Article

Effect of Sodium Phosphate and Calcium Nitrate Sealing Treatment on Microstructure and Corrosion Resistance of Wire Arc Sprayed Aluminum Coatings

1
Department of Architectural Engineering, Hanyang University, 1271 Sa 3-dong, Sangrok-gu, Ansan 15588, Korea
2
Department of Chemistry, Sri Baldeo Post Graduate College-Baragaon, Mahatma Gandhi Kashi Vidyapeeth University, Varanasi 221204, India
3
Intelligent Construction Automation Center, Kyungpook National University, 80, Daehak-ro, Buk-gu, Daegu 41566, Korea
4
Innovative Durable Building and Infrastructure Research Center, Department of Architectural Engineering, Hanyang University, 1271 Sa 3-dong, Sangrok-gu, Ansan 15588, Korea
5
Civil Engineering Department, College of Engineering, Prince Sattam Bin Abdul-Aziz University, Al-Kharaj 11942, Saudi Arabia
*
Authors to whom correspondence should be addressed.
Coatings 2020, 10(1), 33; https://doi.org/10.3390/coatings10010033
Submission received: 28 November 2019 / Revised: 23 December 2019 / Accepted: 29 December 2019 / Published: 1 January 2020

Abstract

:
Aluminum coating was deposited by arc thermal spraying process onto the steel substrate for the corrosion protection in aggressive environment. However, the arc thermal sprayed coating possesses defects in the coating. Thus, it is important to reduce the defects and enhance the corrosion resistance properties of the deposited coating using post-treatment. In the present study, we have used different concentrations of sodium phosphate mono basic (NaH2PO4) with 0.1 molar (M) calcium nitrate [Ca(NO3)2] as post-treatment solution to fill out the defects of the Al coating. It was observed by scanning electron microscopy (SEM) that 1 M NaH2PO4 with 0.1 M Ca(NO3)2 treated sample exhibited 71% reduction in defects compared to as coated samples. X-ray diffraction (XRD) was performed to determine the phases formed on the coating surface after treatments. XRD confirms the formation of sodium aluminum hydrogen phosphate (Na3Al(OH)(HPO4)(PO4)) and brushite (Ca(HPO4)(H2O)2) as composite oxides on the Al coating. Electrochemical results show that 0.5 M NaH2PO4 with 0.1 M Ca(NO3)2 treated sample has exhibited the highest charge transfer resistance and the lowest corrosion current density after 89 days of exposure in 3.5 wt.% NaCl solution. The enhancement in corrosion resistance of 0.5 M NaH2PO4 with 0.1 M Ca(NO3)2 treated sample attributed to the formation of adherent, sparingly soluble, and stable corrosion products. The volume fraction result of the corrosion products formed on 0.5 M NaH2PO4 with 0.1 M Ca(NO3)2 treated sample after 89 days of exposure in 3.5 wt.% NaCl using XRD confirms the highest amount of Bayerite (α-Al(OH)3) deposition, thus, the corrosion rate of this sample was the lowest.

1. Introduction

The economic loss of the most advanced countries due to corrosion is estimated to be about 3%–4% of gross domestic product [1,2,3]. The building and infrastructures can be protected from corrosion using a barrier type of coating, galvanization, cathodic and anodic coating, inhibitor, corrosion resistance alloys, etc. [4]. The coating can be deposited onto the substrate depending on applications and requirements. At some places, organic coating is being used which helps to isolate the metallic substrates from the solution. Such type of coating is called passive coating. However, this type of coating is used for failure, owing to mechanical damages, but it can be minimized using inorganic anticorrosion pigment [5,6].
The chromate conversion coating is used for underline coating, which provides excellent bonding as well as corrosion resistance performance, but due to it being hazardous in nature it is banned by European and American council. However, other chemical conversion coating is effective in mitigation of corrosion. Due to the ban of chromate conversion coating, nowadays rare earth conversion coating is being used in Al alloys which gives good corrosion resistance performance. However, it suffers from crack development [7,8]. Moreover, the formation of cracks on the surface is caused by removal of crystal water in the films after treatment [9].
The corrosion of structural steel can be controlled in marine and aggressive environments using anodic metals. The steel is being used in marine, building, and infrastructure owing to versatile applications and properties. In splash zones of the sea, alternative wet and dry conditions occur where sea water splashes onto the steel substrate resulting in severe corrosion owing to the washing out of corrosion products. In this system, a sufficient amount of oxygen is available which accelerates the corrosion phenomena [10,11]. Thus, sacrificial coating using Al, Zn, Mg, etc. is required to protect the steel substrate from corrosion in aggressive conditions. The deposition of sacrificial coating can be carried out by a thermal spray process.
The thermal spray coating process has a wide-range of applications to deposit the coating on marine instrument, building, and infrastructure which can protect the materials, metals, and alloys from corrosion in harsh environments [12,13,14,15,16]. The arc thermal spray coating process can be used to protect the steel substrate from corrosion [17]. Moreover, Al, Zn, and Mg are anodic metals which can be deposited by an arc thermal spray process and provide sacrificial protection to the steel substrate at a longer duration of exposure in an aggressive environment [18,19].
The thermal spray coating process suffers from a limitation such as formation of defects/pores onto the coating surface which cannot be ignored during the deposition [20,21]. However, it can be minimized by optimizing parameters and pore sealing agents. The higher coating thickness reduces the penetration of chloride ions, thus the corrosion resistance properties of the Al coating can be improved [22]. Some of the researchers have used alloying of Zn, Si, Mg, and rare earth metals with Al using thermal spray process onto the steel substrate and found that the corrosion resistance properties of the coating have increased owing to the deposition of corrosion products in the pores/defects of the coating [23,24,25,26,27,28]. There are many sealants such as organic, inorganic, polymer, ceramic, etc. used to reduce the porosity of the coatings [29,30,31]. The post-treatment of zinc phosphate coated steel substrate with silane provide smooth, crack free, and dense film resulting high corrosion resistance in 3.5 wt.% NaCl solution [32]. It was reported that 0.1 M ammonium phosphate post-treated Al coating provides good corrosion resistance but once the amount was increased, it shows deterioration owing to the acidic in nature of treated film [33]. It was observed by Lee and Singh that when 0.1 M Ca(NO3)2 was added in 1 M ammonium phosphate, the corrosion resistance of Al coating was increased dramatically attributed to the formation of gypsum and aluminum phosphate in corrosion products [34].
Recently we have published the work on post-treatment of Al coating with sodium phosphate mono basic (SP—NaH2PO4) and found that this treatment was very susceptible to corrosion in artificial ocean water solution owing to the formation of crack and acidic film [35]. Thus, it is our prudent thought to treat the Al coating using different concentrations of SP solution with the addition of 0.1 M calcium nitrate [Ca(NO3)2] and study the synergistic effect of Ca(NO3)2 on morphology as well as corrosion characteristics of treated coatings at a longer duration of exposure in 3.5 wt.% NaCl solution. We have found that adding 0.1 M calcium nitrate in a 0.5 M SP solution dramatically enhances the morphological and corrosion resistance properties of Al coating deposited by an arc thermal spray coating process.

2. Materials and Methods

2.1. Process of the Coating

The deposition of Al coating using arc thermal spray process has been described in our earlier published works [20,21]. Prior to depositing the coating onto the steel plate, C = 0.20, Mn = 0.95, Si = 0.26, P = 0.02, S = 0.01, Cu = 0.02, Cr = 0.04, Ni = 0.03, Fe = balance (wt.%) was pickled with 10% v/v HCl solution followed by ringing with distilled water, dried, polished, and finally grit blasted to make the surface rough for proper adhesion of the coating. Then 1.6 mm diameter Al metal (99.95 wt.%) twin wire was used for deposition of the coating onto 8 cm × 6 cm × 0.1 cm of the steel plate. The oppositely charged twin wire melt at the arcing tip of the gun followed by melted metal particles propelled by compressed hot air resulted in deposition of the coating onto the substrate [36,37,38,39].
The Al coating was deposited using arc thermal spray gun (LD/U3 electric arc wire spray gun, Oerlikon Metco™, Wohlen, Switzerland). During deposition of the coating, the spray gun was kept 20 cm away from the steel substrate using 6 bars air pressure at 30 V voltage and 200 mA current [40,41,42].
The thickness of the coating was measured by Elcometer456 (Elcometer, Tokyo, Japan) at three different locations and the average was taken as a result. The adhesion test of deposited coating was performed by KS F4716 [43] for four samples and the average value was considered. The adhesion test was carried out by selecting a 16 cm2 surface area of the deposited coatings.

2.2. Treatment of the Coatings

The treatment solution was prepared by dissolving analytical grade sodium phosphate mono basic (NaH2PO4) and calcium nitrate [Ca(NO3)2] salts in the distilled water. The dissolution of the salts in distilled water was carried out on automatic magnetic stirrer (MS300HS, MTOPS, Seoul, Korea) at 800 rpm and 25 ± 1 °C for 2 h. The post-treatment of the arc thermal sprayed Al coating was performed in different concentrations of NaH2PO4 with fixed amount i.e., 0.1 M Ca(NO3)2 solution. The treatments of 0.1 M NaH2PO4 + 0.1 M Ca(NO3)2, 0.5 M NaH2PO4 + 0.1 M Ca(NO3)2, and 1 M NaH2PO4 + 0.1 M Ca(NO3)2 were abbreviated as SPCN1, SPCN2, and SPCN3, respectively. The pH of the treatment solution was measured at 25 ± 1 °C and it was found to be 3.52, 3.40, and 3.13 for SPCN1, SPCN2, and SPCN3, respectively. The treatment of Al coating was performed at 25 ± 1 °C three times using a nylon brush up to 24 h at every 8 h interval. After the treatment of samples, they were kept for drying at 25 ± 1 °C up to 24 h in laboratory. After drying, the samples were subsequently kept in a humidity chamber for 7 days at 50 °C and 95% relative humidity for the formation of natural oxides [33,34,35]. It is well known that when the coating is exposed to harsh atmospheric conditions where humidity and temperature are very high, there will be a probability of forming natural oxide. Thus, we have kept the samples in the humidity chamber to form natural oxide prior to immersion in NaCl solution.

2.3. Corrosion Studies

The corrosion studies of as coated (AC) Al samples as well as treated coatings were performed by dissolving analytical grade of 3.5 wt.% NaCl salt in distilled water. It was carried out by VersaSTAT potentiostat (Princeton Applied Research, Oak Ridge, TN, USA) using a three electrode system where the coated/treated sample acted as the working electrode, the platinum wire as the counter electrode, and the silver-silver chloride (Ag/AgCl) as the reference electrode. The electrochemical impedance spectroscopy (EIS) of the samples were carried out from 100 kHz to 0.01 Hz with a 10 mV sinusoidal voltage in triplicate number of samples. The DC potentiodynamic polarization was performed by changing the impressed current from −0.4 to +0.8 V versus Ag/AgCl at a 1 mV/s scan rate. The analysis of the obtained results was performed by Metrohm Autolab Nova 1.10 software.

2.4. Characterization of the Coatings and Corrosion Products

The surface morphology of the AC, treated, and corrosion products was carried out by scanning electron microscopy (SEM, MIRA3, TESCAN, Brno, Czech Republic) operated at 15 kV and elemental analysis by energy-dispersive X-ray spectroscopy (EDS). The porosity of the samples considering cross sectional area was calculated by ImageJ software (version 1.52n).
The formation of phases on AC, treated, and corrosion products was performed by X-ray diffraction (XRD, Rigaku, Tokyo, Japan) using Cu Kα radiation (λ = 1.54059 Å) generated at 40 kV and 100 mA. The volume fraction (%) of each phase formed on the samples was analyzed by JADE2016 software.

3. Results and Discussion

3.1. Characterization of the Coatings

3.1.1. Coating Thickness and Bond Adhesion Analysis

The thickness of the coatings was measured at three different locations using Elcometer456 and the average value was taken as a result. The average thickness of AC and SPCN1 was found to be 100 ± 5 µm whereas SPCN2 and SPCN3 were found to be 110 and 140 ± 5 µm, respectively, attributed to the deposition of composite oxide after treatment. The average bond adhesion value of the coatings was 4.86 ± 0.08 MPa for four consecutive samples [19,31,33,34,35].

3.1.2. Scanning Electron Microscopy (SEM) of the Coatings

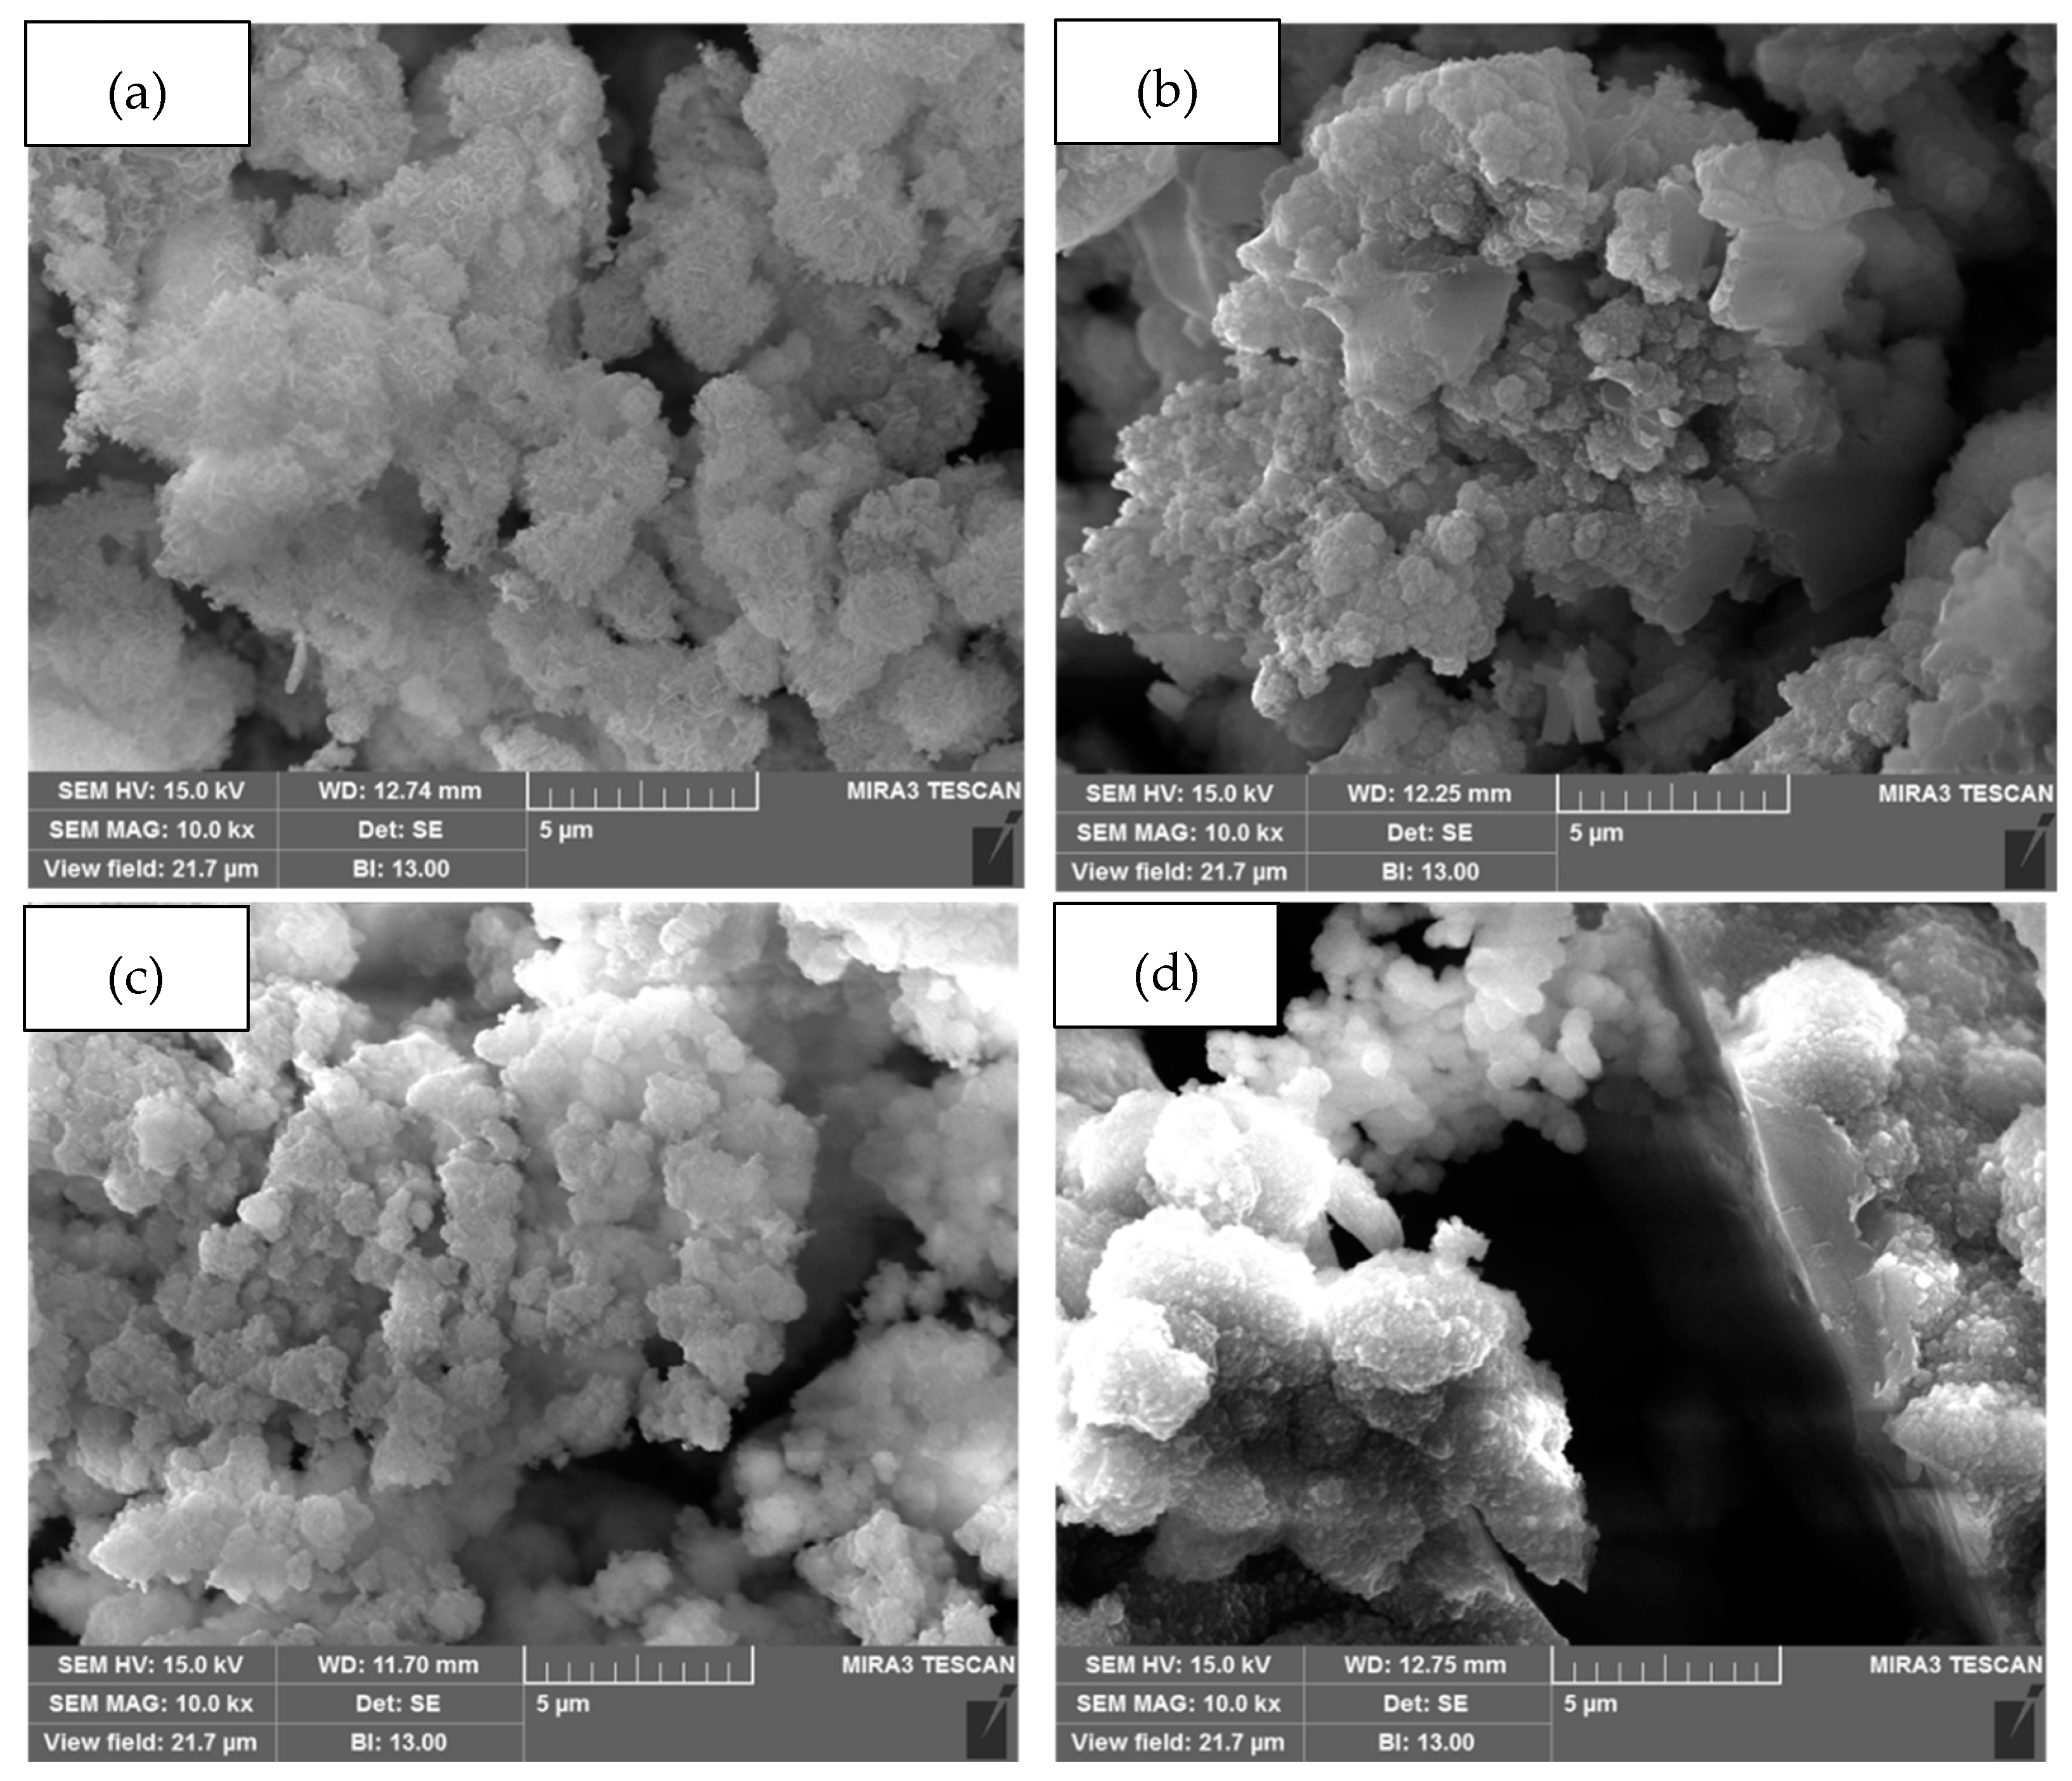
SEM images of the coatings are shown in Figure 1 and Figure 2. The top surface SEM image of the AC sample shows lamellar particles owing to the sudden cooling of melted metal droplets during deposition of the coating using arc thermal spray process. The approximate size of the lamellae is found to be 5–10 µm, but in between two lamellae some defects and cracks can be observed (Figure 1a). The cracks have originated horizontally from the upper layer of the coating and in depth which encourages the ingress of harmful gases and solutions from the atmosphere. Once the coating was treated with solution, the surface morphology has changed dramatically owing to the deposition of oxide film which covers the surface and fills out the defects of the coatings. When the coating was treated with SPCN1 (Figure 1b) solution, it exhibits filamentous and clusters of needle particles. However, it shows defects and non-homogenous deposition owing to the lower concentration of NaH2PO4 solution [35]. The influential effect of 0.1 M Ca(NO3)2 is observed when it was mixed with NaH2PO4 [34]. Moreover, 0.1 M NaH2PO4 and 0.1 M Ca(NO3)2 i.e., SPCN1 is not enough to make proper film. Thus, it is required to increase NaH2PO4 concentration with 0.1 M Ca(NO3)2 from 0.1 to 0.5 and 1 M. The improvement in morphology is observed when coating was treated with 0.5 M NaH2PO4 and 0.1 M Ca(NO3)2 i.e., SPCN2 (Figure 1c). The surface is covered by needle like oxide particles which is smaller in size and combined to each other (Figure 1c). The number of defects and area is reduced compare to AC and SPCN1. A bunch of needle like particles are filled out the defects and enhances the morphology of coating owing to the precursor effect by calcium [44]. As the concentration was increased from 0.5 to 1 M NaH2PO4 with 0.1 M Ca(NO3)2 i.e., SPCN3, the surface become homogeneous (Figure 1d) rather than needle like morphology. It means higher concentration of NaH2PO4 along with 0.1 M Ca(NO3)2 improve the quality of coating in regards of surface morphology. However, it contains net like morphology with micro-cracks owing to the higher concentration of NaH2PO4 which enhances the formation of crack on surface [35]. The net like composite oxides and micro-cracks allow the ingress of aggressive ions easily which later enhances the deterioration of coating.
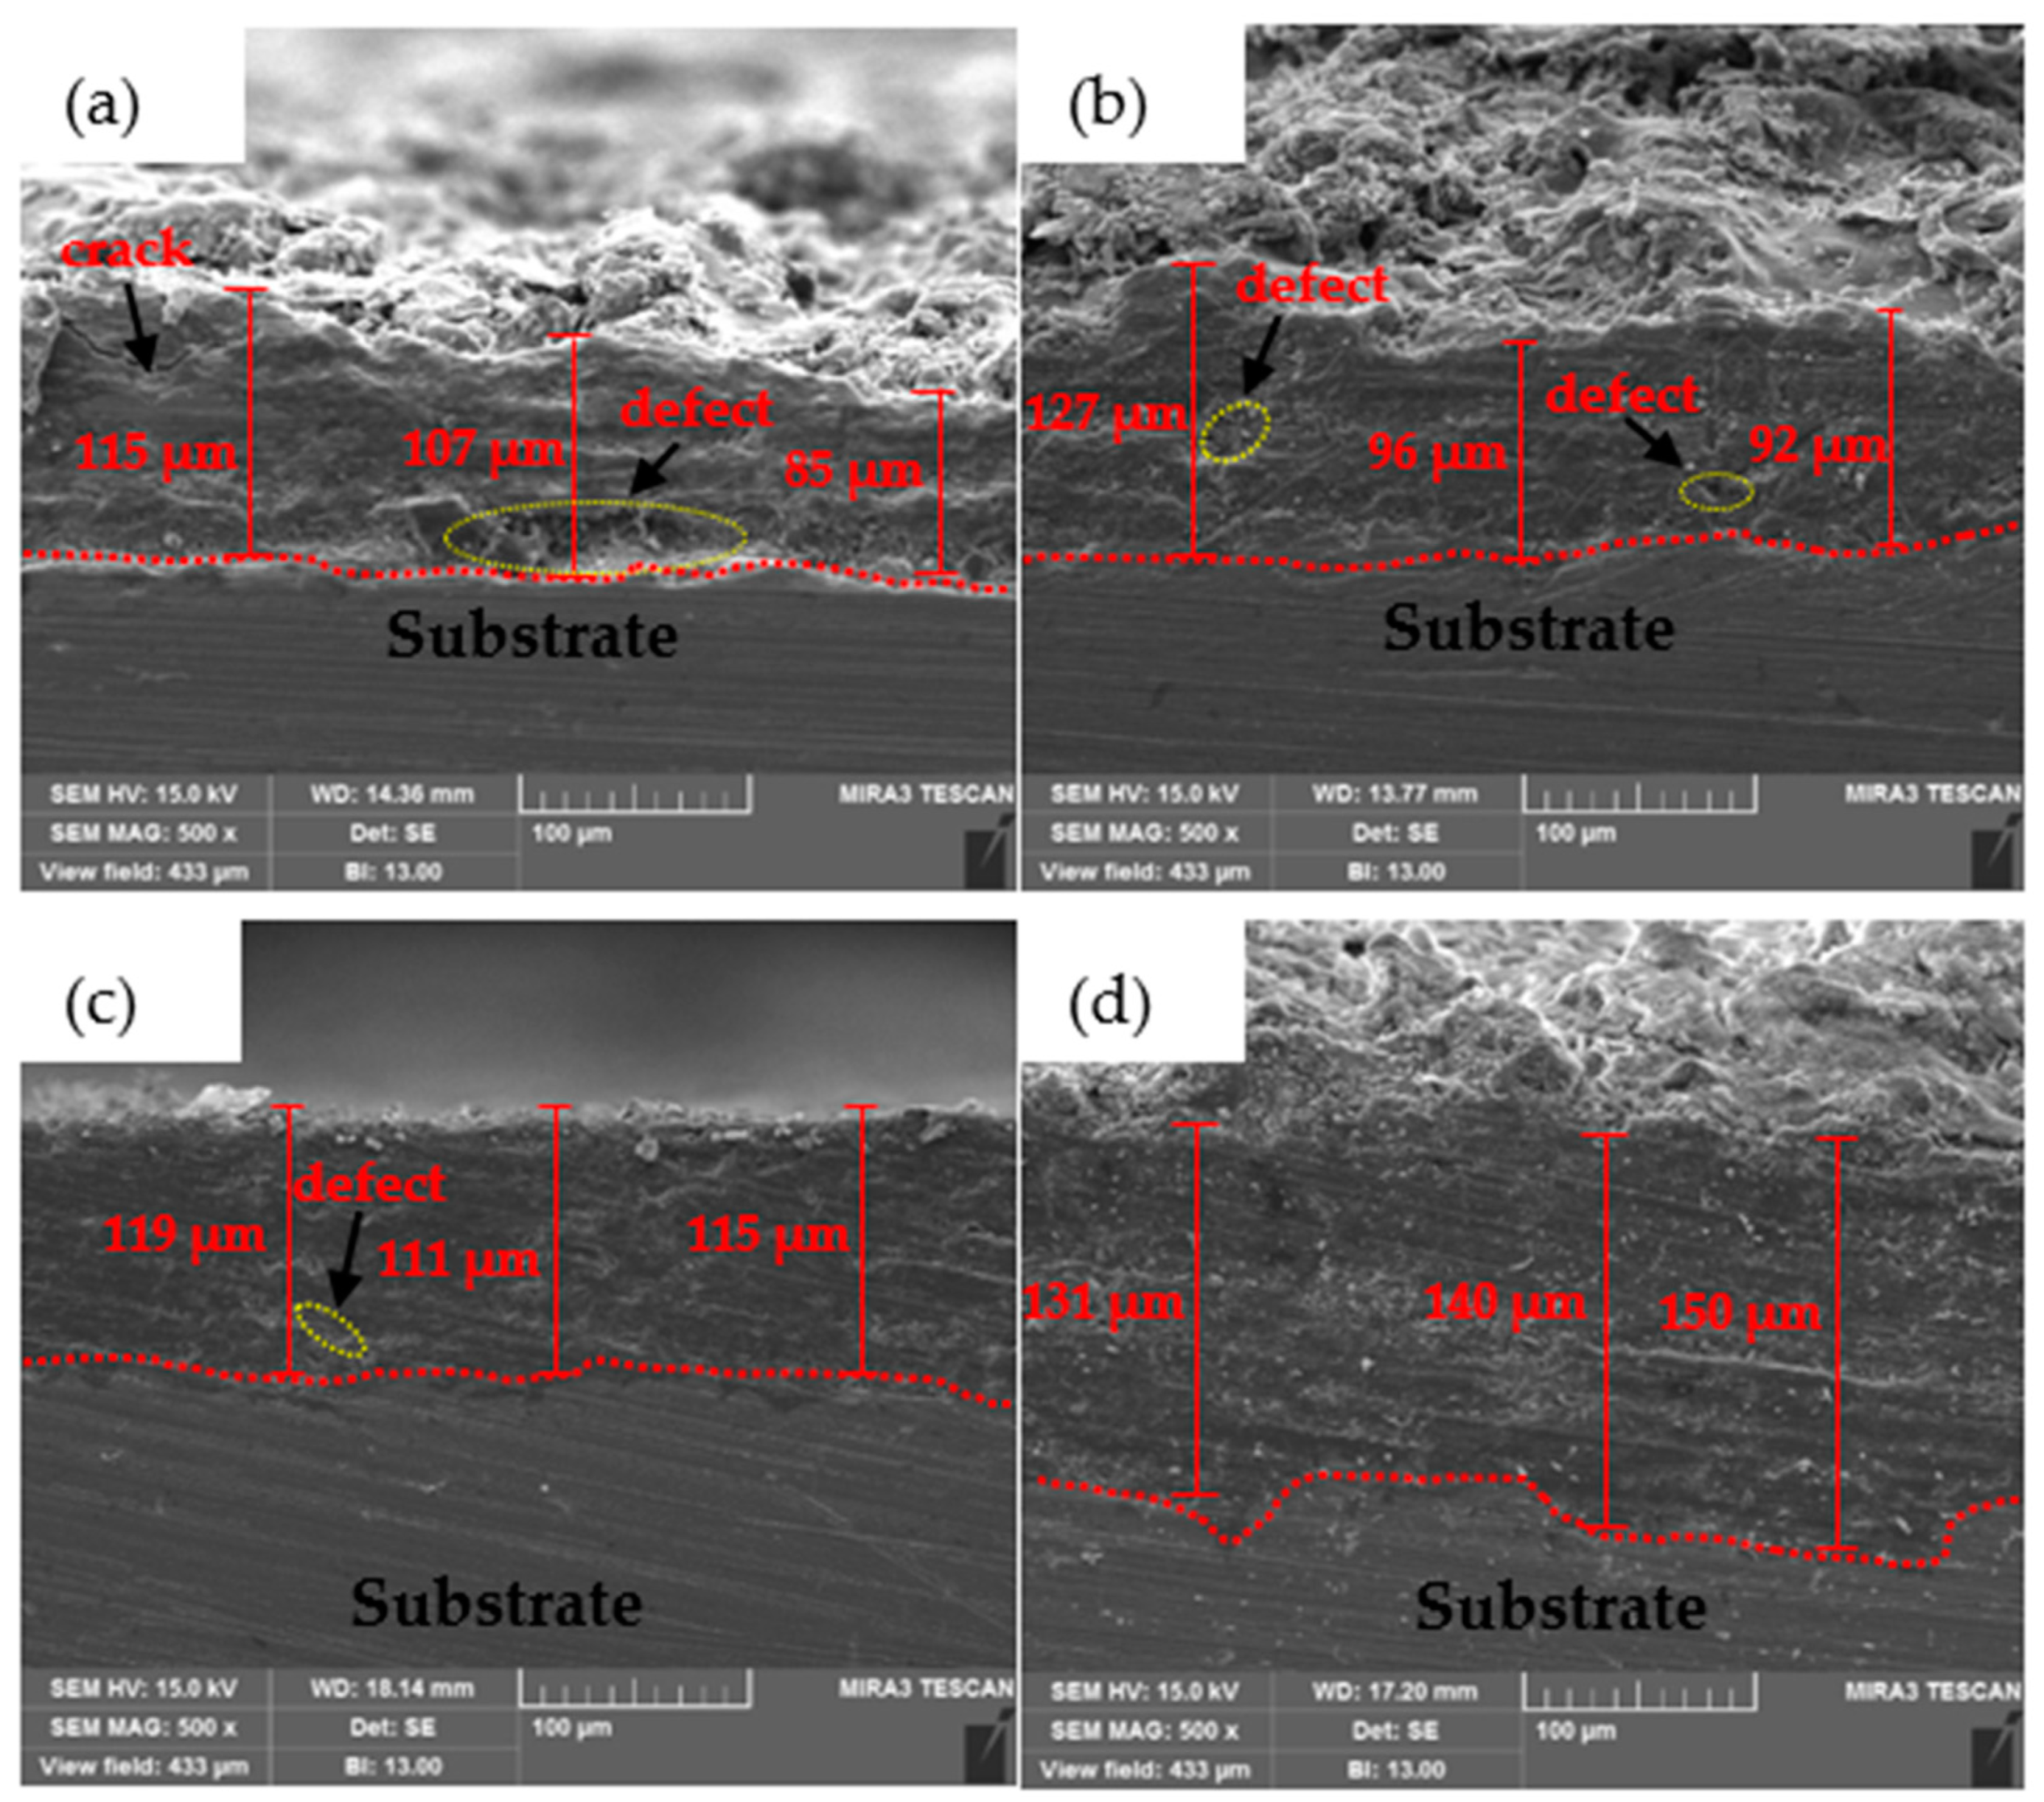
The cross sectional SEM images of the coatings are shown in Figure 2. It can be seen from Figure 2a that the AC sample shows defects at the coating/substrate interface as well as cracks at the outer surface of the coating. These cracks and defects are interconnected and correlate to the results of the top surface morphology (Figure 1a). However, once the treatment was applied, the coating exhibits less defects compared to the AC sample owing to the filling ability of the treatment solution. Figure 2b shows that the defects are found to be pronounced at the coating/substrate interface which is attributed to the incomplete penetration of the treatment solution. However, AC and SPCN1 samples exhibit around 100 ± 5 µm coating thickness. After the treatment with SPCN1, there is no influential effect of the treatment solution in coating thickness owing to the formation of less amount of oxide film. As the concentration of NaH2PO4 is increased from 0.1 to 0.5 M with 0.1 M Ca(NO3)2 solution, the area of defects decreased attributed to the formation of composite oxide film. It can be seen from Figure 2c that the SPCN2 sample shows uniform film (Figure 2c) owing to the penetration of treatment solution through the spaces of lamellae as observed in the AC sample, which encourages the formation of composite oxide. Hence, the defect area is very less observed in SPCN2 (marked by the circle in Figure 2c) compared to AC and SPCN1. The coating thickness after treatment is found to be approximately 115 µm, which is greater than AC, owing to the formation of composite oxide film. SPCN3 sample exhibits defect free surface (Figure 2d) compared to the other samples attributed to the greater filling ability of 1 M NaH2PO4 and 0.1 M Ca(NO3)2 solution. The coating thickness is increased up to 140 µm owing to the formation of greater volume of composite oxide which participated in the coating thickness.
The defect area of the coating was calculated using ImageJ software after treatment considering cross sectional SEM images and it is found to be 31%, 25%, 19%, and 9% for AC, SPCN1, SPCN2, and SPCN3, respectively. The defect is gradually decreased as the amount of NaH2PO4 increased with 0.1 M Ca(NO3)2 solution. The defect is approximately reduced by 19%, 38%, and 71% for SPCN1, SPCN2, and SPCN3, respectively, compared to the AC sample.
The EDS analysis of coating (Table 1) shows that as the concentration of NaH2PO4 is increased, the amount of Na, P, and O increased. The N and Ca amount is found to be between 1.35%–1.44% and 7.71%–7.95%, respectively. The amount of O is found to be 2.20% in the AC sample.

3.1.3. X-ray Diffraction (XRD) of the Coatings

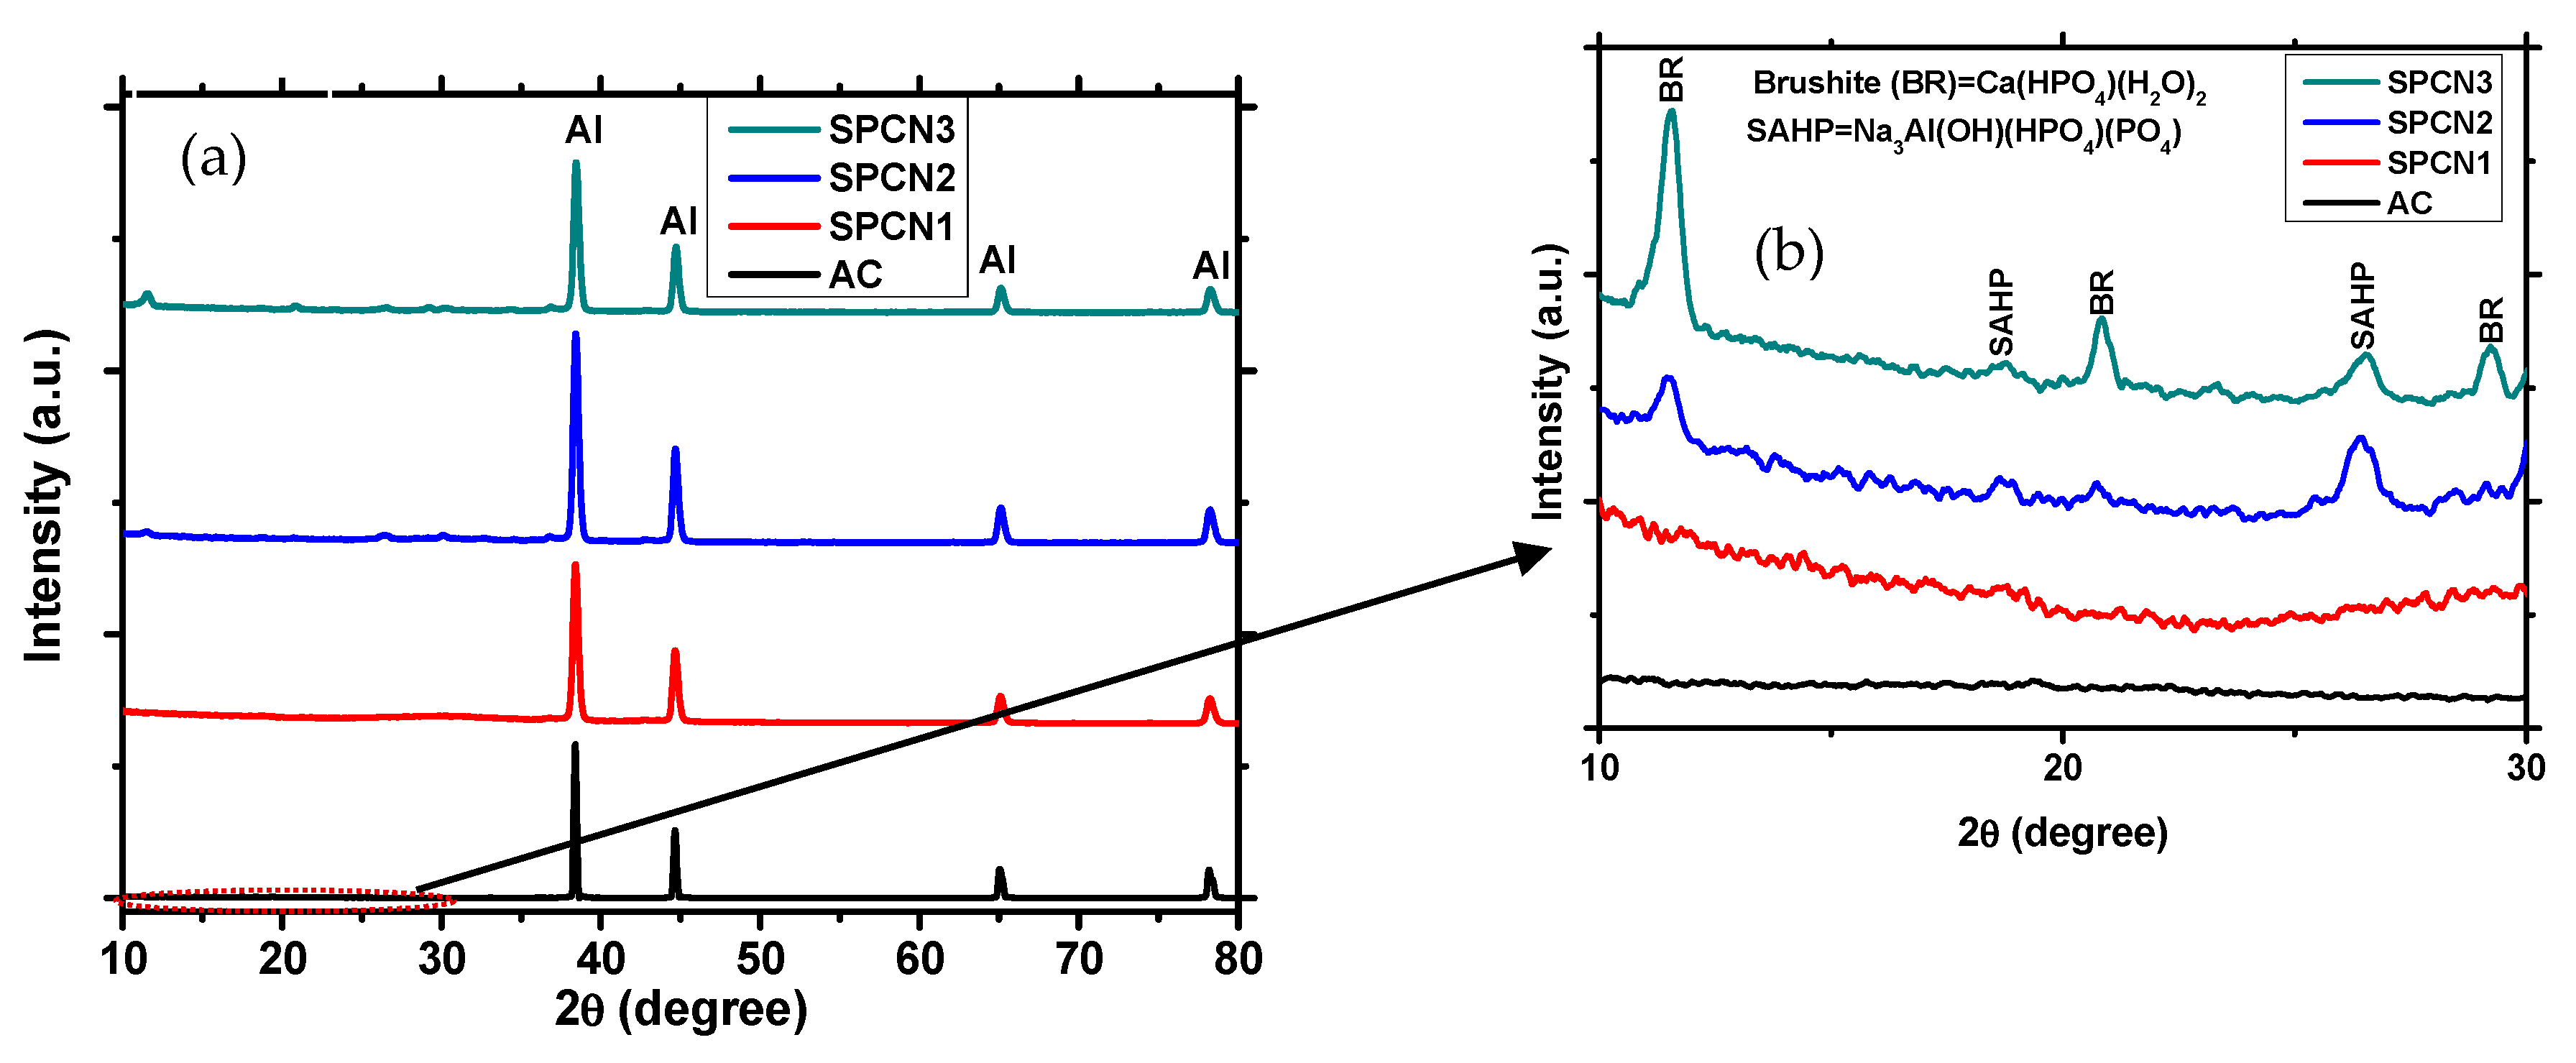
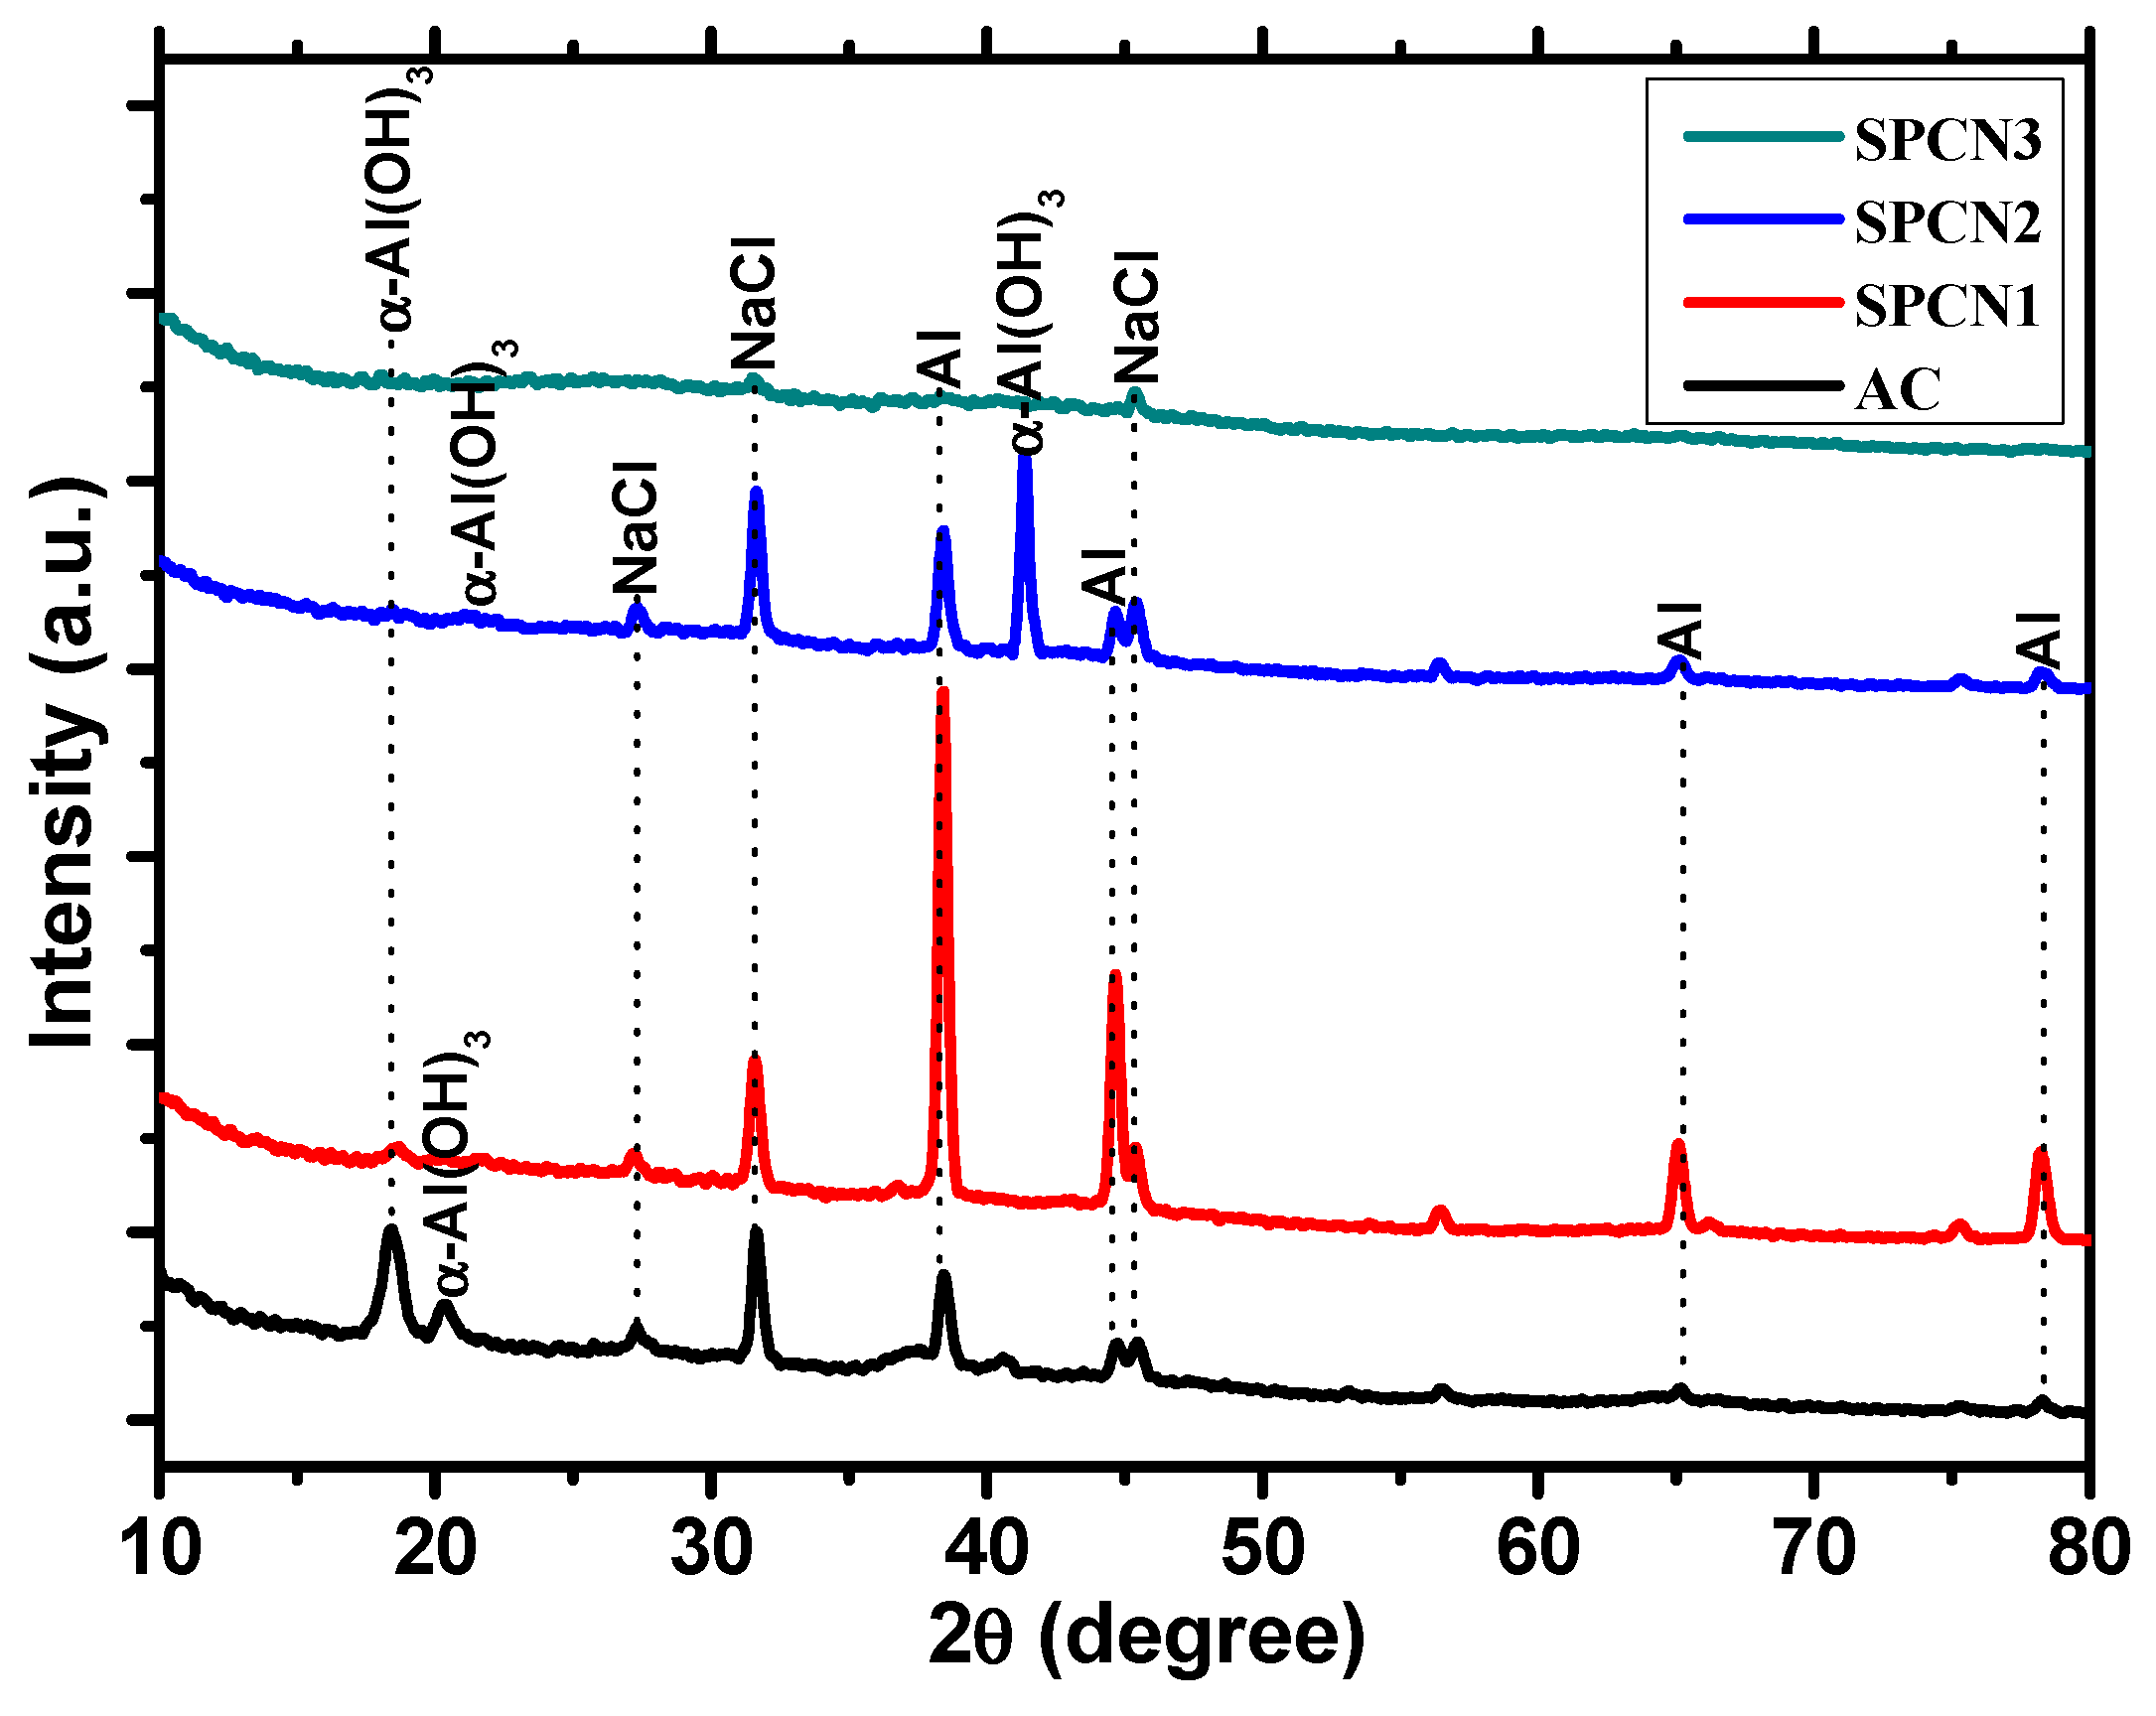
The identification of phases deposited on coating surface after treatment as well as AC sample was analyzed by XRD and results are shown in Figure 3. The full scan i.e., 2θ = 10°–90° XRD result is shown in Figure 3a whereas lower angle scan i.e., 2θ = 10°–30° is shown in Figure 3b. The most intense and strong peak is Al phase (Figure 3a) owing to the coating materials. Once the treatment was performed, the intensity of Al decreased owing to the participation of another phases. After treatment of Al coating with NaH2PO4 and 0.1 M Ca(NO3)2, the following reaction may occur [34,35]:
Al + 3 NaH 2 PO 4 + Ca ( NO 3 ) 2 + 7 H 2 O + 3 e CaHPO 4 ( H 2 O ) 2 + Na 3 Al ( OH ) ( HPO 4 ) ( PO 4 ) + 2 NH 4 OH + 4 O 2 + 3 H +
The presence of brushite (BR—CaHPO4(H2O)2) and sodium aluminum hydrogen phosphate (SAHP—Na3Al(OH)(HPO4)(PO4)) is observed by XRD (Figure 3b) after treatment of Al coating with NaH2PO4 and Ca(NO3)2 solution. Brushite (BR) can be formed by the reaction of phosphate ion with Ca(NO3)2 [34,45,46,47]. The SAHP reaction of Al with phosphate ion [35,48] is shown in Equation (1). From Equation (1), it can be seen that H+ ion releases during the reaction which make the solution acidic, thus the pH of the treatment solution was reduced to 3.52, 3.40, and 3.13 for SPCN1, SPCN2, and SPCN3, respectively. However, SAHP is soluble in water and makes the solution acidic owing to it being acidic in nature [49,50,51]. However, SAHP is brittle [52], thus when the concentration of NaH2PO4 is increased, some micro- and nano-cracks have been observed on the surface of the coating (Figure 1d). Due to the high intensity of Al peaks, Brushite and SAHP peaks are suppressed, thus we have plotted it again and shown it in Figure 3b at 2θ = 10°–30°. As the concentration of NaH2PO4 is increased, the intensity of brushite and SAHP is increased owing to the greater deposition of these phases.
The volume fraction (%) was calculated using JADE software (2016) and the results are shown in Table 2. As the concentration of NaH2PO4 is increased with 0.1 M Ca(NO3)2, the volume fraction of BR and SAHP increased gradually. This result suggests that Al might be highly reactive with NaH2PO4 resulting in deposition of SAHP film, while NaH2PO4 reacts with 0.1 M Ca(NO3)2 and forms BR [34,45,46,47]. AC sample shows 100% Al which indicates that during deposition of the coating there was no new phase formation.

3.2. Corrosion Studies

3.2.1. Electrochemical Impedance Spectroscopy (EIS)

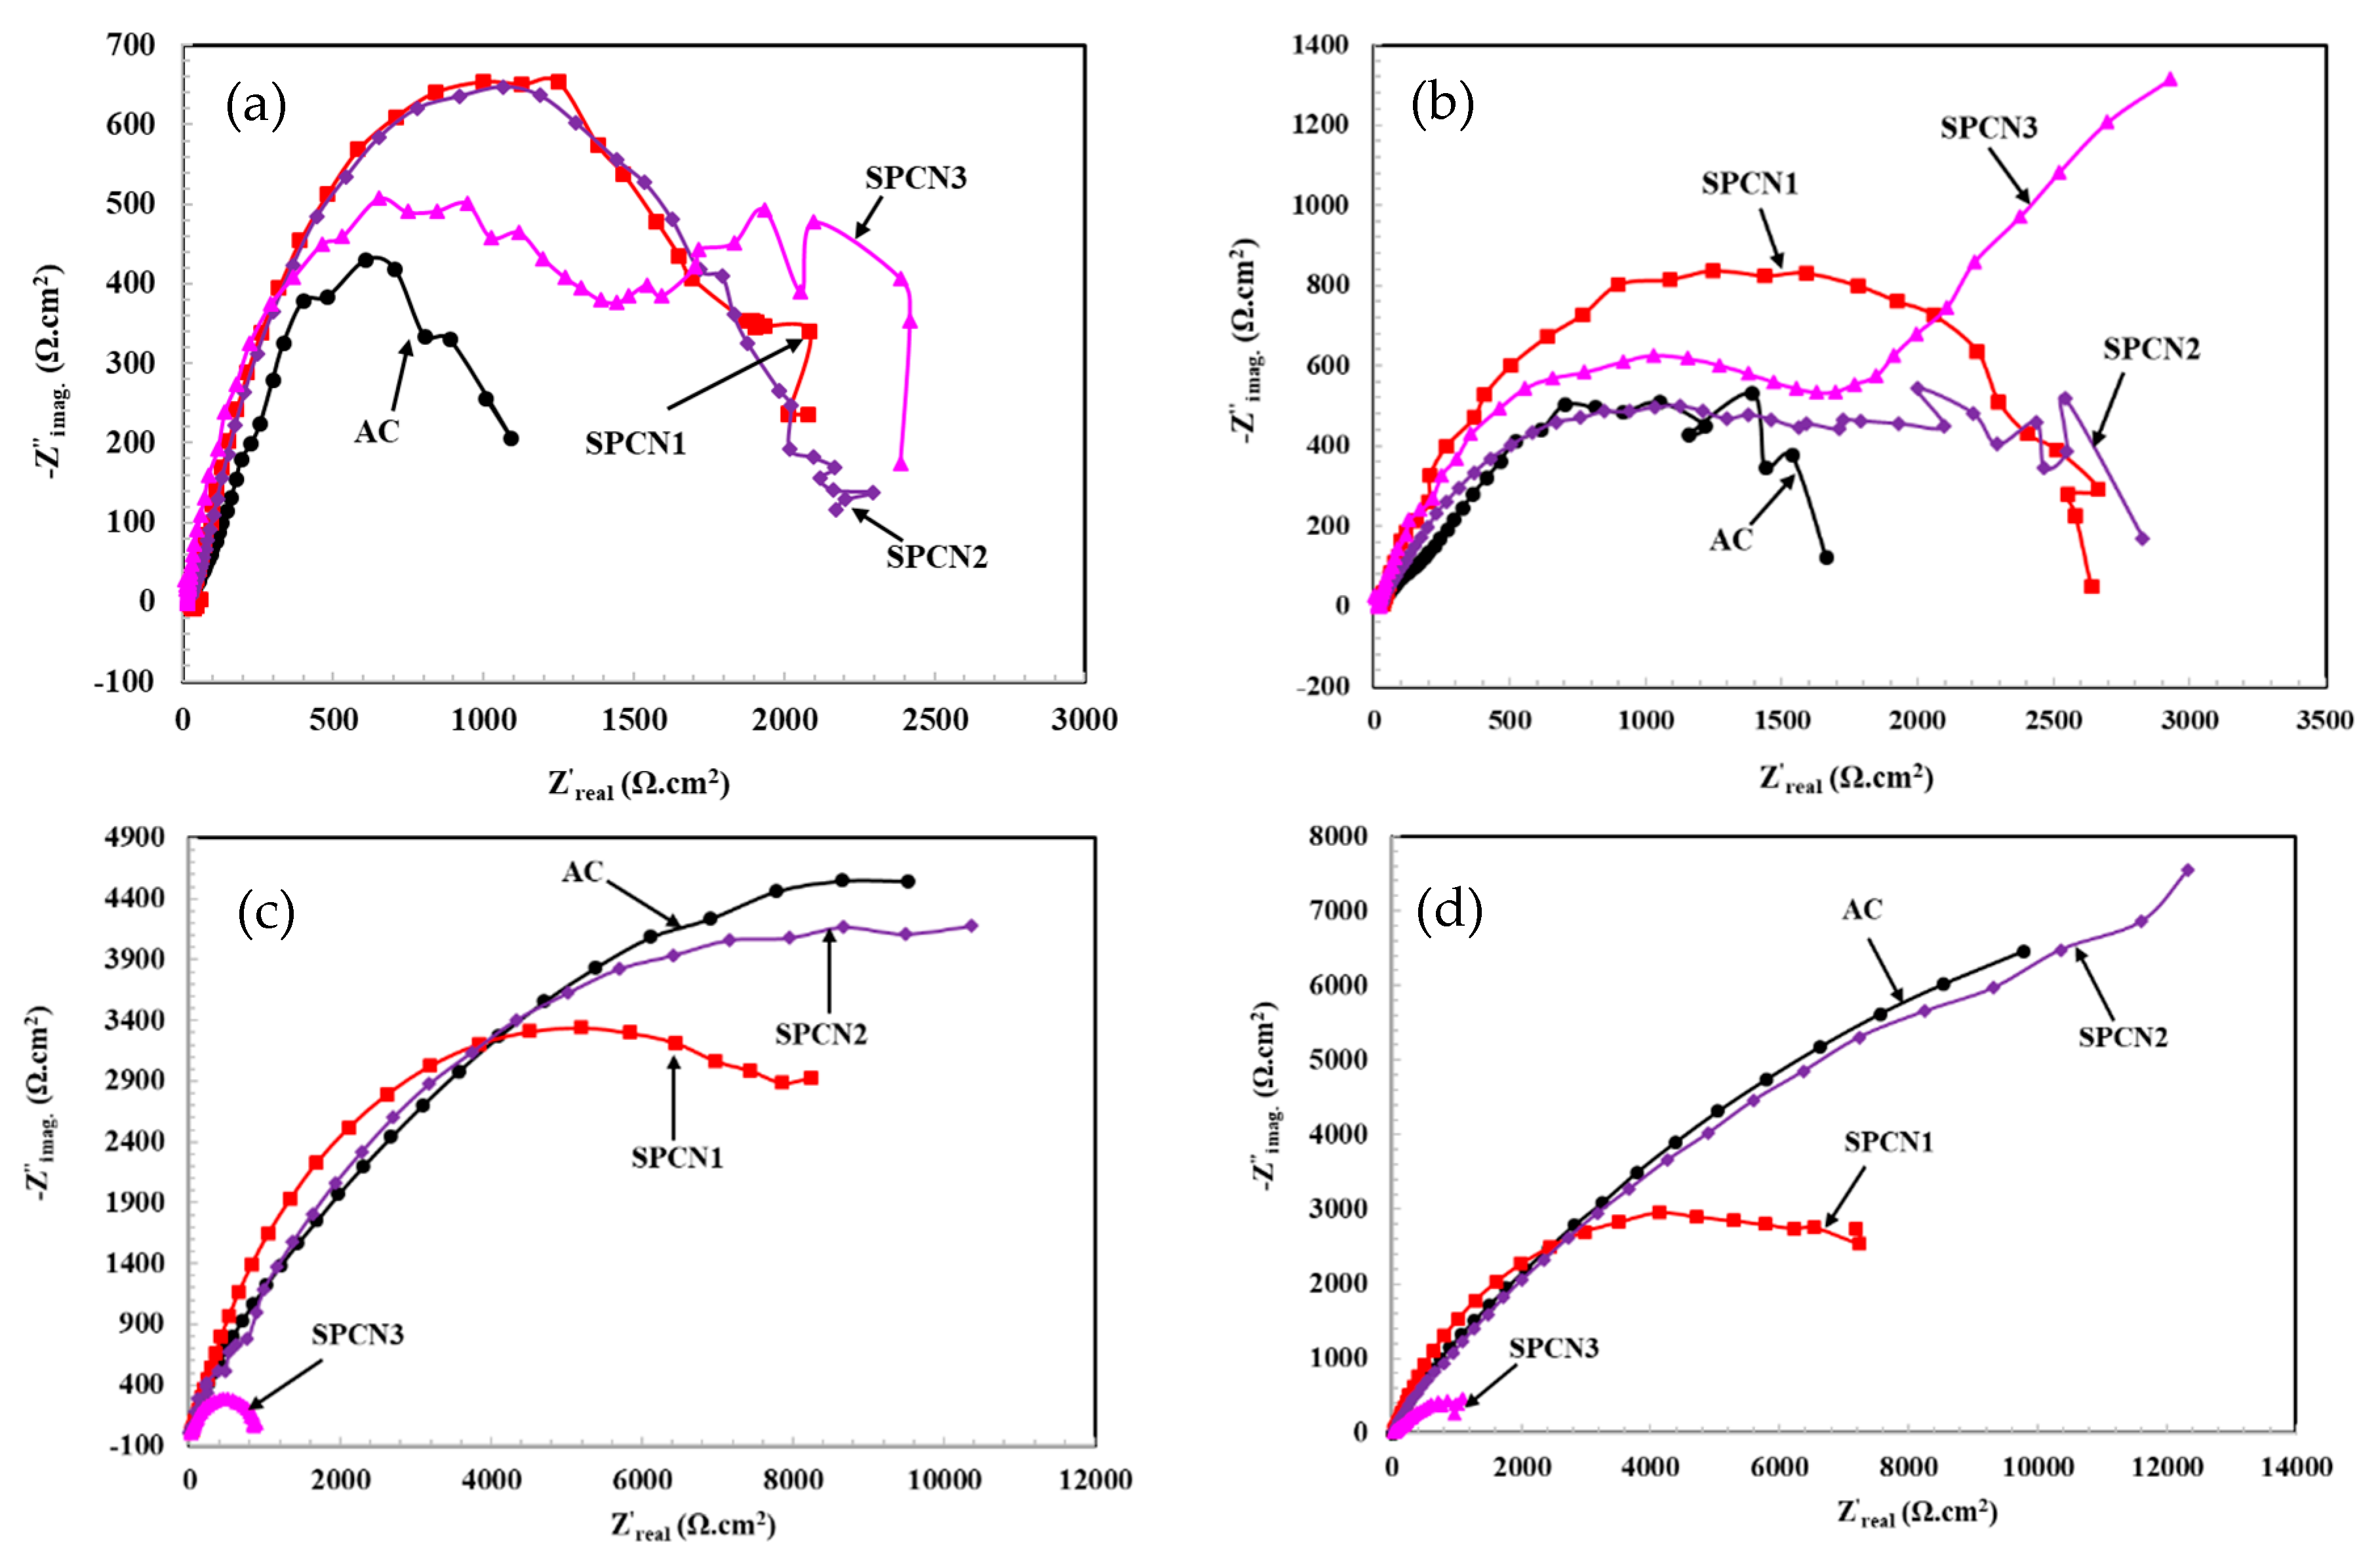
The EIS results of the coatings are shown in Figure 4, Figure 5 and Figure 6. Figure 4 shows the complex-plane impedance plots of the coatings at different exposure periods in 3.5 wt.% NaCl solution. As the concentration of NaH2PO4 increased with 0.1 M Ca(NO3)2, the magnitude of the real and imaginary components of impedance increased gradually after 1 h of exposure (Figure 4a) attributed to the treatment [53]. The AC sample exhibits a smaller magnitude semi-circle compared to treated coating owing to the presence of defects on the surface (Figure 1a and Figure 2a) which allows the ingress of the NaCl solution through the defects and causes a localized attack. At the lower studied frequency, all samples exhibit scattering in data which attributed either due to capacitive properties of the coatings or presence of defective film (after treatment) [35]. As it is observed in the SEM images (Figure 1), AC as well as treated coating contains defects which act as capacitance. This result confirms that AC and SPCN3 contain two electrical equivalent circuits (EEC). In the case of AC, after 1 h of exposure in 3.5 wt.% NaCl solution it might be starting to corrode owing to the presence of defects and cracks on the coating surface. During the reaction of Al coating with NaCl solution, there is possibility to deposit the corrosion products onto the surface which fill out the defects. On the other hand, SPCN3 contains brittle film of the SAHP layer which allows the penetration of the solution, thus corrosion would start on the treated film as well as the coating surface. Moreover, SPCN1 and SPCN2 exhibit a needle like microstructure (Figure 1b,c) which firstly reacts with the NaCl solution thereafter allowing the penetration of the solution towards the coating surface. Once the solution comes in contact with treated surface of SPCN1 and SPCN2, BR and SAHP film stifle the penetration of the solution owing to the barrier type of protection provided by them [54,55]. Therefore, only one EEC can be observed.
As the exposure periods are extended up to 11 days, the magnitude of complex-plane impedance plots increased (Figure 4b) which indicate that coating would provide protection against corrosion in 3.5 wt.% NaCl solution. In the case of the AC sample, the corrosion products might be deposited in defects whereas treated coating containing BR and SAHP film might be transformed into other phases [34,56]. SPCN1 exhibits semi-circle which indicate that treated film might be dissolved and coating surface contributed in the corrosion reaction. AC, SPCN2, and SPCN3 show a semi-circle at higher to middle frequency, attributed to the charge transfer resistance between treated film/corrosion products and solution interface whereas at lower frequency, one tail can be seen which causes a resistance by oxide layer at corrosion products/coating interface in NaCl solution [57,58,59].
As the exposure periods are increased up to 41 days, the magnitude of complex-plane impedance plots of AC, SPCN1, and SPCN2 increased dramatically while SPCN3 decreased compare to earlier exposure periods (Figure 4c). The decrease in magnitude of complex-plane impedance plot of SPCN3 attributed to the presence of high amount of SAHP (Figure 3 and Table 2) which dissolved at longer duration of exposure and made the studied solution acidic. On the other hand, it might be that the AC sample contains protective corrosion product after 41 days of exposure which fill out the defects whereas SPCN1 and SPCN2 transformed the BR and SAHP into a protective film. Thus, there are two semi-circles observed at different studied frequencies. One small semi-circle at higher frequency and another big from middle to lower frequency was observed. In earlier exposure periods, at higher frequency a bigger semi-circle was observed whereas at lower frequency a smaller one was observed. It is attributed to the reaction of NaCl solution with coating/treated surface. Up to 11 days of exposure, coating/treated surfaces participated in the corrosion reaction but at a longer duration of exposure, the treated layer might be dissolved or transformed into corrosion products. It means that at longer duration of exposure corrosion products have contributed in the corrosion reaction rather than the coating or treated film, thus the coatings provide protection against corrosion.
After 89 days of exposure in 3.5 wt.% NaCl solution, SPCN1 and SPCN3 decreased the magnitude of complex-plane impedance plots owing to the deterioration. In case of SPCN1, the thin layer of treated film has dissolved and formed less stable corrosion products thus, a decrease in magnitude is observed but it is higher than SPCN3. BR and SAHP phases were the lowest amount in SPCN1 (Figure 3 and Table 2) and non-uniformly distributed with some spaces between two needle particles of treated film (Figure 1b) which was dissolved as well as there is possibility that the corrosion products are porous. The SPCN3 shows the lowest magnitude in the complex-plane impedance plots among all coatings owing to the dissolution of BR and SAHP film. SAHP film is acidic in nature and reduced the pH of NaCl solution which enhances the dissolution of coating as well as corrosion products. Thus, it shows deterioration of coatings at a longer duration of exposure. On the other hand, SPCN2 dramatically enhances the corrosion resistance properties as observed in complex-plane impedance plots (Figure 4d) after 89 days of exposure might be attributed to the transformation of corrosion products/film into adherent and protective film which stifle the ingress of aggressive ions while in the case of AC sample, the protective corrosion products fill out the porosity and do not allow to ingress the solution. The magnitude of two semicircles i.e., a smaller one at higher frequency and bigger one from middle to lower studied frequency. A second semi-circle at lower frequency, the magnitude in the complex-plane impedance plots of AC, SPCN1, and SPCN2 is greater attributed to the nature of corrosion products than the first semi-circle which reveal the characteristics of coating. Thus, it can be proposed that a corrosion reaction occurred via coating/treated and solution interface as well as corrosion products/solution interface. It means the corrosion phenomena consists of two EECs. It will be described in subsequence paragraphs.
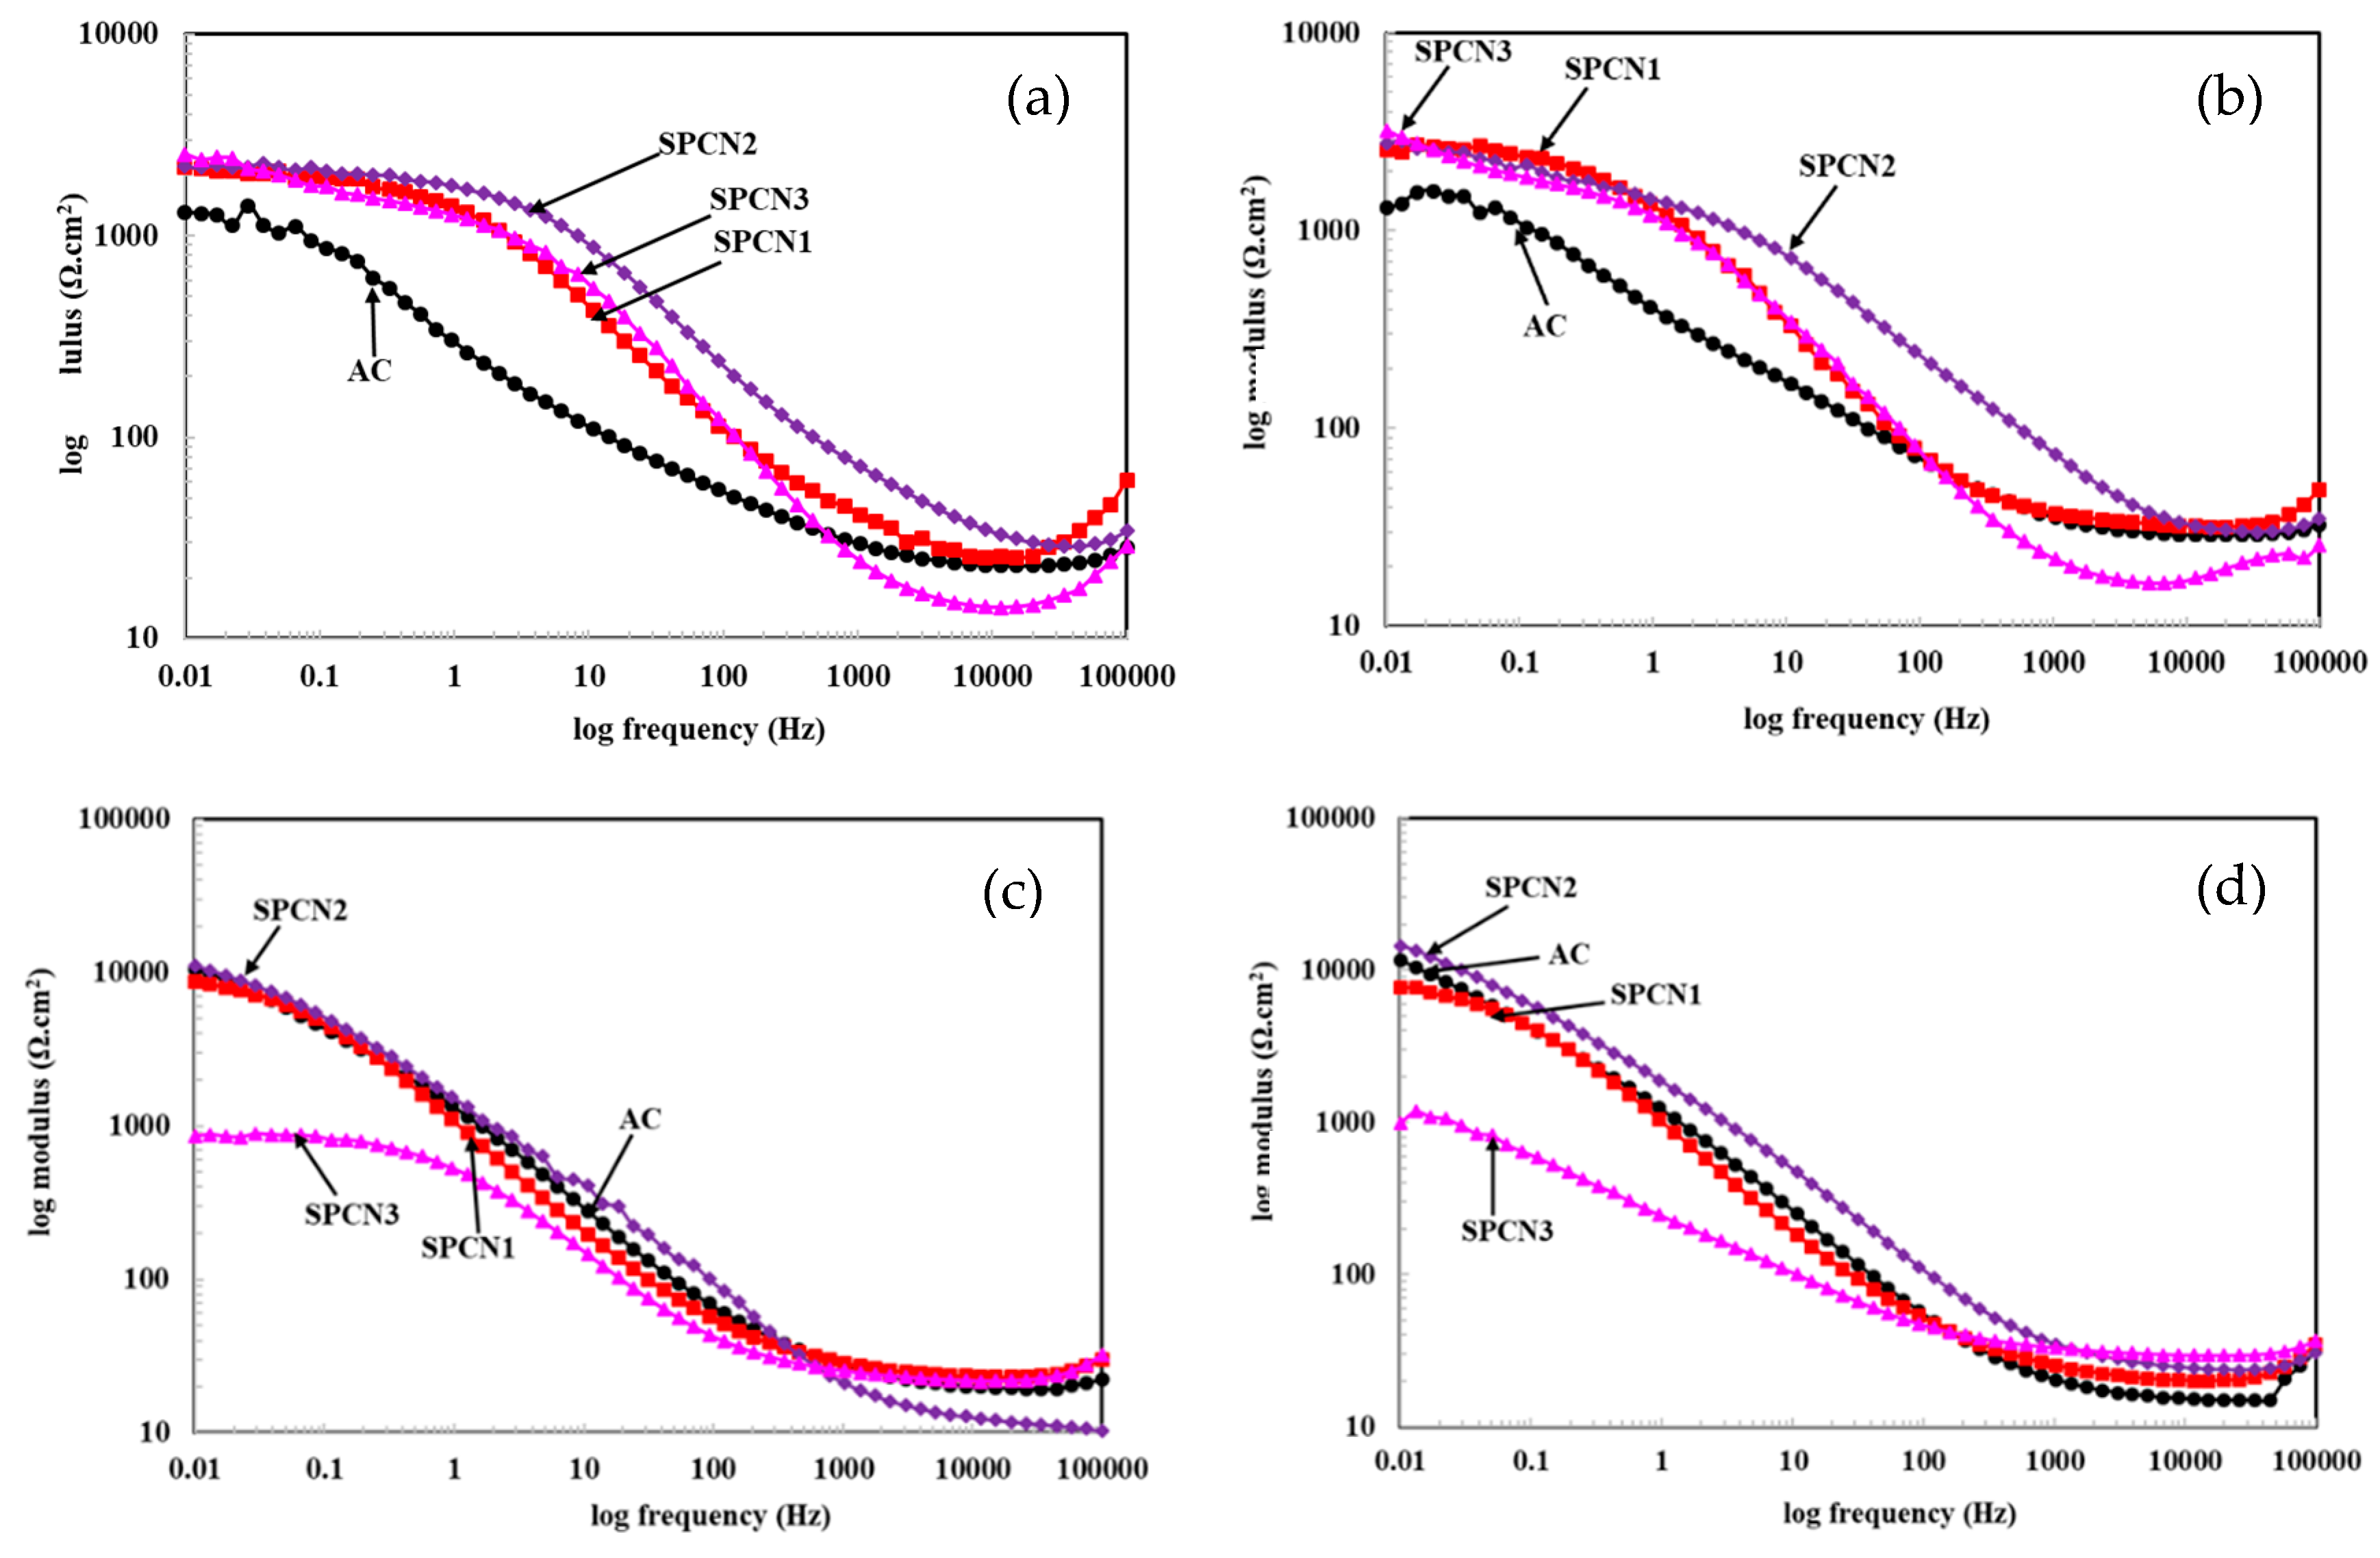
The modulus-frequency Bode plots of the coating with exposure periods in 3.5 wt.% NaCl solution are shown in Figure 5. From Figure 5a it is found that AC shows the lowest total impedance value at 0.01 Hz but as the concentration of NaH2PO4 is increased with 0.1 M Ca(NO3)2, the impedance value increased gradually after 1 h of exposure in 3.5 wt.% NaCl solution. The treated coatings exhibit almost 2 times higher impedance values compared to the AC sample. It is attributed to the filling ability of defects by BR and SAHP film which reduces the ingress of the solution. SPCN3 shows highest impedance values (Figure 5a) after 1 h of exposure at 0.01 Hz owing to the deposition of thicker film as shown in the SEM image (Figure 1d and Figure 2d). As the exposure periods are extended from 1 h to 11 days, the total impedance values at 0.01 Hz of the coatings increased two times (Figure 5b). For the reaction of coating/treated sample, it requires some time to react with the solution. Therefore, 11 days is the duration when all samples properly reacted and form the corrosion products.
It is observed that after 41 days of exposure, all samples exhibit increases in the impedance values except SPCN3 (Figure 5c). SPCN3 shows the lowest impedance value exposed to 3.5 wt.% NaCl solution owing to the dissolution of SAHP film which make the solution acidic. AC, SPCN1, and SPCN2 exhibit more than 11 times higher impedance compared to SPCN3. The increase in impedance values of AC samples is attributed to the deposition of stable and uniform corrosion products which fill out the pores and reduce the ingress of solution towards the surface. Once the exposure periods are extended up to 89 days, the total impedance value of AC and SPCN2 increased dramatically due to the deposition of sparingly soluble corrosion products onto the coating surface which stifle the ingress of the solution while SPCN1 is decreased (Figure 5d) compared to 41 days. In the case of SPCN1, there is a possibility that BR and SAHP have dissolved and deposited the defective corrosion products onto the coating surface. Therefore, the total impedance value is less compared to AC and SPCN2. The amount of BR and SAHP in SPCN1 was minimum which did not influence in pH reduction of the studied solution. However, in the case of SPCN3, the amount of these phases were the maximum and active in nature which might be dissolved in the studied solution and result in lowering of pH as well as impedance value. The SPCN2 sample steadily dissolve and uniformly cover the surface thus, higher total impedance is observed at 0.01 Hz (Figure 5d). The total impedance value of AC, SPCN1, and SPCN2 is found to be increased by 11, 8, and 12 times compared to SPCN3 sample, respectively.
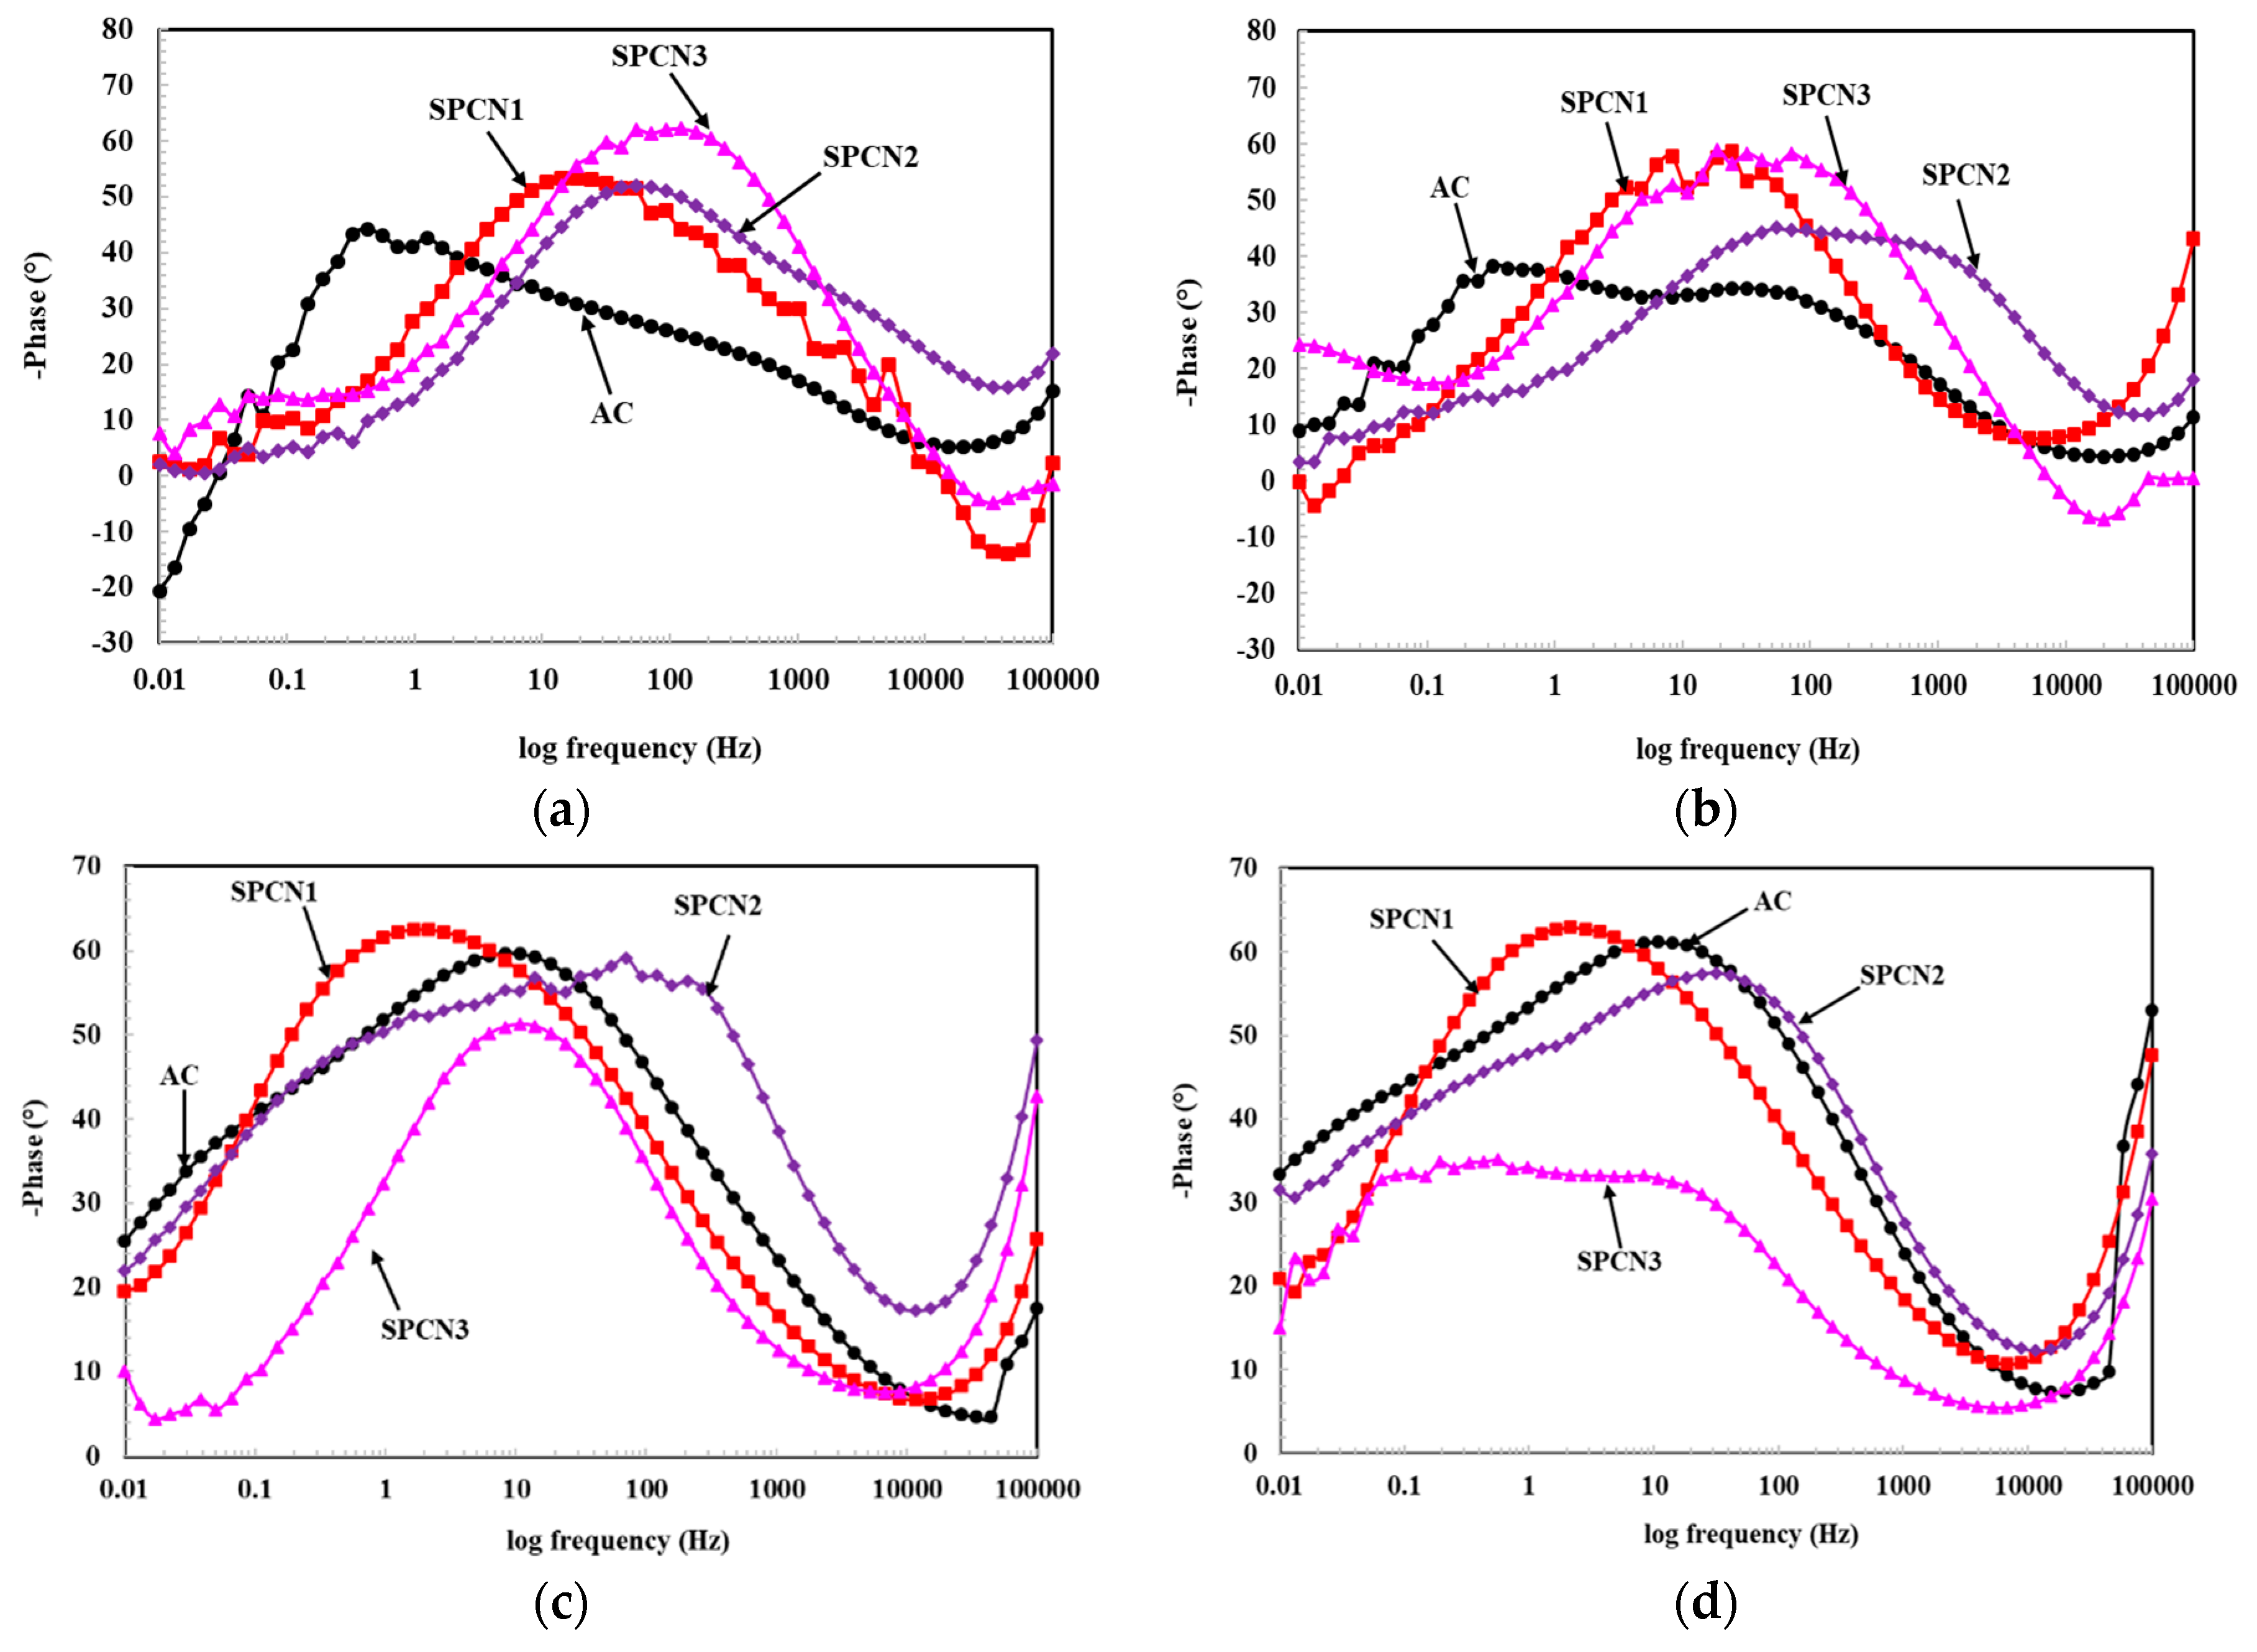
The phase-frequency Bode plots of the coatings with exposure periods in 3.5 wt.% NaCl solution are illustrated in Figure 6. It is observed that SPCN1 and SPCN2 exhibit one time constant around −52° on 11 and 71 Hz, respectively, owing to the deposition of treatment film while AC and SPCN3 show two different time constants at different frequencies (Figure 6a). Middle frequency attributed to the treatment/corrosion products while lower frequency shows the characteristics of the coating [34,60,61,62,63]. The SPCN3 sample shows highest shifting in phase angle maxima at −62° on 120 Hz while at lower frequency i.e., 0.03 Hz exhibit at −13°. The AC sample shows 20° phase angle shifting on 0.01 Hz which reveals that the coating is defective and the crack bearing surface enhances the ingress of aggressive ions from atmosphere/solution. As the exposure periods are extended from 1 h to 11 d, the phase angle maxima are shifted towards a higher angle in the middle frequency range (Figure 6b) owing to the deposition of corrosion products onto the surface. AC sample shows two time constants; one at −33° on 70 Hz attributed to the corrosion products while another at −38° on 0.32 Hz owing to the coating characteristics. This result suggests that coating as well as corrosion products of AC sample strengthen their properties with exposure periods in NaCl solution. Thus, increment in the impedance is observed compared to 1 h of exposure (Figure 5b). The treated coatings show shifting of maxima at a higher angle. The SPCN1 shows only one time constant in middle frequency ranges around −58° attributed to the treatment or deposition of corrosion products. Although, in middle frequency ranges, scattering in data is observed owing to the defective corrosion products which causes capacitance. The SPCN2 and SPCN3 show two phase angle maxima, one at middle and another at lower frequency. The SPCN2 exhibit broadening in maxima at −43° from 1800 to 18 Hz owing to the deposition of uniform corrosion products after reaction of BR and SAHP film with NaCl solution. At lower frequency i.e., 0.017 Hz, the phase angle maxima are shifted from −0.5° to −7.5° for 1 h to 11 days, respectively. It means the reaction of BR and SAHP help in improving the properties of coating as well as corrosion products. The SPCN3 shows the maxima around −58° at 31 Hz with scattering which reveals that treatment/corrosion products are defective and causes capacitance. But broadening in the time constant is observed which helps in improvement of the impedance. However, the decrease in maxima after 11 days compared to 1 h is owing to the dissolution of defective BR and SAHP film during reaction with NaCl solution. It might be corrosion products distributed all over the surface but being defective at longer durations of exposure causes deterioration.
As the exposure periods are extended from 11 to 41 days, the phase angle maxima of all samples shifted towards higher angles except SPCN3 (Figure 6c). The decrease in phase angle maxima of SPCN3 owing to the dissolution of BR and SAHP film as well as deposition of defective corrosion products which was started to dissolve after 11 days of exposure. Thus, the coating itself is participating in the corrosion reaction. It is also observed that the phase angle maxima at lower frequency i.e., 0.01 Hz, is decreased compared to 11 days of exposure. This result indicates that BR and SAHP film is completely dissolved and the coating has started to participate in the corrosion reaction. It is attributed to the high amount of BR and SAHP which makes the studied solution acidic. The phase angle maxima of SPCN1 sample is around −62° on 1.25 Hz which reveals that coating is providing protection rather than corrosion products. It might be due to less amount of BR and SAHP film which was dissolved and fill out the defects of the coating, but the corrosion products are not too protective. Thus, at longer durations of exposure i.e., 89 days, the impedance is decreased (Figure 5d) compared to 41 days. The AC and SPCN2 samples exhibit phase angle maxima in middle frequency ranges at −59° which show the characteristics of corrosion products. But, SPCN2 shows broadening in maxima from 271 to 2 Hz which reveals that corrosion products are uniformly distributed. The phase maxima of AC and SPCN2 at 0.01 Hz shifted towards higher angles compared to earlier exposure periods. This result suggests that the deposition of corrosion products on these two samples strengthen the coating properties. After 89 days of exposure, the phase angle maxima of SPCN3 shifted at a lower angle around −34° with broadening (Figure 6d) which indicates that corrosion products are not helping anymore to stifle the penetration of solution. On the other hand, SPCN1 shows identical phase angle maxima around −62° on 1.25 Hz (Figure 6d) as obtained after 41 days of exposure. It means there is no improvement in corrosion characteristics of the SPCN1 sample. AC and SPCN2 exhibit phase angle maxima around −61° on 14 Hz and −57° on 31 Hz after 89 days of exposure in 3.5 wt.% NaCl solution (Figure 6d) but at lower studied frequency i.e., 0.01 Hz, it is found to be around −33° and −32°, respectively. The shifting in maxima of AC, SPCN1, and SPCN2 at higher angles in middle frequency provide protection due to corrosion products while the lower studied frequency i.e., 0.01 Hz, is due to coating. The shifting in maxima of AC and SPCN2 at higher angle on 0.01 Hz would provide protection attributed to the coating. This result suggests that corrosion products as well as coating are participating in corrosion resistance. Thus, AC and SPCN2 show higher impedance compared to SPCN1 and SPCN3.
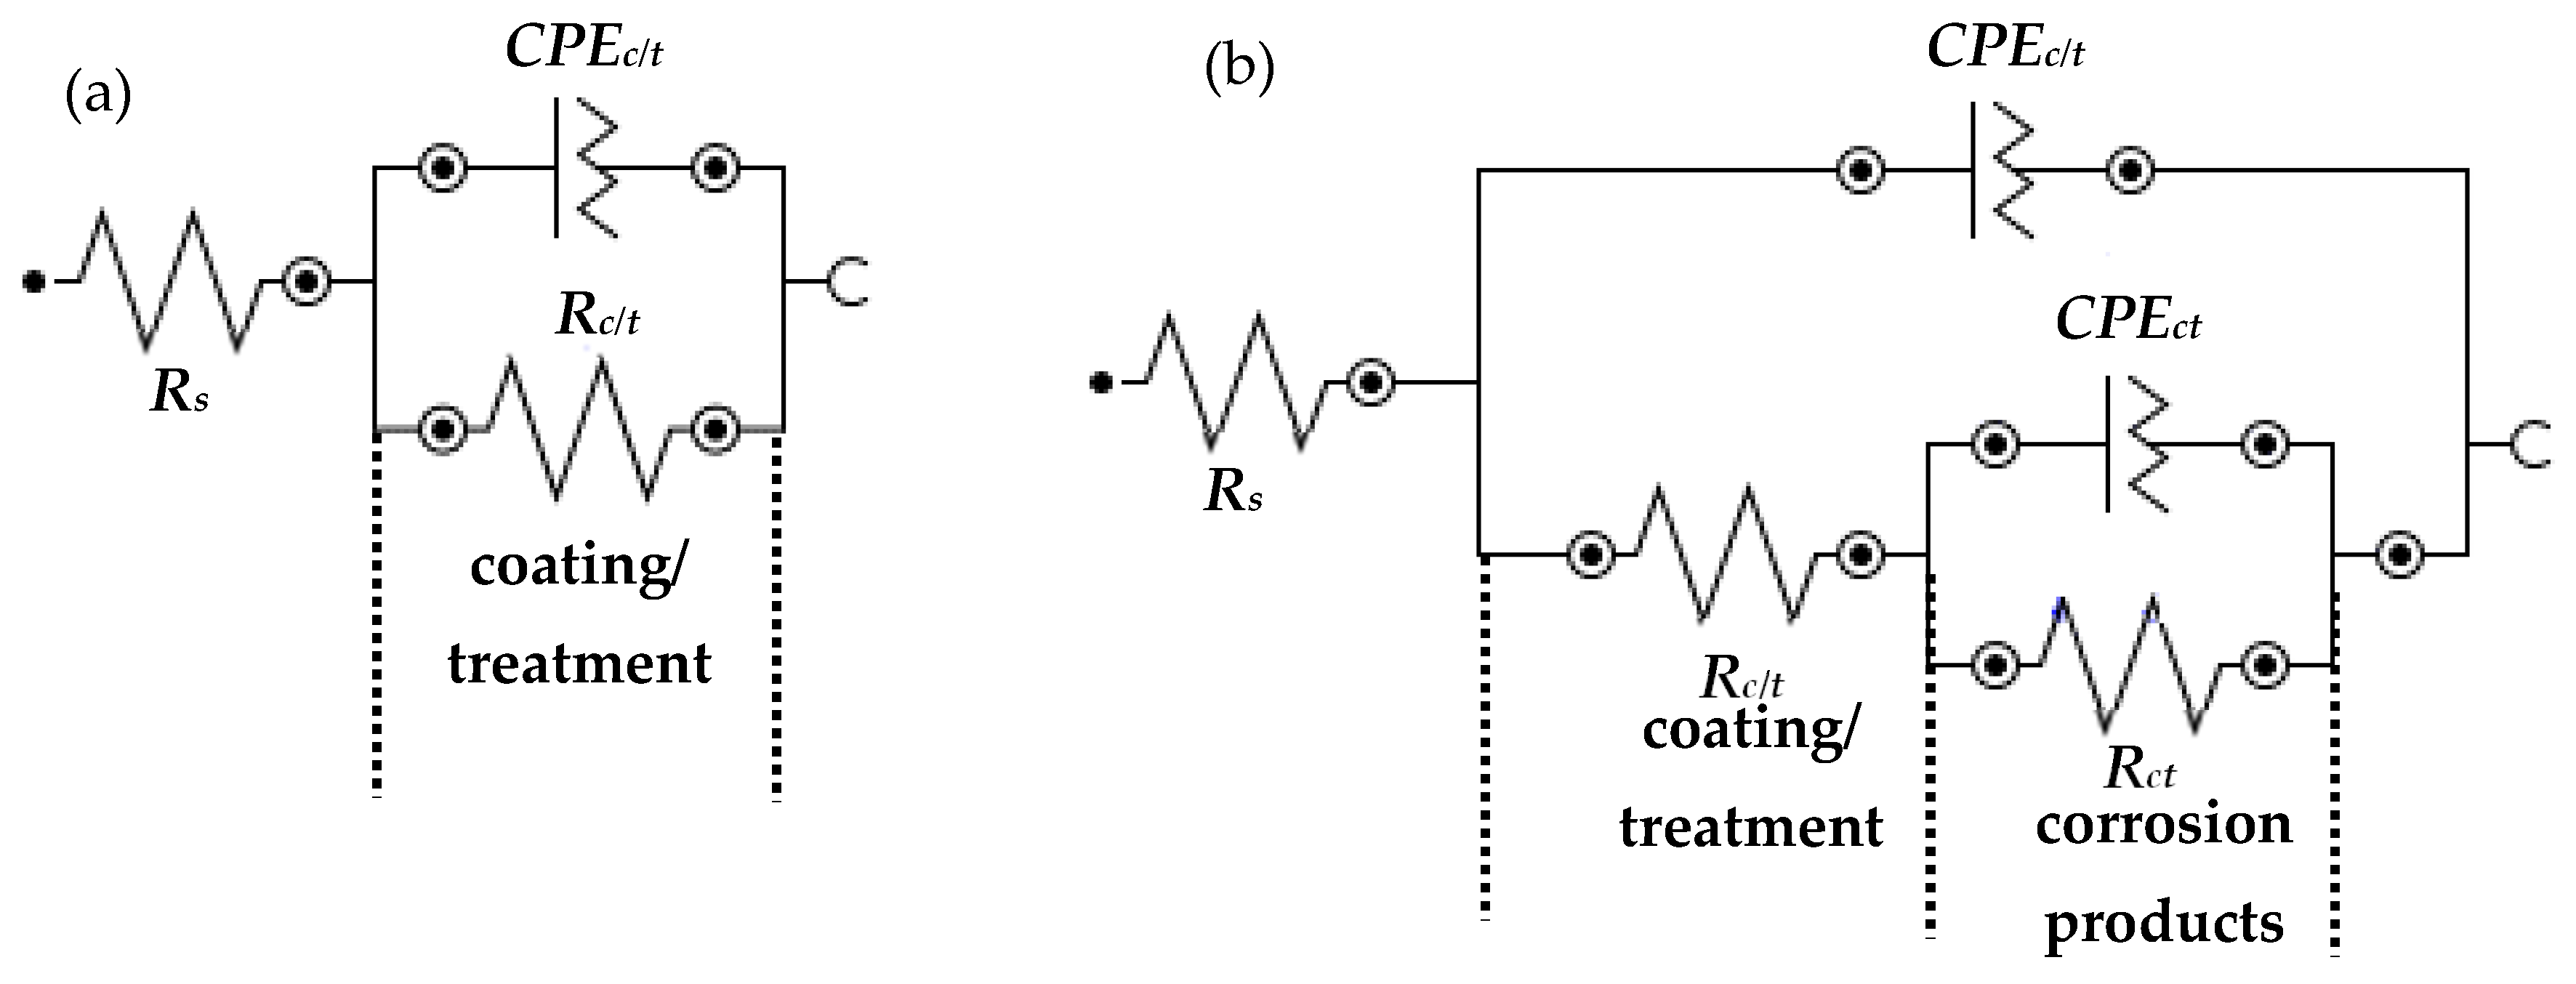
The electrical equivalent circuit (EEC) of the coatings exposed in 3.5 wt.% NaCl solution are shown in Figure 7. In Figure 7a, Rs, Rc/t, and CPEc/t represent the solution resistance, coating/treatment resistance, and constant phase element of coating/treatment, respectively. This EEC is suitable for SPCN1 after 1 h and 11 days as well as SPCN2 for 1 h of exposure in 3.5 wt.% NaCl solution whereas once the exposure periods are extended, another EEC would be involved because the treated layer and corrosion product both have participated in the corrosion reaction at the coating/solution interface. In the case of the AC sample, once the coating comes in contact with the solution, immediately it starts to deteriorate due to the presence of defects on the surface. Thus, two EECs would participate. One EEC for coating which causes resistance for coating (Rc) while another for charge transfer resistance (Rct). This EEC is shown in Figure 7b. In this EEC, CPEct is in series with Rc/t while Rct is parallel (Figure 7b).
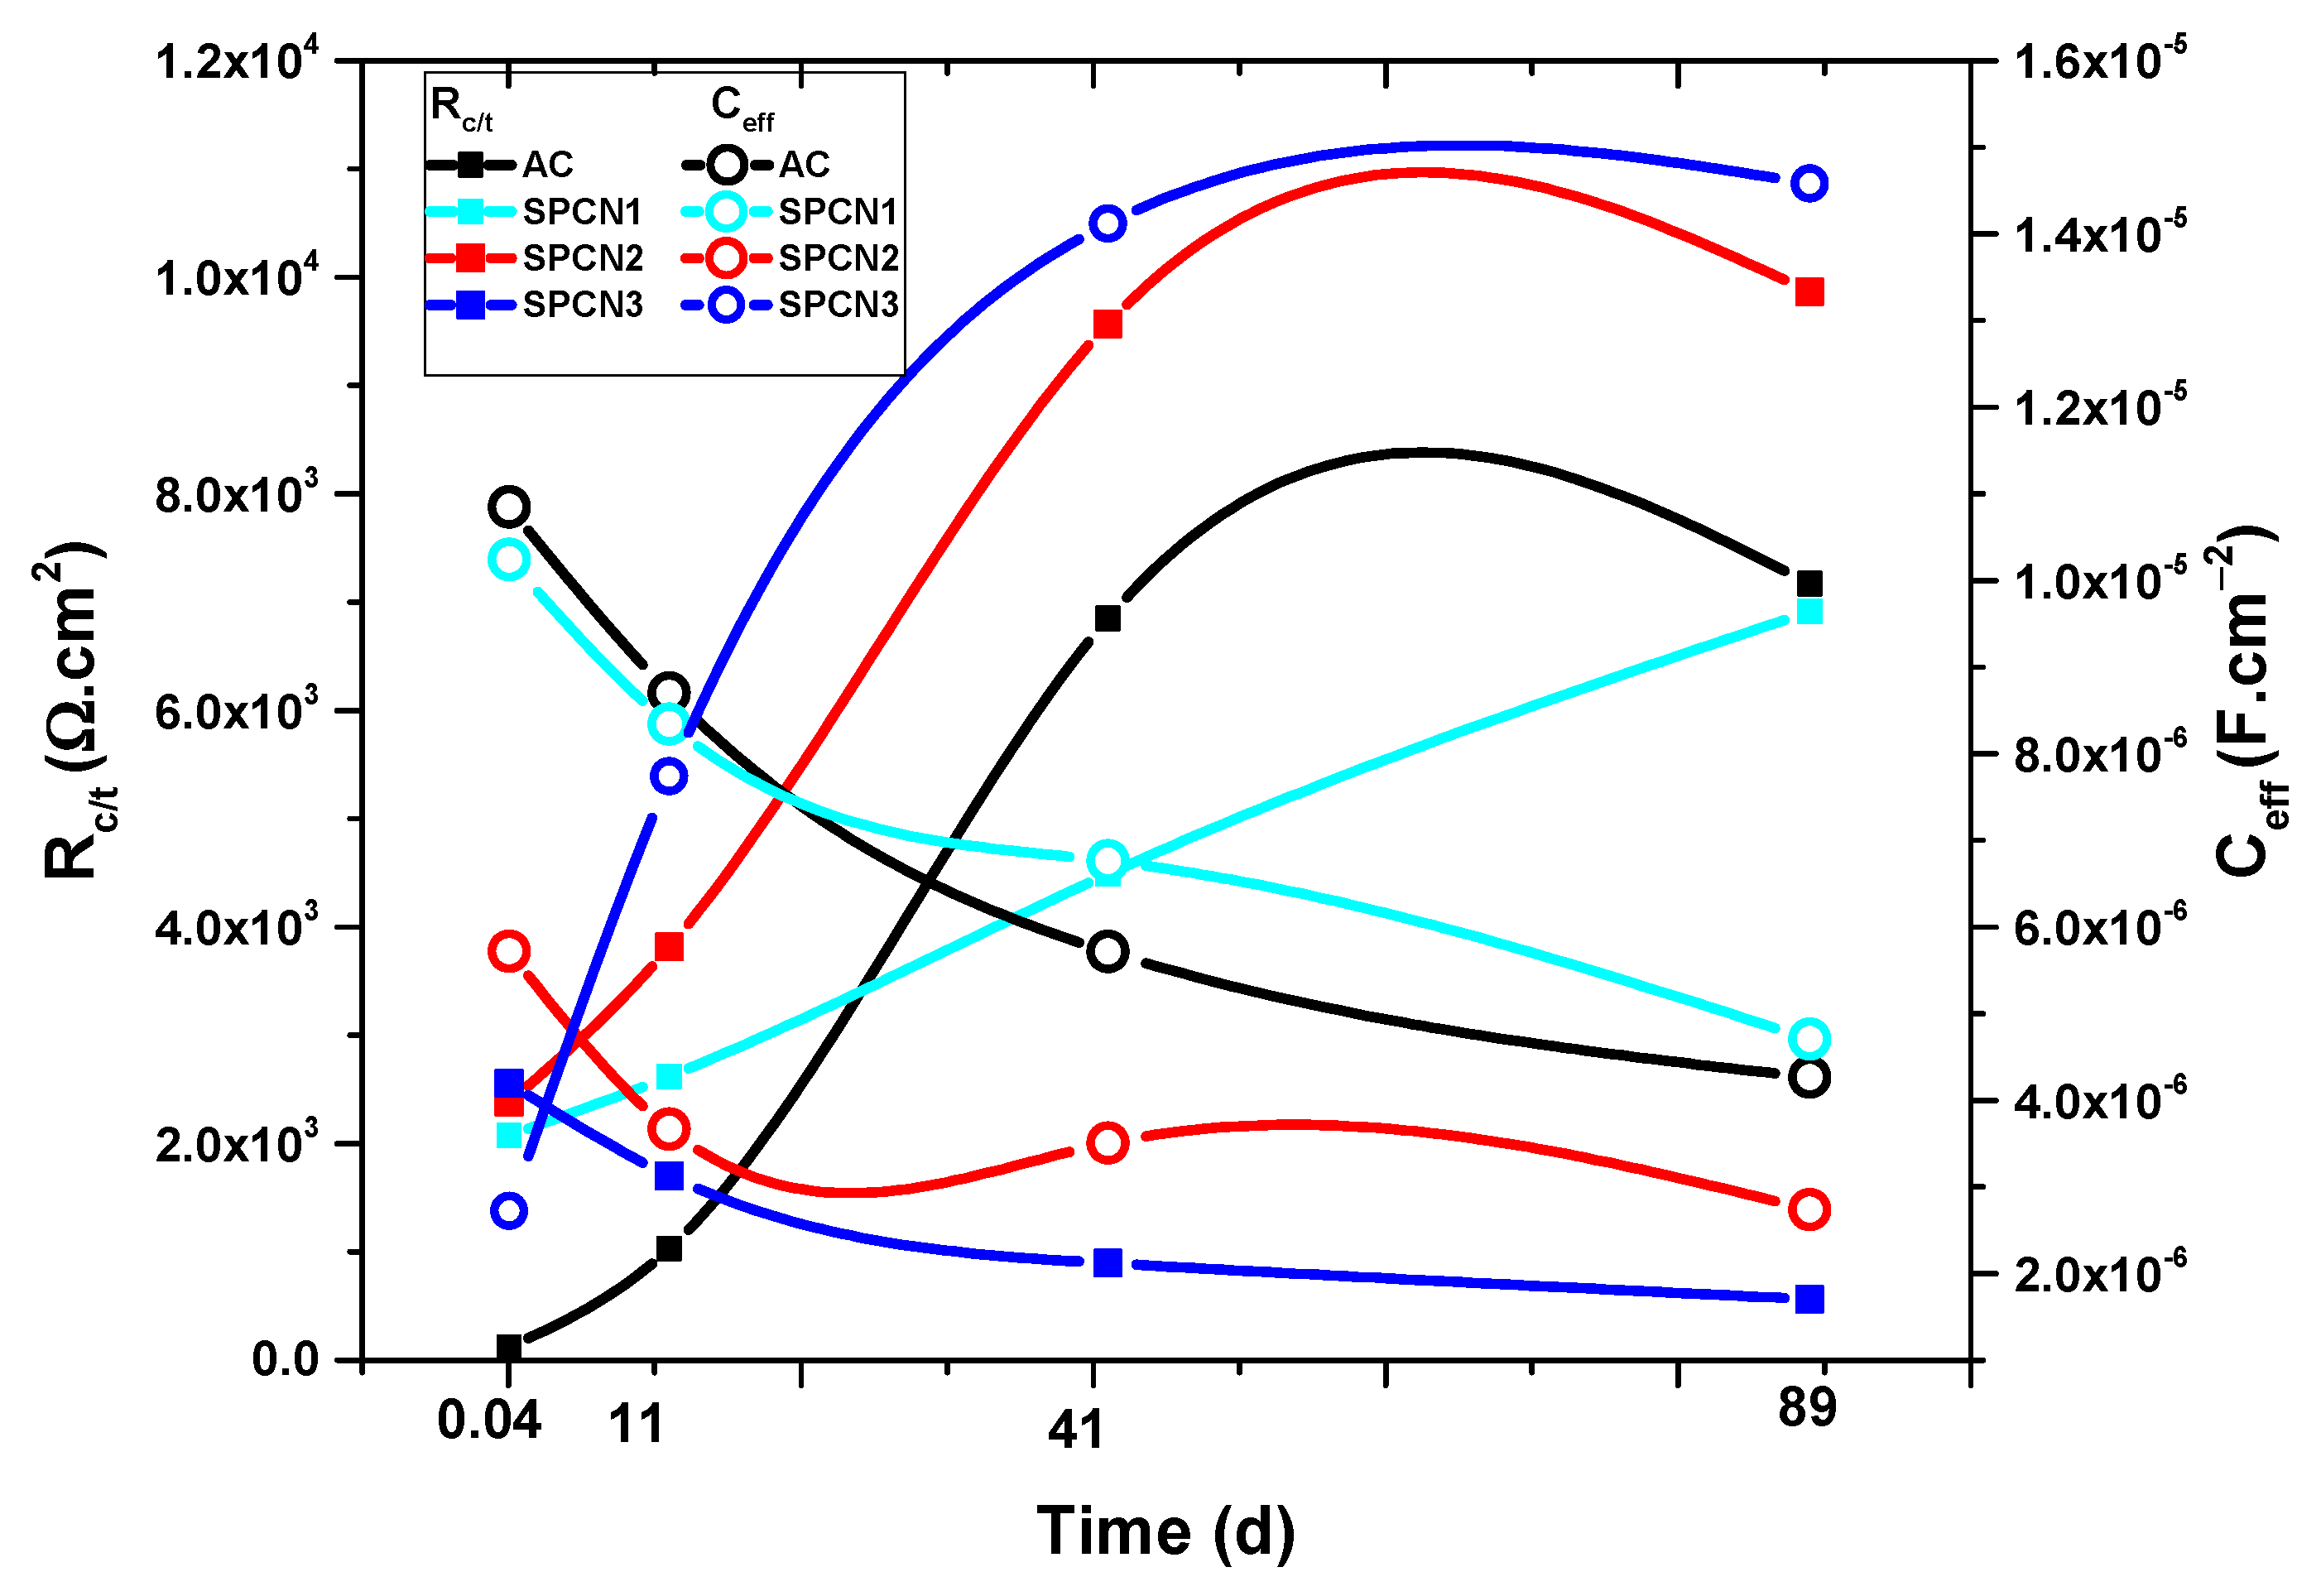
After fitting of EIS data in suitable EEC, electrochemical parameters were determined. The electrochemical parameters after fitting of EIS data in suitable EEC are shown in Table 3 and Figure 8. From Table 3, it can be seen that Rs is found to be in between 16–31 Ω·cm2 for all samples at different exposure periods. Due to the presence of defects on AC as well as treated coatings, constant phase element (CPE) is involved instead of pure capacitance. Thus, the effective CPE (Qeff) can be calculated by imaginary impedance when n ≠ 1 [64]:
Q e f f = sin ( n π 2 ) 1 Z j ( f ) ( 2 π f ) n
where n, Zj, and f are the CPE exponent, imaginary impedance, and frequency, respectively. But, when n = 1 then Qeff becomes a capacitance (Ceff), and Equation (2) can be rewritten as:
Q e f f = C e f f = 1 Z j ( f ) ( 2 π f )
Thus, the corrosion characteristics of the coating between interfacial capacitance and the CPE coefficient (Q) can be calculated by Brug’s equation [65] and others [66,67]:
C e f f = Q 1 / n R s ( 1 n ) / n
From Figure 8, it can be seen that Rc/t of all samples is gradually increased with exposure periods except SPCN3 which shows a decrease in its value after 41 days of exposure. The detrimental nature of SPCN3 after 41 days of exposure might be attributed to the dissolution of BR and SAHP film in NaCl solution which makes the solution acidic thus, at longer duration of exposure Rct is also decreased (Table 3). After 41 days of exposure, AC shows a higher Rc value compared to SPCN1 and SPCN3 owing to the greater filling ability of defects by corrosion products which strengthen the coating properties. In the case of SPCN1, it can be said that the thin layer of BR and SAHP films have dissolved and the corrosion products have deposited onto the coating surface and simultaneously due to the dissolution of film, the solution become slightly acidic which hinders the formation of a stable corrosion product. Thus, Rct is decreased after 89 days of exposure in 3.5 wt.% NaCl solution (Table 3). The resistance to treatment (Rt) value of SPCN2 is highest among all samples after 41 days of exposure (Figure 8) and might be owing to the transformation of BR and SAHP film into a stable corrosion product. Thus, it can be said that 0.5 M NaH2PO4 with 0.1 M Ca(NO3)2 i.e., SPCN2 is the optimum amount to give the highest corrosion resistance of Al coating. In this case, the formed BR and SAHP is neither higher nor lower to give the negative effect on corrosion of Al coating. It can be said that 0.1 M Ca(NO3)2 has the synergistic effect to get an adherent and stable oxide layer which protects the coating from corrosion. As the Rc/t is increased, the Ceff is decreased simultaneously (Figure 8). Ceff represents the defectiveness of the coating surface. It can be seen from SEM images (Figure 1a and Figure 2a) that initially the AC sample was highly defective, thus Ceff is very high (Figure 8) for 1 h but once the exposure periods are increased, this value is decreased owing to the deposition of stable corrosion products which fill out the defects. Due to the greater filling ability of the coating after treatment, Rt is very high in SPCN3 for 1 h and 11 days of exposure but this value is decreased from 41 to 89 days, thus Ceff is increased (Figure 8). After 41 days of exposure, SPCN2 exhibited the highest Rt and lowest Ceff therefore, this treatment is the optimum for corrosion protection of Al coating at longer duration of exposure in 3.5 wt.% NaCl solution. Moreover, it can be suggested that during the initial period of exposure, the protection can be defined by filling ability of the coating but at longer duration it can be determined by nature of corrosion products. Thus, it is very important to characterize the nature of the corrosion product using SEM and XRD. The SEM and XRD results will be described in next section i.e., characterization of corrosion products.
The nc/t gives some information about the surface homogeneity of coating/treatment. Initially, the nt value of SPCN3 is higher due to uniform and homogenous deposition of treated film, but it is gradually decreased with exposure periods due to the dissolution of film (Table 3). AC exhibits the lowest nc value during initial periods of exposure which indicates that the surface is non-uniform, uneven and non-homogenous. On the other hand, nc/t value of AC, SPCN1, and SPCN2 is gradually increased with exposure periods and it is found that SPCN2 shows 0.79 after 89 days of exposure which reveals that the coating becomes homogenous. The Rct of SPCN3 is gradually increased up to 11 days due to deposition of corrosion product but nct is lower which indicates that corrosion products are defective and it might enhance the deterioration at a longer duration of exposure. It is observed from Table 3 that Rct and nct of SPCN3 is decreased after 41 days of exposure. The Rct and nct value of AC and SPCN2 are increased as well as Qct decreased after 11 days of exposure owing to the deposition of protective, uniform, and homogenous corrosion products.

3.2.2. Potentiodynamic Polarization Results

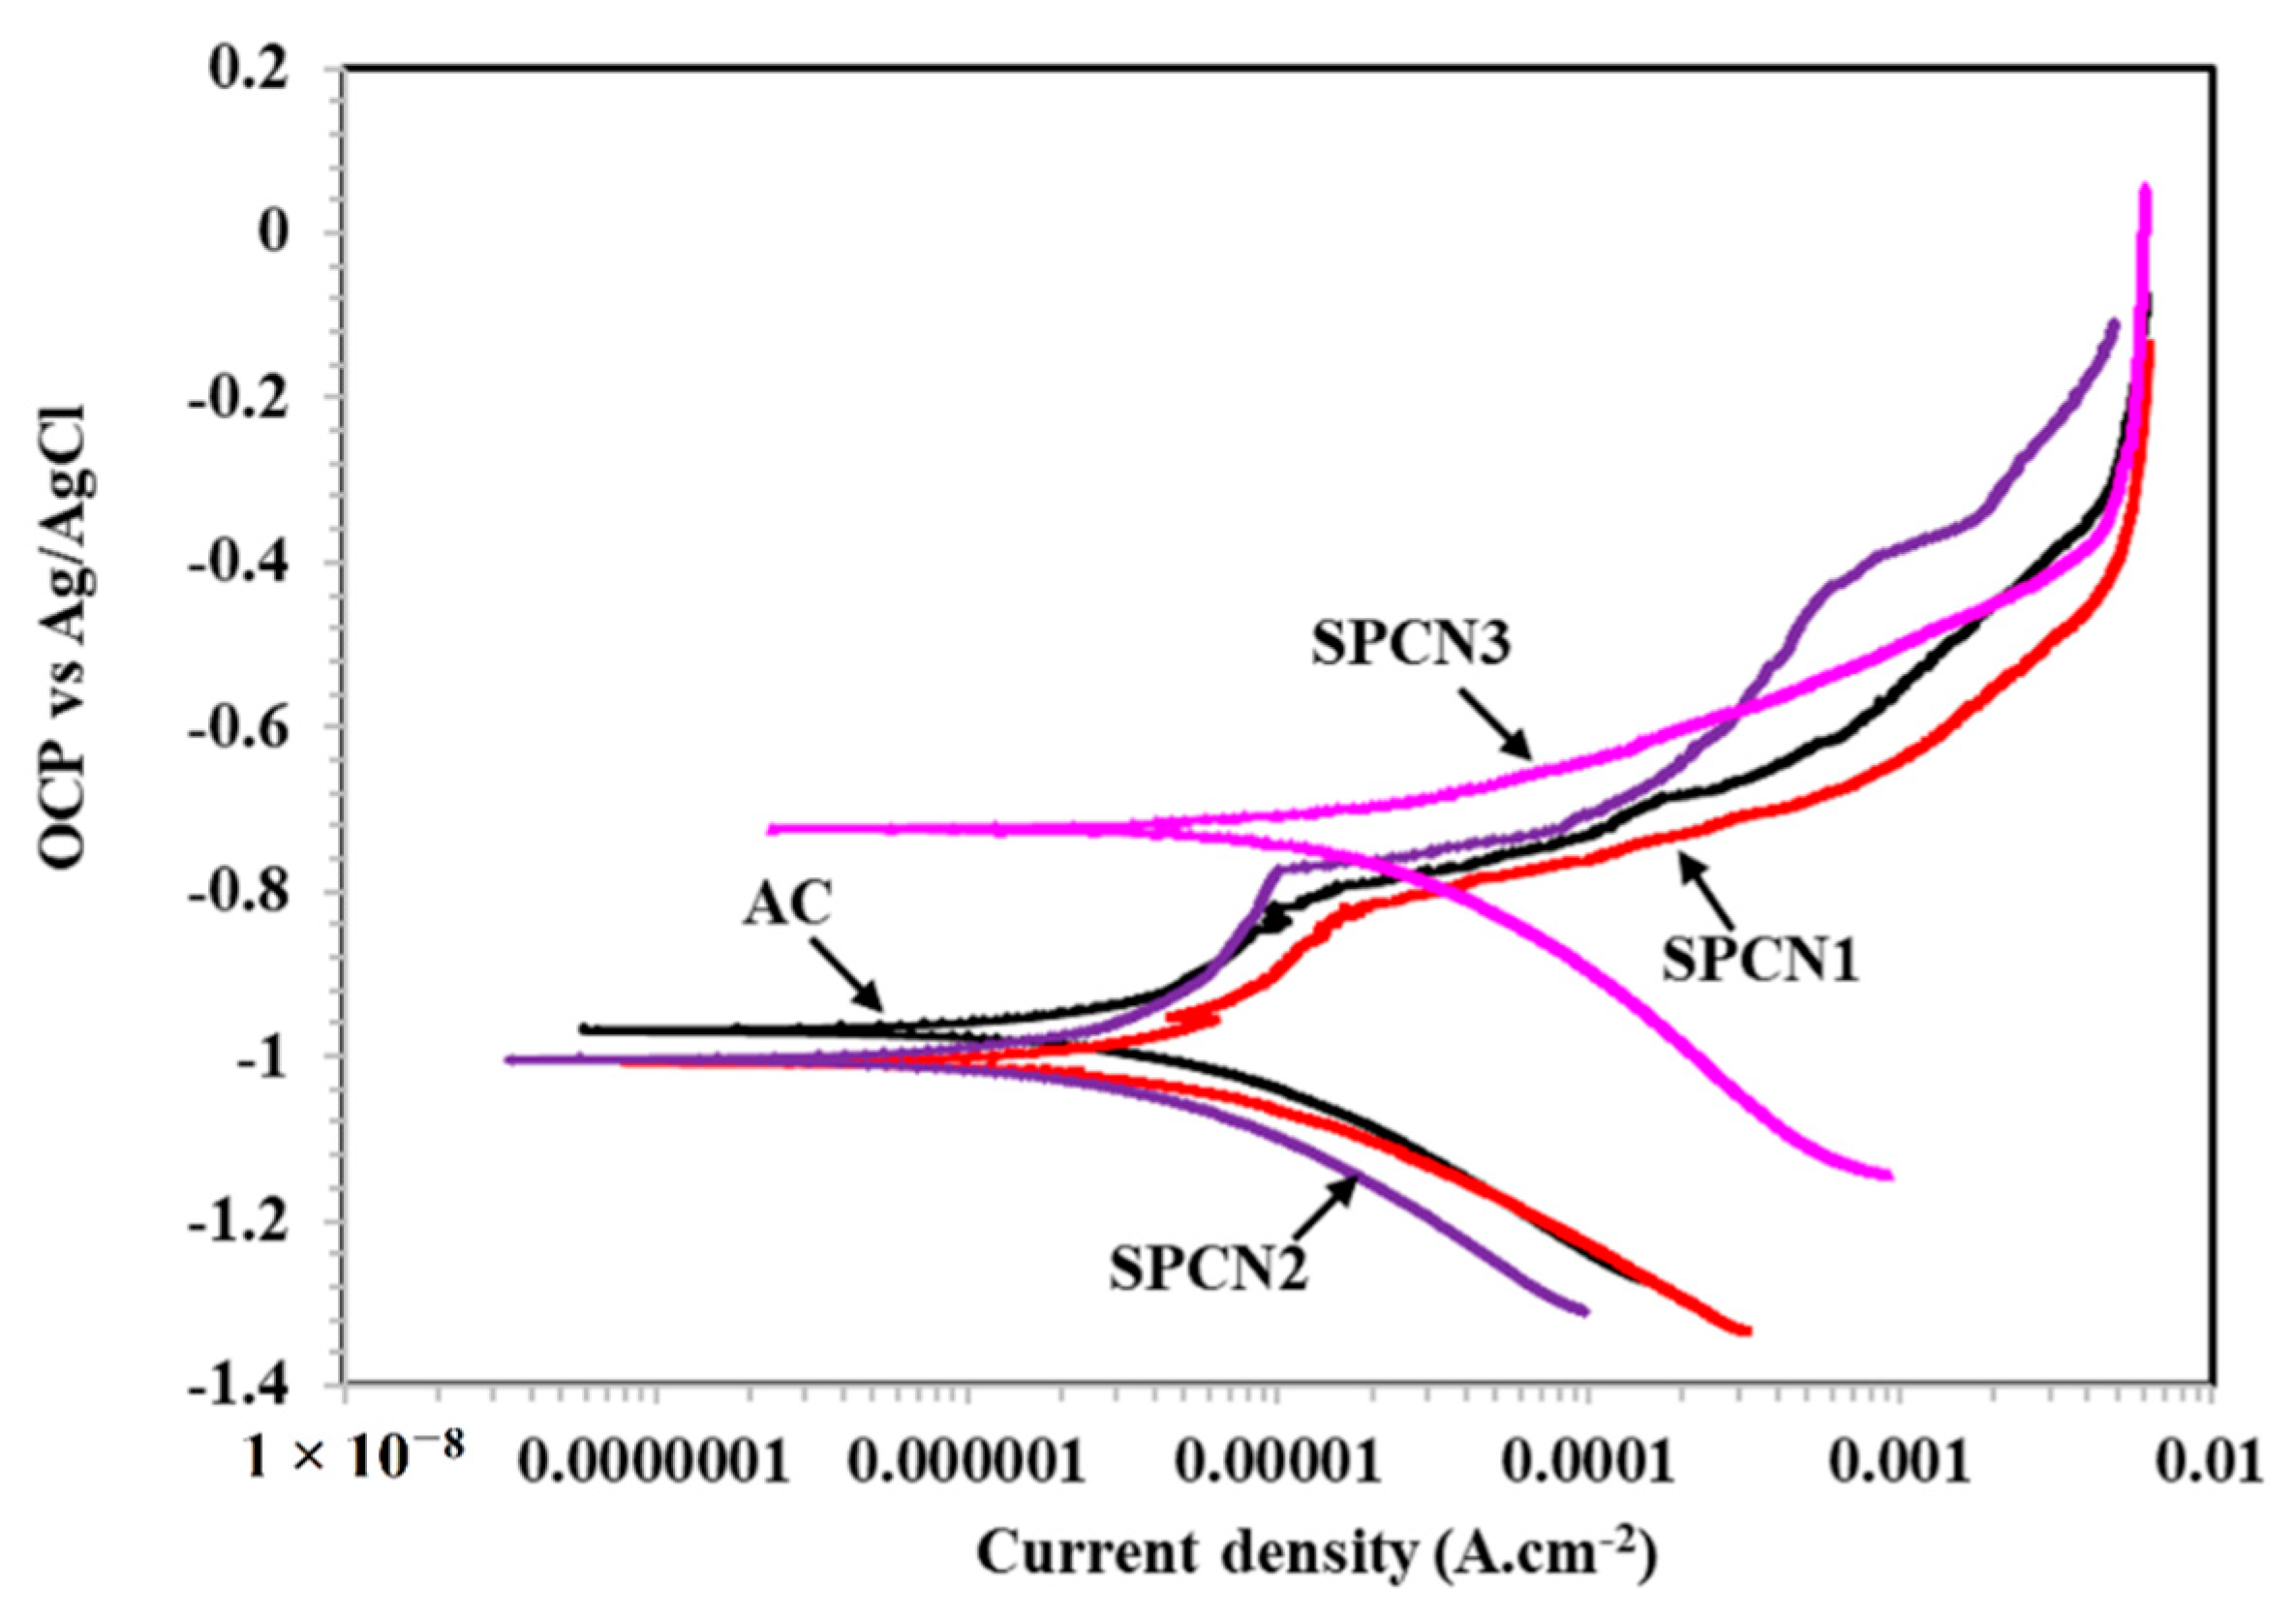
The potentiodynamic polarization plots of coatings after 89 days of exposure in 3.5 wt.% NaCl solution are shown in Figure 9. SPCN3 sample shows hydrogen evolution reaction at cathodic side might be owing to dissolution of SAHP film which is acidic in nature. The oxygen reduction reaction can be seen in AC, SPCN1, and SPCN2 due to deposition of oxide films/corrosion products onto the surface. The highest cathodic current density is observed in SPCN3 while the lowest is observed in SPCN2. It is attributed to the nature of corrosion products where the stable oxide film blocks the cathodic reaction [45]. There is sudden increment in anodic current density found on SPCN3 after corrosion potential (Ecorr) which indicates that there is a possibility to form a heavy pit. The correlation of this statement will be described on the basis of SEM results of corrosion products. It can be seen from Figure 9 that SPCN3 shows mass transfer resistance caused on 400 µA·cm−2 from −0.386 V to 0.021 V vs. Ag/AgCl where anodic current density is stabilized. The anodic current density of SPCN1 is increased on active open circuit potential (OCP). AC, SPCN1, and SPCN2 samples show passive behavior at anodic scanning due to the deposition of stable corrosion products/oxide layer. The formation of passive film is more prominent on SPCN2 followed by AC and SPCN1 which might be attributed to the transformation of unstable corrosion products into stable oxide. The anodic current density of SPCN2 is the lowest then followed by AC, SPCN1, and SPCN3 which indicates that SPCN3 is more active to corrosion at a longer duration of exposure in 3.5 wt.% NaCl solution.
The electrochemical parameters are extracted after the fitting of potentiodynamic polarization plots into Tafel slopes and the results are shown in Table 4. The corrosion potential (Ecorr) of the SPCN3 is found to be −0.722 V vs. Ag/AgCl. This result suggests that almost all treated film has dissolved after 89 days of exposure in 3.5 wt.% NaCl solution. It is attributed to the highly acidic nature of the treated film. The amount of BR and SAHP is highest in the SPCN3 sample among all treated coating which make the 3.5 wt.% NaCl solution acidic resultant to dissolution of Al coating. Al is amphoteric in nature, thus it can be dissolved in acidic medium. Therefore, at the cathodic side, a hydrogen evolution reaction is observed (Figure 9). On the other hand, it is observed that SPCN1 and SPCN2 show Ecorr around −1.0 V vs. Ag/AgCl which is more active compared to SPCN3. This result suggests that 1 M NaH2PO4 with 0.1 Ca(NO3)2 i.e., SPCN3, is not beneficial for corrosion resistance at a longer duration of exposure in 3.5 wt.% NaCl solution but at a shorter duration i.e., up to 11 days it has shown highest impedance (Figure 5) owing to the greater filling ability of defects. It is reported that if the coating shows Ecorr at −0.870 V vs. Ag/AgCl then such type of coating is considered as a sacrificial coating [68]. Since, in the present study, AC, SPCN1, and SPCN2 exhibit more than −0.870 V vs. Ag/AgCl, it indicates that these coatings are providing sacrificial protection to the steel even after 89 days of exposure in 3.5 wt.% NaCl solution. The corrosion current density (Icorr) of the SPCN3 is found to be highest among all coatings whereas SPCN2 shows the lowest in value (Table 4).
The corrosion rate of the sample was calculated using following equation [69]:
Corrosion   rate   ( µ m · y 1 )   =             3.27   ×   I c o r r   ×   E . W . d
where Icorr, E.W., and d represent corrosion current density (µA/cm2) obtained from dividing the total surface area of the working electrode by the corrosion current (µA), the equivalent weight (g/mol), and the density (g/cm3) of Aluminum, respectively.
The corrosion rate (µm·year−1) of the coatings is shown in Table 4. From this table it is confirmed that SPCN3 has the highest corrosion rate i.e., 208.52 µm·year−1 and lowest to be found on SPCN2. The corrosion rate of SPCN2 is 30% lower whereas SPCN1 and SPCN3 exhibited 21.53% and 379.47% higher, respectively compared to AC. Thus, it can be suggested that 0.5 M NaH2PO4 with 0.1 M Ca(NO3)2 i.e., SPCN2 is the optimum amount for corrosion resistance of Al coating deposited by arc thermal spray coating process. The highest and lowest corrosion rate of the coatings can be correlated with morphology and phases present in corrosion products. Therefore, in the subsequent paragraphs, we have characterized the corrosion products using SEM and XRD.

3.3. Characterization of the Corrosion Products

3.3.1. SEM of the Corrosion Products

The SEM of the corrosion product formed onto the coating surface after potentiodynamic polarization studies are shown in Figure 10. It can be seen from Figure 10a that AC sample contain regular and condensed globular particles of corrosion products which covered all over the surface, but some cracks can be observed because potentiodynamic polarization is a destructive experiment where the development of crack is possible. Thus, it shows cracks on the surface. The SEM images of corrosion products formed on treated samples are shown in Figure 10b–d. Figure 10b shows that corrosion products are coagulated in the center but in periphery of the corrosion products, space is observed which causes to ingress of solution. Thus, corrosion rate is higher compare to AC. Once the NaH2PO4 concentration is increased from 0.1 to 0.5 M with 0.1 M Ca(NO3)2 i.e., SPCN2, the corrosion products are uniformly distributed over the surface of coating (Figure 10c) with compact and adherent in nature characteristics which stifle the attack of aggressive ions from solution and atmosphere. The particle size of the corrosion products is smaller compare to AC and SPCN1 which completely cover all over the surface thus, the lowest corrosion rate is observed. It is attributed to the transformation of BR and SAHP into stable corrosion products. On the other hand, SPCN3 exhibits very big cracks perpendicular to the coating (Figure 10d) which allows the penetration of the solution and reaches towards the steel substrate and causes heavy corrosion. This result correlates with potentiodynamic polarization results (Figure 9) where the anodic current density was suddenly increased during anodic scanning which attributed to the pits formation. The diameter of the cracks is around 10 µm where the smaller particles of corrosion products are filled. After the treatment of Al coating with SPCN3, fine cracks were developed (Figure 1d) but once it was exposed to NaCl solution, the cracks are propagated and enhanced the corrosion rate at a longer duration. Thus, highest corrosion rate is observed after 89 days of exposure in 3.5 wt.% NaCl solution (Table 4).
The EDS analysis of the corrosion products formed on coating surfaces are shown in Table 5. The element present on corrosion products of AC sample contain O, Al, Na, and Cl. Na and Cl are attributed to the NaCl solution whereas O and Al are owing to the corrosion products. This result suggests that the corrosion products contain NaCl, Al, and oxides or hydroxides of Al. Therefore, XRD is needed to characterize the corrosion products which will be described in subsequent paragraph. N is found to be between 1.24% to 1.31% in corrosion products of all treated coatings. This amount is almost identical as found after treatment (Table 1). This result suggests that N from Ca(NO3)2 is remaining in the corrosion products which might help in the transformation of corrosion products. It means Ca(NO3)2 has a synergistic effect on transformation of corrosion products into a stable form. The amount of Cl in SPCN3 and SPCN1 is very high which causes pitting corrosion, thus, SEM images of the corrosion products of these treated coatings exhibit pit formation (Figure 10b,d). P and Ca in corrosion products of SPCN2 are the highest which means that these elements are entrapped in corrosion products and help in formation of stable corrosion products. The presence of Na and Cl shows that NaCl was deposited in corrosion products of all coatings. However, the P and Ca amount is reduced (Table 5) in corrosion products of all treated samples compared to treatment (Table 1). This result suggests that BR and SAHP have dissolved and transformed into another form. High amounts of O reveal that corrosion products contain either Al2O3 or Al(OH)3. Thus, XRD is performed to know the phases formed in corrosion products.

3.3.2. XRD of Corrosion Products

XRD results of the corrosion products are shown in Figure 11. It is found that all samples show Al, NaCl, and α-Al(OH)3. Al is present due to the coating whereas NaCl is found because the coating was exposed in 3.5 wt.% NaCl solution. Thus, there is possibility to deposit the NaCl in corrosion products. The presence of α-Al(OH)3 in treated coating might have occurred via the following reaction [32,33]:
CaHPO 4 ( H 2 O ) 2 + Na 3 Al ( OH ) ( HPO 4 ) ( PO 4 ) + 5 H 2 O Al ( OH ) 3 + 3 NaOH + Ca ( OH ) 2 + 3 H 3 PO 4
The BR and SAHP react with water and form Al(OH)3, NaOH, Ca(OH)2, and H3PO4. Al(OH)3 is identified as α-Al(OH)3 (bayerite). Bayerite is thermodynamically stable which plays an important role in the reduction of corrosion rate. Thus, it is important to determine the volume fraction of phases present in the corrosion products. Volume fraction of each phase identified by XRD in corrosion products are shown in Table 6. AC sample shows higher NaCl compared to SPCN1 and SPCN2 owing to the absence of treatment layer. In this case, there is the possibility that corrosion products and NaCl both fill out the defects of the coating. The SPCN2 sample exhibits 43.95% α-Al(OH)3 which is highest compared to the others. Thus, it shows the least corrosion rate (Table 4). The SPCN3 shows least percentage of α-Al(OH)3 thus, it shows highest corrosion rate. AC sample shows the lowest Al owing to the deposition of NaCl and α-Al(OH)3 in the corrosion products. The amount of α-Al(OH)3 is greater than SPCN1 and SPCN3 and lesser than SPCN2. Therefore, it shows lesser corrosion rate compared to SPCN1 and SPCN3.

4. Conclusions

From the above results and discussion the following conclusions can be drawn:
  • The treatment of Al coating exhibited reduction in defects by 19%, 38%, and 71% for SPCN1, SPCN2, and SPCN3, respectively compared to AC.
  • After treatment with different concentrations of NaH2PO4 and 0.1 M Ca(NO3)2, brushite and sodium Aluminum hydrogen phosphate (SAHP) composite oxide film was formed on the coating surface. Due to the formation of SAHP film on treated coating, it exhibits cracking.
  • The EIS results show that initially SPCN3 exhibited highest Rt value followed by SPCN2, SPCN1, and AC, but at longer durations of exposure it shows least in value owing to the dissolution of the treated film. High amounts of SAHP make the solution acidic which enhances the deterioration of the coating in 3.5 wt.% NaCl solution.
  • After 89 days of exposure, SPCN2 shows highest Rt and Rct values whereas SPCN3 is the lowest owing to the deposition of stable and protective corrosion products.
  • SPCN2 shows lowest corrosion rate whereas SPCN3 is the highest.
  • Morphology of corrosion products formed on SPCN2 after 89 days of exposure in 3.5 wt.% NaCl solution show compact and less porous while SPCN3 shows heavy cracking.
  • Highest amount of α-Al(OH3)-Bayerite present in corrosion products of SPCN2 after 89 days of exposure in 3.5 wt.% NaCl solution stifle the ingress of solution. Therefore, enhancement in corrosion resistance is observed.

Author Contributions

Data curation, A.K. and J.K.S.; formal analysis, H.-S.L., S.M., J.K.S., F.A., R.A., and H.A.; funding acquisition, H.-S.L.; investigation, A.K., S.M., and J.K.S.; methodology, S.M., J.K.S., and F.A.; supervision, J.K.S.; writing—original draft, H.-S.L., A.K., S.M., J.K.S., F.A., R.A., and H.A.; writing—review and editing, H.-S.L., A.K., S.M., J.K.S., F.A., R.A., and H.A. All authors have read and agreed to the published version of the manuscript.

Funding

There is no external funding for this research.

Acknowledgments

This research was supported by basic science research program through the National Research Foundation (NRF) of Korea funded by the Ministry of Science, ICT and Future Planning (No. 2015R1A5A1037548).

Conflicts of Interest

The authors declare no conflict of interest.

References

  1. Schmitt, G.; Schütze, M.; Hays, G.F.; Burn, W.; Han, E.-H.; Pourbaix, A.; Hacobson, G. Global Needs for Knowledge Dissemination, Research, and Development in Materials Deterioration and Corrosion Control; World Corrosion Organization (WCO): New York, NY, USA, 2009. [Google Scholar]
  2. McCafferty, E. Introduction in Corrosion Science; Springer: New York, NY, USA, 2010. [Google Scholar]
  3. Hou, B.; Li, X.; Ma, X.; Du, C.; Zhang, D.; Zheng, M.; Xu, W.; Lu, D.; Ma, F. The cost of corrosion in China. Npj Mater. Degrad. 2017, 1, 1–10. [Google Scholar] [CrossRef]
  4. Qian, Y.; Li, Y.; Jungwirth, S.; Seely, N.; Fang, Y.; Shi, X. The application of anti-corrosion coating for preserving the value of equipment asset in chloride-laden environments: A review. Int. J. Electrochem. Sci. 2015, 10, 10756–10780. [Google Scholar]
  5. Etzrodt, G. Pigments, inorganic, 5. Anticorrosive pigments. In Ullmann’s Encyclopedia of Industrial Chemistry; Wiley: Weinheim, Germany, 2012; Volume 27, pp. 343–357. [Google Scholar]
  6. Buxbaum, G.; Pfaff, G. (Eds.) Industrial Inorganic Pigments; Wiley: Weinheim, Germany, 2005. [Google Scholar]
  7. Zhang, H.B.; Zuo, Y. The improvement of corrosion resistance of Ce conversion films on aluminum alloy by phosphate post-treatment. Appl. Surf. Sci. 2008, 254, 4930–4935. [Google Scholar] [CrossRef]
  8. Hinton, B.R.W.; Arnott, D.R.; Ryan, N.E. The inhibition of aluminium alloy corrosion by cerous cation. Maters Forum 1984, 7, 211–217. [Google Scholar]
  9. Hughes, A.E.; Scholes, F.H.; Glenn, A.M.; Lau, D.; Muster, T.H. Factors influencing the deposition of Ce-based conversion coatings, part I: The role of Al3+ ions. Surf. Coat. Technol. 2009, 203, 2927–2936. [Google Scholar] [CrossRef]
  10. Hou, B.-R.; Zhang, J.-L.; Sun, H.-Y.; Li, Y.; Xiang, B. Corrosion of C–Mn steel in simulated tidal and immersion zones. Br. Corros. J. 2001, 36, 310–312. [Google Scholar] [CrossRef]
  11. Smith, M.; Bowley, C.; Williams, L. In situ protection of splash zones—30 years on. Mater. Perform. 2002, 41, 30–33. [Google Scholar]
  12. Wigren, J.; Pejryd, L. Tungsten carbide coatings on jet engine components: Safe aviation. Sulzer Tech. Rev. 2000, 2, 36–39. [Google Scholar]
  13. Dorfman, M.R.; Erning, U.; Mallon, J. Benefits of clearance control thermal spray coatings: Sealing the gap. Anti Corros. Methods Mater. 2002, 49, 137–140. [Google Scholar] [CrossRef]
  14. Meuter, P. Protecting pumps against abrasive wear. World Pumps 2006, 482, 18–20. [Google Scholar] [CrossRef]
  15. Barbezat, G.; Herber, R. Breakthrough in improving car engine performance through coatings. Sulzer Tech. Rev. 2001, 2, 8–11. [Google Scholar]
  16. Pecoskie, R.P.; Parker, D.W. Coatings protect severe-service ball valves. Adv. Mater. Process. 1993, 144, 22–25. [Google Scholar]
  17. Muhamad, H.A.M.; Hayati, S.N.; Kiyai, A.S.; Binti, M.S.N. Thermal arc spray overview. Mater. Sci. Eng. 2013, 46, 1–10. [Google Scholar]
  18. Li, Y.; Liu, J.; Duan, J.; Hou, B. Thermally sprayed aluminium and zinc coatings for tidal zone cathodic protection of offshore platform pile leg. Mater. Perform. 2006, 45, 16–20. [Google Scholar]
  19. Yung, T.Y.; Chen, T.C.; Tsai, K.C.; Lu, W.F.; Huang, J.Y.; Liu, T.Y. Thermal spray coatings of Al, ZnAl and inconel 625 alloys on SS304L for anti-saline corrosion. Coatings 2019, 9, 32. [Google Scholar] [CrossRef] [Green Version]
  20. Lee, H.-S.; Singh, J.K.; Ismail, M.A.; Bhattacharya, C. Corrosion resistance properties of aluminum coating applied by arc thermal metal spray in SAE J2334 solution with exposure periods. Metals 2016, 6, 55. [Google Scholar] [CrossRef] [Green Version]
  21. Lee, H.S.; Singh, J.K.; Park, J.H. Pore blocking characteristics of corrosion products formed on aluminum coating produced by arc thermal metal spray process in 3.5wt.% NaCl solution. Constr. Build. Mater. 2016, 113, 905–916. [Google Scholar] [CrossRef]
  22. Min-Su, H.A.N.; Yong-Bin, W.O.O.; Seok-Cheol, K.O.; Jeong, Y.-J.; Jang, S.-K.; Kim, S.-J. Effects of thickness of Al thermal spray coating for STS 304. Trans. Nonferrous Met. Soc. China 2009, 19, 925–929. [Google Scholar]
  23. Jiang, Q.; Miao, Q.; Liang, W.; Ying, F.; Tong, F.; Yi, X.; Ren, B.; Yao, Z.; Zhang, P. Corrosion behavior of arc sprayed Al–Zn–Si–RE coatings on mild steel in 3.5 wt.% NaCl solution. Electrochim. Acta 2014, 115, 644–656. [Google Scholar] [CrossRef]
  24. Persson, D.; Thierry, D.; LeBozec, N. Corrosion product formation on Zn55Al coated steel upon exposure in a marine atmosphere. Corros. Sci. 2011, 53, 720–726. [Google Scholar] [CrossRef]
  25. Kim, S.-J.; Jeong, J.-Y.; Kim, J.-I. Investigation of optimum materials selection in thermal spray coating for the corrosion protection of STS 304. J. Ceram. Process. Res. 2007, 8, 296–299. [Google Scholar]
  26. Lee, H.-S.; Kwon, S.-J.; Singh, J.K.; Ismail, M.A. Influence of Zn and Mg alloying on the corrosion resistance properties of Al coating applied by arc thermal spray process in simulated weather solution. Acta Metall. Sin. (Engl. Lett.) 2018, 31, 591–603. [Google Scholar] [CrossRef] [Green Version]
  27. Lee, H.-S.; Singh, J.K.; Ismail, M.A.; Bhattacharya, C.; Seikh, A.H.; Alharthi, N.; Hussain, R.R. Corrosion mechanism and kinetics of Al–Zn coating deposited by arc thermal spraying process in saline solution at prolong exposure periods. Sci. Rep. 2019, 9, 3399. [Google Scholar] [CrossRef] [PubMed]
  28. Tailor, S.; Modi, A.; Modi, S.C. Synthesis, microstructural, corrosion and antimicrobial properties of Zn and Zn-Al coatings. Surf. Eng. 2019, 35, 736–742. [Google Scholar] [CrossRef]
  29. Heidersbach, R. Metallurgy and Corrosion Control in Oil and Gas Production, 1st ed.; Willey: Hoboken, NJ, USA, 2011. [Google Scholar]
  30. NORSOK. M-501, Surface Preparation and Protective Coating; Standards Norway: Oslo, Norway, 2012. [Google Scholar]
  31. Fauchais, P.; Vardelle, A. Thermal sprayed coatings used against corrosion and corrosive wear. In Advanced Plasma Spray Applications, 1st ed.; Jazi, H.S., Ed.; Intech: Rijeka, Croatia, 2012; pp. 1–38. [Google Scholar]
  32. Ramezanzadeh, B.; Akbarian, M.; Ramezanzadeh, M.; Mahdavian, M.; Alibakhshi, E.; Kardarar, P. Corrosion protection of steel with zinc phosphate conversion coating and post-treatment by hybrid organic-inorganic sol-gel based silane film. J. Electrochem. Soc. 2017, 164, C224–C230. [Google Scholar] [CrossRef]
  33. Lee, H.S.; Singh, J.K.; Ismail, M.A. An effective and novel pore sealing agent to enhance the corrosion resistance performance of Al coating in artificial ocean water. Sci. Rep. 2017, 7, 41935. [Google Scholar] [CrossRef] [PubMed]
  34. Lee, H.-S.; Singh, J.K. Influence of calcium nitrate on morphology and corrosion characteristics of ammonium phosphate treated aluminum coating deposited by arc thermal spraying process. Corros. Sci. 2019, 146, 254–268. [Google Scholar] [CrossRef]
  35. Jeong, H.-R.; Lee, H.-S.; Jalalzai, P.; Kwon, S.-J.; Singh, J.K.; Hussain, R.R.; Alyousef, R.; Alabduljabbar, H.; Aslam, F. Sodium phosphate post-treatment on Al coating: Morphological and corrosion study. J Therm. Spray Technol. 2019, 28, 1511–1531. [Google Scholar] [CrossRef]
  36. Pawlowski, L. The Science and Engineering of Thermal Spray Coating; Wiley: New York, NY, USA, 1995. [Google Scholar]
  37. Guenbour, A.; Benbachir, A.; Kacemi, A. Evaluation of the corrosion performance of zinc-phosphate-painted carbon steel. Surf. Coat. Technol. 1999, 113, 36–43. [Google Scholar] [CrossRef]
  38. Cinca, N.; Lima, C.R.C.; Guilemany, J.M. An overview of intermetallics research and application: Status of thermal spray coatings. J. Mater. Res. Technol. 2013, 2, 75–86. [Google Scholar] [CrossRef] [Green Version]
  39. Bettridge, D.F.; Ubank, R.G. Quality control of high-temperature protective coatings. Mater. Sci. Technol. 1986, 2, 232–242. [Google Scholar] [CrossRef]
  40. Steffens, H.D.; Babiak, Z.; Wewel, M. Recent developments in arc spraying. IEEE Trans. Plasma Sci. 1990, 18, 974–975. [Google Scholar] [CrossRef]
  41. Muhamad, H.A.M.; Hayati, S.N.; Kiyai, A.S.; Binti, M.S.N. Critical process and performance parameter of thermal arc spray coatings. Int. J. Mater. Eng. Innov. 2014, 5, 12–27. [Google Scholar]
  42. Davis, J.R. Surface Engineering for Corrosion and Wear Resistance; ASM International USA, Materials Park: Cleveland, OH, USA, 2001. [Google Scholar]
  43. KS F4716, Cement Filling Compound for Surface Preparation; Korean Agency for Technology and Standards (KATS): Seoul, Korea, 2001.
  44. Natarajan, U.V.; Rajeswari, S. Influence of calcium precursors on the morphology and crystallinity of sol-gel-derived hydroxyapatite nanoparticles. J. Korean Cryst. Growth Cryst. Technol. 2008, 310, 4601–4611. [Google Scholar] [CrossRef]
  45. Song, Y.; Shan, D.; Chen, R.; Zhang, F.; Han, E.-H. A novel phosphate conversion film on Mg–8.8Li alloy. Surf. Coat. Technol. 2009, 203, 1107–1113. [Google Scholar] [CrossRef]
  46. Brown, P.W. Phase relationships in the ternary system CaO-P2O5-H2O at 25 °C. J. Am. Ceram. Soc. 1992, 75, 17–22. [Google Scholar] [CrossRef]
  47. Dale, E.A.; Butler, K.H.; Thomas, M.J.B. Process for making brushite form of calcum hydrogen phosphate. U.S. Patent 3505012, 7 April 1970. [Google Scholar]
  48. Lii, K.-H.; Wang, S.-L. Na3M(OH)(HPO4)(PO4), M5Al, Ga: Two phosphates with a chain structure. J. Solid State Chem. 1997, 128, 21–26. [Google Scholar] [CrossRef]
  49. Dorozhkin, S.V.; Epple, M. Biological and medical significance of calcium phosphates. Angew. Chem. Int. Ed. 2002, 41, 3130–3146. [Google Scholar] [CrossRef]
  50. Lagno, F.; Demopoulos, G.P. The stability of hydrated Aluminium phosphate, AlPO4·1.5H2O. Environ. Technol. 2006, 27, 1217–1224. [Google Scholar] [CrossRef]
  51. Menon, M.; Parulkar, B.G.; Drach, G.W. Urinary Lithiasis, Etiology, Diagnosis, and Medical Management, Campbell’s Urology, 7th ed.; W.B. Saunders Co: London, UK, 1998; pp. 2661–2733. [Google Scholar]
  52. Xiong, Q.Y.; Zhou, Y.; Xiong, J.P. The study of a phosphate conversion coating on magnesium alloy AZ91D: II. Effects of components and their content in phosphating bath. Int. J. Electrochem. Sci. 2015, 10, 8454–8464. [Google Scholar]
  53. Dong, K.; Song, Y.; Shan, D.; Han, E.-H. Corrosion behavior of a self-sealing pore micro-arc oxidation film on AM60 magnesium alloy. Corros. Sci. 2015, 100, 275–283. [Google Scholar] [CrossRef]
  54. Yu, X.; Cao, C. Electrochemical study of the corrosion behavior of Ce sealing of anodized 2024 aluminum alloy. Thin Solid Films 2003, 423, 252–256. [Google Scholar] [CrossRef]
  55. Yu, X.; Yan, C.; Cao, C. Corrosion behavior of the rare earth sealing anodized coating on aluminum alloy LY12. J. Mater. Sci. Technol. 2002, 18, 471–474. [Google Scholar]
  56. Tao, Y.; Xiong, T.; Sun, C.; Kong, L.; Cui, X.; Li, T.; Song, G.L. Microstructure and corrosion performance of a cold sprayed aluminium coating on AZ91D magnesium alloy. Corros. Sci. 2010, 52, 3191–3197. [Google Scholar] [CrossRef]
  57. Ma, Y.; Li, N.; Li, D.; Zhang, M.; Huang, X. Characteristics and corrosion studies of vanadate conversion coating formed on Mg–14 wt.% Li–1 wt.% Al–0.1 wt.% Ce alloy. Appl. Surf. Sci. 2012, 261, 59–67. [Google Scholar] [CrossRef]
  58. Zheludkevich, M.L.; Serra, R.; Montemor, M.F.; Yasakau, K.A.; Salvado, I.M.M.; Ferreira, M.G.S. Nanostructured sol-gel coatings doped with cerium nitrate as pretreatments for AA2024-T3 Corrosion protection performance. Electrochim. Acta 2005, 51, 208–217. [Google Scholar] [CrossRef]
  59. Fontinha, I.R.; Salta, M.M.; Zheludkevich, M.L.; Ferreira, M.G.S. EIS study of amine cured epoxy-silica-zirconia sol-gel coatings for corrosion protection of the aluminium alloy EN AW 6063. Port. Electrochim. Acta 2013, 31, 307–319. [Google Scholar] [CrossRef]
  60. Zheludkevich, M.L.; Shchukin, D.G.; Yasakau, K.A.; Mo¨hwald, H.; Ferreira, M.G.S. Anticorrosion coatings with self-healing effect based on nanocontainers impregnated with corrosion inhibitor. Chem. Mater. 2007, 19, 402–411. [Google Scholar] [CrossRef]
  61. Kumar, C.S.; Rao, V.S.; Raja, V.S.; Sharma, A.K.; Mayanna, S.M. Corrosion behavior of solar reflector coatings on AA 2024T3—An electrochemical impedance spectroscopy study. Corros. Sci. 2002, 44, 387–393. [Google Scholar] [CrossRef]
  62. Hitzig, J.; Juttner, K.; Lorenz, W.J.; Paatsch, W. AC-impedance measurements on porous aluminium oxide films. Corros. Sci. 1984, 24, 945–952. [Google Scholar] [CrossRef]
  63. Mansfeld, F.; Kendig, M.W. Evaluation of anodized aluminum surfaces with electrochemical impedance spectroscopy. J. Electrochem. Soc. 1988, 135, 828–833. [Google Scholar] [CrossRef]
  64. Orazem, M.E.; Pébère, N.; Tribollet, B. Enhanced graphical representation of electrochemical impedance data. J. Electrochem. Soc. 2006, 153, B129–B136. [Google Scholar] [CrossRef]
  65. Brug, G.J.; van den Eeden, A.L.G.; Sluyters-Rehbach, M.; Sluyters, J.H. The analysis of electrode impedances complicated by the presence of a constant phase element. J. Electroanal. Chem. 1984, 176, 275–295. [Google Scholar] [CrossRef]
  66. Huang, V.M.-W.; Vivier, V.; Orazem, M.E.; Pébère, N.; Tribollet, B. The apparent constant-phase-element behavior of a disk electrode with faradaic reactions: A global and local impedance analysis. J. Electrochem. Soc. 2007, 154, C99–C107. [Google Scholar] [CrossRef] [Green Version]
  67. Hirschorn, B.; Orazem, M.E.; Tribollet, B.; Vivier, V.; Frateur, I.; Musiani, M. Determination of effective capacitance and film thickness from constant-phase-element parameters. Electrochim. Acta 2010, 55, 6218–6227. [Google Scholar] [CrossRef]
  68. Park, I.C.; Kim, S.J. Electrochemical characteristics in seawater for cold thermal spray-coated Al–Mg alloy layer. Acta Metall. Sin. (Engl. Lett.) 2016, 29, 727–734. [Google Scholar] [CrossRef] [Green Version]
  69. Dean, S.W. Electrochemical methods of corrosion testing. In Electrochemical Techniques for Corrosion; Baboian, R., Ed.; NACE: Houston, TX, USA, 1977. [Google Scholar]
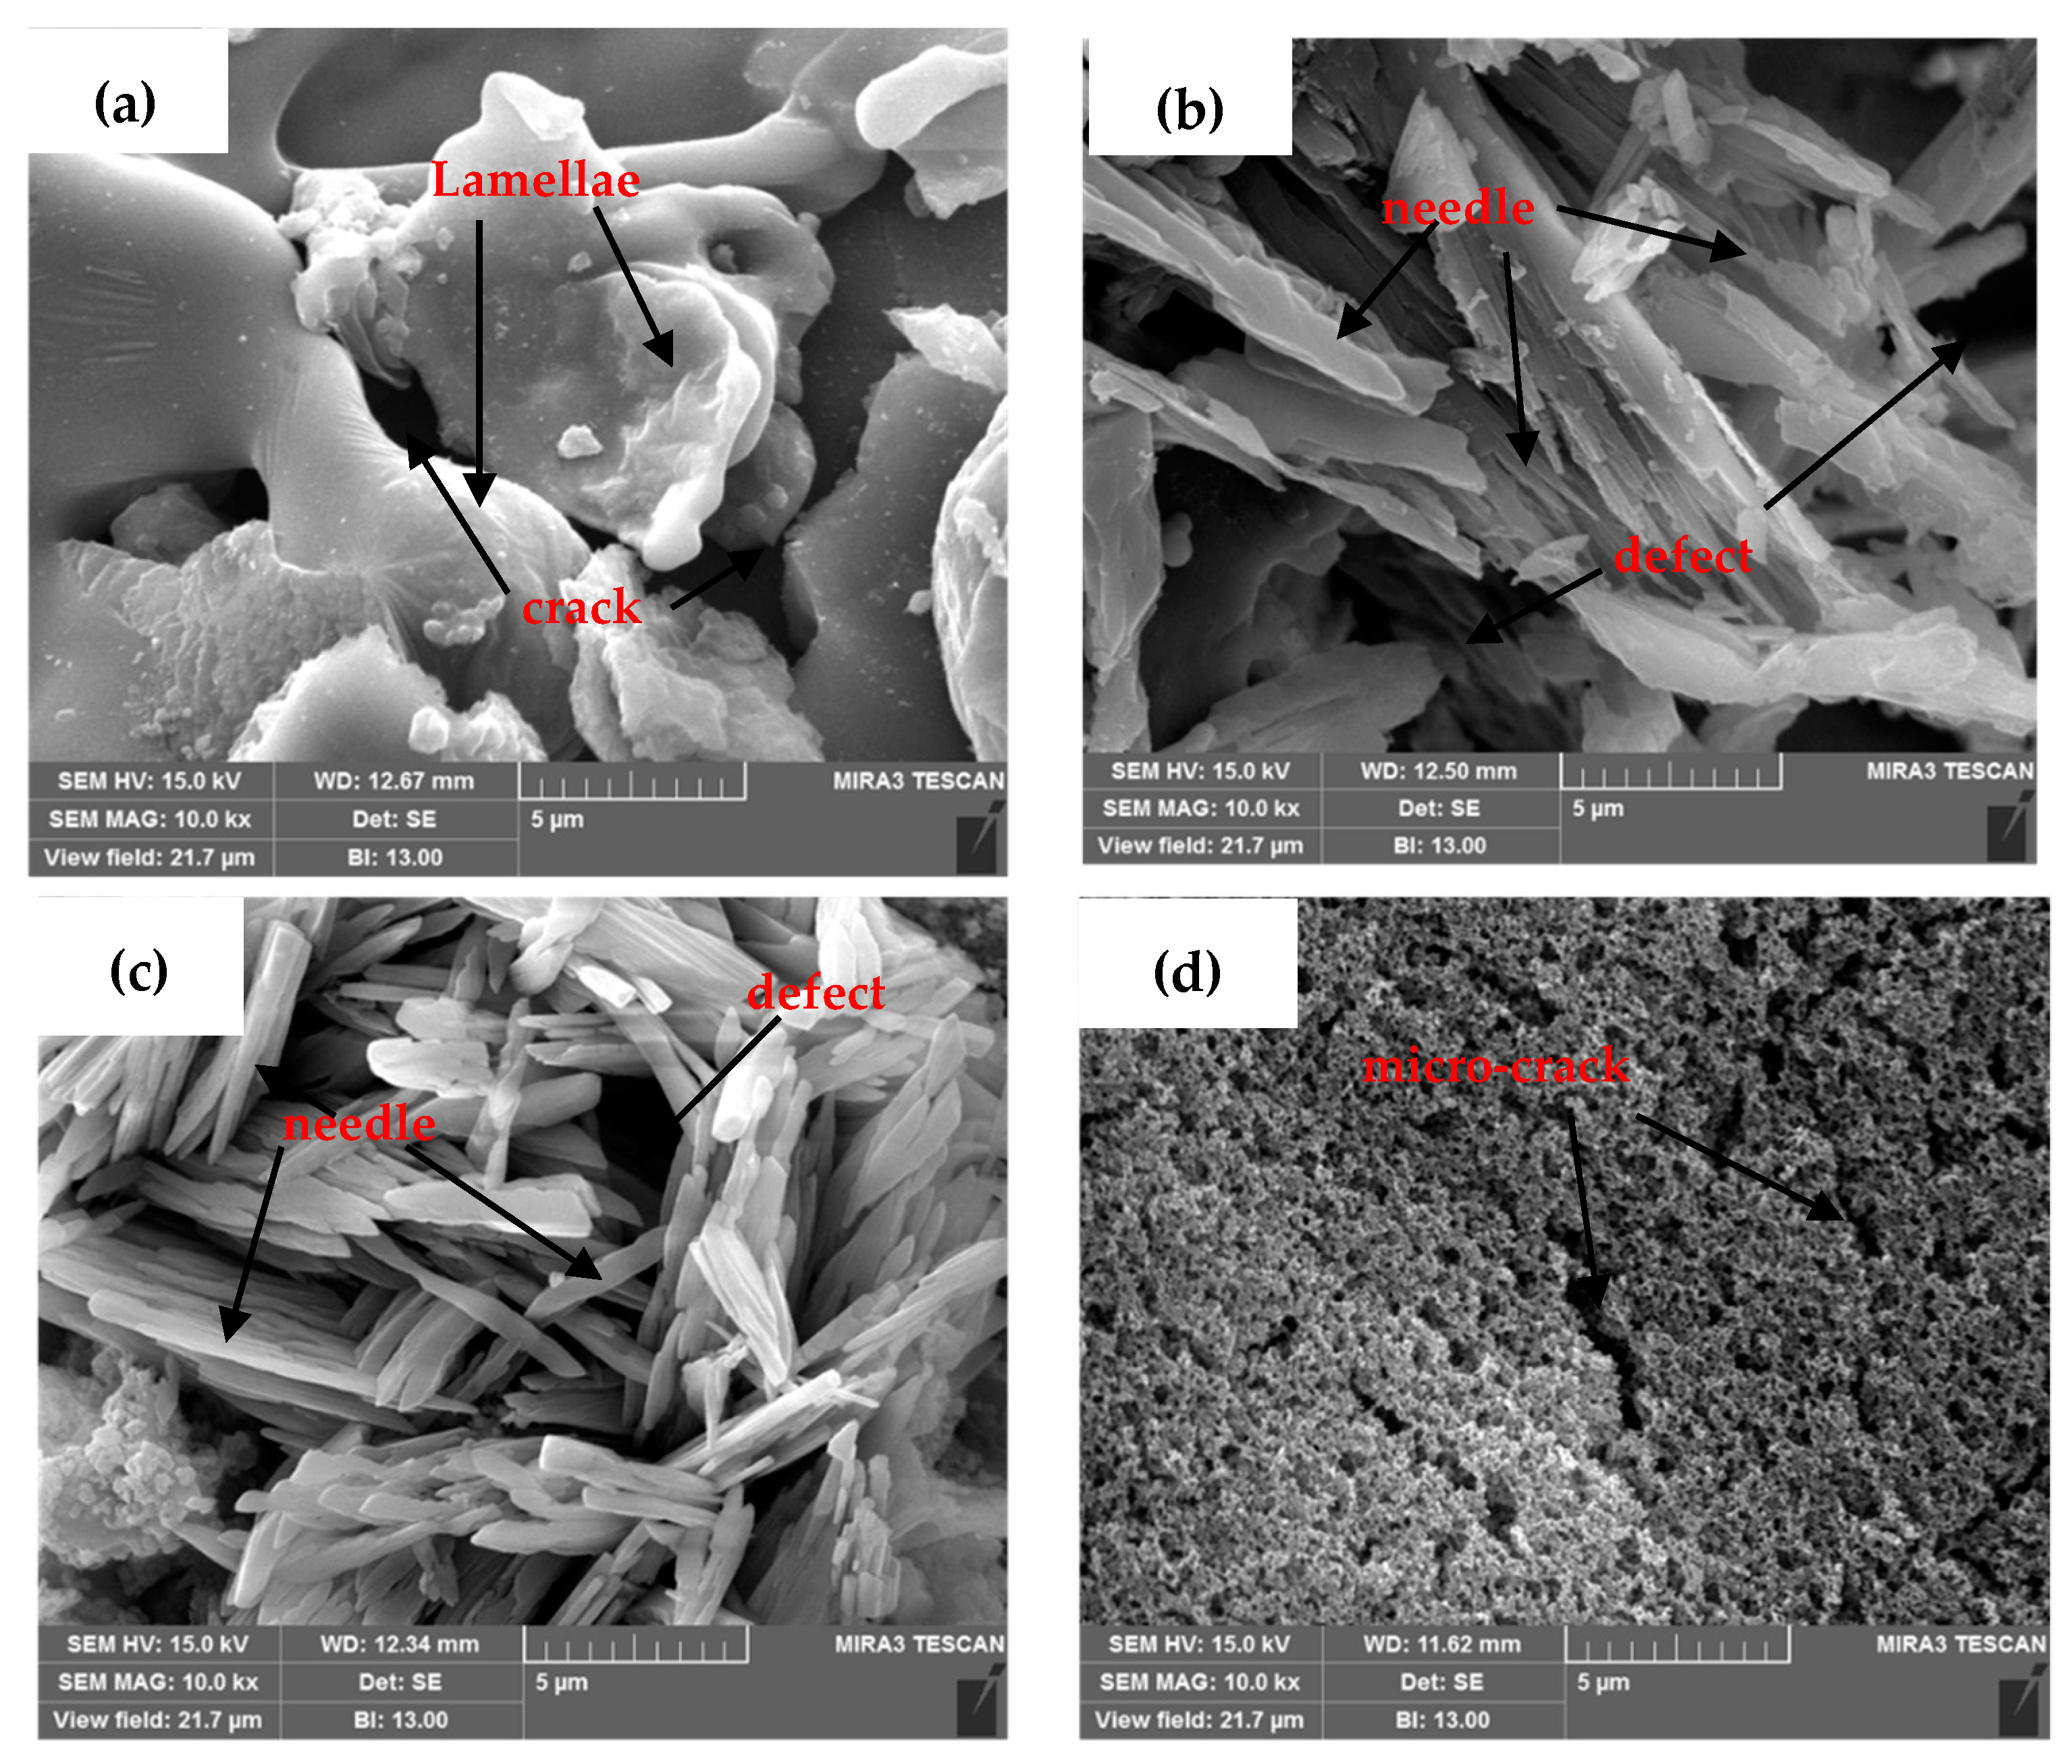
Figure 1. SEM of (a) as coated (AC), (b) 0.1 M NaH2PO4 + 0.1 M Ca(NO3)2 (SPCN1), (c) 0.5 M NaH2PO4 + 0.1 M Ca(NO3)2 (SPCN2), and (d) 1 M NaH2PO4 + 0.1 M Ca(NO3)2 (SPCN3).
Coatings 10 00033 g001
Figure 2. Cross sectional SEM of (a) AC, (b) SPCN1, (c) SPCN2, and (d) SPCN3.
Coatings 10 00033 g002
Figure 3. XRD of coating at (a) 2θ = 10°–90° and (b) 2θ = 10°–30°.
Coatings 10 00033 g003
Figure 4. Complex-plane impedance plots of coatings after (a) 1 h, (b) 11 days, (c) 41 days, and (d) 89 days of exposure in 3.5 wt.% NaCl solution.
Coatings 10 00033 g004
Figure 5. Modulus-frequency Bode plots of coatings after (a) 1 h, (b) 11 days, (c) 41 days, and (d) 89 days of exposure in 3.5 wt.% NaCl solution.
Coatings 10 00033 g005
Figure 6. Phase-frequency Bode plots of coating after (a) 1 h, (b) 11 days, (c) 41 days, and (d) 89 days of exposure in 3.5 wt.% NaCl solution.
Coatings 10 00033 g006
Figure 7. Electrical equivalent circuits (EEC) of (a) SPCN1 for 1 h and 11 days and SPCN2 for 1 h and (b) AC from 1 h to 89 days, SPCN1 for 41 and 89 days, SPCN2 from 11 to 89 days, and SPCN3 from 1 h to 89 days.
Coatings 10 00033 g007
Figure 8. Electrochemical parameters plot of Rc/t and Ceff with exposure periods in 3.5 wt.% NaCl solution.
Coatings 10 00033 g008
Figure 9. Potentiodynamic plot of coatings after 89 days of exposure in 3.5 wt.% NaCl solution.
Coatings 10 00033 g009
Figure 10. SEM of corrosion products formed onto (a) AC, (b) SPCN1, (c) SPCN2, and (d) SPCN3 surface after 89 days of exposure in 3.5 wt.% NaCl solution.
Coatings 10 00033 g010
Figure 11. XRD of corrosion products formed onto the coating surface after 89 days of exposure in 3.5 wt.% NaCl solution.
Coatings 10 00033 g011
Table 1. Energy-dispersive X-ray spectroscopy (EDS) analysis of coatings.
Sample IDElements (wt.%)
NONaPCaAl
AC2.20Rest
SPCN11.3514.380.998.847.71Rest
SPCN21.4420.771.5113.167.89Rest
SPCN31.3736.897.2625.807.95Rest
Table 2. Volume fraction (%) of phases formed onto the coating surface.
Sample IDVolume Fraction (%)
AlBRSAHP
AC10000
SPCN189.263.687.06
SPCN280.4111.148.45
SPCN371.9519.188.87
Table 3. Electrochemical parameters after fitting of electrochemical impedance spectroscopy (EIS) plots in appropriate EECs at different durations of exposure in 3.5 wt.% NaCl solution.
Sample IDTimeElectrochemical Parameters
Rs (Ω·cm2)CPEc/tRct (kΩ·cm2)CPEct
Qc/t (1 × 10⁻⁵) (Ω−1·cm−2·sn)nc/tQct (1 × 10⁻⁵) (Ω−1·cm−2·sn)nct
AC1 h23.1527.50.610.4951.90.65
SPCN129.0012.70.69
SPCN227.247.270.71
SPCN323.794.050.720.5339.80.67
AC11 days27.7912.50.680.5144.60.67
SPCN131.629.10.71
SPCN225.294.10.740.1154.70.65
SPCN316.0211.50.71.4837.60.68
AC41 days19.416.10.743.6821.10.77
SPCN124.437.10.734.2516.80.77
SPCN29.013.80.771.5023.60.69
SPCN321.9820.30.670.2539.00.60
AC89 days18.824.10.764.5415.50.78
SPCN120.655.20.740.7529.10.67
SPCN222.42.10.794.5716.50.79
SPCN329.821.90.650.2938.80.60
Table 4. Electrochemical parameters of coatings extracted after fitting of potentiodynamic plots in Tafel regions exposed to 3.5% NaCl solution.
Sample IDElectrochemical Parameters
Ecorr (V) vs. Ag/AgClIcorr (µA·cm−2)CR (µm·year−1)
AC−0.9573.9943.49
SPCN1−1.0034.8552.87
SPCN2−1.0052.7930.41
SPCN3−0.72219.13208.52
Table 5. EDS analysis of coatings after 89 days of exposure in 3.5 wt.% NaCl solution.
Sample IDElements (wt.%)
NONaPCaClAl
AC48.851.507.95Rest
SPCN11.2946.891.933.250.1311.56Rest
SPCN21.3142.692.737.611.809.76Rest
SPCN31.2447.141.400.950.2413.65Rest
Table 6. Volume fraction (%) of phases present on corrosion products after 89 days of exposure in 3.5 wt.% NaCl solution.
Sample IDVolume Fraction (%)
AlNaClα-Al(OH)3
AC28.0632.2839.66
SPCN148.1223.4828.40
SPCN230.2525.8043.95
SPCN335.2937.0327.68