Article

Preparation and Photocatalytic Property of Ag Modified Titanium Dioxide Exposed High Energy Crystal Plane (001)

1
College of Chemistry and Chemical Engineering, Neijiang Normal University, Neijiang 641112, China
2
Key Laboratory of Fruit Waste Treatment and Resource Recycling of the Sichuan Provincial College, Neijiang 641112, China
*
Author to whom correspondence should be addressed.
Coatings 2020, 10(1), 27; https://doi.org/10.3390/coatings10010027
Submission received: 12 December 2019 / Revised: 25 December 2019 / Accepted: 27 December 2019 / Published: 1 January 2020
(This article belongs to the Special Issue Nanolaminate Multilayer Coatings)

Abstract

:
TiO2 exposed high energy crystal plane (001) was prepared by the sol-gel process using butyl titanate as the titanium source and hydrofluoric acid as the surface control agent. Ag-TiO2 was prepared by depositing Ag on the crystal plane of TiO2 (101) with a metal halide lamp. The surface morphology, interplanar spacing, crystal phase composition, ultraviolet absorption band, element composition, and valence state of the samples were characterized by using field emission scanning electron microscopy (FESEM), transmission electron microscope (TEM), X-ray diffraction (XRD), ultraviolet-visible absorption spectrum (UV-Vis-Abs), and X-ray photoelectron spectroscopy (XPS), respectively. The formation mechanism of high energy crystal plane (001) was discussed, and the photocatalytic activities were evaluated by following degradation of methyl orange. The results show that TiO2 exposed the (001) crystal plane with a ratio of 41.8%, and Ag can be uniformly deposited on the crystal plane of TiO2 (101) by means of metal halide lamp deposition. Under the same conditions, the degradation rate of methyl orange by deposited Ag-TiO2 reaches as much as 93.63% after 60 min using the metal halide lamp (300 W) as an illuminant, 81.89% by non-deposited samples and 75.20% by nano-TiO2, causing a certain blue shift in the light absorption band edge of TiO2. Ag-TiO2 has the best photocatalytic performance at a pH value of 2.

1. Introduction

The main pollutants in water pollution are inorganic and organic pollutants. At present, in terms of the treatment for organic pollutants in sewage, the main methods include electrocatalytic technology [1], electrochemical anodic oxidation [2], surface adsorption [3], and photocatalysis [4]. Among them, photocatalysis attracted more and more attention due to its excellent degradation performance for organic pollutants. Semiconductor-type metal oxides or sulfides are the main photocatalysts, such as TiO2, ZnO, CdS, CuS, etc. [5,6,7,8]. TiO2 has become a hot spot of photocatalytic catalysts due to its advantage of non-toxicity, stable chemical properties, high photocatalytic activity, and low cost [9,10,11,12,13]. TiO2 can be stimulated by ultraviolet irradiation, leading to the formation of highly active electrons (e) on the conduction band and positive charged holes (h+), so that highly active electron-hole pairs are formed on the surface of TiO2. They can react with water molecules and the dissolved oxygen which adsorbed on the catalyst surface to generate superoxide radicals and hydroxyl radicals, while superoxide radicals and hydroxyl radicals have strong oxidation and high activity. Water and CO2 can be produced by reacting with organic pollutants, which can degrade most organic compounds [14]. In addition, superoxide radicals and hydroxyl radicals also have the ability to sterilize, purify the air, and prepare cleaning materials [15,16].
The crystalline forms of TiO2 mainly include anatase, slate, and rutile. Among them, photocatalytic performance of anatase-type is the most excellent [17,18]. However, the forbidden band width of anatase-type TiO2 is about 3.2 eV, which can only absorb ultraviolet light with a wavelength less than 387 nm, resulting in its utilization rate of sunlight below 5%. However, photogenerated electrons and holes produced by TiO2 are also easily recombined, which is not conducive to photocatalytic performance. In order to achieve the aim of prolonging the lifetime of photogenerated electron holes, it is necessary to enhance their surface catalytic activity and boost the absorption of sunlight. A large number of modification methods were reported, such as exposure to specific crystal surfaces, heat treatment, semiconductor composite, metal and non-metal ion doping, precious metal deposition, and so on [16,19,20,21,22,23,24]. The modification of TiO2 by exposing specific crystal surfaces has been a hot topic in recent years [19,25,26,27,28,29,30,31]. For the anatase phase TiO2, its (001) crystal surface belongs to the high energy crystal surface compared with the stable (101). The (001) crystal surface has high energy and good reactivity. In the photocatalytic reactions, photogenerated electrons tend to transfer to the (101) crystal plane with lower energy, and thus accumulating on (101), while photogenerated holes tend to accumulate on (001) crystal plane with a high energy. This feature can effectively promote the separation of photogenerated electron hole pairs, thereby improving their photocatalytic performance [32]. Secondly, research has shown that precious metal deposition also has the advantage of promoting the separation of photogenerated electron holes. Noble metal deposition modification is achieved by changing the electronic distribution and the surface properties of TiO2, so as to reduce the forbidden band width of TiO2, increase its light-sensitive wavelength, and improve the utilization rate of sunlight [22]. By means of impregnation reduction or photoreduction deposition [33,34,35], an appropriate amount of precious metals can be deposited on the surface of TiO2, which can not only broaden the spectral response range of TiO2, produce ionic resonance effect (SPR) [36], inhibit the recombination of photogenerated electrons and holes, and improve the light response of TiO2 to visible light, but also localize the generated electrons and holes by light on precious metals and TiO2 respectively. When the electrons are enriched on noble metals, and the electron density on the surface of TiO2 decreases, which further promotes the separation of electron-hole pairs, thus enhancing the catalytic activity. In addition, a Schottky barrier is formed at the interface when highly active Ag is combined with TiO2, and photogenerated electrons are transferred rapidly across the interface to Ag, resulting in the effective separation of carriers. The above-mentioned can effectively improve the photocatalytic efficiency of TiO2 [33,37].
In this study, exposed (001) crystal plane TiO2 was prepared by the sol-gel process using butyl titanate as the titanium source and hydrofluoric acid as the surface control agent, followed by depositing Ag on the crystal plane of TiO2 (101) with the metal halide lamp. The photocatalytic properties of the samples were studied, which provided a reference for sewage treatment.

2. Experimental

2.1. Preparation of High Energy Crystal Surface TiO2

Twenty-five mL butyl titanate was poured into a plastic beaker, 5 mL hydrofluoric acid was added under slow magnetic stirring, and the mixture turned into a white semi-solid. Then, 25 mL of absolute ethanol was added, followed by stirring for 10 min, and the semi-solid became opalescent suspension. After that, the sample was dried at 100 °C, calcined in a muffle furnace at 550 °C for 2 h with a heating rate of 1 °C/min, followed by cooling down to room temperature to obtain the high energy crystalline surface TiO2 in the furnace [38].

2.2. Preparation of Ag-TiO2

The high energy crystal plane TiO2 prepared in Section 2.1 (0.5 g) was dispersed in AgNO3 solution placed in a quartz tube (30 mL), in which the mass ratio of Ag to TiO2 was 1%. Ag-TiO2 was obtained by irradiating the system for 5 min with the metal halide lamp (300 W), centrifuging, washing with distilled water for three times, and drying at 80 °C.

2.3. Evaluation of Photocatalytic Performance

Methyl orange solution (30 mL, 20 mg/L) was put into a quartz tube, and 0.02 g photocatalyst was added. Then, the quartz tube was placed in the photochemical reactor. The mixture was first kept in the dark for 30 min, and then centrifuged for 10 min. The absorbance was measured as the initial absorbency (A0). After that, the photochemical reactor was turned on and the power of the metal halide lamp was adjusted (wavelength range: 280–780 nm) to 300 W for photocatalytic degradation. The absorbance (At) was measured at regular intervals, and the degradation rate was calculated by Formula (1). The photocatalytic performance of the sample was reflected by the degradation rate. The methyl orange solution was used to simulate the organic substances in the sewage, and the photocatalytic performance of the sample was evaluated using a photochemical reactor with an eight position magnetic stirring reactor (BL-GHX-V, Shanghai Bilon Instrument Co., Ltd., Shanghai, China). In the photochemical reactor, the metal halide lamp was placed in a quartz cold well in the middle, and the power of the lamp could be adjusted according to the need. The absorbance of methyl orange solution was determined by an ultraviolet-visible spectrophotometer (Model 752, Shanghai Xinmao Instrument Co., Ltd., Shanghai, China). The nano-TiO2 we used was purchased from Shanghai Yuanye Biotechnology Co., Ltd., Shanghai, China. It is a comparative commercial TiO2:
X = (A0At)/A0 × 100%

2.4. Characterization

The surface morphology of the samples was characterized by field emission scanning electron microscopy (SIGMA 300, Carl Zeiss Co., Ltd., Jena, Germany). Morphology and interplanar spacing of samples were characterized by transmission electron microscope (TEM 2010, Japan Electronic Optical Laboratory Co., Ltd., Tokyo, Japan). The crystal phase composition of the samples was investigated with X-ray diffraction (DX−2700, Dandong Haoyuan Instrument Co., Ltd., Liaoning, China) using Cu Kα radiation at a scanning rate of 0.05° s−1 and a working voltage/current of 40 kV/40 mA. Ultraviolet absorption band of the samples was analyzed by an ultraviolet-visible spectrophotometer (UV-Vis-Abs, UV2700, Shimadzu Corporation, Kyoto, Japan). The elemental composition and valence state of the sample were characterized by using an X-ray photoelectron spectroscopy (XPS, Escalab 250 Xi, Thermo Fisher Scientific, Waltham, MA, USA).

3. Results and Discussion

3.1. FESEM Analysis

Figure 1 is a field emission scanning electron microscope image of pure TiO2 and Ag-TiO2. It can be seen from Figure 1 that the morphology of the prepared TiO2 is uniform and the particle size is nanometer, showing regular truncated octahedral. The results show that high energy crystalline surface titanium dioxide particles have been prepared successfully. According to the literature [7], the atomic exposure of the upper and lower surfaces of the crystal is equivalent to that of the (001) surface of anatase, and the atomic exposure of the eight crystal surfaces on the side is equivalent to that of the (101) surface of anatase. There is an obvious agglomeration phenomenon due to the small particle size, the large specific surface area, and the high surface energy. Both the pure TiO2 and Ag-TiO2 grains have smooth (001) crystal planes, and there are almost no particles on the (001) surface. However, many fine particles exist on the side of the (101) crystal plane. Relatively speaking, the fine particles of Ag-TiO2 are more than that of pure TiO2, which may be attributed to Ag deposition.
According to the later XPS analysis, Ag was deposited successfully on the surface of TiO2. The (001) crystal plane of anatase TiO2 is more favorable for the oxidation reaction, and the (101) crystal plane of the anatase phase TiO2 is more conducive to the reduction reaction, which is consistent with the work by Wang et al. [23]. Careful observation of the crystal plane of TiO2 (101) shows that the particles are aggregated from fine grains, which makes the (101) crystal surface rough and enlarges the specific surface area, which contributes to the improved photocatalytic performance.

3.2. TEM Analysis

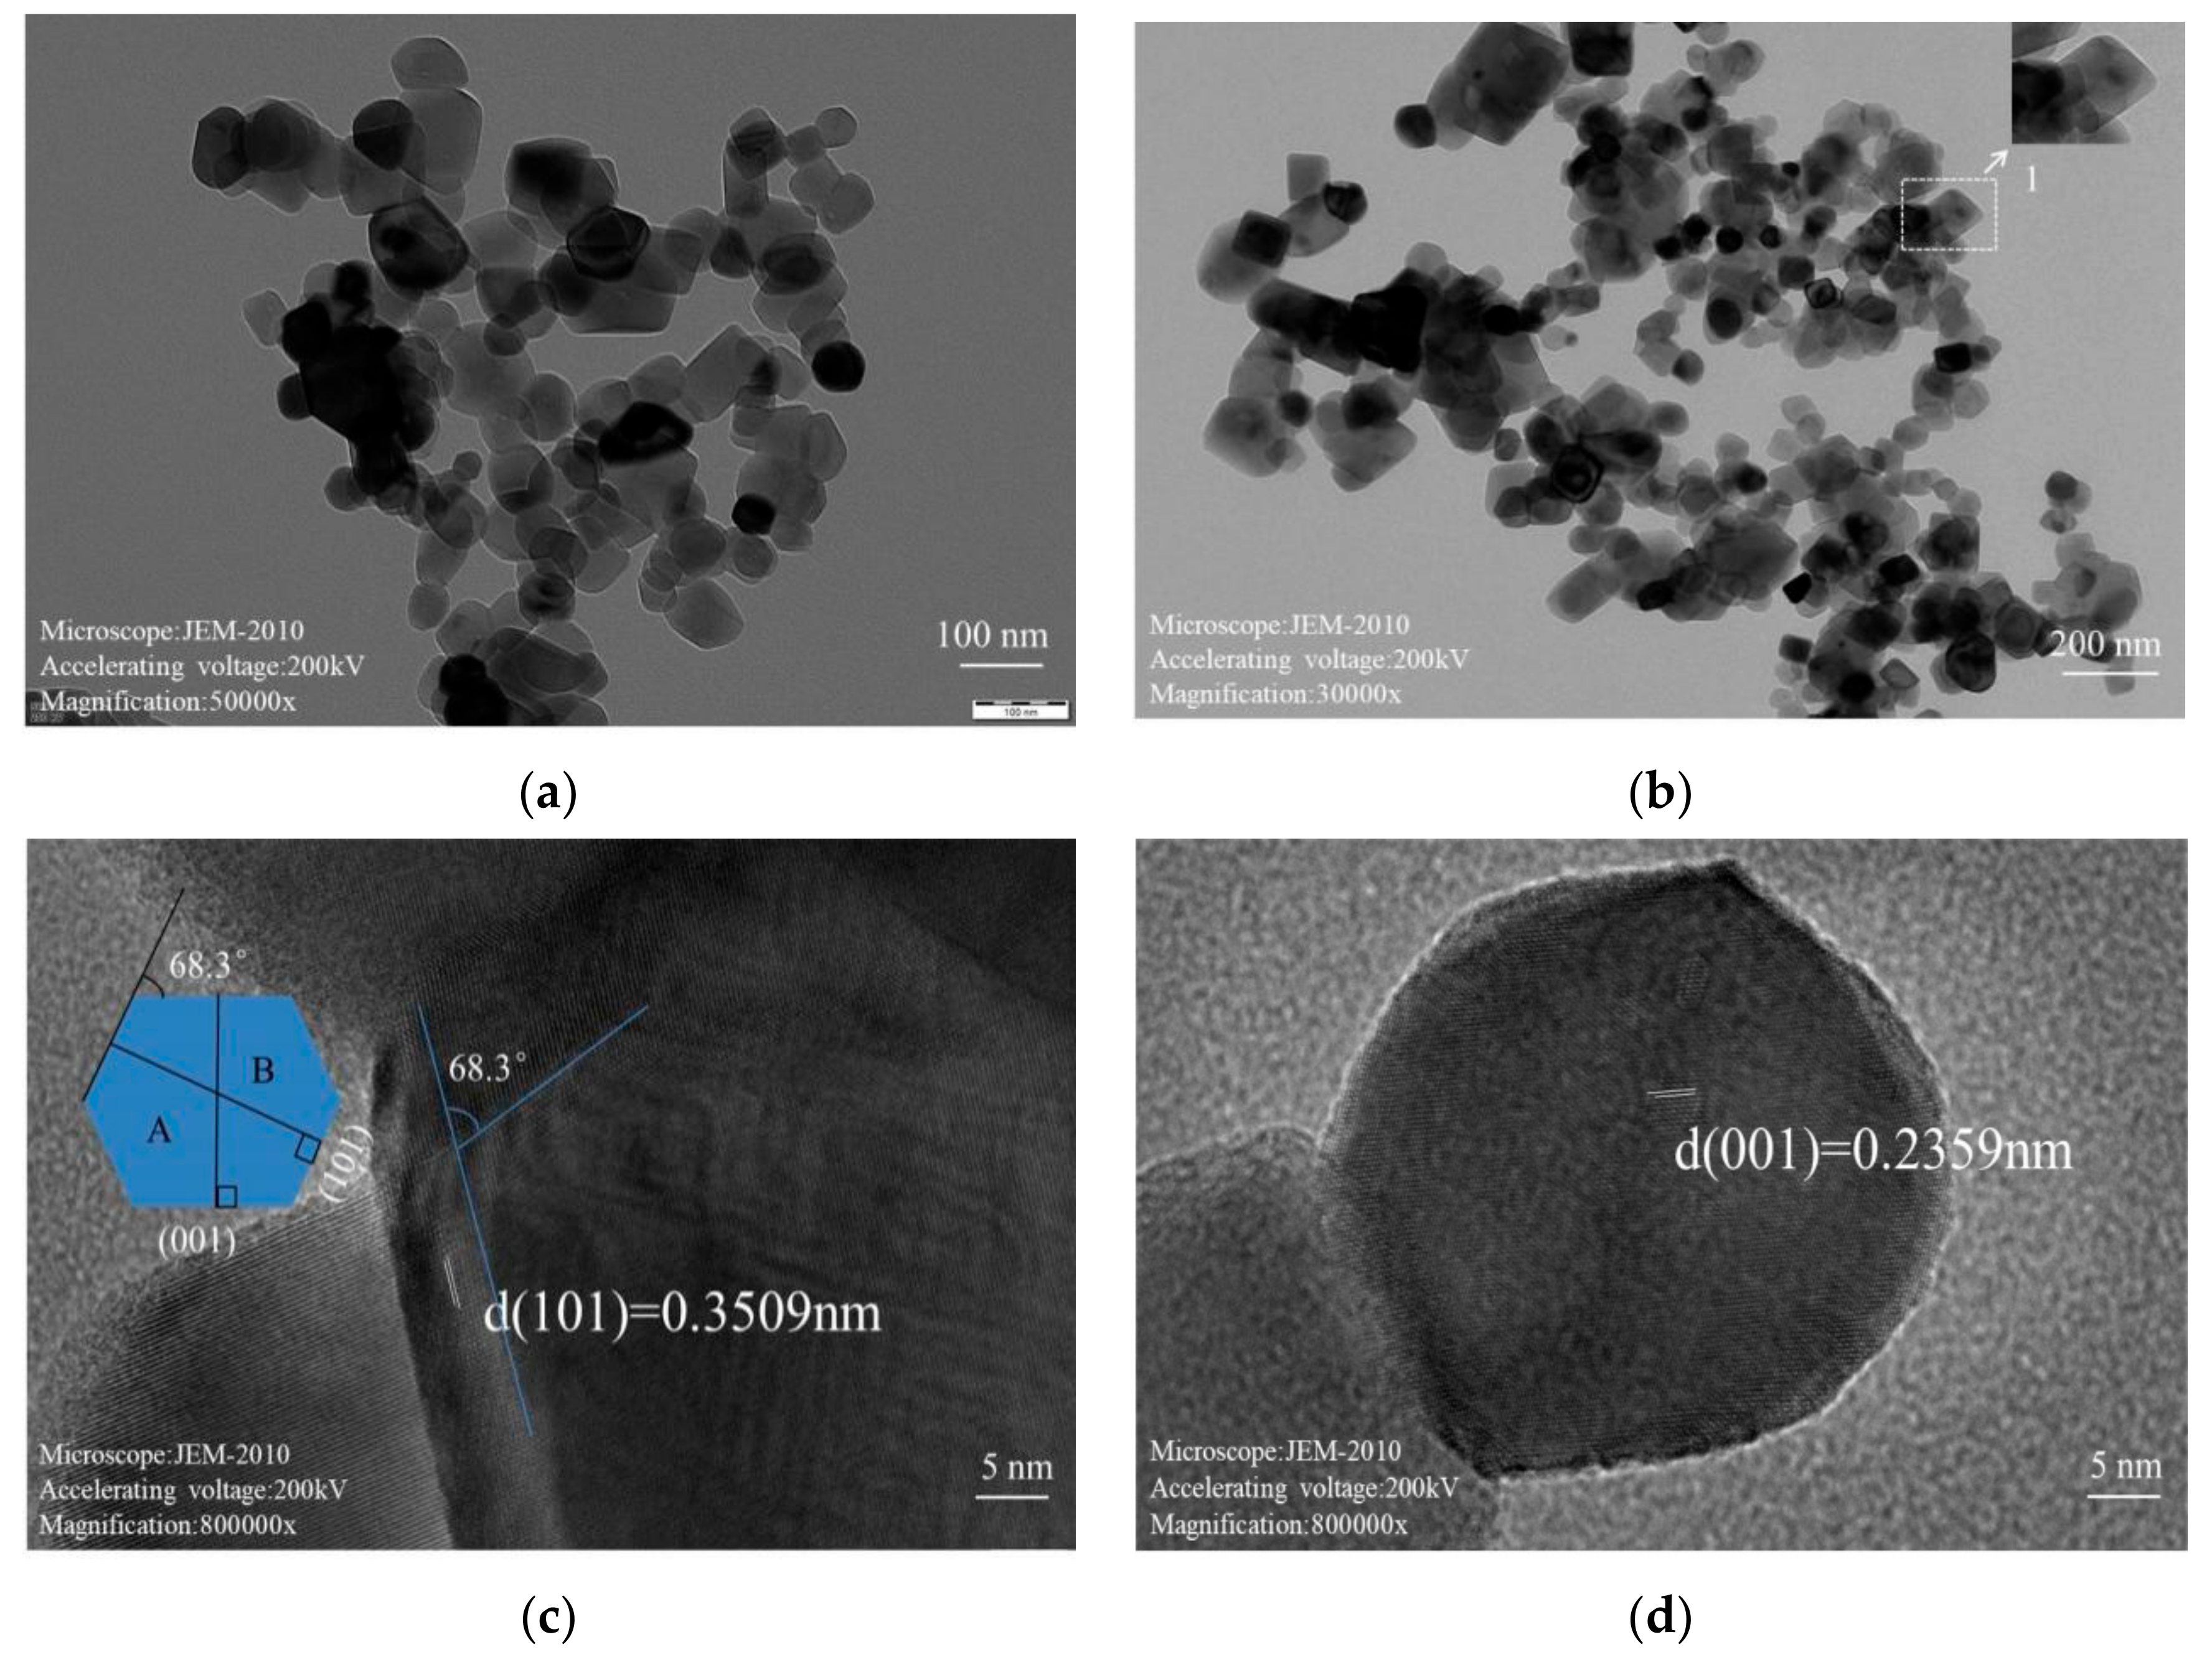
Figure 2 gives TEM images of the high energy crystal plane TiO2. From Figure 2a,b, it can be seen that the morphology of high energy crystalline surface titanium dioxide particles is uniform and regular truncated octahedral morphology, and the particle size is mostly in the nanometer level (50–100 nm). Figure 2c shows the apparent lattice fringes on the surface of the particles, in which the clearer fringes are 0.3509 nm, and the theoretical value of the interplanar spacing of titanium dioxide (101) is close to 0.3520 nm, indicating that this surface is the side (101) of the high energy crystal plane. Figure 2d demonstrates that the interplanar spacing of the lattice fringes on the surface of the particles is 0.2359 nm, and the (001) interplanar spacing of Figure 2d is consistent with that of the (001) measured in reference [39], which indicates that this surface is the high energy crystal plane (001). It is proved that high energy crystal surface titanium dioxide exposed (001) has been successfully prepared. From Figure 2c, it can be seen that the supplementary angle of (001) and (101) crystal faces of pure TiO2 is 68.3°, which is consistent with the theoretical model. It can be further explained by the successful preparation of high energy crystal face titanium dioxide [40]. Besides, it can also be found that the particle size of the sample observed by TEM is basically the same as that by FESEM, with an average value of ~80 nm. The formation mechanism can be described as the following. Both H- and O-terminated anatase TiO2 surfaces present high surface energies (γ), high values of γ are mainly attributed to the high bonding energies of H–H (436.0 kJ/mol) and O–O (498.4 kJ/mol), which restrict the formation of anatase TiO2 (001) crystal plane. The combination of Ti and F might provide an effective means for stabilizing the surfaces. Under clean conditions, the balance between the O–O repulsions and the attractive Ti–O–F interactions is broken, owing to the cleavage of surfaces, causing unsaturated O and Ti atoms to move outward. However, with the formation of Ti–F bonds, surface O and Ti atoms move inward and outward significantly, owing to the strong repulsive and attractive interactions of O–F and Ti–F bonds respectively. This is the interaction between the strong repulsion of the O–F bond and the attraction of the Ti–F bond, and the Ti 2p3/2 and O 1s electrons can both interact strongly with the F 2p electron. As a result, a new balance can be established between O–O/F–O repulsions and Ti–O/Ti–F attractions, which stabilizes Ti and O atoms on the surfaces [7]. The lattice constants of anatase are known as that (I41/amd, Z = 4) a = 0.37852 nm, c = 0.95139 nm, the angles of (101) and (−101) are 44°, and the angles between (001) and (101) planes are 112° [41]. The sample is considered to be an ideal decagon, the upper and lower (001) crystal planes are regarded as a square, and the sides are treated as eight identical Equilateral trapeziums. The exposures of the (001) high energy crystal plane are calculated on the basis of Figure 2b. It can be found that the size of the upper and lower edges of the trapezoid is about 78.43 and 98.04 nm respectively, that is, the exposure ratio of the (001) crystal plane is 41.8%.

3.3. XRD Analysis

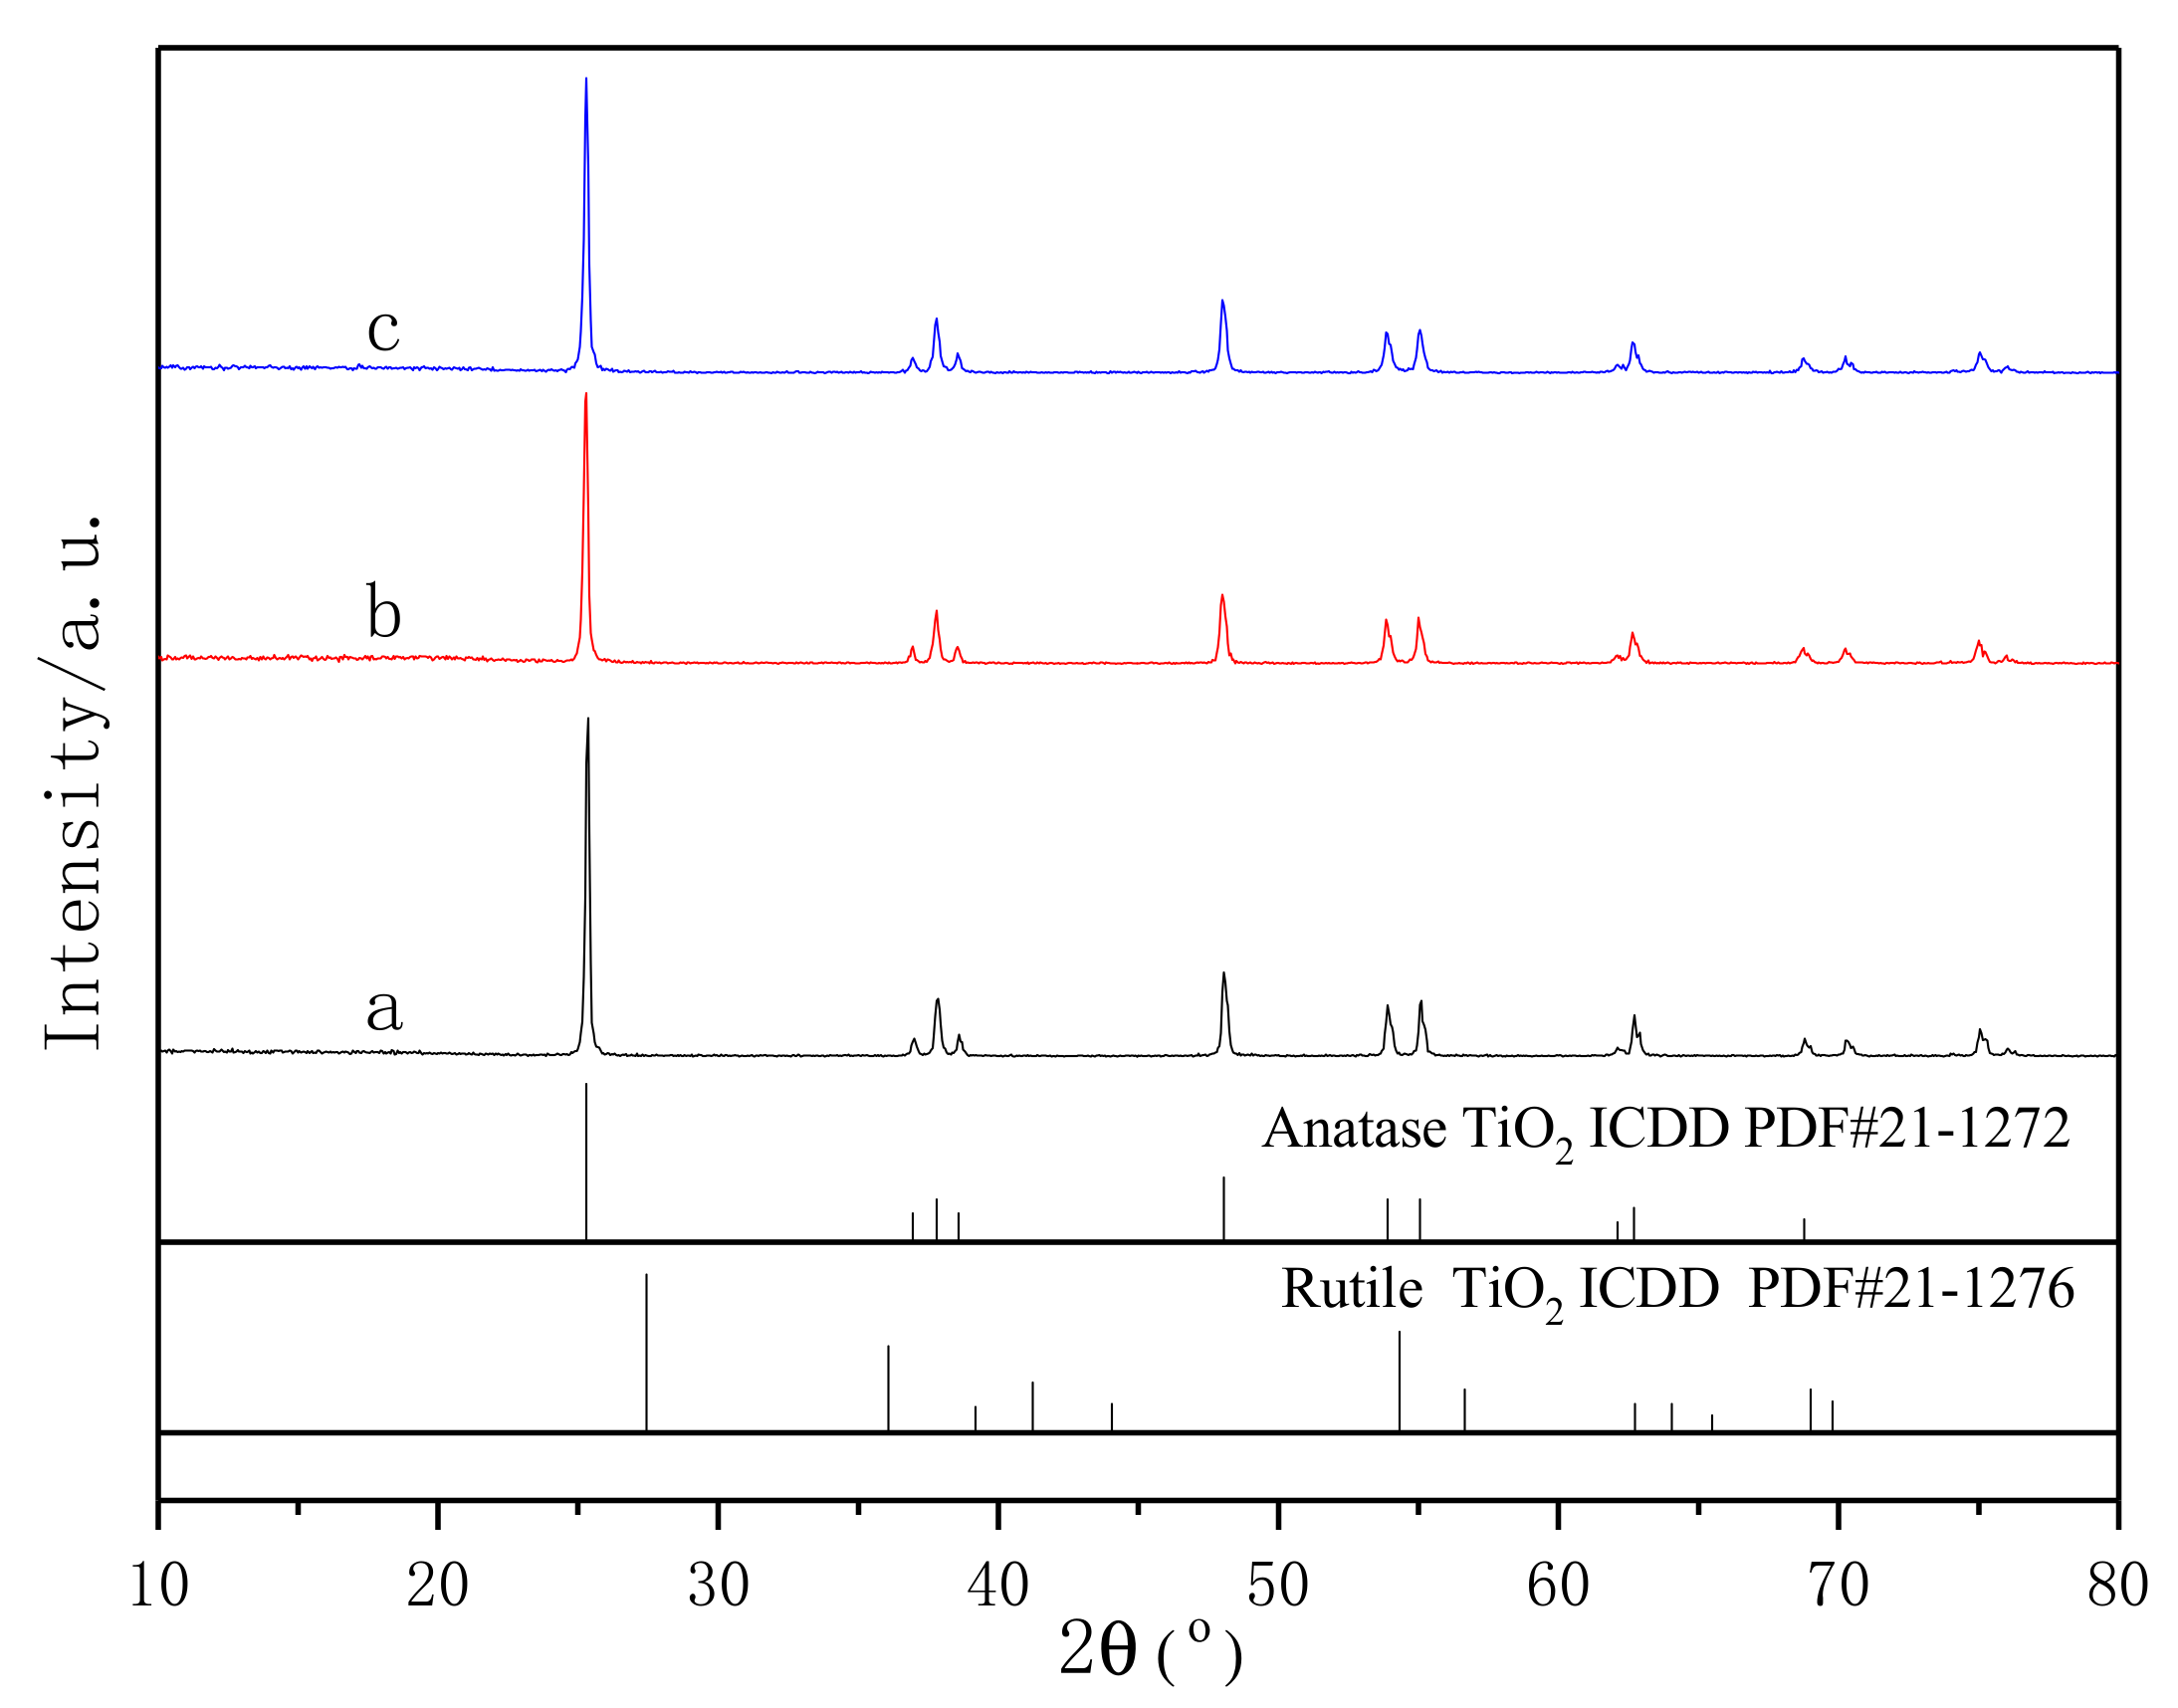
It is known that the diffraction angles 2θ = 25.3° and 2θ = 27.5° are the characteristic peaks of anatase TiO2 (101) and rutile TiO2 (110), respectively. Figure 3 gives XRD patterns of three different types of TiO2. As is shown in Figure 3, nano-TiO2, the high energy crystal plane TiO2, and the high energy crystal plane Ag-TiO2 are only exist in anatase phase, and the crystallinity of the three samples is high. The diffraction peaks of anatase of the three samples are obvious. There is no diffraction peak of Ag and silver compounds in curve c, owing to the little and even deposition of Ag on the surface of TiO2. According to the basic theory of XRD, the intensity and sharpness of the diffraction peak are related to the crystallinity and grain size of TiO2. The grain size of (101) surface can be calculated by the Scherrer formula (Formula (2)), and the results are revealed in Table 1. Simultaneously, according to the XRD pattern and data in Table 1, the peak height of curve c is 1373 and that of curve b is 1267 at 2θ = 25.3°, and the grain size of Ag-TiO2 is smaller than that of TiO2. It is indicated that the deposition of Ag on the surface of TiO2 increases the crystallinity but decreases the grain size. Table 1 shows that the grain size of the sample is nano-TiO2 > high energy crystal plane TiO2 > high energy crystal plane Ag-TiO2. The larger the grain size, the less favorable the photocatalytic activity of TiO2. It can be predicted that nano-TiO2 has the worst photocatalytic performance:
D = Kλ/(βcosθ) (nm)

3.4. BET Analysis

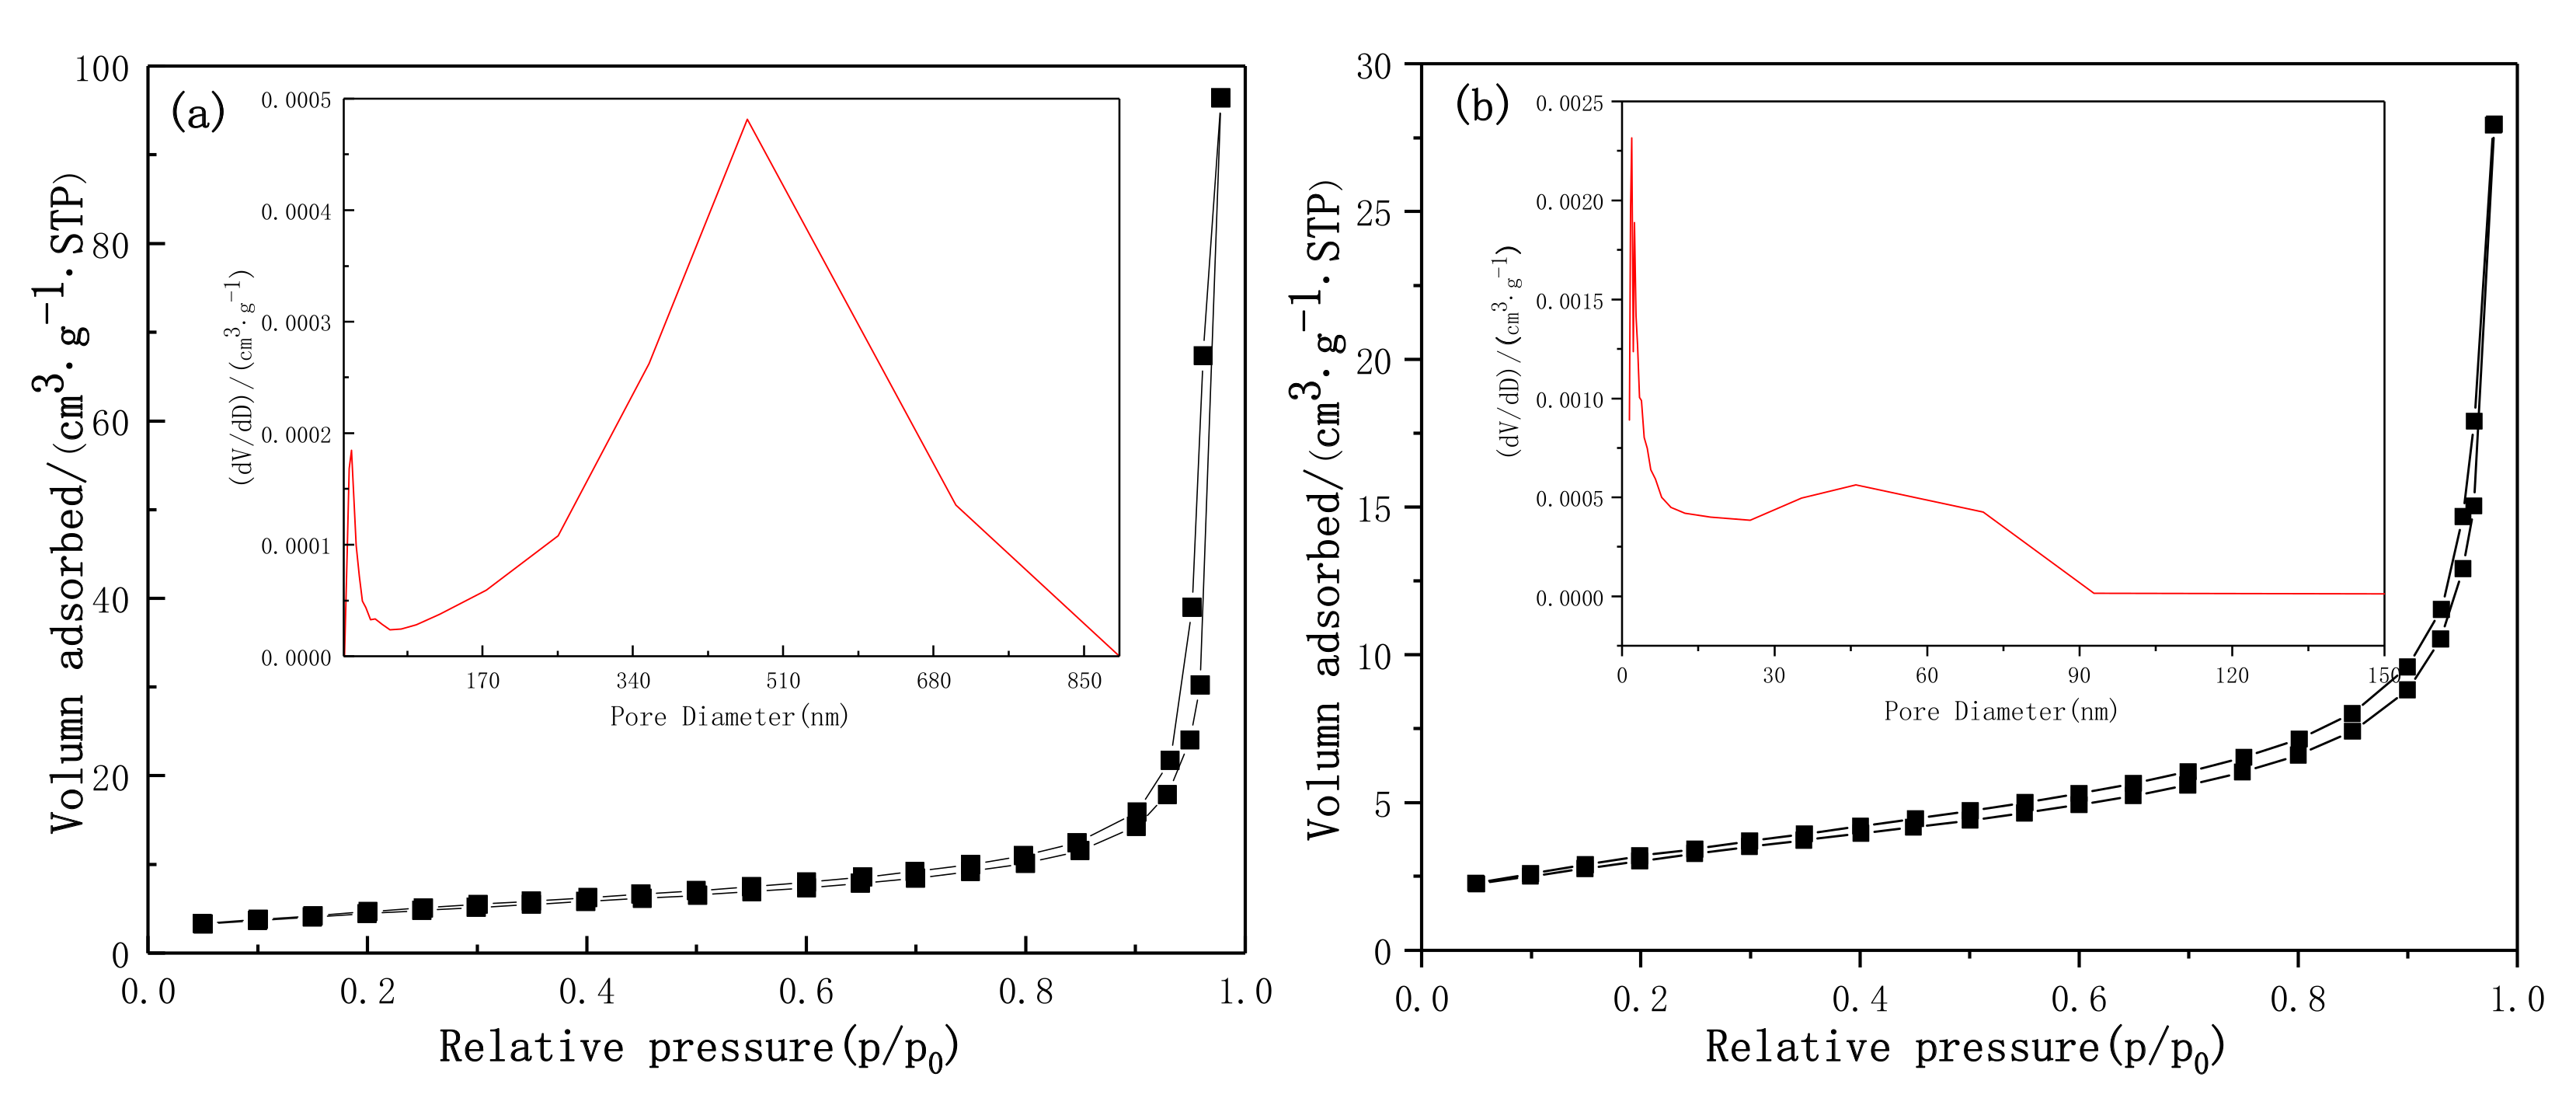
Figure 4 shows the N2 adsorption–desorption isotherm curve and pore size distribution of pure TiO2 and Ag-TiO2 samples. Figure 4 shows that the N2 adsorption-desorption isotherm curves of the two kinds of TiO2 belong to type IV H3 type, and both have hysteresis rings. The hysteresia of pure TiO2 occurred at a place where the relative pressure was 0.35, while that of Ag-TiO2 occurred at a place where the relative pressure was 0.20, indicating that the pore structure of the two samples was irregular, which might be the flat slit structure, crack and wedge structure. The two samples showed no adsorption saturation in the high relative pressure region [42,43].
It can be seen from the pore size distribution diagram that the pore size distribution of Figure 4a is uneven, mainly in the form of mesopores and macropores. The pore size is mainly distributed in the range of 17–27 nm and 300–700 nm, with the most holes at 469.386 nm. It can be seen in the Figure 4b that the pore size distribution is relatively uniform, mainly in the form of micropores and mesopores. The pore size is mainly distributed in the range of 1.21–4.30 nm, and the most pores are at 1.936 nm. The content of Ag-TiO2 in pores less than 80 nm was significantly higher than that of pure TiO2, while the content of Ag-TiO2 in pores more than 90 nm was basically absent. This indicates that Ag deposition can promote the formation of titanium dioxide micropores and mesoporous, and inhibit the formation of macropores. We believe that the deposition of Ag may block TiO2 so that the macropores are reduced, while the increase of micropores and mesoporous particles is caused by the non-seamless accumulation of Ag particles on the surface of titanium dioxide, and the gap formed by the accumulation is exactly of micropores and mesoporous levels. It can be seen from Table 2 that the deposition of Ag reduces the specific surface area of titanium dioxide. This is because although the content of Ag-TiO2 in pores less than 80 nm is significantly higher than that of pure TiO2, the pore range of pure TiO2 is 10 times that of Ag-TiO2, thus making the specific surface area of pure TiO2 larger than that of Ag-TiO2.

3.5. UV-Vis-Abs Analysis

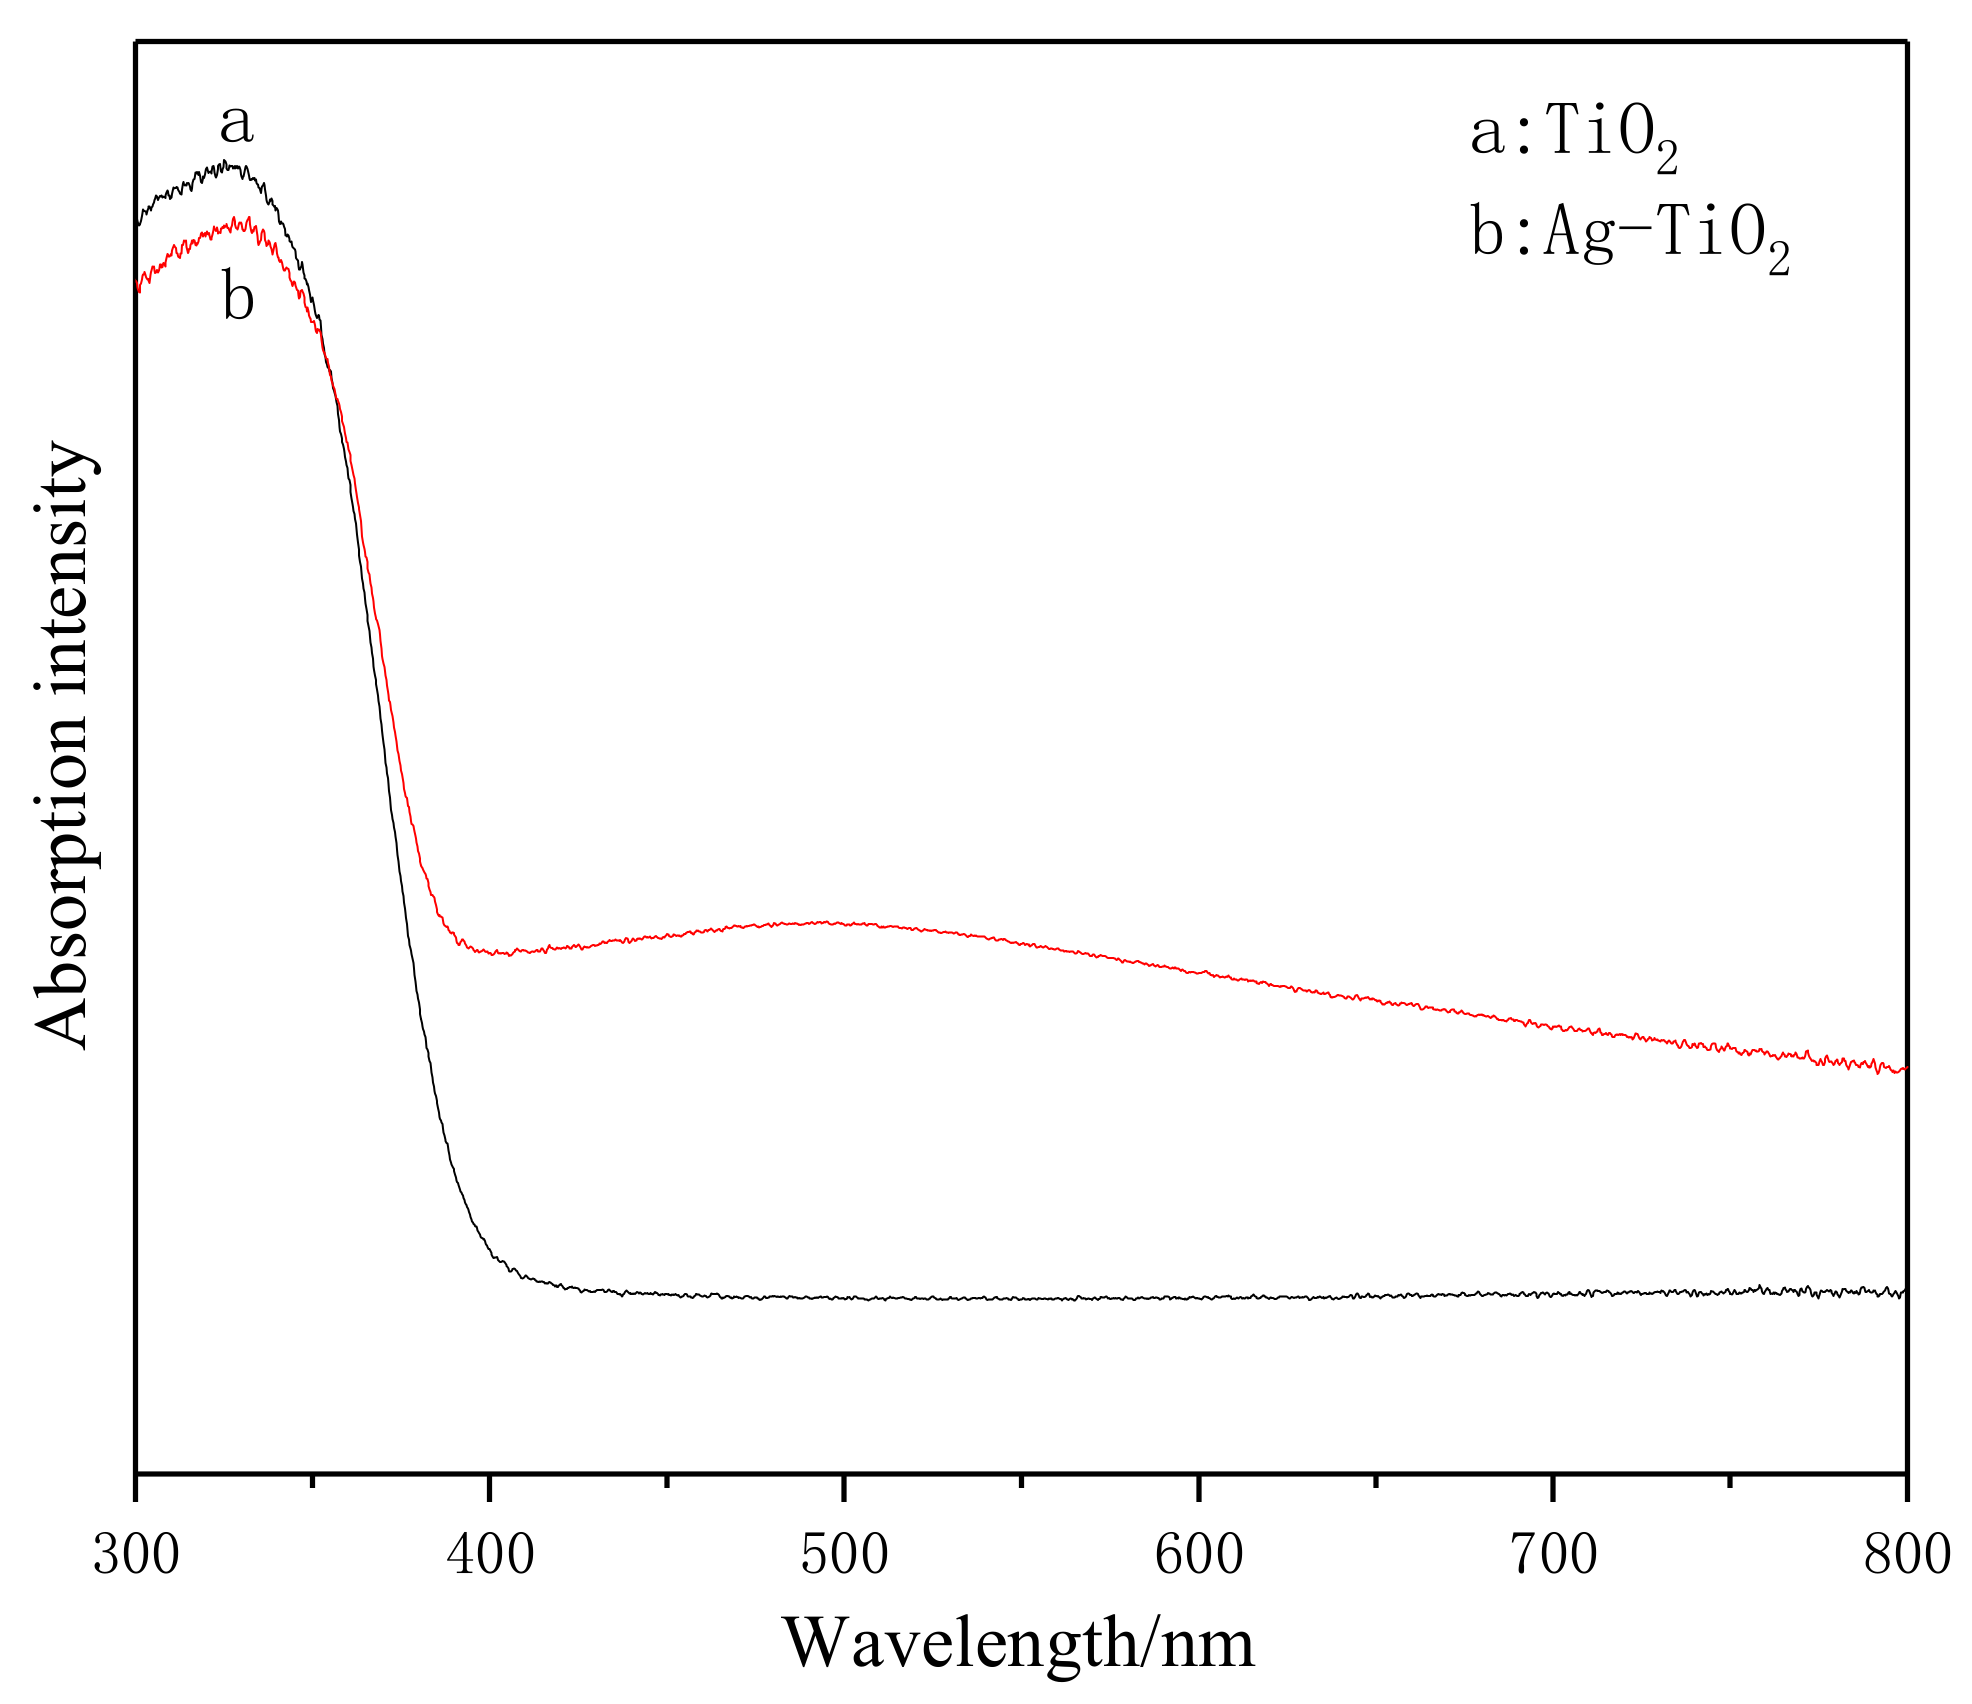
The ultraviolet-visible absorption spectrum (UV-Vis-Abs) of TiO2 and Ag-TiO2 particles are demonstrated in Figure 5. The maximum light absorption intensity of pure TiO2 and Ag-TiO2 in the visible region is 0.035 and 0.322, respectively, which illustrates that the absorbance increased significantly in the visible light region after the deposition of Ag on the surface of TiO2. The photocatalytic activity of photocatalyst is strictly related to its light absorption ability, and the photocatalytic activity increases with the enhancement of its light absorption ability. The threshold wavelength (λg) of the absorption spectrum of the Ag-deposited TiO2 particles is 388.5 nm, while that of the non-deposited TiO2 particles is 396.5 nm. The significant blue shift of Ag-TiO2 compared with that of TiO2 indicates that the deposition of Ag can reduce the threshold of light response. The band gap energy of the samples can be calculated according to Formula (3). The results show that the band gap energy of non-deposited TiO2 is 3.13 eV, and that of Ag-TiO2 is 3.19 eV. Generally speaking, the band gap energy of anatase TiO2 is 3.2 eV. That is to say, the band gap energy of the high energy crystal plane TiO2 is lower than that of general anatase TiO2, while the Ag deposition will increase the band gap energy of the high energy crystal plane TiO2, but it is also smaller than that of general anatase TiO2:
Eg = 1240/λg (eV)
Ag deposition causes the absorption band of TiO2 to shift blue and the absorption intensity increases both in the ultraviolet and visible region. It can be seen from Figure 1 and Figure 3, and Table 1 that the deposition of Ag can reduce the particle size and grain size of TiO2. Zhong et al. [44] reported that according to the quantum size effect, the absorption band edge of the sample will gradually shift blue with the decrease of particle size. That is to say, when the particle size drops to a certain value, the electronic energy level near the Fermi level of metal changes from quasi-continuous to the discrete energy level. There is a discontinuity in the highest occupied molecular orbital and the lowest unoccupied molecular orbital energy level between the semiconductor TiO2 particles, which widens the energy gap. Thus, the energy level from the valence band to the conduction band of TiO2 becomes separate. The required energy to excite electrons to transit from valence band to conduction band increases, and the threshold of light response increases, which leads to the blue shift of the ultraviolet absorption band. The optical absorption intensity of Ag-TiO2 in the visible light region is significantly higher than that of TiO2 because of the plasma resonance effect on the surface of the Ag-TiO2 photocatalyst [22]. That is to say, when the total reflection of light occurs on the surface of the metal film, the evanescent wave will form and enter into the optical thinner medium, while there are some plasma waves in the metal medium. Resonance may occur when two waves meet. When the evanescent wave resonates with the surface plasma wave, the intensity of the detected reflected light will be greatly weakened. Energy is transferred from photon to surface plasma, and most of the energy of the incident light is absorbed by the surface plasma wave, which makes the energy of the reflected light sharply reduced. Surface plasmon resonance (SPR) is a unique optical property of nanostructured metals.

3.6. XPS Analysis

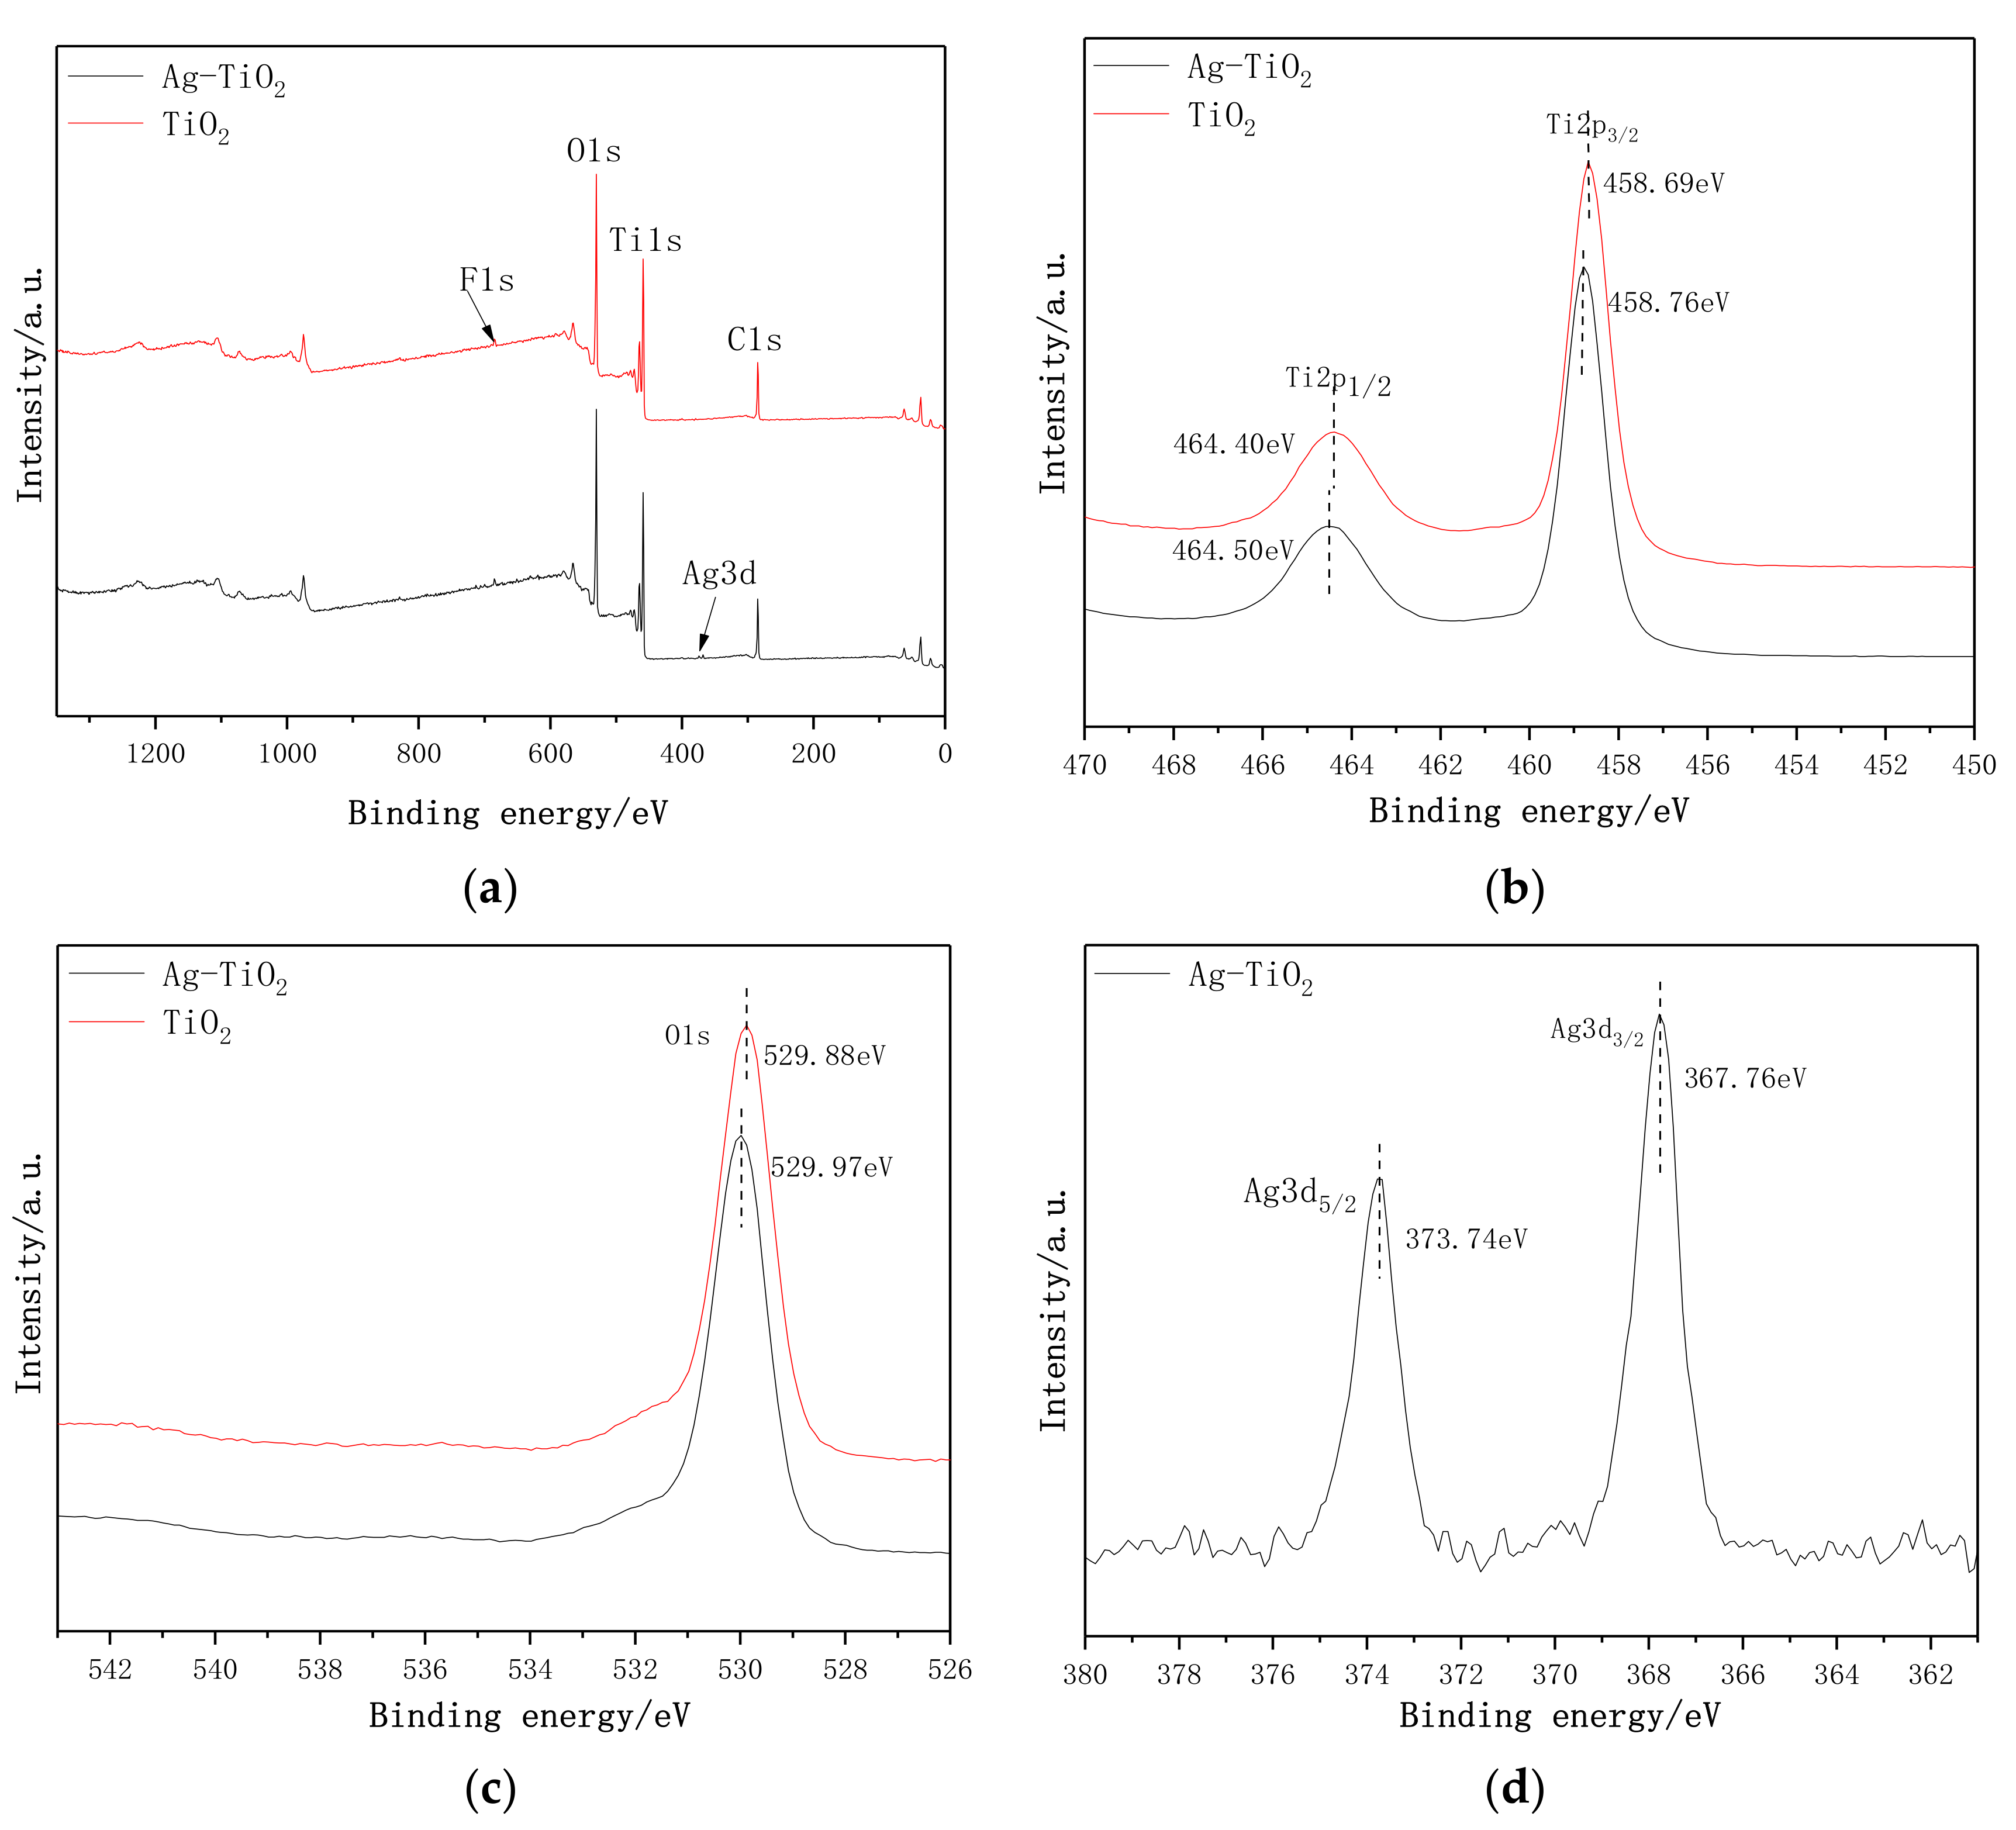
In order to analyze the elemental composition and valence of elements in the samples, XPS characterization of TiO2 and Ag-TiO2 was carried out. The results are shown in Figure 6, among which, 6a is the full spectrum and 6b-d are the spectra of Ti, O, and Ag elements, respectively. It shows that pure TiO2 and Ag-TiO2 are mainly composed of Ti, O, and C, with a small amount of F and Ag. Where C is introduced during the sample testing, while F is the residue of hydrofluoric acid after calcination. In Figure 6a, the characteristic peaks of Ag at 373.74 and 367.76 eV can be easily observed in XPS full spectrum of the Ag-TiO2 sample, indicating that Ag has successfully deposited on the surface of TiO2, which is consistent with FESEM images. The XPS spectra of the Ti element are shown in Figure 6b, among them the binding energies of spin orbitals Ti 2p3/2 and Ti 2p1/2 of pure TiO2 are 458.69 eV and 464.40 eV, respectively, indicating that the Ti element in pure TiO2 mainly exists in the form of Ti4+ [45]. Compared with pure TiO2, the binding energy of Ti in the Ag-TiO2 sample increases by 0.07 and 0.10 eV respectively, which illustrates that the chemical bond properties around Ti4+ are changed due to Ag deposition. Ag Deposition results in the decrease of the electron cloud density around Ti atom and the increase of binding energy of Ti 2p3/2 and Ti 2p1/2, which makes the peak of the Ti element move toward higher energy. The binding energy (529.97 eV) of O 1s orbital of Ag-TiO2 particles is 0.09 eV higher than that of pure TiO2 (529.88 eV). The reason is that a part of the Ti–O–Ag bond is formed after Ag deposition, which changes the lattice constants of TiO2. The distortion energy and deposition lead to the change of the electron cloud density around the O atom, increasing the binding energy of the O atom. Figure 6d is an XPS spectra of Ag 3d with a characteristic peak at 367.76 and 373.74 eV, which demonstrates that Ag has been successfully deposited on the surface of TiO2. In addition, the quantitative analysis results of XPS show that the elemental composition of pure TiO2 is Ti, O, and C, and the contents of each element are 23.07 at.%, 43.83 at.%, and 33.1 at.%, respectively. The elemental composition of Ag-TiO2 is Ti, O, C, and Ag, and the content of each element is 22.60 at.%, 43.66 at.%, 33.59 at.%, and 0.16 at.%, respectively. It can be seen that the ratio of O/Ti in both samples is slightly less than the standard stoichiometric ratio of TiO2 2:1. The former is due to the fact that the F ion can replace hydroxyl groups on the surface of TiO2 and exist on the surface of TiO2 in the state of chemical adsorption, which results in the decreased content of O. The latter is the result of the interaction of Ag and F. The radius of Ag+ is 144 pm and Ti4+ is 68 pm. The relative difference between the two ions is 111.8%, which is much larger than 30%. Besides, the valence difference between Ag+ and Ti4+ is quite apparent. Thus, it is difficult for Ag+ to enter into the lattice of TiO2. However, Ag+ may form the Ti–O–Ag bond in the gap of the TiO2 crystal. The positive charge of the system increases with the entry of Ag+ and the oxygen vacancy decreases in order to maintain the electrical neutrality. That is to say, the content of the O element in Ag-TiO2 is increased compared with pure TiO2.
In this work, Ag was deposited on the surface of TiO2 at a mass ratio of 1%. Through XPS quantitative analysis, the actual deposition amount of Ag in the final Ag-TiO2 was 0.956 wt.%. The actual amount is slightly less than the theoretical deposition value. XPS is mainly used to measure the content of elements on the surface of the sample. Normally, the content of silver on the surface of the sample should be higher than 1 wt.%, which illustrates that the deposition of silver on the sample surface is uneven. Some crystal faces may be more distributed than others.

3.7. Photocatalytic Performance

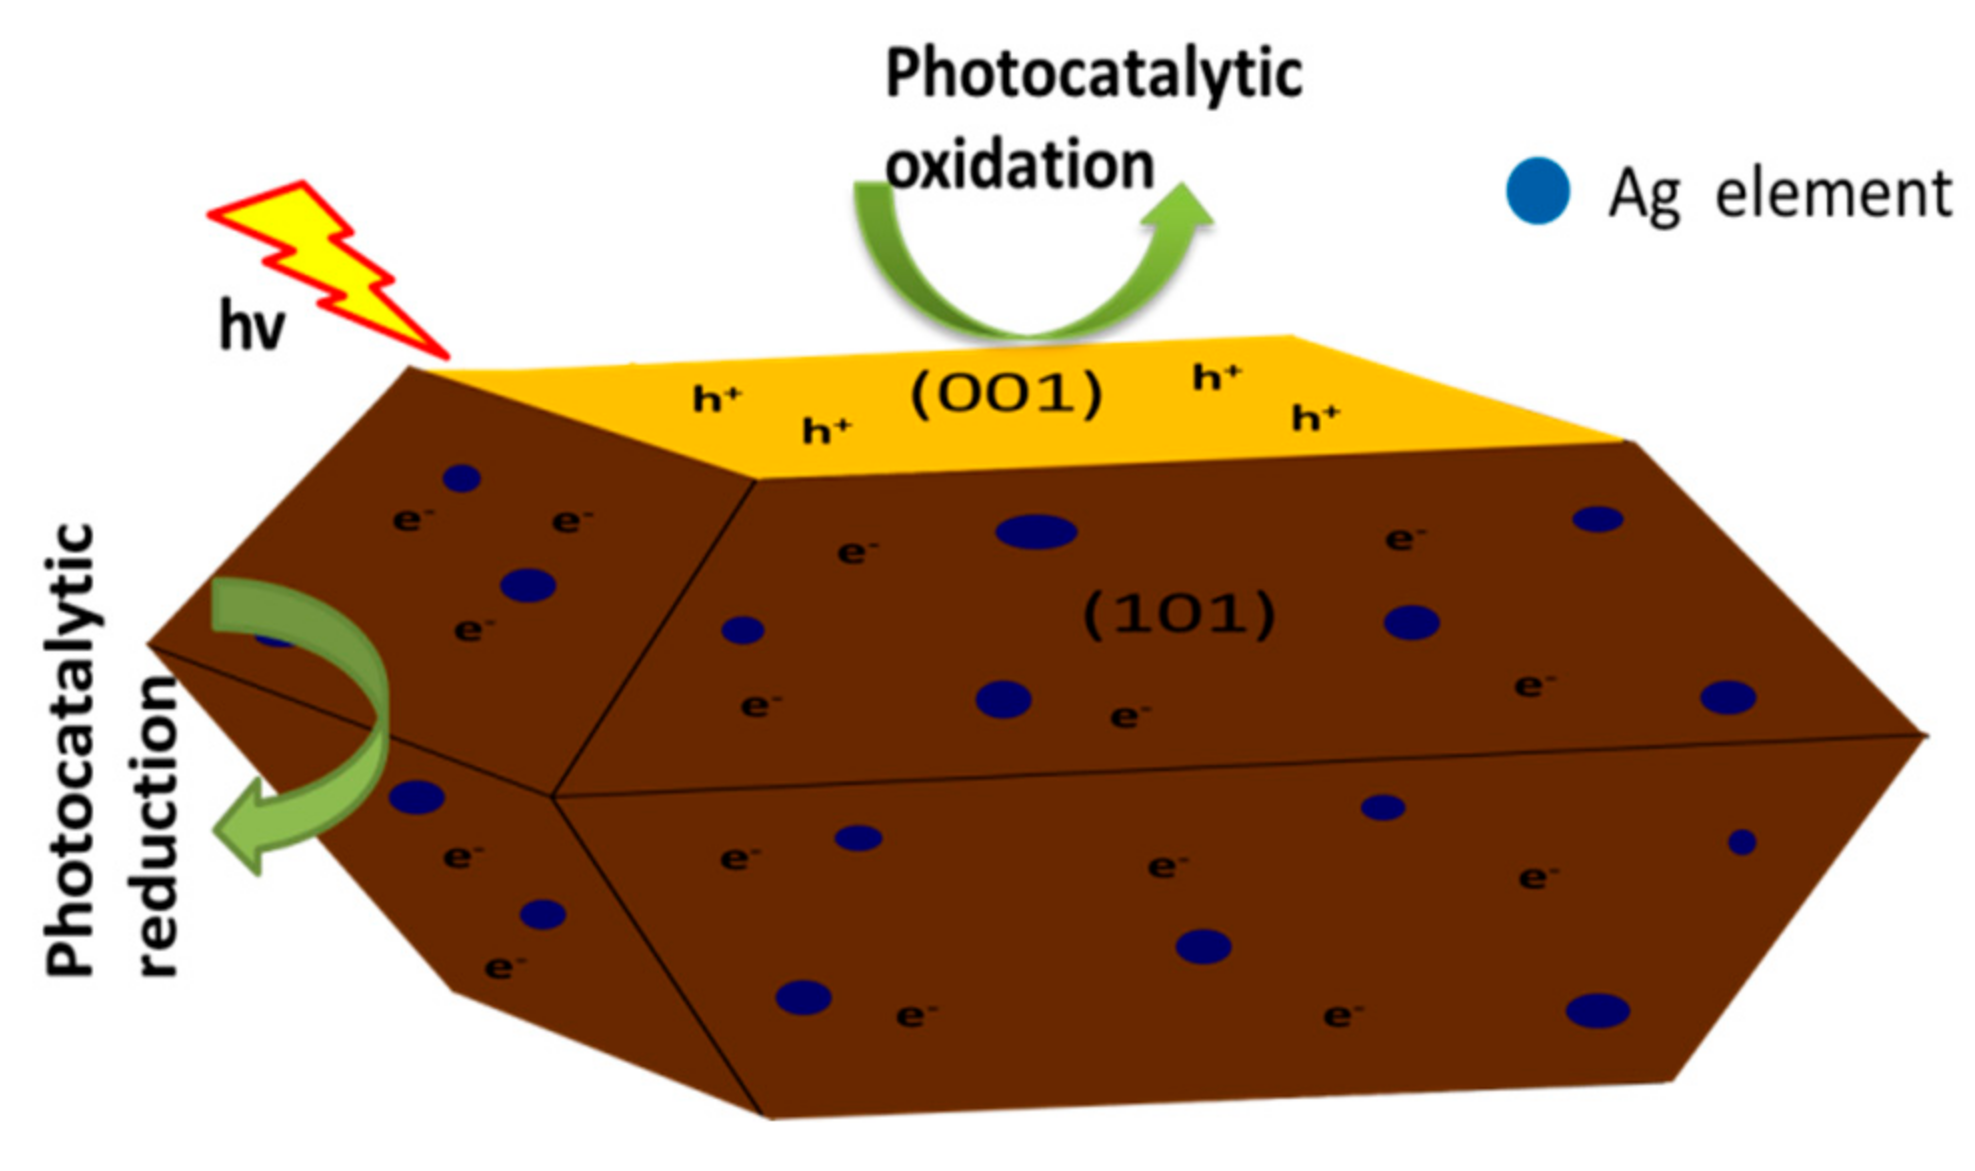
Figure 7 shows the degradation rate of methyl orange by different TiO2. Figure 8 illustrates the photocatalytic mechanism diagram of Ag-TiO2. From Figure 7, it can be seen that the blank (without photocatalyst) control group has almost no degradation effect on methyl orange, and the other three groups show high degradation rates. Under the same conditions, the photocatalytic performance of the high energy crystal plane Ag-TiO2 was the best, and its degradation rate reached as high as 93.63% after illumination for 60 min. For the high energy crystal plane TiO2, the degradation rate reached 81.89%, while that of nano-TiO2 was only 75.20%. It is demonstrated from Figure 7 that the photocatalytic activity of the high energy crystal plane Ag-TiO2 is 11.74% higher than that of the high energy crystal plane TiO2. It shows that Ag deposition can effectively enhance the photocatalytic activity of TiO2. The photocatalytic performance of nano-TiO2 is lower than that of the high energy crystal plane TiO2. One reason is that the grain size of the nano-TiO2 is larger than that of the high energy crystal plane TiO2; the other is that the (101) crystal plane of the high energy crystal plane TiO2 exists. In the photocatalytic reaction, photogenerated electrons tend to transfer to the low (101) crystal plane and accumulate on it, while photogenerated holes tend to accumulate on the high energy crystal plane (001). The above characteristics can effectively promote the separation of photogenerated electron-hole pairs, thereby improving the photocatalytic performance [32]. Moreover, the F–Ti coordination group formed by the fluoride ion adsorbed on the surface of TiO2 can promote the formation of highly active hydroxyl radicals under ultraviolet light [41]. The OH radicals produced by fluorinated TiO2 in the photocatalytic process more easily transfer from the surface of TiO2, so the photocatalytic activity of the fluorinated TiO2 is enhanced. In addition to the smallest grain size of Ag-deposited TiO2, Ag deposition causes blue shift of the threshold wavelength (λg) of the absorption spectrum of TiO2 particles, broadens the spectral response range, and produces ion resonance effect (SPR) during photocatalysis, which inhibits the recombination of photogenerated electrons and holes, improves the photoresponse of TiO2 to visible light. Besides, it also makes electrons and holes generated by illumination localized on Ag and TiO2. Electrons are enriched on Ag, and the electron density on the surface of TiO2 decreases, which further promotes the separation of electron-hole pairs, thus enhancing the catalytic activity [34,35]. In addition, when highly active Ag is combined with TiO2, a Schottky barrier region is formed at the interface, and photogenerated electrons are rapidly transferred to the Ag through the interface, thereby effectively promoting carrier separation. It can also effectively improve the photocatalytic efficiency of TiO2 [33,37].
Figure 9 shows the time-dependent curve of degradation rate of methyl orange by Ag-TiO2 at different pH. In Figure 9, 30 min is the starting point, and in the photocatalytic performance test, the sample was treated under dark conditions for 30 min. It can be seen from Figure 9 that the photocatalytic performance in acidic and alkaline environments is superior to that under neutral conditions, and the acidic conditions are better than those under alkaline conditions. The obvious reasons for the effect of pH are: First, methyl orange has a quinoid structure in acidic conditions and an azo structure in alkaline conditions. When methyl orange is degraded under light, the quinone structure is more susceptible to degradation than the azo structure under alkaline conditions. Second, it is determined by the photocatalytic mechanism of titanium dioxide. Hydroxyl radical is one of the main active substances in photocatalytic reaction, which plays a decisive role in photocatalytic oxidation. OH, H2O adsorbed on the surface of the catalyst and in hydrated suspension can produce this substance. When water is adsorbed on the surface of titanium dioxide, the reaction mechanism is expressed as follows: (4), (5). In the strong alkali environment, there is a large amount of OH, which is beneficial to the formation of ·OH. When the titanium dioxide adsorbs O2 on the surface, the mechanism can be expressed as follows: (6), (7), (8), (9), (10) [14]. There is a large amount of H+ in a strong acid environment, and it can be seen from the expression of reaction mechanism that it is beneficial to the formation of ·OH under a large amount of H+. The large number of hydroxyl radicals formed in both acid and base plays an important role in the whole catalytic oxidation process [46]:
TiO2 + hv → e + h+,
h+ + H2O →· OH + H+,
O2 + e- →· O2,
O2 + H+ →· HO2,
2·HO2 → H2O2 + 1O2(Singlet oxygen),
H2O2 + e →· OH + OH,
OH + H+ +dye →···→ CO2 + H2O.

4. Conclusions

The (001) crystal plane TiO2 with an exposure ratio of 41.8% was prepared by the sol-gel process using butyl titanate and hydrofluoric acid as raw materials. Ag is uniformly deposited on the surface of TiO2 (101) under the irradiation with a metal halide lamp. The particle size and grain size of TiO2 were reduced due to the deposition of Ag, and the photocatalytic performance was improved. For Ag-TiO2, the degradation rate of methyl orange solution reaches 93.63% after 60 min. High temperature calcination cannot completely remove F, and the presence of F also promotes photocatalysis. The deposition of Ag causes a certain blue shift in the light absorption band of TiO2, and the absorption intensity in the ultraviolet and visible region is significantly increased. Ag-TiO2 has the best photocatalytic performance at pH = 2.

Author Contributions

Performed the experiments, L.-Y.Z. and J.Y.; wrote the original draft, Z.-H.D.; reviewed and edited the paper, Q.-W.L. and Y.-J.Z.; drawed the figures with software, Y.-L.H.; designed the experiments, Y.-H.Y. All authors have read and agreed to the published version of the manuscript.

Funding

This research was funded by Sichuan Science and Technology Program (Grant No. 2019YJ0383) and The College Students’ Innovation Project of Neijiang Normal University (No. X2019112).

Conflicts of Interest

The authors declare no conflict of interest. We identify and declare there is no personal circumstances or interest that may be perceived as inappropriately influencing the representation or interpretation of reported research results.

References

  1. Yan, Q.; Huang, G.F.; Li, D.F.; Zhang, M.; Pari, A.L.; Huang, W.Q. Facile synthesis and superior photocatalytic and electrocatalytic performances of porous B-doped g-C3N4 nanosheets. J. Mater. Sci. Technol. 2018, 34, 2515–2520. [Google Scholar] [CrossRef]
  2. Aris, M.; Agus, P. Removal efficiency of nitrite and sulfide pollutants by electrochemical process by using Ti/RuIrO2 anode. Indones. J. Chem. 2018, 18, 286–293. [Google Scholar]
  3. Trellu, C.; Oturan, N.; Pechaud, Y.; Hullebush, E.D.V.; Esposito, G.; Outran, M.A. Anodic oxidation of surfactants and organic compounds entrapped in micelles-selective degradation mechanisms and soil washing solution reuse. Water Res. 2017, 118, 1–11. [Google Scholar] [CrossRef] [PubMed]
  4. Boltersdorf, J.; Sullivan, I.; Shelton, T.L.; Wu, Z.K.; Gray, M.; Zoellner, B.; Osterloh, F.E.; Maggard, P.A. Flux synthesis optical and photocatalytic properties of n-type Sn2TiO4: Hydrogen and oxygen evolution under visible light. Chem. Mater. 2016, 28, 8876–8889. [Google Scholar] [CrossRef]
  5. Hernandez-Alonso, M.D.; Fresno, F.; Suarez, S.; Coronado, M. Development of alternative photocatalysts to TiO2: Challenges and opportunities. Energy Environ. Sci. 2009, 2, 1231–1257. [Google Scholar] [CrossRef]
  6. Wang, T.; Costan, J.; Centeno, A.; Pang, J.S.; Darvill, D.; Ryan, M.P.; Xie, F. Broad and enhanced fluorescence using zinc-oxide nanoflower arrays. J. Mater. Chem. 2015, 3, 2656–2663. [Google Scholar]
  7. Yang, H.G.; Sun, C.H.; Qiao, S.Z.; Zou, J.; Liu, G.; Smith, S.C.; Cheng, H.M.; Lu, G.L. Anatase TiO2 single crystals with a large percentage of reactive facets. Nature 2008, 453, 638–641. [Google Scholar] [CrossRef] [Green Version]
  8. Hosseinpour, Z.; Alemi, A.; Khandar, A.A. A controlled solvothermal synthesis of cus hierarchical structures and their natural-light-induced photocatalytic properties. New J. Chem. 2015, 39, 5470–5476. [Google Scholar] [CrossRef]
  9. Qi, K.Z.; Liu, S.Y.; Qiu, M. Photocatalytic performance of TiO2 nanocrystal with/without oxygen defects. Chin. J. Catal. 2018, 39, 867–875. [Google Scholar] [CrossRef]
  10. Low, J.X.; Chen, B.; Yu, J.G. Surface modification and enhanced photocatalytic CO2 reduction performance of TiO2: A review. Appl. Surf. Sci. 2017, 392, 658–686. [Google Scholar] [CrossRef]
  11. Wei, S.H.; Ni, S.; Xu, X.X. A new approach to inducing Ti3+ in anatase TiO2 for efficient photocatalytic hydrogen production. Chin. J. Catal. 2018, 39, 510–516. [Google Scholar] [CrossRef]
  12. Liu, F.; Feng, N.D.; Wang, Q. Transfer channel of photoinduced hole on TiO2 surface as revealed by solid-state nmr and esr spectroscopy. J. Am. Chem. Soc. 2017, 139, 10020–10028. [Google Scholar] [CrossRef]
  13. Moreau, M.M.L.; Granja, L.P.; Fuertes, M.C.; Martinez, E.D.; Ferrari, V.; Levy, P.E.; Soler-lllia, G.J.A.A. Three-dimensional electrochemical lithography in mesoporous TiO2 thin films. J. Phys. Chem. 2015, 119, 28954–28960. [Google Scholar] [CrossRef]
  14. Hoffman, M.R.; Martin, S.T.; Choi, W.; Bahnemann, D.W. Environmental applications of semiconductor photocatalysis. Chem. Rev. 1995, 95, 69–96. [Google Scholar] [CrossRef]
  15. Li, F.L.; Cai, H.Q.; Chen, L.S. The study of antioxidation and reducing ability of polysaccharides from pogonatherum crinitum. J. Org. Chem. Res. 2015, 3, 16–24. [Google Scholar] [CrossRef]
  16. Saharudin, K.A.; Sreekantan, S.; Basiron, N.; Khor, Y.L.; Harun, N.H.; Mydin, R.B.S.M.N.; Adki, H.M.; Seeni, A.; Vignesh, K. Bacteriostatic activity of lldpe nanocomposite embedded with sol-gel synthesized TiO2/ZnO coupled oxides at various ratios. Polymers 2018, 10, 878. [Google Scholar] [CrossRef] [Green Version]
  17. Shen, W.; Nitta, A.; Chen, Z.; Eda, T.; Yoshida, A.; Nation, S.C. NOx storage and reduction over potassium titanate nanobelt-based catalyst with high storage capacity. J. Catal. 2011, 280, 161–167. [Google Scholar] [CrossRef]
  18. Buchalska, M.; Kobielusz, M.; Matuszek, A.; Pacia, M.; Wojtyla, S.; Macyk, W. On oxygen activation at rutile- and anatase-TiO2. ACS Catal. 2015, 5, 7424–7431. [Google Scholar] [CrossRef]
  19. Tian, F.; Zhang, Y.P.; Zhang, J.; Pan, C.X. Raman spectroscopy: A new approach to measure the percentage of anatase TiO2 exposed (001) facets. J. Phys. Chem. 2012, 116, 7515–7519. [Google Scholar] [CrossRef]
  20. Kumari, R.; Majumdar, J.D. Heat-treated TiO2 plasma spray deposition for bioactivity improvement in ti-6Al-4V Alloy. J. Mater. Eng. Perform. 2017, 26, 6207–6218. [Google Scholar] [CrossRef]
  21. Moitzheim, S.; Balder, J.E.; Poodt, P.; Unnikrishnan, S.; Gendt, S.D.; Vereecken, P.M. Chlorine doping of amorphous TiO2 for increased capacity and faster Li+-Ion storage. Chem. Mater. 2017, 29, 10007–10018. [Google Scholar] [CrossRef]
  22. Du, J.M.; Zhang, J.L.; Liu, Z.M.; Han, B.X.; Jiang, T.; Huang, Y. Controlled synthesis of Ag/TiO2 core−shell nanowires with smooth and bristled surfaces via a one-step solution route. Langmuir 2006, 22, 1307–1312. [Google Scholar] [CrossRef] [PubMed]
  23. Wang, X.; Li, R.G.; Xu, Q.; Han, H.X.; Li, C. Roles of (001) and (101) facets of anatase TiO2 in photocatalytic reactions. Acta Phys. Chim. Sin. 2013, 29, 1566–1571. [Google Scholar]
  24. Luo, T.; Wan, X.J.; Jiang, S.X.; Zhang, L.Y.; Hong, Z.Q.; Liu, J. Preparation and photocatalytic performance of fibrous Tb3+-doped TiO2 using collagen fiber as template. Appl. Phys. Mater. Sci. Process. 2018, 124, 304. [Google Scholar] [CrossRef]
  25. Shi, Y.L.; Sun, H.J.; Nguyen, M.C.; Wang, A.Z.; Ho, K.M.; Saidi, W.A.; Zhao, J. Structures of defects on anatase TiO2 (001) surfaces. Nanoscale 2017, 9, 11553–11565. [Google Scholar] [CrossRef] [PubMed]
  26. Jin, M.; Xu, J.Y.; Shen, H.; Lu, B.L. Etching behavior on (001) face of relaxor ferroelectric crystal pznt. J. Synth. Cryst. 2011, 40, 334–337. [Google Scholar]
  27. Hong, X.X.; Kang, Y.Y.; Zhen, C.; Kang, X.D.; Yin, L.C.; Wang, L.Z.; Irvine, J.T.S.; Liu, G.; Cheng, H.M. Maximizing the visible light photo electron chemical activity of B/N-doped anatase TiO2 microspheres with exposed dominant (001) facets. Sci. Chin. Mater. 2018, 61, 831–838. [Google Scholar] [CrossRef] [Green Version]
  28. Jia, X.W.; Wang, M. Surface photocatalytic research of Fe-doped TiO2 (001) based on the first-principles. IOP Conf. Ser. Mater. Sci. Eng. 2018, 392, 32–40. [Google Scholar] [CrossRef]
  29. Liu, S.W.; Yu, J.G.; Jaroniec, M. Anatase TiO2 with dominant high-energy {001} facets: Synthesis, properties, and applications. Chem. Mater. 2011, 23, 4085–4093. [Google Scholar] [CrossRef]
  30. Yu, J.G.; Qi, L.F.; Jaroniec, M. Hydrogen production by photocatalytic water splitting over Pt/TiO2 nanosheets with exposed (001) facets. J. Phys. Chem. 2010, 114, 13118–13125. [Google Scholar]
  31. Liu, S.W.; Yu, J.G.; Jaroniec, M. Tunable photocatalytic selectivity of hollow TiO2 microspheres composed of anatase polyhedra with exposed {001} facets. J. Am. Chem. Soc. 2010, 132, 11914–11916. [Google Scholar] [CrossRef]
  32. Liu, M.; Li, H.M.; Zeng, Y.G.; Huang, T.C. Anatase TiO2 single crystals with dominant (001) facets: Facile fabrication from Ti powders and enhanced photocatalytical activity. Appl. Sur. Sci. 2013, 274, 117–123. [Google Scholar] [CrossRef]
  33. Yu, L.Q.; Dong, K.T.; Yang, C.; Wang, Q.Q.; Hou, Y.L. Facile synthesis and dehydrogenation properties of Fe3B nanoalloys. Mater. Lett. 2014, 132, 4–7. [Google Scholar] [CrossRef]
  34. Tan, L.L.; Ong, W.J.; Chai, S.P.; Mohamed, A.R. Noble metal modified reduced graphene oxide/TiO2 ternary nanostructures for efficient visible-light-driven photoreduction of carbon dioxide into methane. Appl. Catal. Environ. 2015, 166, 251–259. [Google Scholar] [CrossRef]
  35. Hotsenpiller, P.A.M.; Bolt, J.D.; Farneth, W.E.; Lowekamp, J.B.; Rohrer, G.S. Orientation dependence of photochemical reactions on TiO2 thin film surfaces. Abstr. Pap. Am. Chem. Soc. 1998, 216, 747. [Google Scholar]
  36. Yang, X.L.; Wang, Y.; Xu, X.; Ding, X.; Chen, H. Surface plasmon resonance-induced visible-light photocatalytic performance of silver/silver molybdate composites. Chin. J. Catal. 2017, 38, 260–269. [Google Scholar] [CrossRef]
  37. Xin, B.F.; Jing, L.Q.; Ren, Z.Y.; Wang, B.Q.; Fu, H.G. Effects of simultaneously doped and deposited Ag on the photocatalytic activity and surface states of TiO2. J. Phys. Chem. 2005, 109, 2805–2809. [Google Scholar] [CrossRef]
  38. Liu, H.; Liu, T.T.; Dong, X.N. Preparation and photocatalytic activity of noble metal ag selectively loading on high energy facet of TiO2 single crystal. J. Shanxi Univ. Sci. Technol. 2016, 34, 40–45. [Google Scholar]
  39. Zhang, Y.; Li, L.D.; Liu, H.Y. Photocatalytic reduction activity of {001} TiO2 codoped with F and Fe under visible light for bromate removal. J. Nanomater. 2016, 2016, 7. [Google Scholar] [CrossRef] [Green Version]
  40. Wang, J.Y.; Liu, B.S.; Nakata, K. Effects of crystallinity, {001}/{101} ratio, and Au decoration on the photocatalytic activity of anatase TiO2 crystals. Chin. J. Catal. 2019, 40, 403–412. [Google Scholar] [CrossRef]
  41. Howard, C.J.; Sabine, T.M.; Dickson, F. Structural and thermal parameters for rutile and anatase. Acta Crystal. 1991, 47, 462–468. [Google Scholar] [CrossRef] [Green Version]
  42. Bae, Y.S.; Yazaydın, A.O.; Snurr, R.Q. Evaluation of the BET method for determining surface areas of MOFs and zeolites that contain ultra-micropores. Langmuir 2010, 26, 5475–5483. [Google Scholar] [CrossRef] [PubMed]
  43. Liu, L.C.; Ji, Z.Y.; Zou, W.X.; Gu, X.R.; Deng, Y.; Gao, F.; Tang, C.J.; Dong, L. In site loading transition metal oxide clusters on TiO2 nanosheets as Co-catalysts for exceptional high photoactivity. ACS Catal. 2013, 3, 2052–2061. [Google Scholar] [CrossRef]
  44. Zhong, M.; Wei, Z.H.; Si, P.Z.; Li, H.; Wei, G.Y.; Han, G.R.; Ge, H.L. Preparation of iron-doped titania nanocrystalline grains and its photocatalytic property. J. Chin. Ceram. Soc. 2010, 38, 68–73. [Google Scholar]
  45. Zhang, Y.Y.; Gu, D.; Zhu, L.Y. Highly ordered Fe3+/TiO2 nanotube arrays for efficient photocatalytic degradation of nitrobenzene. Appl. Surf. Sci. 2017, 420, 896–904. [Google Scholar] [CrossRef]
  46. Yu, J.G.; Ma, T.T.; Liu, S.W. Enhanced photocatalytic activity of mesoporous TiO2 aggregates by embedding carbon nanotbes as electron-transfer channel. Phys. Chem. Chem. Phys. 2011, 13, 3491–3501. [Google Scholar] [CrossRef]
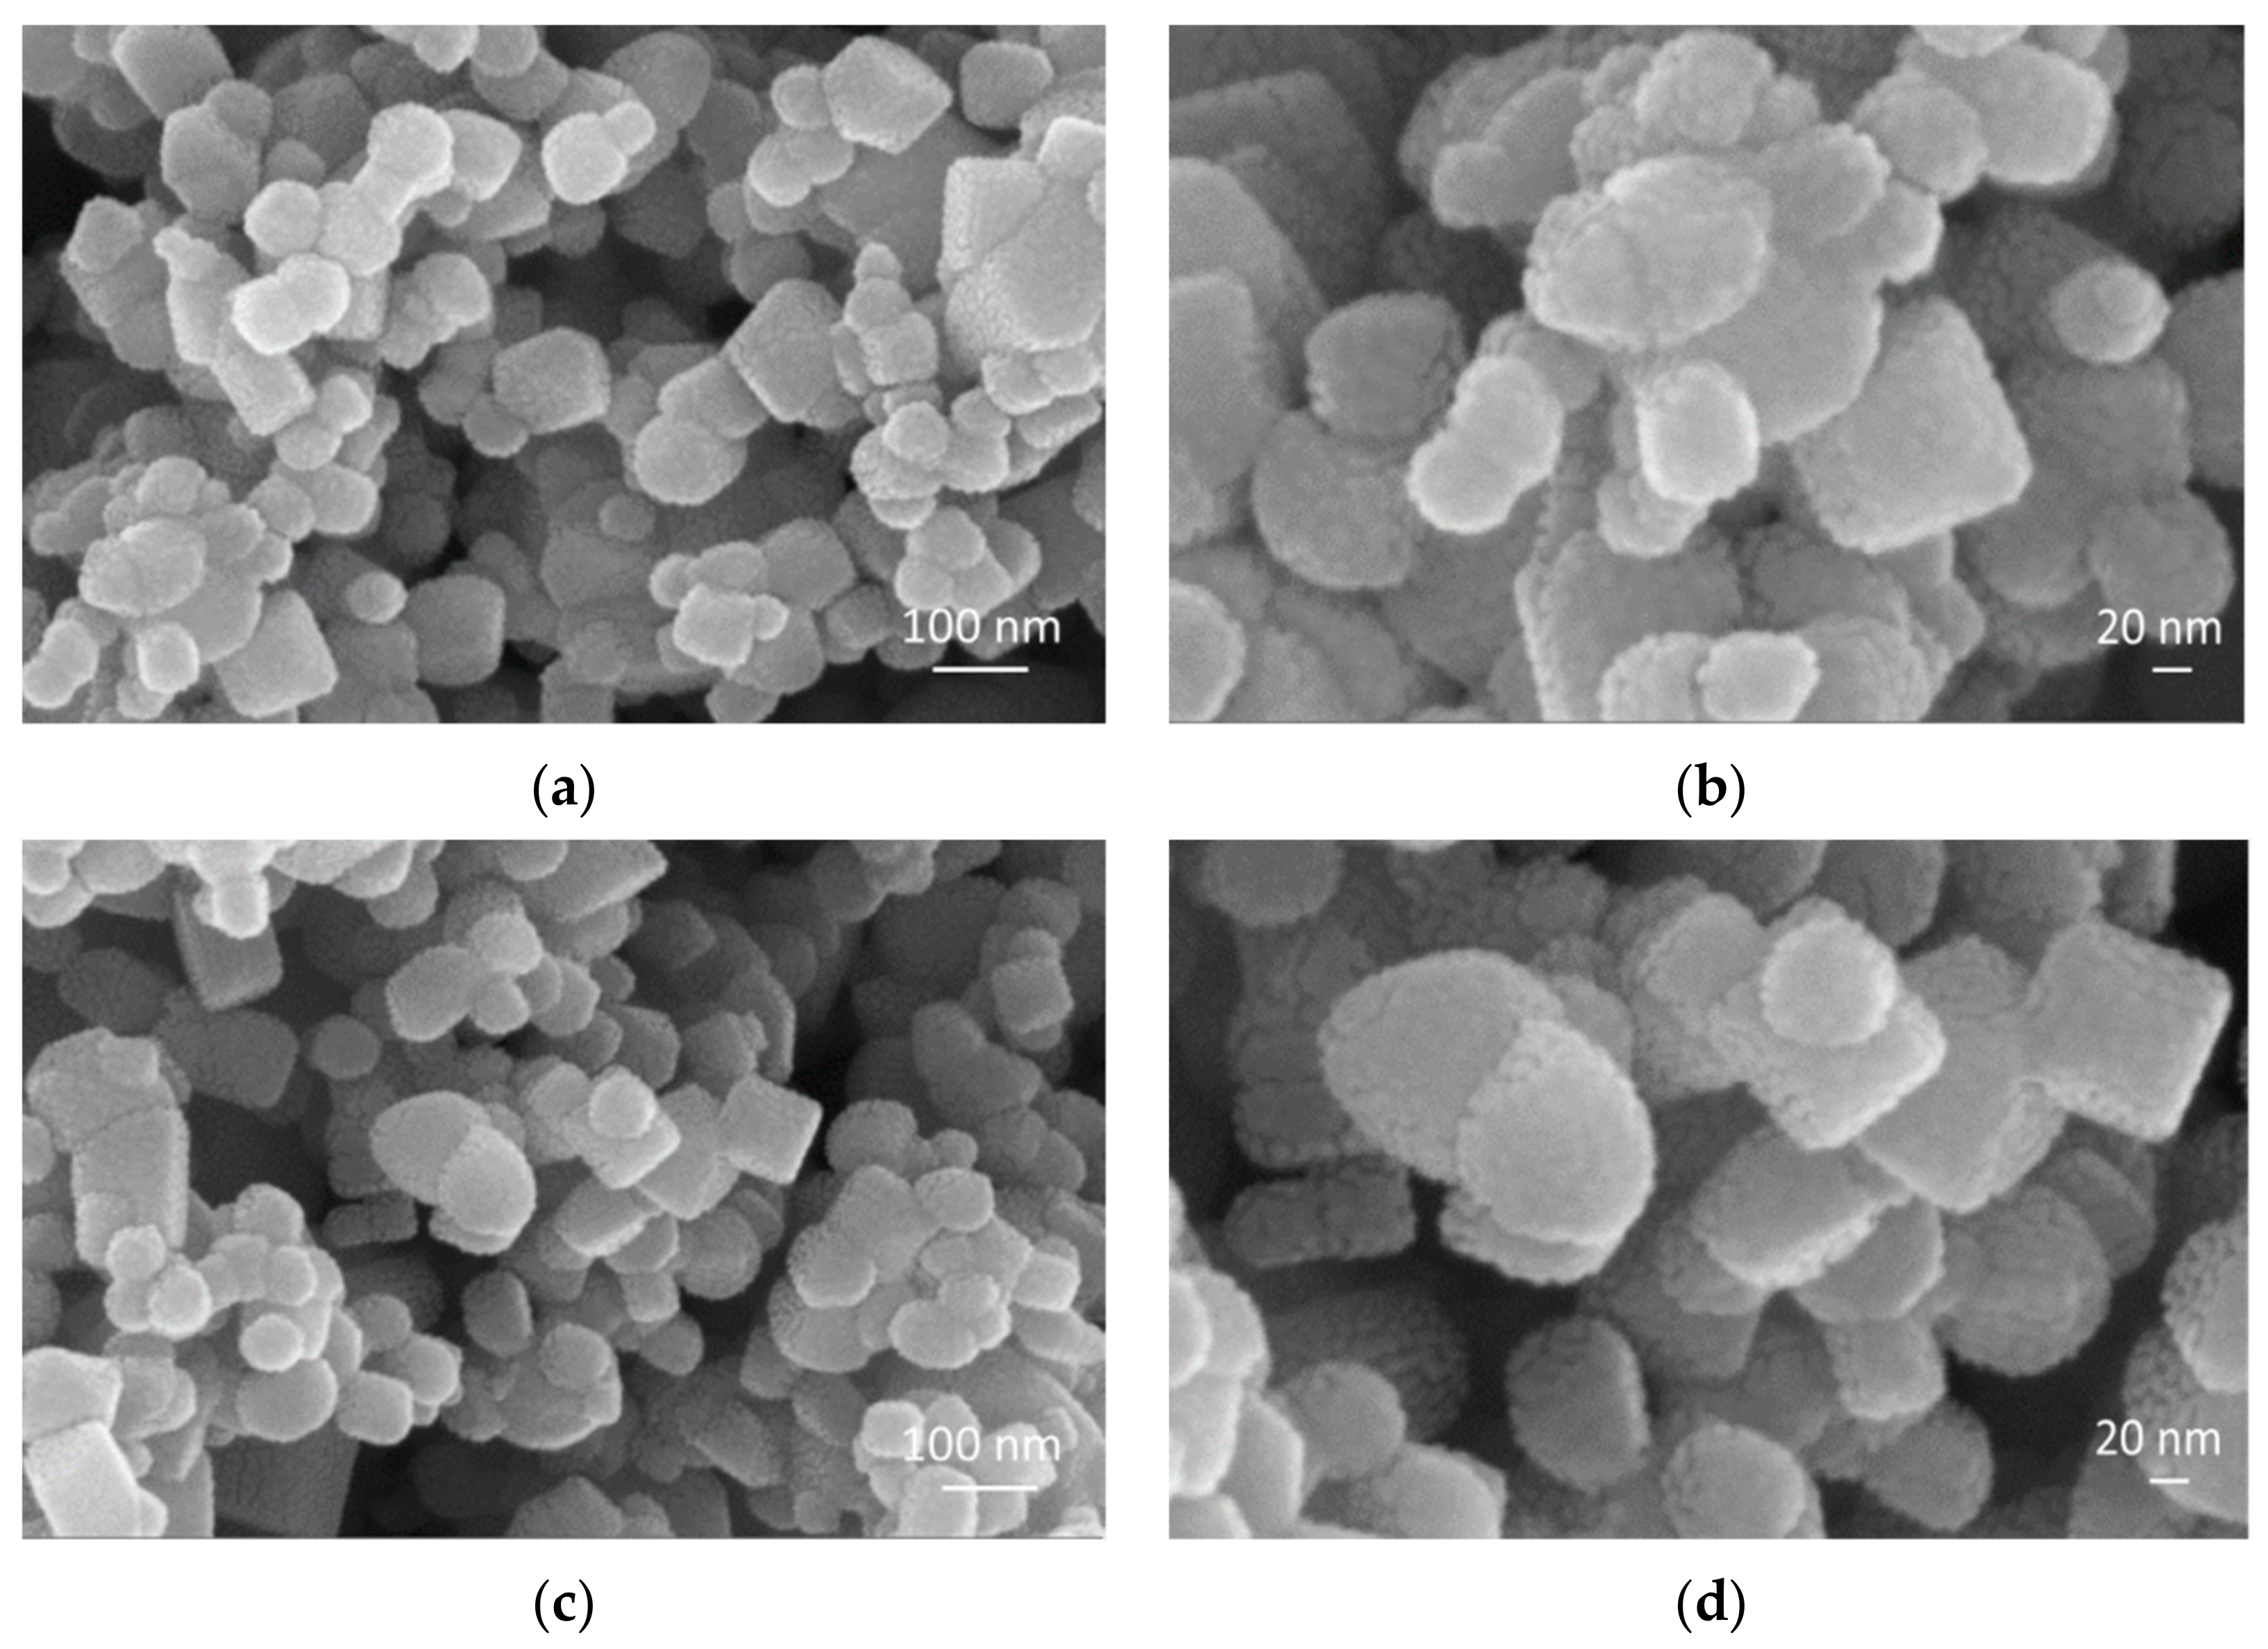
Figure 1. FESEM images of pure TiO2 and Ag-TiO2: (a) and (b) pure TiO2, (c) and (d) Ag-TiO2.
Coatings 10 00027 g001
Figure 2. TEM images of pure TiO2: (a): Sample Magnified 50,000×, (b): Sample Magnified 30,000×, (c): (101) Crystal plane spacing, and (d): (001) Crystal plane spacing.
Coatings 10 00027 g002
Figure 3. XRD patterns of different TiO2 (a) nano-TiO2, (b) TiO2, and (c) Ag-TiO2.
Coatings 10 00027 g003
Figure 4. Adsorption isotherms and pore size distributions of different TiO2: (a) TiO2, and (b) Ag-TiO2.
Coatings 10 00027 g004
Figure 5. UV-Vis-Abs of pure TiO2 and Ag-TiO2.
Coatings 10 00027 g005
Figure 6. XPS spectra of pure TiO2 and Ag-TiO2 (a) Survey, (b) Ti 2p peaks, (c) O 1s peaks, and (d) Ag 3d peaks.
Coatings 10 00027 g006
Figure 7. Curves of decolorization rate of methyl orange by different TiO2: (a) Ag-TiO2, (b) TiO2, (c) nano-TiO2, and (d) blank (without photocatalyst).
Coatings 10 00027 g007
Figure 8. Photocatalytic mechanism diagram of Ag-TiO2.
Coatings 10 00027 g008
Figure 9. The time-dependent curve of degradation rate of methyl orange by Ag-TiO2 at different pH.
Coatings 10 00027 g009
Table 1. Summary of physical properties of TiO2 sample.
SamplesCrystallite Size D(101)/nmTEM Particle Size/nm
Ag-TiO238.97
TiO241.4480
Nano-TiO245.64
Table 2. BET data of TiO2 and Ag-TiO2.
SamplesSurface Area (m2/g)Pore Volume (cc/g)Pore Diameter Dv(d)(nm)
TiO218.590 0.150469.386
Ag-TiO2 12.5700.0441.936