1. Introduction
Rapid dissemination of antibiotic-resistant Gram-negative infections constitute a worldwide problem with an increasing health and economic burden [
1]. A recently published European Centre for Disease Prevention and Control (ECDC) study estimates that about 33,000 people die each year as a direct consequence of an infection due to bacteria resistant to antibiotics [
2]. Healthcare associated infections (HAI’s) account for the major burden of these multidrug-resistant infections, while last-line treatments, such as carbapenems and colistin, become increasingly less reliable, limiting the available therapeutic options [
3].
According to the European Antimicrobial Resistance Surveillance Network (EARS-Net) data from 2015, Greece is among the countries with the greatest burden of infections due to antibiotic-resistant bacteria in the EU and EEA [
4]. In 2015, most of this burden was due to infections with carbapenem-resistant or colistin-resistant bacteria [
2,
4,
5]. A mean incidence of 0.48 per 1000 patient-days and a crude 28-day mortality rate of 34.4% were reported from the Hellenic Center for Disease Control and Prevention (HCDCP) in 2014, in the context of a national action plan to combat carbapenem-resistant Gram-negative pathogens in acute-care hospitals in Greece [
6].
Moreover, the annual report of the EARS-Net for 2017 shows that Greece has the highest percentage of resistance to carbapenems and fluoroquinolones for
Klebsiella pneumoniae among all European countries, with a combined resistance to three or more antimicrobial groups among piperacillin/tazobactam, ceftazidime, fluoroquinolones, aminoglycosides and carbapenems being above 30% for
Pseudomonas aeruginosa, with resistance of
Acinetobacter baumannii to carbapenems being raised to 94% [
7].
Antimicrobial stewardship programs aim to optimize the appropriate use of currently available antimicrobial agents to improve therapeutic results for Gram-negative multi-drug-resistant (MDR) infections, reducing antimicrobial resistance and decreasing hospital costs [
8].
P. aeruginosa,
A. baumannii, and
K. pneumoniae are encountered more frequently than other pathogens in intensive care units (ICUs). To establish preventive measures, it is crucial to know the antibiotic resistance profiles in each ward separately compared with ICUs. The aim of the present study is to compare the resistance levels of
P. aeruginosa,
A. baumannii and
K. pneumoniae isolates between ICUs and other facilities in two consecutive years, from January 2017 until December 2018, in one of the largest public tertiary hospitals in Greece. This will help to implement more effective strategies for the reduction of multidrug resistance.
3. Discussion
Despite significant advances in the intensive care setting during the last decade, healthcare-associated infections are a potentially modifiable source of morbidity and mortality. The prevalence of ICU-acquired infections remains significantly higher than those encountered among non-ICU patients [
10]. Several factors, such as a greater severity of illness, underlying conditions, immunosuppression or impaired host responses, exposure to multiple invasive devices and procedures and increased patient contact with healthcare personnel in a small specialized area may contribute to the increased risk of infection in ICU patients [
11,
12]. Invasive devices and procedures, such as endotracheal intubation and urinary and central venous catheters, facilitate the entry of infectious organisms into the body. The proportion of healthcare-associated infections caused by MDR Gram-negative bacteria (GNB) is on the rise, and as treatment options are scarce, it must be a global priority of the healthcare community to monitor the prevalence and spread of antimicrobial resistance [
1,
2,
3].
The aim of the present study was to survey the overall resistance rates in ICUs compared with the non-ICU environment of our hospital, with regard to the three most commonly encountered MDR pathogens. A significantly worse antibiotic resistance profile in all three examined bacteria was observed in the ICU setting throughout the study period. Another survey [
13] on the prevalence of multidrug resistance of GNB isolates in ICUs in United States and European hospitals compared with non-ICU wards from 2009 to 2011 suggested that overall resistance rates were generally higher among ICU isolates compared with non-ICU isolates. Among these three pathogens, the most frequent in our ICU were
P. aeruginosa (224), followed by
K. pneumoniae (204) and
A. baumanii (195), as shown in
Table A1,
Table A4 and
Table A7.
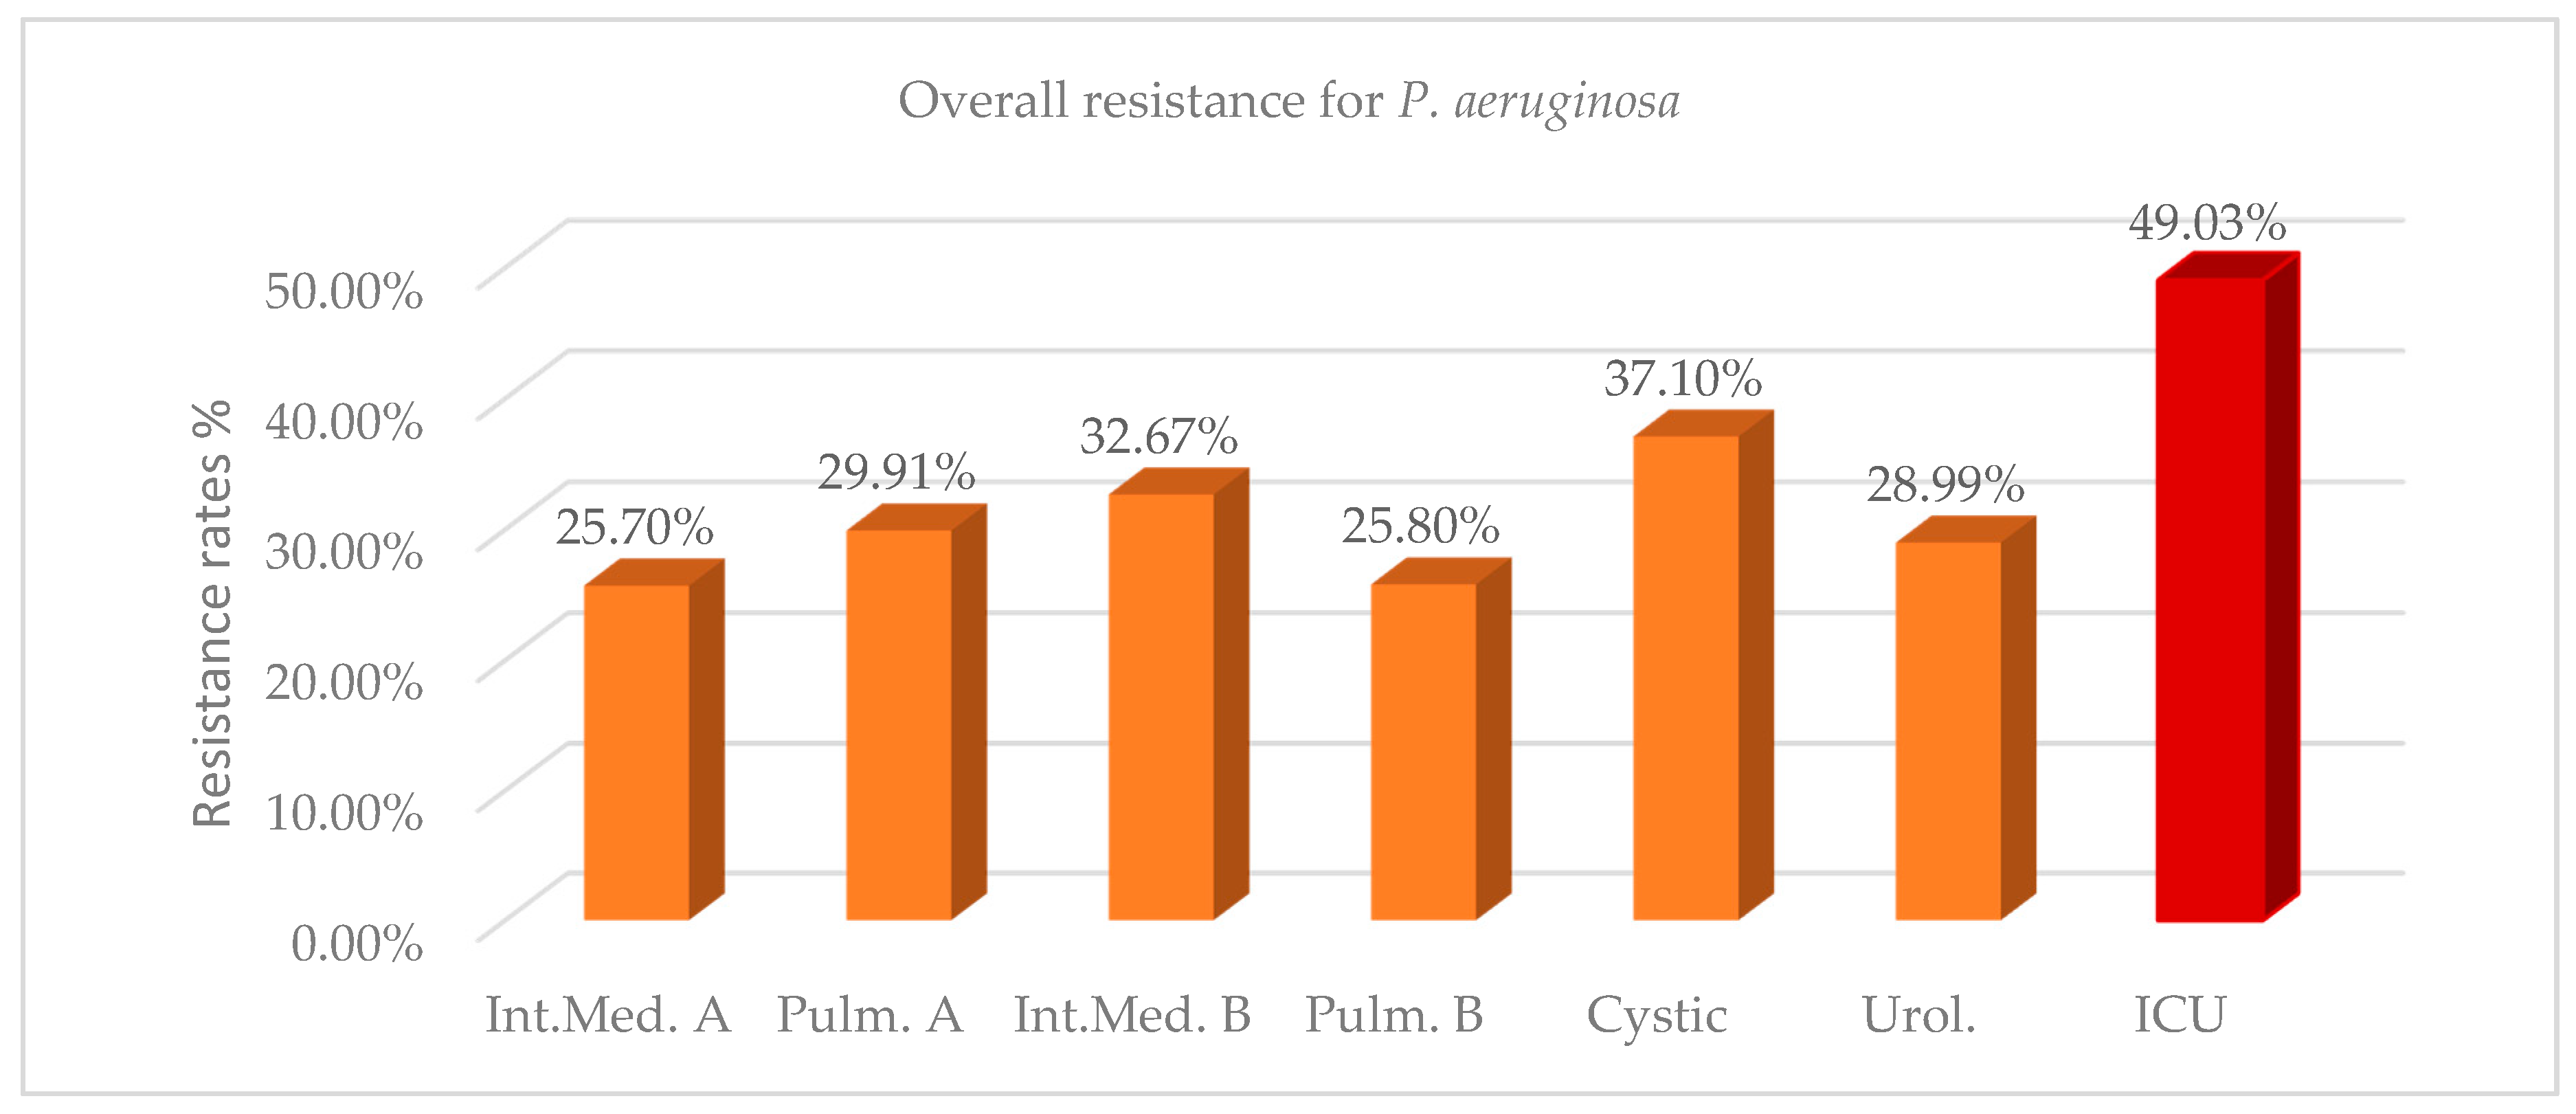
The overall resistance of
P. aeruginosa in the ICU during the two years 2017–2018 was 49.03%, while in the other wards resistance ranged from 25.70% to 37.10% (
Figure 1,
Table A1). Mean differences of resistance between ICU and non-ICU isolates during the two years were statistically significant and ranged from 11.93% to 23.33%. The number of isolates and resistance rate increased in the ICU in 2018 compared with 2017, while there was a corresponding reduction in the wards, except in the cystic fibrosis unit, where both values remained approximately in the same levels (
Table A1). The high antibiotic resistance rate against
P. aeruginosa strains (37.10%), as well as the high prevalence of this pathogen (46% of total isolates) in the cystic fibrosis unit can be explained by the distinct microbiota and the predominance of the pathogen in the airways of these patients [
14]. As shown in
Table A2, more than 47% of the ICU strains were resistant to any tested antibiotic, except colistin, where a sensitivity of 97.41% was reported. We can also observe that ICU strains present the highest resistance rates to gentamycin (57.97%) and extended-spectrum cephalosporins (56.67%), followed by fluoroquinolones (55.11%) and carbapenems (54.76–55.02%). These rates were significantly higher than those observed in most of the wards (
Table A3). The high percentage of
P. aeruginosa resistance to aminoglycosides (41.88%) and ciprofloxacin (46.22%) encountered in the urology department might be attributed to the increased in-and-out-of-hospital usage of these antibiotics for the treatment of urinary tract infections. An emerging
P. aeruginosa resistance to colistin in up to 6% of the isolates can also be observed in the cystic fibrosis unit. High levels of resistance to aztreonam in both ICU and non-ICU strains of
P. aeruginosa were detected, ranging from 38.21 to 46.22% (
Table A2).
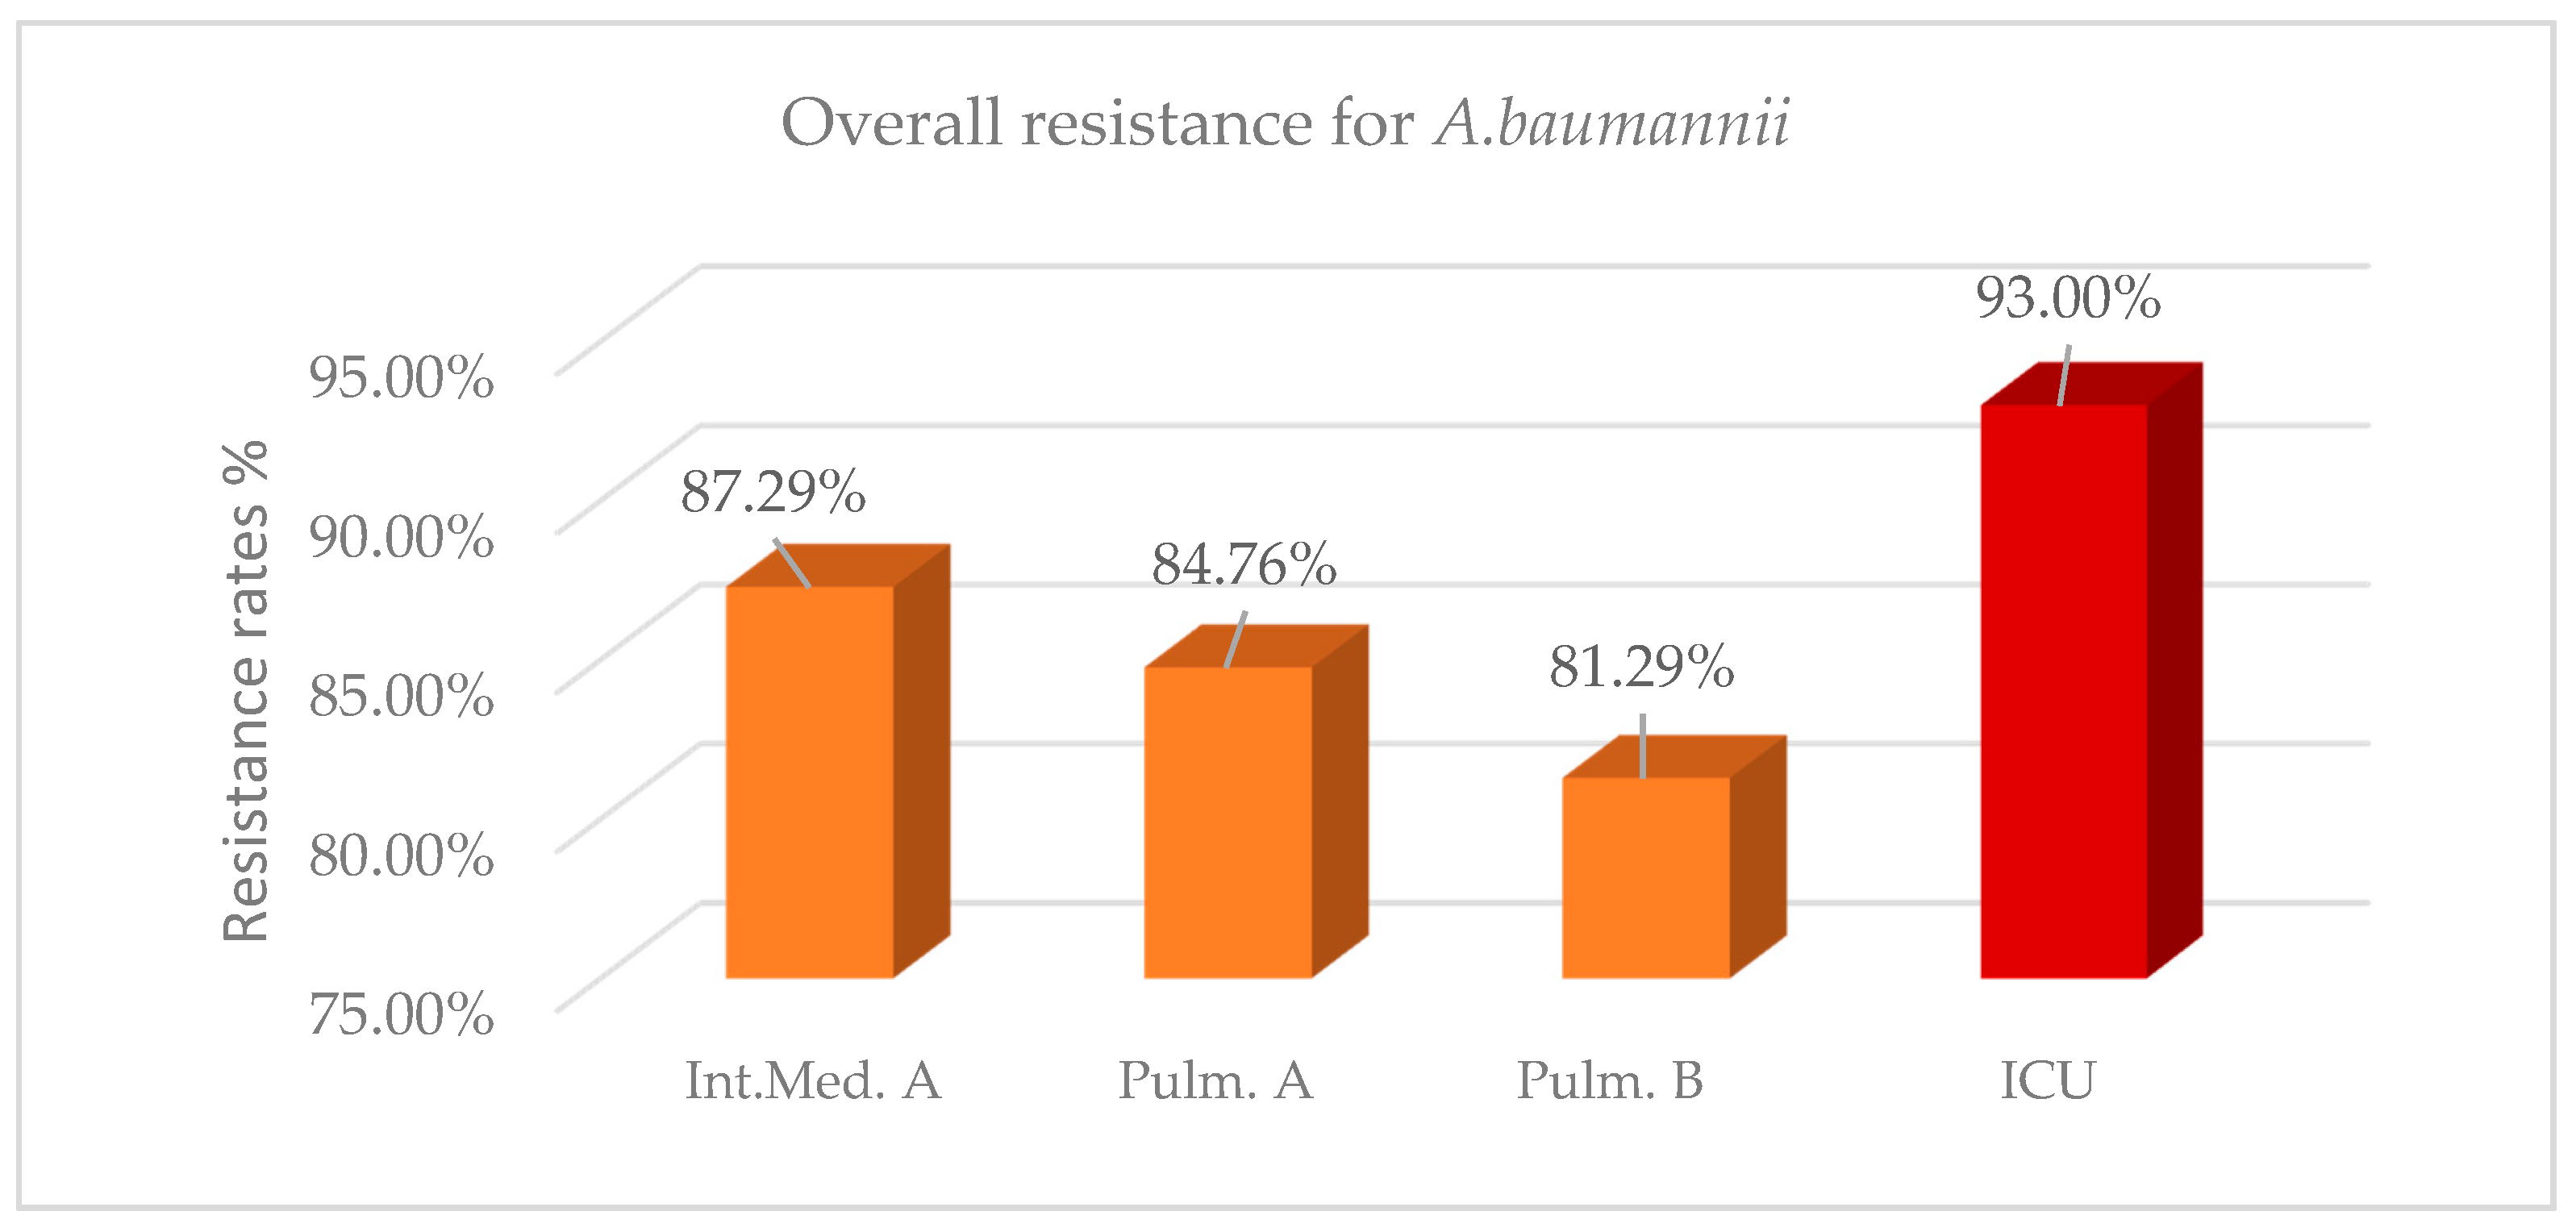
For the same 2-year period, overall resistance of
A. baumanii in the ICU was 93% (
Figure 2,
Table A4). A high resistance rate above 80% was also identified in the other three wards; however, it was significantly lower compared with the ICU in the three last semesters, while in the first semester a nonsignificant difference was reported. As shown in
Table A4, mean differences of resistance between ICU isolates and non-ICU isolates were statistically significant and ranged from 5.71% to 11.72%. In 2018, a decrease in the number of isolates with a slight decrease in the resistance rates was observed in the wards, while there was an increase in both the number of isolates and resistance rate in the ICU. Recent studies [
15,
16,
17] have also shown a high prevalence of
A. baumanii, ranging from 87% to 95.9%. As shown in
Table A5, both ICU isolates and isolates from the wards of
A. baumannii present an extremely high resistance to most antibiotics over 80%, with the lowest percentage reported to colistin. Colistin resistance in the ICU was 53.37%, while in the wards was on average 31.40%. Comparing the resistance of
A. baumannii to specific antibiotics between ICU and non-ICU isolates, the highest mean difference of resistance was observed to colistin (up to 27.23%). On the other hand, no significant difference concerning
A. baumannii resistance to ampicillin/sulbactam, trimethoprim/sulfomethoxazole (TMP/SMX), and minocycline was found between ICU isolates and isolates from the wards (
Table A6).
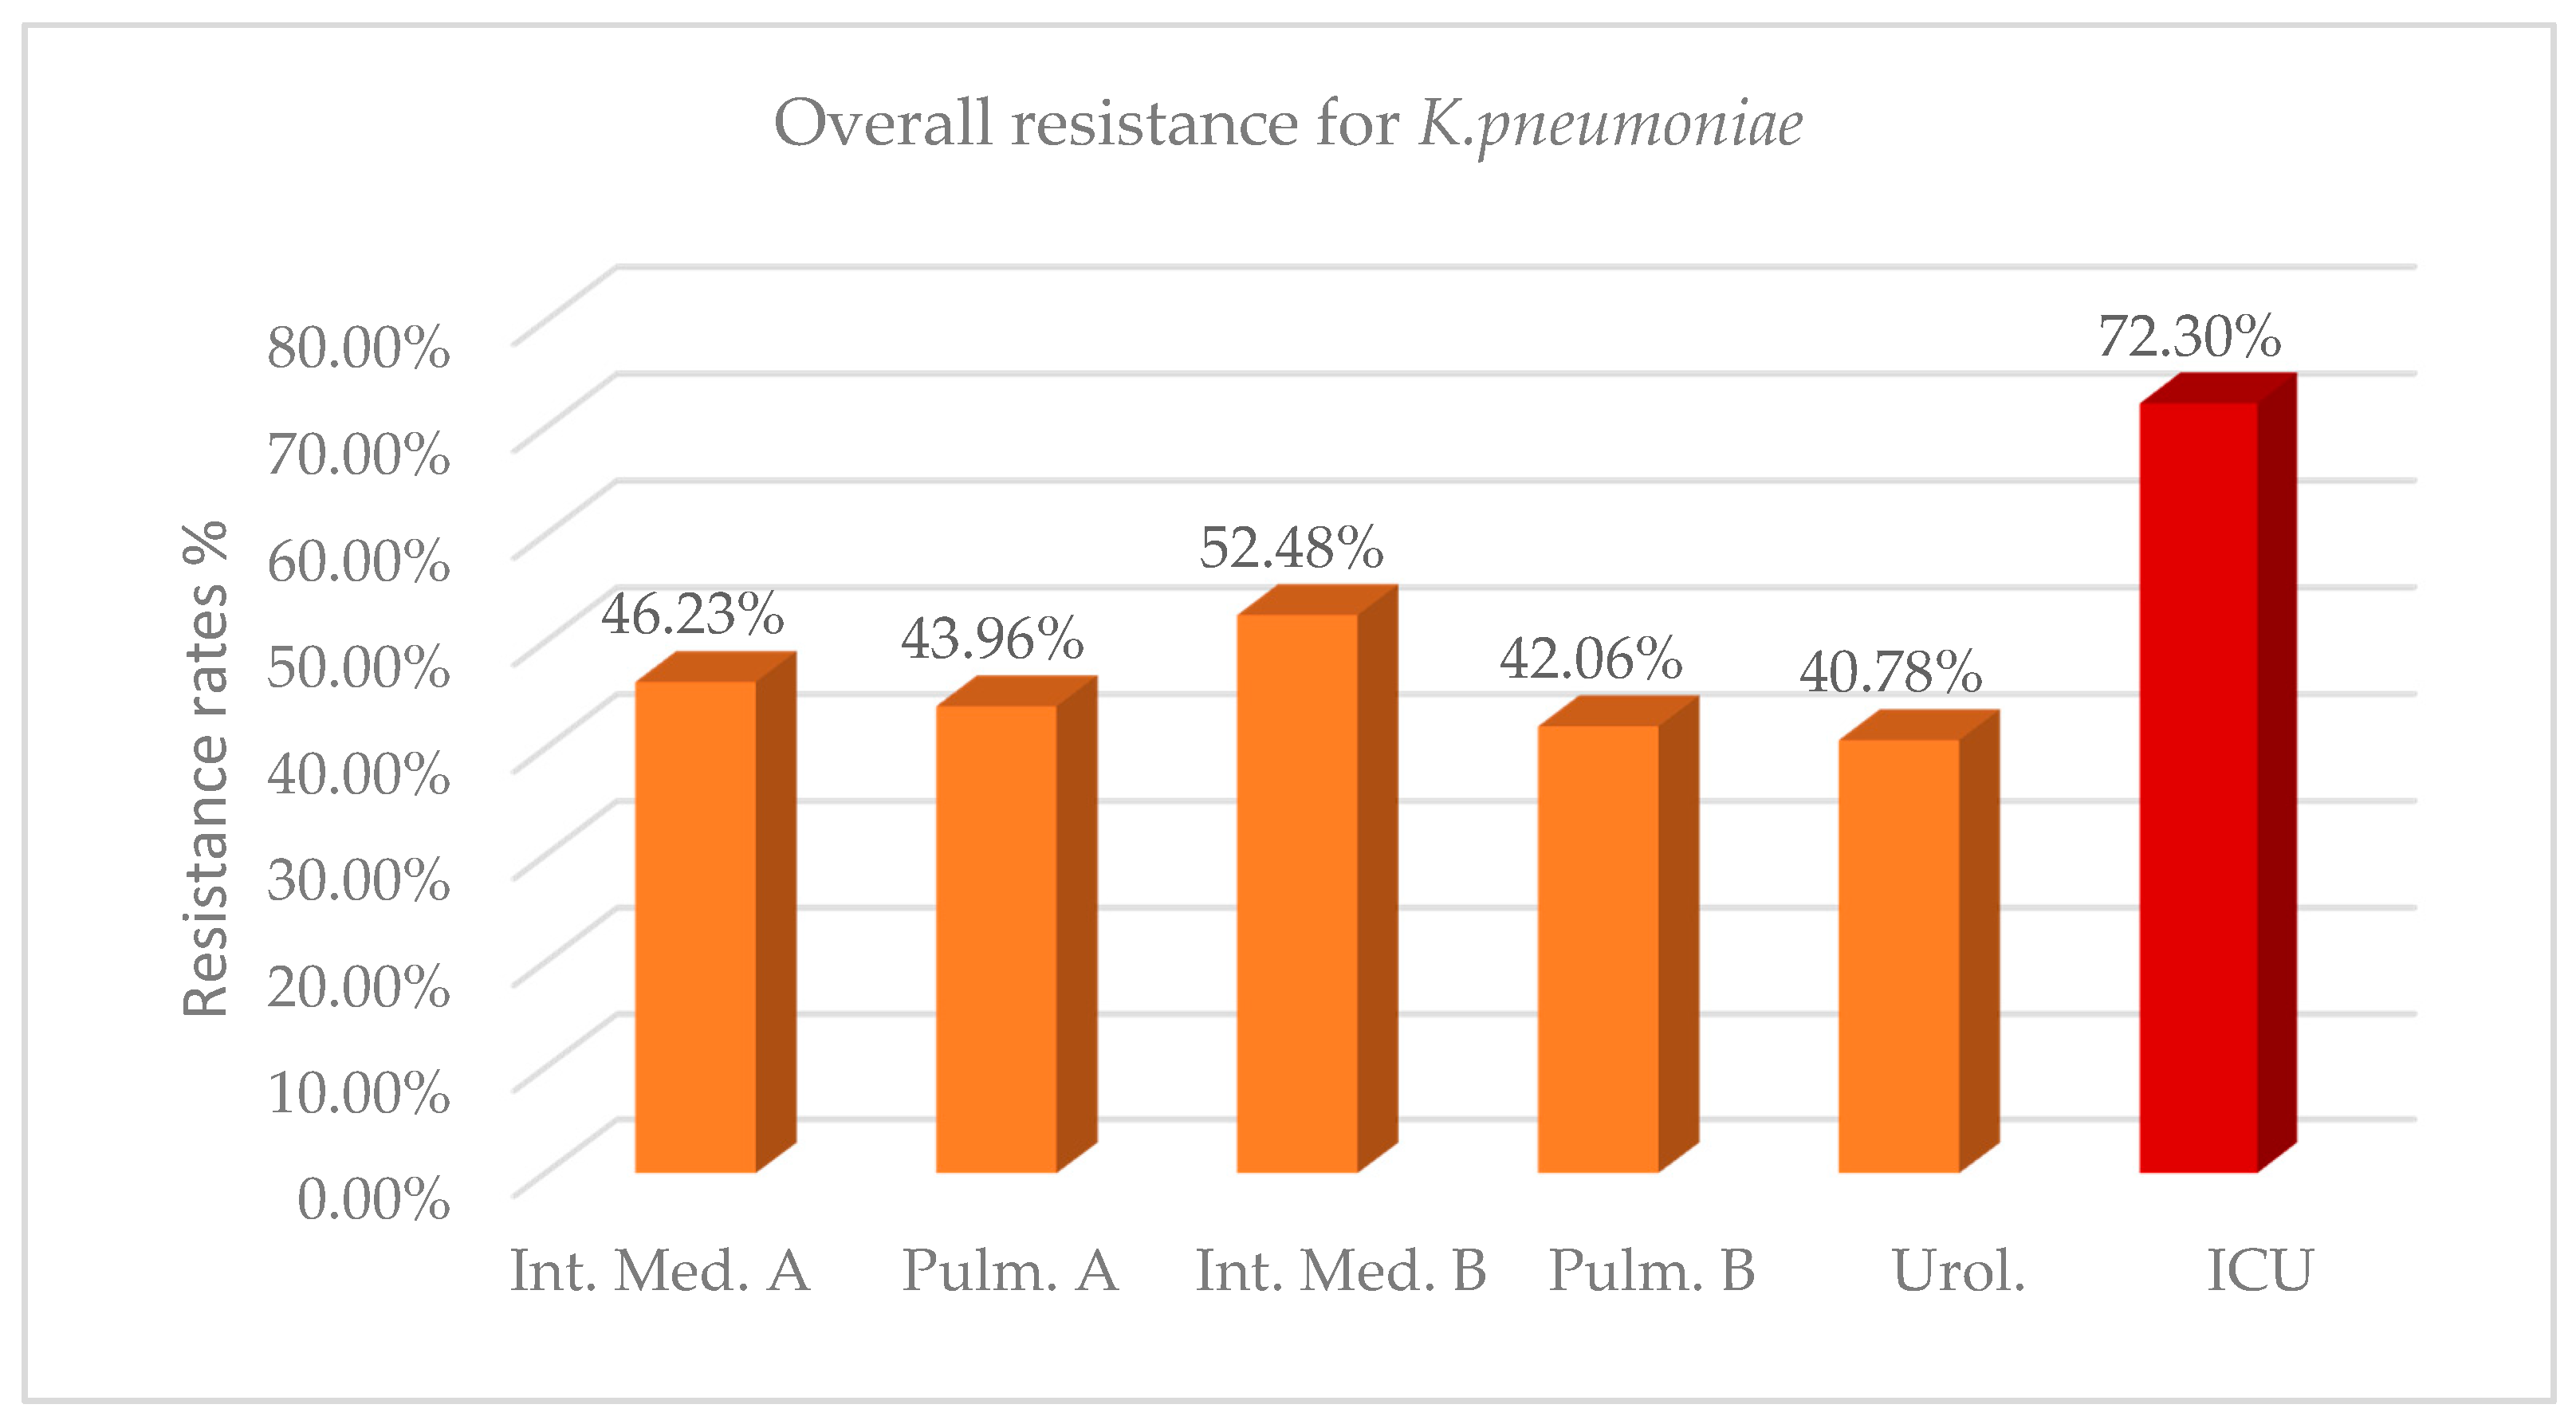
Regarding
K. pneumoniae strains, overall 2-year resistance in the ICU environment was on average 72.30% (
Figure 3,
Table A7). This rate was significantly higher than the resistance rate observed in the other wards, with mean differences ranging from 19.82% to 31.52% in the 2 years (
Table A7). As it concerns the number of isolates, in 2018 compared with 2017, there was a significant decrease in the wards, except for ICUs and the urology department, where an increase was reported. In 2018, a significant reduction on the antibiotic resistance of
K. pneumoniae isolates was captured in both the ICU and non-ICU environments, except in the urology department, where there was a slight increase. This fact could be attributed to the effectiveness of the surveillance measures implemented in our hospital or the antibiotic policy. A further long-term survey of the resistance profile is required to extract safe conclusions. Regarding the resistance of ICU isolates of
K. pneumoniae to specific classes of antibiotics, the highest resistance rate was reported to older beta lactams/beta lactamase inhibitors (amp/sulb 85.98%), fluoroquinolones (79.04% to 83.04%), carbapenems (78.31% to 81.44%) and third generation cephalosporins (80.21% to 81.61%). Less than 40% of ICU isolates are resistant to colistin, versus an average rate of 13.83% reported in non-ICU isolates (
Table A8). The low resistance rate of ICU isolates to tigecycline (3.57%) makes it a suitable antibiotic option for the treatment of certain
K. pneumoniae infections. Statistically significant higher levels of resistance to most classes of antibiotics were noted in ICU isolates of
K. pneumoniae compared with isolates from the wards, with the highest difference reported to carbapenems at up to 48.86% (
Table A8 and
Table A9).
In our study, the maximum overall antibiotic resistance in ICUs was reported for
Acinetobacter spp. (93.00%), followed by
Klebsiella spp. (72.30%) and
Pseudomonas spp. (49.03%). In a similar study [
18], the antimicrobial resistance rates were 82.10%, 52.40%, and 56.90%, respectively.
4. Materials and Methods
This is a cross-sectional study conducted in a public tertiary hospital in Greece, based on data from the Microbiology Department.
4.1. Sample-Source of Isolates
During the 2-year period (January 2017 to December 2018) a total of 888 clinical samples from 345 ICU patients and 5086 samples from 4090 patients hospitalized in other wards were included in this study and proceeded by the Microbiology Laboratory according to established protocols [
19,
20,
21]. The samples included blood, tracheobronchial aspirates, bronchoalveolar lavage fluid, urine, skin, wounds and soft tissue specimens, intravascular catheters and pleural and peritoneal fluid. Blood cultures were incubated in the BacT/Alert system (bioMerieux, Marcy-l’Étoile, France). Isolation and identification of pathogens were carried out according to classical microbiological procedures [
22].
4.2. Antimicrobial Susceptibility Data
Antimicrobial susceptibility testing was performed by the MicroScan system (Siemens, Munich, Germany), according to CLSI guidelines [
23,
24] and the results were confirmed, when necessary, using a gradient MIC (minimum inhibitory concentration) determining method following the manufacturer’s guidelines (e.g., the E-test bioMerieux, Solna, Sweden). The MICs of colistin were retested via microtiter plates (SensiTestColistin, Liofilchem, Roseto degli Abruzzi, Italy). Sensitivity and resistance breakpoints for the antibiotics were determined according to CLSI interpretive criteria [
23,
24] and for tigecycline according to Eucast criteria [
25].
Escherichia coli ATCC 25922 strain and
Pseudomonas aeruginosa ATCC 27853 were used as quality control strains for susceptibility testing.
The phenotypic detection of the production of extended-spectrum beta-lactamases (ESBL) was performed by the double disk synergy test (DDST) according to CLSI guidelines [
23]. Metallo-beta-lactamases (MBL) and carbapenemases (KPC) were detected phenotypically by (a) the modified Hodge test [
23], (b) the combined disk test, with a meropenem (MER) disk alone, a MER disk plus phenyl boronic acid (PBA), a MER disk plus EDTA and a MER disk plus PBA and EDTA (as described by Tsakris et al. [
26]) and (c) the NG CARBA 5 immunochromatographic assay, targeting KPC-, NDM-, VIM- and IMP-type and OXA-48-like carbapenemases following the manufacturer’s guidelines (data presented at 29th ECCMID 2019 [
27].
P. aeruginosa strains were tested phenotypically for MBL either by a combined disk test using imipenem (IPM) disk and IPM plus EDTA as described by Yong et al. [
28] or by IPM-EDTA double-disk synergy test (DDST) performed as described by Lee et al. [
29].
All strains that phenotypically produced more than one or no carbapenemases, the OXA producers and all those tested with NG CARBA 5, were subjected to PCR for
blaNDM,
blaVIM,
blaKPC, and
blaOXA-48 genes. They were also examined for the presence of the plasmid-mediated
mcr-1 gene for colistin-resistance (data presented at the 28th and 29th ECCMID 2019 [
27,
30]).
4.3. Study Design
This study included non-duplicate clinical isolates from different patients. All isolates with similar susceptibility patterns from a single patient were excluded. The resistance for P. aeruginosa was measured based on the following antibiotics: amikacin, aztreonam, cefepime, ceftazidime, ciprofloxacin, colistin, gentamicin, imipenem, meropenem, doripenem, piperacillin/tazobactam, tobramycin and levofloxacin. The resistance for A. baumannii was measured based on the following antibiotics: amikacin, ampicillin/sulbactam, cefepime, cefotaxime, ceftazidime, ciprofloxacin, colistin, gentamicin, imipenem, levofloxacin, meropenem, minocycline, tobramycin, trimethoprim/sulfamethoxazole, tetracycline and tigecycline. The resistance for K. pneumoniae was measured based on the following antibiotics: amikacin, amoxicillin/clavulanic acid, ampicillin/sulbactam, cefepime, cefotaxime, cefoxitin, ceftazidime, cefuroxime, ciprofloxacin, colistin, ertapenem, gentamicin, imipenem, meropenem, piperacillin/tazobactam, tetracycline, tobramycin, trimethoprim/sulfamethoxazole, levofloxacin, moxifloxacin and tigecycline.
Our research focuses only on the antibiotics mentioned above since there is an adequate number of samples for these for deducing reliable conclusions and there was a susceptibility testing for them in all four semesters. The wards that were included in this comparative study besides ICU were selected upon the adequate frequency of isolates in all four semesters.
4.4. Statistical Analysis
The overall 2-year and semester resistance rates of P. aeruginosa, A. baumannii and K. pneumoniae clinical isolates against individual antimicrobial agents were analyzed. Differences between means regarding the resistance of the three bacteria mentioned above between ICU and other wards were determined by univariate analysis of variance and Tukey’s multiple range tests. The relevant data were analyzed by the two years and by each semester separately. A significance level of p < 0.05 was used.

 ,
, 
