Article

Comparison of Environmental Microbiomes, Resistomes and Plasmidomes from a Human Tertiary Hospital and Companion Animal Veterinary Hospital in London, UK

by
Linzy Elton
1,2,*,
Stuart Lutimba
3,
Alonso Dupuy Mateos
4,
Siân Marie Frosini
5,
Rosanne Jepson
6,
Alan Williams
7,
Shanom Ali
2,8,
Jelena Heaphy
9,
Vicky Pang
9,
Liam Commins
9,
Conor O’Brien
9,
Özge Yetiş
2,8,
Estelle Caine
8,
Imogen Ward
8,
Monika Muzslay
8,
Samuel Yui
8,
Kush Karia
8,
Ellinor Shore
8,
Sylvia Rofael
2,10,
Damien Mack
2,11,
Claire Atkinson
3,
Timothy D. McHugh
2 and
Emmanuel Q. Wey
2,11
add Show full author list remove Hide full author list
1
Centre for Innovation in Genomics and Microbiome Sciences, University of West London, London W5 5RF, UK
2
UCL Centre for Clinical Microbiology, University College London, London NW3 2QG, UK
3
School of Applied and Health Science, London South Bank University, London SE1 0AA, UK
4
Independent Veterinary Surgeon, London, UK
5
Pathobiology and Population Sciences, Royal Veterinary College, Hawkshead AL9 7TA, UK
6
Clinical Science and Services, Royal Veterinary College, Hawkshead AL9 7TA, UK
7
Department of Infection Sciences, Health Services Laboratories, London WC1H 9AX, UK
8
Environmental Research Laboratory, University College London Hospitals NHS Foundation Trust, London NW1 2PG, UK
9
Royal Free London Hospitals NHS Foundation Trust, London NW3 2QG, UK
10
Faculty of Pharmacy, Alexandria University, Alexandria 21521, Egypt
11
Department of Infection, Royal Free London NHS Foundation Trust, London NW3 2QG, UK
*
Author to whom correspondence should be addressed.
Antibiotics 2026, 15(6), 568; https://doi.org/10.3390/antibiotics15060568
Submission received: 17 April 2026 / Revised: 26 May 2026 / Accepted: 28 May 2026 / Published: 2 June 2026
(This article belongs to the Special Issue Genomic Surveillance of Antimicrobial Resistance (AMR))

Abstract

Background: Human hospitals and veterinary centres are hotspots for resistant microbes and plasmids, and metagenomic sequencing offers an agnostic insight into microbiomes, resistomes, and mobilomes, informing strategies for reducing AMR spread. Methods: Environmental samples, including wastewater and surface swabs, were taken from a tertiary human hospital ward (36 samples) and a companion animal veterinary hospital (48 samples) in London. Whole DNA was extracted and metagenomic sequencing undertaken using Oxford Nanopore Technologies’ MinION. Data were analyzed for microbiomes, resistomes and mobilomes and compared. Results: Microbial diversity analyses highlight higher richness across human hospital (HH) environmental samples, but more evenness in veterinary hospital (VH) environmental samples. Diversity showed distinct microbial communities in the HH and VH samples. There were significantly more total antimicrobial resistance gene (ARG) types (p < 0.0001) in the environmental HH samples compared with the environmental VH samples. There was a significantly higher mean number of Enterobacteriales plasmid types (p ≤ 0.0001) in the HH samples. There were significantly more total Gram-Positive plasmid types (p ≤ 0.0001) in the VH samples. Discussion: This research highlights the presence of human and animal pathogens, ARGs and mobile genetic elements in clinical environments, underscoring the importance of multisectoral surveillance. Integrating taxonomic, resistome, and mobilome analyses provides a better understanding of the potential for AMR dissemination at the human–animal–environment interface. This provides insights relevant for the development of targeted surveillance and mitigation strategies within a OH framework.

1. Introduction

Antimicrobial resistance (AMR) is a critical global health challenge, threatening the effective treatment of infectious diseases across all One Health sectors [1,2]. The spread of AMR is driven by a complex interplay of horizontal gene transfer among microbial communities, the movement of resistant organisms across ecological boundaries, and the selective pressures from antimicrobial use in clinical, veterinary and agricultural settings [3,4,5,6,7].
The transmission of AMR is not limited to direct contact between humans and animals, but involves environmental compartments such as wastewater, soils, and surfaces across urban, agricultural and natural systems [8,9,10,11,12]. These environments may serve as both sinks and sources of AMR organisms and mobile genetic elements [2]. Understanding how plasmids, antimicrobial resistance genes (ARGs), and organisms differ between these different environments, and how they interact in shared environments, is critical for providing evidence for infection prevention and control (IPC) interventions to limit the spread of AMR [13].
Human hospitals (HHs) and veterinary hospitals (VHs) are particularly important places for selection pressure, which drives development of AMR, as they are both centres in which antimicrobial agents are routinely used. They are also both important junctions for potential AMR and multi-drug-resistant organism (MDRO) transmission, and we are becoming increasingly aware of the multi-directional risk factors associated with hospital inpatient stays and companion animal ownership [7,14,15,16,17,18,19]. Wastewater and environmental contamination from these settings may spread pathogens and ARGs within these settings and beyond into wider ecosystems, highlighting the need for integrated surveillance approaches [20,21].
Genomic technologies can provide enhanced information for the surveillance of AMR and pathogens. Traditional culture-based approaches can be less sensitive and may fail to capture the full diversity of microbial communities and ARGs [22,23,24]. Other molecular techniques, such as polymerase chain reaction (PCR), are more sensitive than phenotypic methods, but are limited in the specificity of the primers, probes and sequences targeted and may not distinguish between live and dead cells, thus preventing assignment of viable transmission/acquisition risk in clinical settings [25]. Genomic sequencing enables high-resolution characterization of pathogens, resistomes and plasmidomes. Furthermore, metagenomic analysis provides a culture-independent method to profiling microbial communities by sequencing total extracted DNA. This approach is valuable in One Health AMR surveillance, as the focus lies not only on pathogens of direct clinical concern but also on the wider resistome and mobilome contributing to the persistence and transmission of AMR [26,27]. The use of long read platforms such as Oxford Nanopore Technologies (ONT) are especially advantageous for metagenomics, as it allows higher-resolution differentiation between genetically similar species by spanning longer sections of genome [28].
Metagenomic sequencing has been increasingly employed to monitor AMR in wastewater, agriculture, and natural ecosystems, providing insights into both local and global dynamics [26,27,29,30,31,32]. However, multisectoral, comparative analyses of environmental resistomes remain limited in number. HHs present hubs for drug-resistant pathogens associated with human infections, while companion animal VHs are central to domestic animal health and may be a major site of antimicrobial consumption [33]. By comparing environmental metagenomes, resistomes and mobilomes from these two contexts we seek to detect similarities and differences in microbial community compositions, ARG prevalence, and plasmid diversity, which may reveal potential routes of cross-sectoral transmission [13].
This study aimed to use metagenomic sequencing to compare and contrast the species, ARGs and plasmids present in environmental samples collected from a companion animal VH and a tertiary HH in the same geographical area of London.

2. Results

2.1. Sample Recovery

A total of 36 clinical and 48 metagenomic VH environmental samples were sequenced. For the HH environmental samples, 17/36 (47.2%) were sponge swabs, 6/36 (16.6%) were stick swabs and 13/36 (36.1%) were wastewater samples. For the VH samples 33/48 (68.7%) were sponge swabs, 7/48 (14.5%) were stick swabs, 5/48 (10.4%) were wastewater samples and 3/48 (6.2%) were non-potable water samples. Sponge swab, stick swab and wastewater samples were compared for species and ARG recovery. There were no significant differences between the HH and VH sample types when number of species recovered was compared using the t-test (HH sponge mean = 71.8, standard deviation (SD) = 47.0, VH sponge mean = 52.1, SD = 94.9, HH wastewater mean = 232.6, SD = 140.6, VH wastewater mean = 93.8, SD = 98.6, HH stick mean = 88.2, SD = 32.8, VH stick mean = 35.7, SD = 48.8). Significantly more ARGs were recovered from the HH sponge swabs (mean = 37.3, SD = 36.1) compared with the VH sponge swabs (mean = 15.2, SD = 19.3) (p = 0.0080). There was no significant difference in ARG recovery between the HH and VH stick swabs (mean = 57.5, SD = 46.4 and mean = 17.3, SD = 12.5 respectively) or wastewater (mean = 55.9, SD = 36.6, mean = 19.2, SD = 24.3 respectively) (Figure 1).

2.2. Species

2.2.1. HH Samples Show a Greater Species Variation than VH Samples

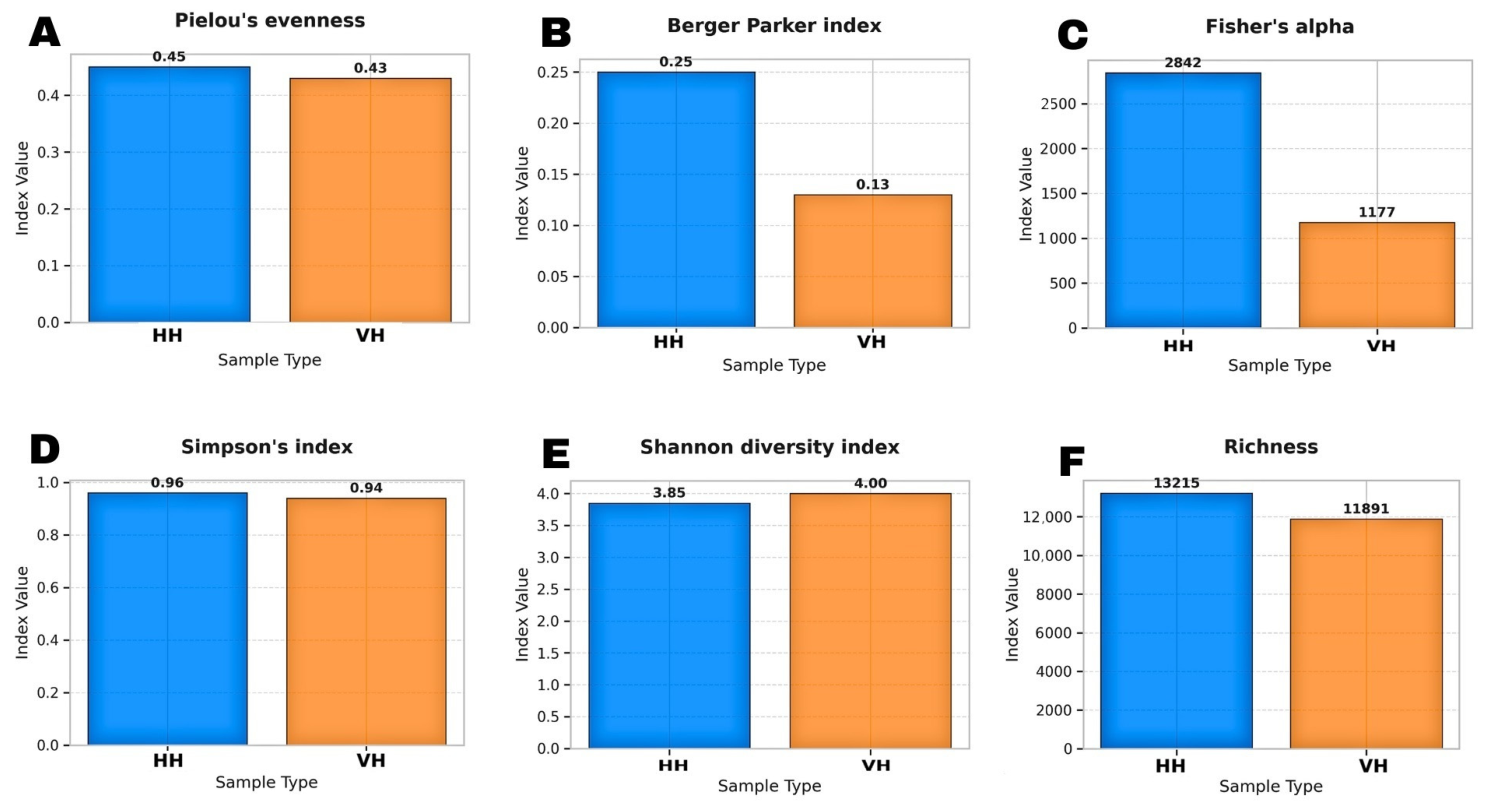
Samples that contained at least one microbial genus (including bacteria, viruses, fungi, or protozoa) were included in the analysis. Overall microbial diversity was higher in the HH metagenomic samples when measured using the Shannon diversity index, which considers both the number of species and how evenly they are distributed. The results indicate that HH and VH samples have different microbial community structures. The HH sample had a much higher Fisher’s alpha and greater species richness, meaning they likely contained more distinct microbial species overall. By contrast, the VH samples had a slightly higher Shannon diversity index, suggesting their microbial communities may be more evenly balanced in terms of species abundance. The lower Berger–Parker index in the VH samples also indicates that no single species strongly dominated the communities compared with the HH group. Overall, HH samples showed greater dominance (Berger–Parker index) and higher estimated richness (Fisher’s alpha) (Figure 2).

2.2.2. Distinct Microbial Communities Were Identified for HH and VH Samples

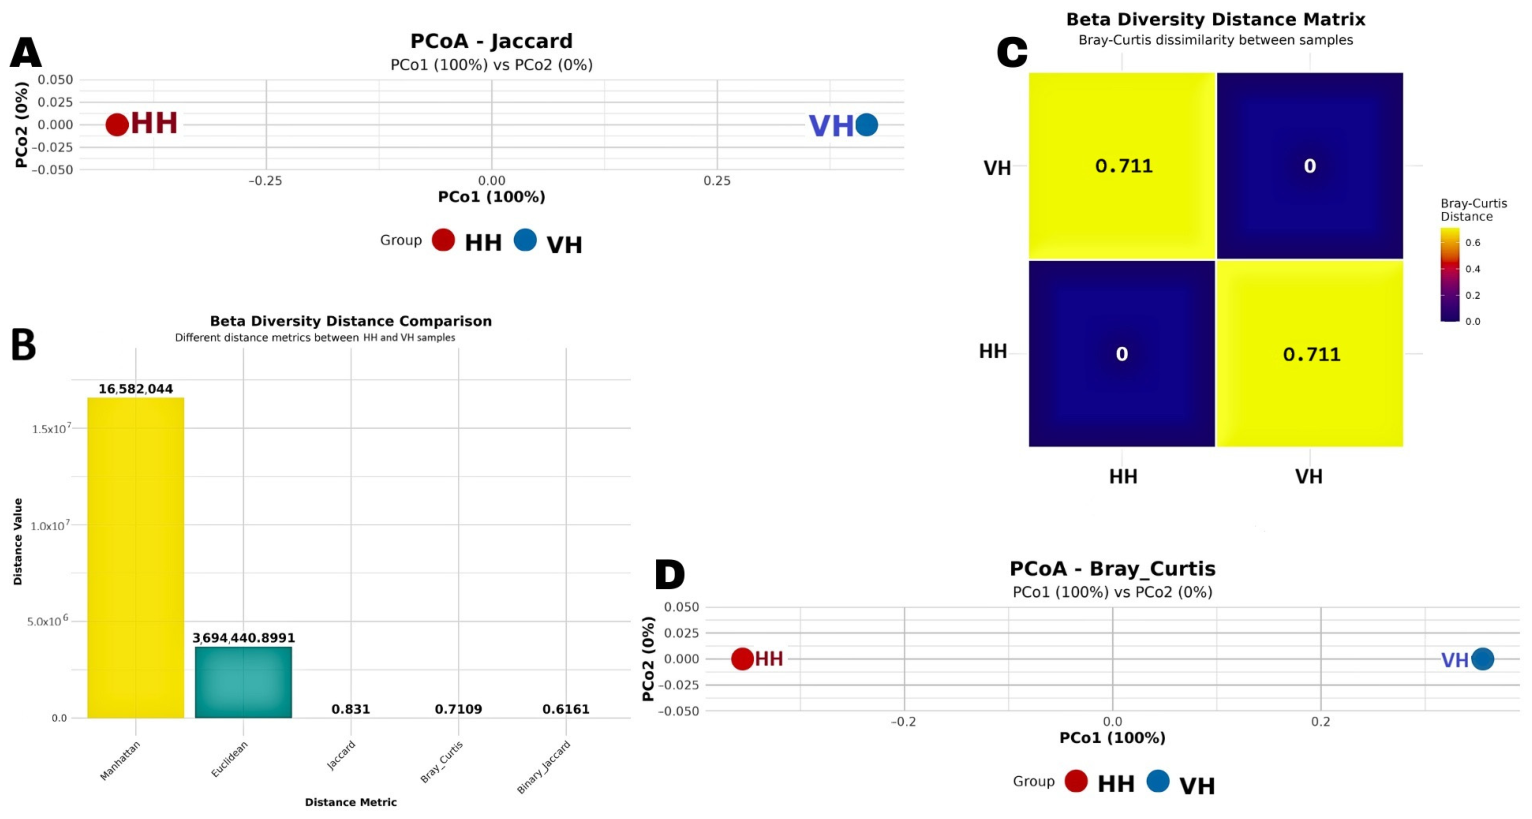
Principal Coordinates Analysis (Principal Coordinates Analysis, PCoA) using the Jaccard distance (Figure 3A) showed a complete separation between the HH and VH samples along the first principal coordinate (PCo1), which explained 100% of the variation. This indicates that the two samples contained very different sets of microbial taxa. A complementary assessment using Bray–Curtis dissimilarity, which also considers species abundance, produced a high dissimilarity value (0.7) (Figure 3C) between the HH and VH samples, confirming that differences extended beyond taxonomic presence to include major differences in their relative abundances.
Both samples exhibited zero within-group dissimilarity, as expected for single-sample comparisons, but the between-group difference indicates that the overall microbial compositions were strongly distinct. Comparative analysis of multiple distance metrics (Figure 3B) further supported this result. Manhattan and Euclidean distances showed the largest distances, reflecting substantial cumulative abundance differences between taxa; presence/absence metrics, including Jaccard and binary Jaccard, remained comparatively lower but still showed considerable separation. Bray–Curtis values were also high, confirming that differences in species abundance contributed strongly to the overall dissimilarity. Together, these results show that the HH and VH samples differed both in which taxa were present and in their abundance patterns. The Bray–Curtis PCoA plot (Figure 3D) mirrored the patterns observed with Jaccard distances. The HH and VH samples separated along PCo1, which explained 100% of the variation. The tight clustering and lack of overlap suggests very limited ecological similarity between the two environments.
Alpha-diversity analyses demonstrated that the HH samples had a higher richness (Fisher’s alpha, observed species), while the VH sample exhibited slightly higher Shannon diversity, indicative of a more even taxonomic distribution. However, these within-sample measures do not indicate similarity between communities. The pronounced beta-diversity separation indicated that the HH and VH samples contain different microbial communities overall, both in terms of taxa present and relative abundances. HH samples appear to contain more taxa but with greater dominance by one or a few species (reflected in the Berger–Parker index), whereas the VH samples are more evenly balanced without a strongly dominant taxon.

2.2.3. There Was Multi-Kingdom Diversity in the VH Group Microbiome

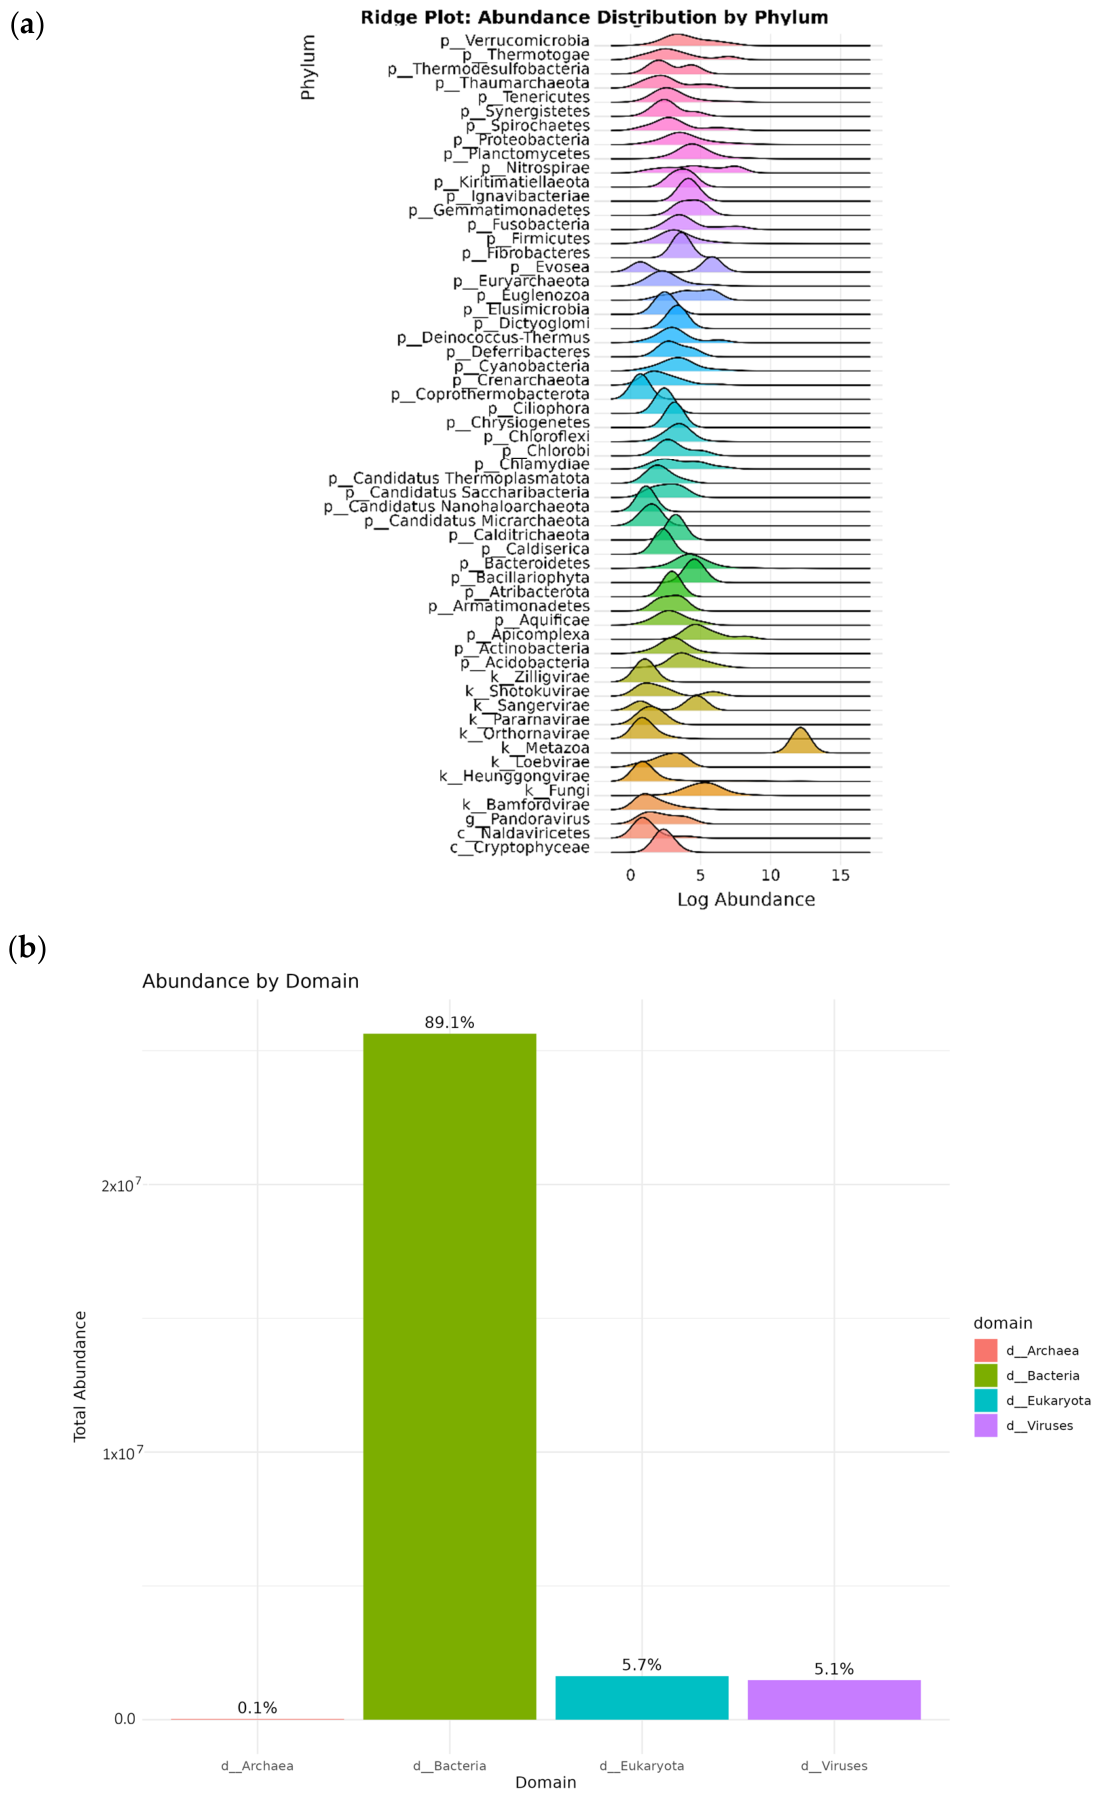
The taxonomic composition of the VH samples revealed a complex and highly diverse microbial community dominated by bacteria. The ridge plot (Figure 4a) displays the distribution of log-transformed abundances across all detected phyla, illustrating a wide range of evolutionary groups. Several bacterial phyla demonstrate clear abundance peaks. Bacteria accounted for 89.1% of total abundance (25,636,020 reads), reflecting their dominance across communities. Eukaryota (5.7%) and viruses (5.15%) form smaller but notable proportions, representing a mixture of fungal, protist, metazoan, and viral taxa, highlighting the multi-kingdom composition of the VH microbiome (Figure 4b). Archaea contributed 0.1% of total abundance (25,551 reads) (Figure 4a).

2.2.4. HH Microbiomes Exhibited Less Diversity than VH Microbiomes

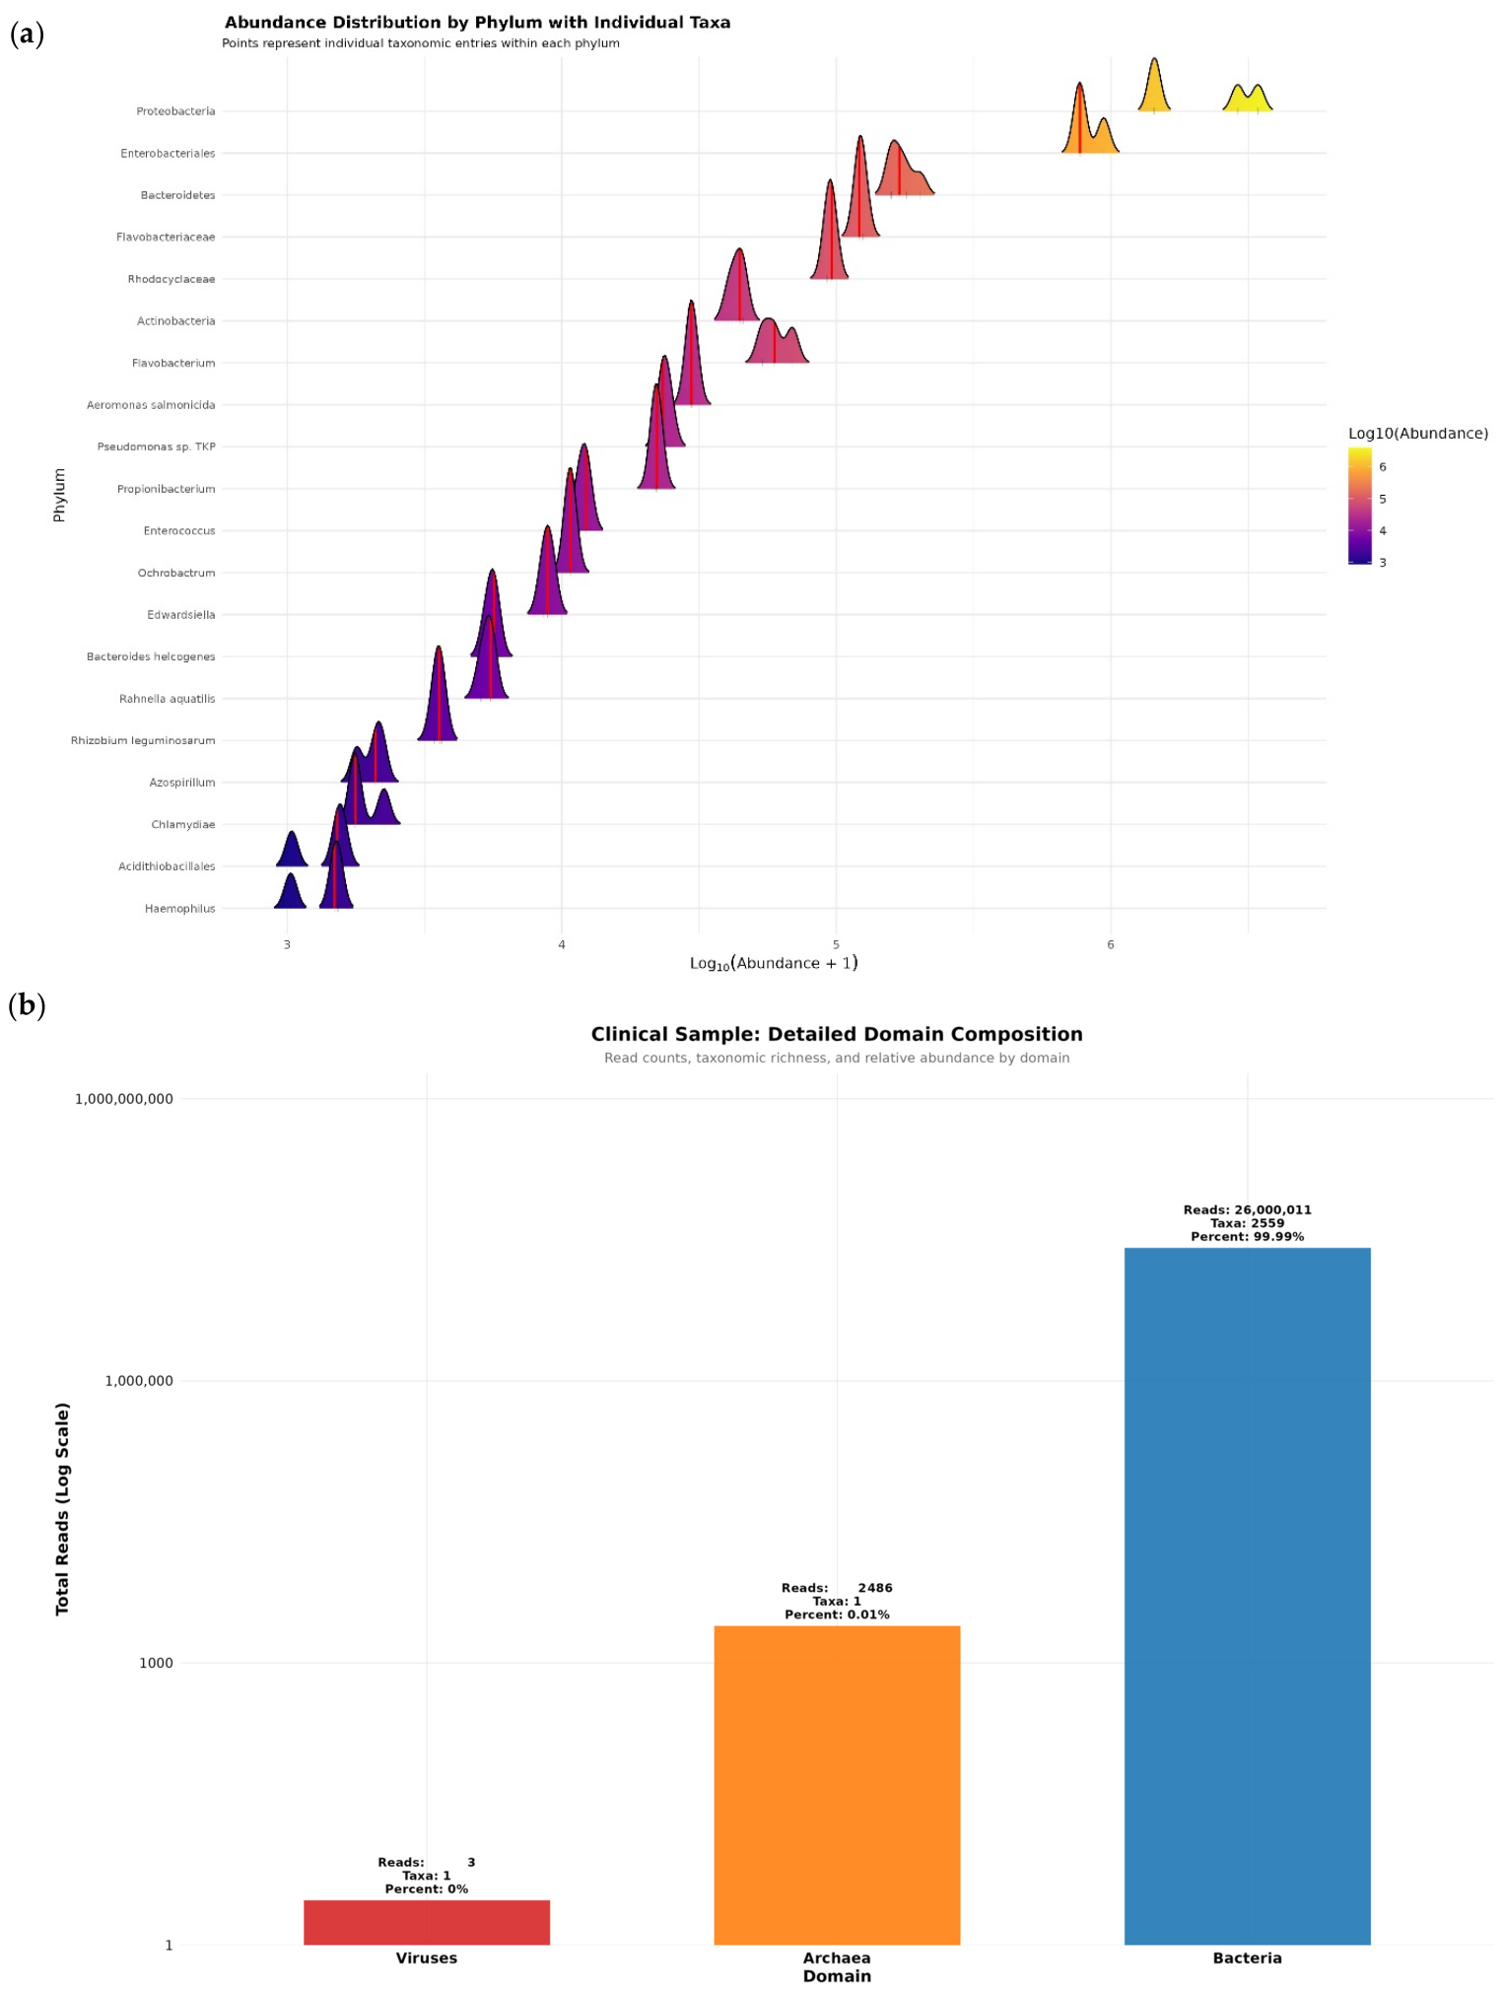
The HH samples displayed strongly uneven microbial community structures dominated almost exclusively by bacteria. Figure 5a presents the abundance distribution of taxa within each phylum on a log scale, highlighting a small number of bacterial groups with very high abundance. Figure 5b summarizes the composition at the domain level. Bacteria constitute 26,000,011 reads, representing nearly 100% of the total classified sequences. Archaea were detected at very low levels (2486 reads; <0.01%), while viruses were nearly absent (3 reads; <0.01%). Beta diversity patterns showed clear separation of the HH samples, driven by the high abundance of clinically associated bacterial taxa and the minimal presence of archaeal or viral domains. Although the HH and VH samples shared some bacterial taxa, the HH community differed markedly in both abundance patterns and overall evenness.

2.2.5. Notifiable, Reportable and Zoonotic Species Prevalence

The metagenomic samples were analyzed for notifiable human and veterinary pathogens, as well as the list of zoonotic diseases found in the UK [34,35,36]. Table 1 outlines the species found and the percentage of samples from the HH and VH samples they were found in. The VH samples had an average of 0.4 notifiable or zoonotic species (SD = 0.6), whilst the HH samples had an average of 0.9 notifiable/zoonotic species (SD = 1.2).

2.3. AMR

2.3.1. Total Number of ARGs and Environmental Stressor Resistance Genes Are Higher in HH Samples

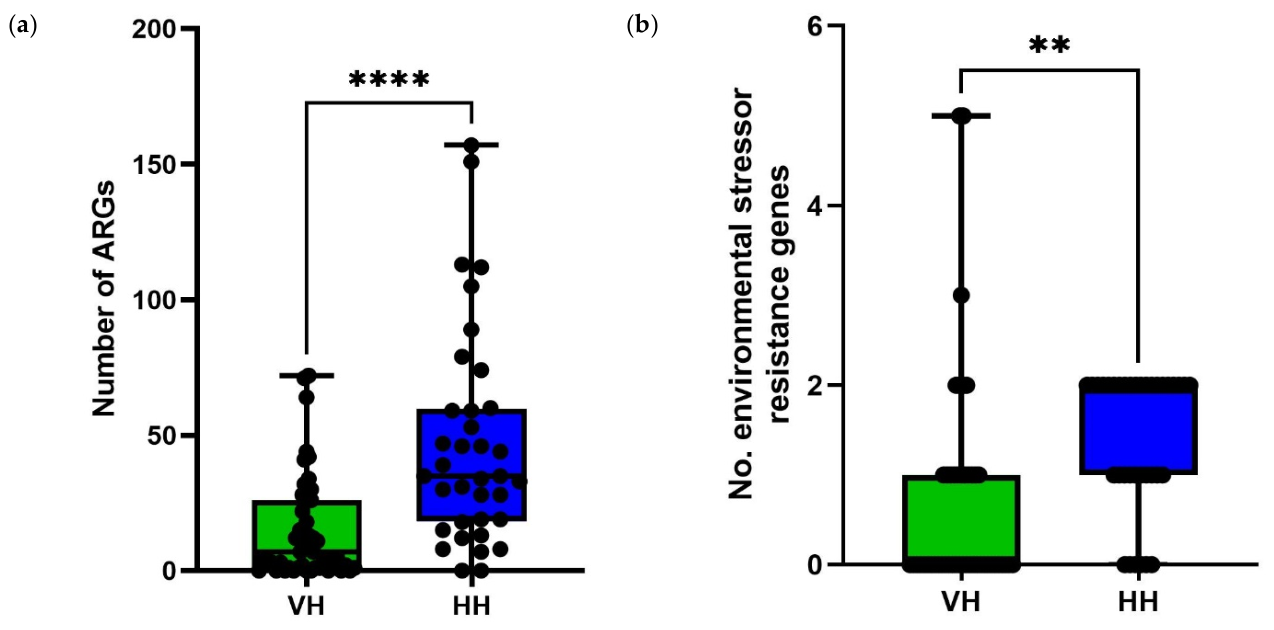
When the total number of ARGs was compared between the HH (mean = 47.4, SD = 39.4) and VH (mean = 15.0, SD = 18.9) samples, the HH samples showed significantly higher numbers (p < 0.0001), using Welch’s t test (Figure 6a). When the total number of environmental stressor resistance genes was compared between the HH (mean = 1.4, SD = 0.8) and VH (mean = 0.7, SD = 1.2) samples, the HH samples showed significantly higher numbers (p = 0.0010), using Welch’s t test (Figure 6b) [37,38].
ARGs and environmental stressor resistance genes were broken down by the class of antibiotic or stressor they caused resistance to. The highest number of individual/unique genes in class for VH were β-lactams (67 genes), aminoglycosides (44 genes) and tetracyclines (36 genes). For HH these were β-lactams (243 genes), aminoglycosides (91 genes) and sulfonamides (32 genes). The cumulative number of genes describes the number of individual genes multiplied by the number of times they were identified across all samples for VH and HH samples. For the VH samples, the highest cumulative number of genes in a class were the β-lactams (615 genes), aminoglycosides (479 genes) and sulfonamides (274 genes). For the HH samples, the highest cumulative number of genes in a class was the β-lactams (161 genes), aminoglycosides (130 genes) and sulfonamides (82 genes) (Table 2). Whilst HH samples often had the highest number of individual genes within a class, the VH samples had the highest number of cumulative genes within a class.

2.3.2. Significantly Higher Numbers of High Risk ARGs Were Identified Across HH Samples

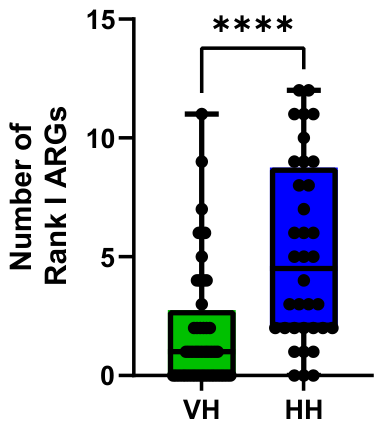
High risk ARGs, as defined by Zhang et al. (2021), were compared using the t-test [39]. When total rank I ARGs were compared, there was statistical significance (p < 0.0001), with the HH samples having more total ARGs (mean = 5.1, SD = 3.8), than the VH samples (mean = 0.9, SD = 2.6). The HH samples also had significantly more Rank II ARGs (p = 0.0017), (mean = 0.8, SD = 0.8), compared with the VH samples (mean = 0.3, SD = 0.7) and significantly more Rank IV ARGs (p < 0.0001) (mean = 0.7, SD = 0.4). than the VH samples (mean = 0.2, SD = 0.4) (Figure 7).
For the VH samples, the mean number of ARGs was 1.9 (SD = 2.6). For the HH samples the mean number of ARGs was 5.1 (SD = 3.8). An overview of the number of samples each high risk ARG was identified in can be found in Table 3.

2.3.3. More ARGs Were Unique to HH Samples

Of the total 592 ARGs present in the metagenomic analysis, 125 (21.1%) were unique to the VH environment and 377 (63.7%) were unique to the HH environment. A total of 90 (15.2%) were found in both sets of samples. Of the total 15 environmental stressor resistance genes identified, eight (53.3%) were unique to the VH samples and three (20.0%) were unique to the HH samples, with three (20.0%) being identified in both sets of samples. When this was broken down into classes, it was found that resistance genes for five antibiotic classes were uniquely found in the HH samples: colistin, fosfomycin, rifamycins, ‘multiple classes’ (antibiotics that had multiple functions) and efflux pumps. A total of 77.2% of the β-lactam genes identified were unique to the HH samples. Resistance genes for one environmental stressor gene class, for peroxide resistance, were also uniquely found in the HH samples. Resistance genes for one antibiotic class, the glycopeptides (bleomycin), were found to be unique to the VH samples (Table 4). Detailed resistance gene identifications for the HH and VH samples can be found in Elton et al. (2024) and Elton et al. (2025) [40,41].

2.4. Plasmid Composition

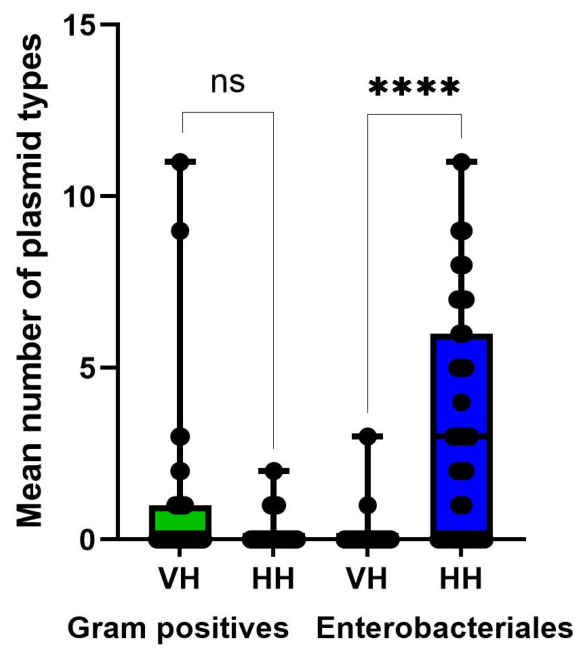
No significant difference was seen between the HH and VH samples for the Gram-Positive plasmid types. Significantly more Enterobacteriales plasmid types were found in the HH metagenomic samples (3.4 (SD = 3.3)) than the VH samples (0.1 (SD = 0.5)) (p < 0.0001). For an overview of plasmid type data, see Table 5. There was no significant difference in the number of Gram-Positive plasmid types found per sample when the HH samples were compared with the VH samples (Figure 8).

2.4.1. Enterobacteriales Plasmid Types Were More Common in HH Samples

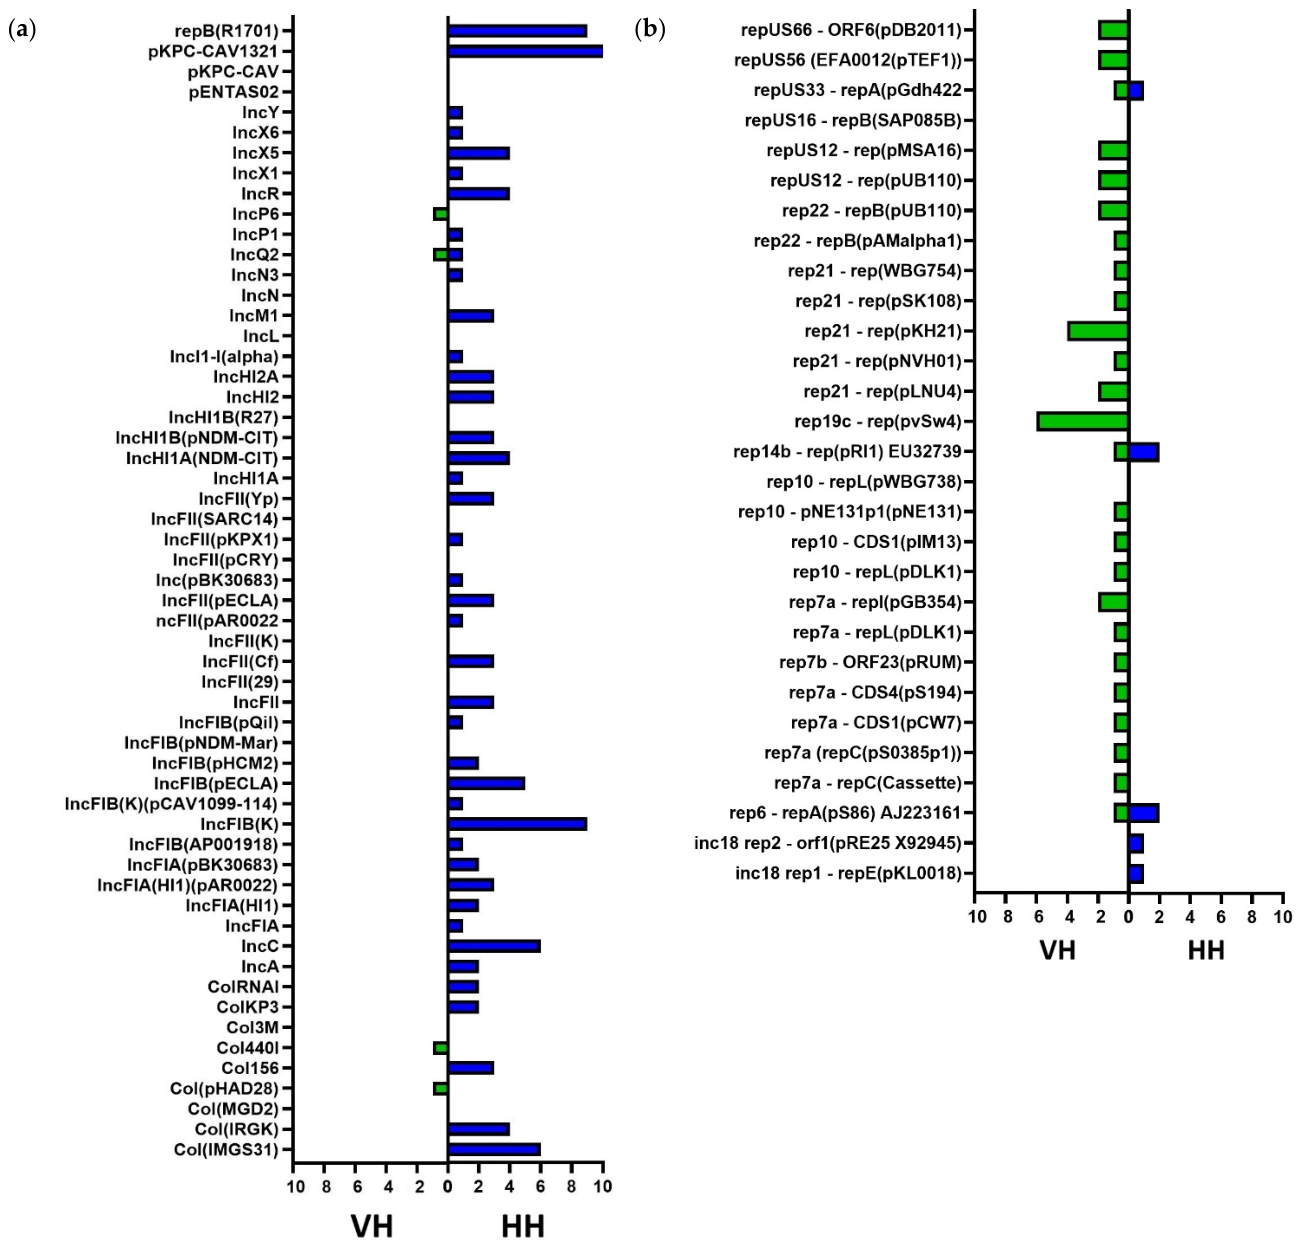
There were significantly more total Enterobacteriales plasmids identified in the HH samples compared with the VH samples (p < 0.0001), and significantly more Enterobacteriales plasmid types were unique to the HH samples compared with the VH samples (p < 0.0001). A total of four Enterobacteriales plasmid types were identified from the VH samples, of which one (IncP6) was unique and not found in the HH samples. Enterobacteriales plasmid types were identified from 2/48 (4.2%) samples and the mean number of plasmid types per sample was 0.1 (SD = 0.5). The most common plasmid types were Col(pHAD28), Col440I, IncQ2 and IncP6 (one sample each) (Figure 9a). A total of 120 Enterobacteriales plasmid types were identified from the HH samples, of which 119 were unique. Enterobacteriales plasmid types were identified from 24/36 (66.7%) samples and the mean number of plasmid types per sample was 3.4 (SD = 3.3). The most common plasmid types were pKPC-CAV1321 (12 samples), IncFIB(K) and repB(R1701) (nine samples each). IncQ2 was the only plasmid type found in both the VH and HH samples.

2.4.2. Gram-Positive Plasmid Types Were More Common in VH Samples

There were significantly more total Gram-Positive plasmids identified in VH samples compared with HH samples (p < 0.0001), and significantly more Gram-Positive plasmid types unique to the VH samples compared with the HH samples (p < 0.0001). A total of 40 Gram-Positive plasmid types were identified from the VH samples, of which 37 were unique and not found in the HH samples. Gram-Positive plasmid types were identified from 14/48 (29.2%) samples and the mean number of plasmid types per sample was 0.8 (SD = 2.1). The most common plasmid types were rep19c—rep(pvSw4) (six samples), rep21—rep(pKH21) (four samples), and rep7a—repI(pGB354), rep21—rep(pLNU4), rep22—repB(pUB110), repUS12—rep(pUB110), repUS12—rep(pMSA16), repUS56 (EFA0012(pTEF1) and repUS66—ORF6(pDB2011) (two samples each), all of which were unique to the VH samples (Figure 9b). For full plasmid details see [40,41].
A total of five Gram-Positive plasmid types were identified from the HH samples, of which two (inc18 rep1—repE(pKL0018) and inc18 rep2—orf1(pRE25 X92945)) were unique. Gram-Positive plasmid types were identified from 6/36 (16.7%) samples and the mean number of plasmid types per sample was 0.2 (SD = 0.5). The most common plasmid types were rep6—repA(pS86) AJ223161 and rep14b—rep(pRI1) EU32739 (two samples each). rep6—repA(pS86) AJ223161, rep14b—rep(pRI1) EU32739 and repUS33—repA(pGdh422) were all found in both the VH and HH samples.

3. Discussion

The HH and VH samples showed variation in the microbiomes, resistomes and plasmidomes identified, reflecting potential differences in HH and VH clinical practice and biology, but common themes were noted, highlighting IPC and surveillance implications across human and animal healthcare settings.

3.1. Microbiome

The diversity results indicate a greater number, and lower evenness, of species identified across the HH samples compared with the VH samples. This is perhaps unsurprising due to several factors, including selective pressures such as host immune responses and communal competition [42]. Human hospitals tend to have higher numbers of individuals entering the ward per day, including patients, healthcare workers and visitors. In the case of human hospitals, individuals within these sites are almost exclusively people (with the exception of, e.g., therapy animals); however, veterinary hospitals include several species, including humans, and therefore there is a greater chance of host species crossover [43]. Each individual brings their own microbiome, shedding bacteria and other organisms into the environment from their skin and hair, exhaled respiratory particles, clothing and footwear, and length of stay may affect the microbial load shed [44]. The greater the microbial introduction, the more species are likely to end up in the environment, and the routine use of disinfectants will affect the diversity of microbiomes in wastewater and on surfaces [45]. It is important to note that the sampled hospital ward was part of a tertiary hospital, so it was a larger institution than the companion animal veterinary hospital, which may account for some of the differences. It was also a single ward, rather than representative samples across the entire hospital, and intra-ward diversity is likely within both the HH and VH centres.
A greater variety of antimicrobial classes used in human hospitals, with more combination therapies and greater use of prophylactic antimicrobials [46]. This is likely to cause a greater disruption of patient microbiomes, the selection for resistant strains and a more rapid species turnover. This will result in a dynamic, constantly shifting microbial pool, increasing richness. The human tertiary hospital ward environment is also likely to be more complex than a companion animal veterinary hospital, with a greater number of medical devices and equipment, including more invasive items, each of which forms its own ecological niche to be filled by the microorganisms present [47].
As a result of this high richness but unevenness, fewer, more dominant pathogens could drive infections within the human hospital setting. Monitoring of the microbial community for shifts in composition could predict outbreak risks, and targeted IPC strategies should focus on these high-risk, hospital-adapted bacteria, which could include adaptive surface cleaning, hand hygiene and antibiotic stewardship. In veterinary settings a higher evenness and multi-kingdom diversity may suppress the dominance of specific pathogens via ecological competition. Contamination, including with MDROs, highlights that IPC is key, with the cornerstones of hand hygiene, cleaning and stewardship to minimize patient-to-patient transmission and zoonotic transmission in the context of the veterinary hospital.
The presence of sequencing reads for notifiable, reportable or zoonotic pathogens does not necessarily mean that live, culturable organisms are present, especially at a low percentage prevalence, as the majority of these were. DNA can persist in the environment and can be identified from lysed cells, extracellular DNA or environmental DNA fragments [48]. These samples were from a single time point at each site, so whilst detecting these organisms may appear concerning, the low copy number of these species may mean colonization may be transient, or there were no viable organisms in the samples. How these pathogens entered these environments would be a concern however, and if longitudinal sequencing identified an increase over time, it may suggest potential reservoirs. Of note was the fact that of the zoonotic species, only Salmonella and Campylobacter species were found across both the HH and VH samples, suggesting greater potential for OH transmission.

3.2. AMR

Compared with the VH samples, the HH samples had larger proportions of Rank I high risk ARGs, but as this ranking system is geared towards pathogens, and the ARGs found in them, in humans rather than animals, this may introduce bias [39]. This may also be partially explained by the difference in sizes between the tertiary HH and companion animal VH sampled. In both HH and VH settings in the UK, broad-spectrum β-lactams, including penicillins, β-lactam-inhibitor combinations, tetracyclines and macrolides are the most commonly prescribed antibiotics [49,50]. This study found that the resistomes across both the HH and VH samples commonly included β-lactam ARGs, with Rank I β-lactam ARGs especially prevalent in the HH samples. mecA was only found in the VH samples, which may be related to higher levels of staphylococci, in particular, Staphylococcus pseudintermedius, of which methicillin-resistant S. pseudintermedius is a known multi-drug-resistant (MDR) pathogen, particularly of dogs but occasionally of other species including humans [51]. That the majority of QAC resistance genes were identified in the VH samples may be concerning, as QAC products are often the main disinfectant used in companion animal practices in the UK.
Aminoglycoside ARGs were also commonly identified across both the HH and VH samples, although aminoglycoside use is usually restricted to resistant infections in both human and companion animal hospital settings [52,53]. Aminoglycoside resistance genes are however found across many Gram-Positive and Gram-Negative bacterial species, including non-pathogenic environmental ones [6,50]. The sulfonamides are not typically used as first-line antibiotics in human or companion animal practices, but sul genes, carried on plasmids and integrons, are also found in many bacterial species, including environmental ones, and species that can cause infection in humans and companion animals such as Escherichia coli and the streptococci [50,54,55].
The identification of high numbers of β-lactam, aminoglycoside and sulfonamide resistance genes, including high-risk ARGs, was notable from an IPC perspective. Enhanced environmental IPC procedures, especially the flushing out and disinfection of wastewater outlets may be necessary during outbreaks of high-risk AMR pathogens, such as the carbapenem-resistant Enterobacteriales (CRE). If an increase in multi-drug-resistant infections was seen within hospital settings, re-consideration of environmental cleaning, to reduce spread of these ARGs to potential nosocomial pathogens in patients, could be considered.

3.3. Plasmids

There was little overlap in plasmid types found across the HH and VH samples, which is perhaps not surprising given the relatively separate taxa found in each group. The VH samples had more Gram-Positive-associated plasmids, which may be due to the larger proportion of, and greater prevalence across samples, of Staphylococci, as described in greater detail in the previous literature [40,41]. Meanwhile, the HH samples had more plasmid types associated with Enterobacteriales, whose species are often associated with hospital-acquired species [56]. This is of concern for both human and veterinary settings, as whilst Gram-Positive plasmid types do carry ARGs, Enterobacteriales-associated ones are highly mobile, more easily transferred and more likely to carry high-risk ARGs such as extended spectrum β-lactamases (ESBLs), carbapenemases, and multidrug-resistance cassettes [57].
Any plasmids associated with AMR are a One Health issue and are capable of being spread between bacteria infecting both human and animal hosts and the environment [5]. The presence of both of these types of plasmids in both the HH and VH settings represents a transmission and infection risk to both humans and animals. A multidisciplinary approach would be needed to reduce these plasmids across patient and environmental settings, such as enhancing antimicrobial stewardship to reduce selection pressure, improving hygiene and sanitation to reduce the overall numbers of species and biomass present and reducing the opportunities for horizontal gene transfer by limiting ‘hotspots’ such as biofilm-heavy wastewater, shared equipment (and caging in the case of animals) [58]. The augmentation of hospital environments, such as ventilation and water safety measures, would also limit mixing of environmental species sources [59,60].

3.4. Importance of a Multisectoral Response

This study has highlighted both the similarities and differences between the microbiomes, resistomes and plasmidomes in a human and animal hospital setting and whilst these were individual sites, this adds to the voice from the previous literature, which highlights the need for a multisectoral approach towards the improved surveillance of AMR and pathogen transmission between patients and the environments that they are treated in [61]. Understudied but perhaps of particular importance in these potential transmission events are companion animals, and it is becoming increasingly clear that they may be significant reservoirs, especially when their human caregivers are immunocompromised or have had spells in hospital [62]. Equally, transmission goes both ways and reverse-zoonoses are increasingly being highlighted as a concern in the veterinary world [63].

3.5. Use of Metagenomics for Surveillance

Longitudinal environmental surveillance for ARGs and pathogens will be vital in high-risk settings such as human and animal hospitals to monitor changes in species prevalence and presence of ARGs. The One Health sharing of these data will help to elucidate intra- and inter-setting transmission risk. The use of metagenomics as a surveillance tool has advantages over other methods such as culture and molecular techniques such as PCR, as it can provide a complete, real-time and minimally biassed view of microbial communities. It provides greater resolution, identifies non-culturable organisms and provides genetic clues to uncover potential transmission risks. Whilst metagenomics may not be as sensitive for identifying specific factors, such as single base pair changes, as other methods, it can provide a holistic overview on microbial ecosystems without selection bias. The use of long read technologies such as Oxford Nanopore Technologies is advantageous, as reads may span many kilobases, helping to differentiate species, plasmids and ARGs. This is especially useful in environmental samples with multiple low biomass species.
Genomic surveillance is important for guiding a directed and truly One Health response, as it can pinpoint contamination hotspots (such as sinks, drains, equipment), identify high-risk wards or animal housing areas and environmental reservoirs and signal emerging high-risk clones. This can provide the evidence needed for IPC teams to undertake targeted action, such as enhanced cleaning of high-risk sites or the redesign of plumbing or water systems.
Whilst its strengths lay in community analysis and biome surveillance, metagenomics provides a lower sensitivity and resolution compared with whole genome sequencing. This may hinder the ability to uncover finer-scale relationships, such as determining which species harbour particular plasmids or extra-chromosomal AMR genes. The challenge is compounded by the rapid evolution of bioinformatics tools and databases used to detect these genetic features. As a result, distinguishing whether multidrug-resistant profiles originate from pathogenic organisms or from environmental or commensal species usually requires further ‘deep-dive’ analysis.

4. Methods

4.1. Sample Collection

All samples and data were obtained either from a large primary care companion animal veterinary hospital, or a tertiary referral and teaching hospital in London, UK.

4.2. HH Environmental Sampling

A site visit to the sampled ward was undertaken prior to collection, to evaluate layout and staff and patient routes of travel and sampling locations. Samples were taken from every multiple-occupancy-bed bay and single-bed room, covering areas where patients were known to have had a CRE, and non-affected areas. From each bay and room every sink and drain were sampled (in both bed and bathroom areas) and shower drains sampled. Non-clinical rooms were also covered, such as the shared-use pantry, staff toilets, nurses’ station, storage rooms, sluice, and workstations on wheels. Further details of sampling methodology, including types and locations, are described in Elton et al. (2024) [40].

4.3. VH Environmental Sampling

For environmental sampling, a site visit to the VH was undertaken prior to sample collection to evaluate room layout and staff and patient routes of travel and determine prioritized sampling locations including both patient and non-patient areas. Where there were multiple same-use rooms, e.g., consultation rooms, one representative location was chosen. Non-clinical rooms were also evaluated, including the visitor toilets. Samples were obtained on a normal working week afternoon shift in September 2022 from pre-designated locations. Sample types included wastewater samples (e.g., dog kennel waste drain), sponge swabs of surfaces (e.g., consulting tables), cotton stick swabs (e.g., sink drain holes) and liquid samples (e.g., ultrasound gel). Further details of sampling methodology, including types and locations, are described in Elton et al. (2025) [41].

4.4. DNA Extraction

DNA for metagenomic analysis was extracted directly from swab and water samples using the ZymoBIOMICS™ DNA Miniprep Kit (Zymo Research Corporation, Irvine, CA, USA), following the manufacturer’s instructions [64]. A sample of ZymoBIOMICS™ Microbial Community Standard (Zymo Research Corporation) was included, following the manufacturer’s instructions [65]. DNA quality was assessed for concentration using the Qubit™ dsDNA BR Assay Kit (Thermo Fisher, Waltham, MA, USA) and molecular weight and DNA integrity was confirmed using the Genomic DNA ScreenTape and reagents on the TapeStation 4150 (Agilent Technologies Inc., Santa Clara, CA, USA). Nuclease-free water (Sigma-Aldrich, St. Louis, MO, USA) was run as a negative control alongside samples from DNA extraction through to sequence analysis.

4.5. Library Preparation

Metagenomic DNA libraries were prepared using the ONT Rapid PCR Barcoding Kit (SQK-RPB004) with a DNA input of 1–5 ng and following the manufacturers’ instructions [66]. ZymoBIOMICS™ Microbial Community DNA Standards (Zymo Research Corporation) were included, following the manufacturer’s instructions [67].

4.6. Sequencing and Basecalling

Up to 24 barcoded metagenomic samples were run together on a flow cell version R9.4.1 (Oxford Nanopore Technologies, Oxford, UK) using a MinION device for 72 h, using the default parameters on the MinKNOW software (v23.04.6). Basecalling was performed either by the MinKNOW software alongside sequencing or using the Guppy basecalling software (v6.5.7) [68], using the flip-flop high accuracy algorithm, with a minimum Q score of 8.

4.7. Data Analysis

Of the 36 HH samples sequenced, all obtained reads. Of the 48 VH samples sequenced, nine did not yield any reads. Fastq files were quality checked using FastQC (v0.21.1) and MultiQC (v1.15) [69,70]. Sample data were analyzed for the presence of AMR genes using KmerResistance 2.2 (v02-2018), using the ResFinder AMR gene database (v4.2.5) and KmerFinder (v3.0.2), using the KmerFinder database (v2022-07-11), with 70% identity threshold, using the ONT pipeline [37,38]. Plasmids were identified using PlasmidFinder 2.1 (v2.0.1), using the PlasmidFinder database (v2023-01-18), with a minimum identity threshold of 95% and a minimum coverage threshold of 60% [38,71].
Species were assigned using Kraken (v2.1.3) and the NCBI Standard Refseq indexes PlusPF (v2022-06-07), which includes bacteria, viruses, fungi, archaea and the human genome [72,73]. Non-human mammalian genomes, including cat or dog genomes, were reported as unclassified. A confidence level of 0.1 was used when running Kraken2, as ONT data have lower quality scores than Illumina, and these were environmental samples.

4.8. Alpha and Beta Diversity

Taxonomic profiling was performed with Kraken2 (v2.1.3) using the PlusPFP-8 database spanning bacterial, archaeal, viral, fungal, protozoan, and plasmid genomes. Species-level read abundances were inferred with Bracken (v2.9). Bracken tables were imported into R (v4.3.2) via phyloseq (v1.44.0) and integrated with sample metadata. Alpha-diversity metrics (Richness, Shannon, Simpson, Pielou’s evenness, Berger–Parker, Fisher’s alpha) were computed using phyloseq and vegan (v2.6-4); group differences were evaluated with Wilcoxon rank-sum tests. Beta diversity was quantified using Bray–Curtis, Jaccard, Euclidean, and Manhattan distances (vegan::vegdist), followed by PCoA (vegan::capscale) and PERMANOVA (adonis2, 999 permutations). Visualizations, including boxplots and PCoA plots with 68% confidence ellipses, were produced with ggplot2 (v3.4.4). Statistical significance was set at p < 0.05.

4.9. Species Selection

The ‘reads (taxon)’ output from Kraken2 was used as the species read number, as the number of reads whose lowest common ancestor (LCA) is exactly that taxon. Taxa were discarded at <0.001–0.01% of total classified bases. Zoonotic species of interest were identified from the Public Health England (now UK Health Security Agency (UKHSA)) list of Zoonotic diseases of concern [36]. The UKHSA list of notifiable human pathogens and Department for Environment, Food and Rural Affairs (DEFRA) and the Animal and Plant Health Agency (APHA) list of notifiable veterinary pathogens were used to select species of interest from the metagenomic samples [34,35].

4.10. Selection of High-Risk ARGs

Based on the health-risk ARGs framework, 122 high-risk ARGs were screened, of which 72 were unique and Rank I, based on the ranking system of Zhang et al. (2021) [31,39]. Additional environmental stressor genes: sit (peroxide resistance), qac (increased tolerance to quaternary ammonium compounds decreased and other cationic biocides such as chlorhexidine) and cpl (heat resistance) were also identified to assess environmental persistence, as part of the KmerResistance 2.2 database.

4.11. Statistical Analysis

Statistical analysis was conducted using Prism v10.3.0 (GraphPad). The test used for each analysis is described within the Results Section. Sequence data were deposited in European Nucleotide Archive (ENA) under BioProject PRJEB84924 (VH samples) and PRJEB76684 (HH samples) and are outlined in the Supplementary Materials sections of references [40,41]. For analysis of HH isolate AMR status, an isolate was deemed MDR if it showed resistance to antibiotics in three or more antibiotic classes, to which the bacterial species does not show intrinsic resistance [74,75].

Author Contributions

Conceptualization, L.E., A.D.M., S.A., D.M., T.D.M. and E.Q.W.; Methodology, L.E., A.D.M., S.M.F., R.J., A.W., S.A., J.H., V.P., S.R., D.M., C.A., T.D.M. and E.Q.W.; Software, S.L.; Validation, L.E., S.L., A.W., S.A. and S.R.; Formal analysis, L.E. and S.L.; Investigation, L.E., A.D.M., A.W., S.A., V.P., L.C., C.O., Ö.Y., E.C., I.W., M.M., S.Y., K.K., E.S. and E.Q.W.; Resources, S.A., C.A. and E.Q.W.; Data curation, L.E., J.H., V.P., L.C., C.O., Ö.Y., E.C., I.W., M.M., S.Y., K.K. and E.S.; Writing—original draft, L.E. and E.Q.W.; Writing—review and editing, S.L., A.D.M., S.M.F., R.J., A.W., S.A., J.H., V.P., L.C., C.O., Ö.Y., E.C., I.W., M.M., S.Y., K.K., E.S., S.R., D.M., C.A., T.D.M. and E.Q.W.; Visualization, L.E. and S.L.; Supervision, A.D.M., T.D.M. and E.Q.W.; Project administration, L.E., A.D.M., T.D.M. and E.Q.W.; Funding acquisition, T.D.M. All authors have read and agreed to the published version of the manuscript.

Funding

This research was funded by the Centre for Clinical Microbiology, UCL internal funds and the Royal Free London NHS Foundation Trust.

Institutional Review Board Statement

The HH research was part of a diagnostic service evaluation was undertaken at the request of the Division of Nursing in support of the Infection Prevention and Control team as part of enhanced standard of care practices for IPC outbreak investigation. This project is under HRA approval for ELCID and registered with Health Services London. IRAS project ID: 283831, National HRA REC reference: 20/HRA/4928, Local REC: RFL R&D ref: 134895, HSL Project number: 1529. No ethical approval was needed to undertake this project, so no ethical approval number was assigned. The obtaining of samples was authorized by the Head Veterinary Surgeon at the companion animal veterinary hospital in London.

Informed Consent Statement

Not applicable.

Data Availability Statement

All data is Open Access. All data is Open Access and is available on the European Nucleotide Archive, under the project accession numbers PRJEB84924 (VH data) and PRJEB76684 (HH data).

Conflicts of Interest

The authors declare no conflicts of interest.

Abbreviations

AMRAntimicrobial resistance
ARGsAntimicrobial resistance genes
CRECarbapenem-resistant Enterobacteriales
HHHuman hospital
IPCInfection prevention and control
MDRMulti-drug resistance
MDROMulti-drug-resistant organism
OHOne Health
ONTOxford Nanopore Technologies
PBSPhosphate-buffered saline
PCRPolymerase chain reaction
SDStandard deviation
VHVeterinary hospital

References

  1. Algammal, A.M.; Hetta, H.F.; Elkelish, A.; Alkhalifah, D.H.H.; Hozzein, W.N.; Batiha, G.E.S.; Nahhas, N.E.; Mabrok, M.A. Methicillin-resistant Staphylococcus aureus (MRSA): One health perspective approach to the bacterium epidemiology, virulence factors, antibiotic-resistance, and zoonotic impact. Infect. Drug Resist. 2020, 13, 3255–3265. [Google Scholar] [CrossRef] [Scilit] [PubMed]
  2. Despotovic, M.; de Nies, L.; Busi, S.B.; Wilmes, P. Reservoirs of antimicrobial resistance in the context of One Health. Curr. Opin. Microbiol. 2023, 73, 102291. [Google Scholar] [CrossRef] [Scilit] [PubMed]
  3. Wielders, C.L.C.; Fluit, A.C.; Brisse, S.; Verhoef, J.; Schmitz, F.J. mecA gene is widely disseminated in Staphylococcus aureus population. J. Clin. Microbiol. 2002, 40, 3970–3975. [Google Scholar] [CrossRef] [Scilit] [PubMed]
  4. Rozwandowicz, M.; Brouwer, M.S.M.; Fischer, J.; Wagenaar, J.A.; Gonzalez-Zorn, B.; Guerra, B.; Mevius, D.J.; Hordiik, J. Plasmids carrying antimicrobial resistance genes in Enterobacteriaceae. J. Antimicrob. Chemother. 2018, 73, 1121–1137. [Google Scholar] [CrossRef] [Scilit] [PubMed]
  5. Castañeda-Barba, S.; Top, E.M.; Stalder, T. Plasmids, a molecular cornerstone of antimicrobial resistance in the One Health era. Nat. Rev. Microbiol. 2024, 22, 18–32. [Google Scholar] [CrossRef] [Scilit] [PubMed]
  6. BSAVA/SAMSoc. BSAVA/SAMSoc Guide to Responsible Use of Antibiotics: PROTECT ME (2024). 2024. Available online: https://www.bsavalibrary.com/content/chapter/10.22233/9781913859312.chap4_1#references (accessed on 23 August 2024).
  7. Van Den Bogaard, A.E.; Stobberingh, E.E. Epidemiology of resistance to antibiotics: Links between animals and humans. Int. J. Antimicrob. Agents 2000, 14, 327–335. [Google Scholar] [CrossRef] [Scilit] [PubMed]
  8. Uluseker, C.; Kaster, K.M.; Thorsen, K.; Basiry, D.; Shobana, S.; Jain, M.; Kumar, G.; Kommedal, R.; Pala-Ozkok, I. A Review on Occurrence and Spread of Antibiotic Resistance in Wastewaters and in Wastewater Treatment Plants: Mechanisms and Perspectives. Front. Microbiol. 2021, 12, 717809. [Google Scholar] [CrossRef] [Scilit]
  9. Homeier-Bachmann, T.; Heiden, S.E.; Lübcke, P.K.; Bachmann, L.; Bohnert, J.A.; Zimmermann, D.; Schaufler, K. Antibiotic-resistant Enterobacteriaceae in wastewater of abattoirs. Antibiotics 2021, 10, 568. [Google Scholar] [CrossRef] [Scilit]
  10. Chau, K.K.; Barker, L.; Budgell, E.P.; Vihta, K.D.; Sims, N.; Kasprzyk-Hordern, B.; Harriss, E.; Crook, D.W.; Read, D.S.; Walker, A.S.; et al. Systematic review of wastewater surveillance of antimicrobial resistance in human populations. Environ. Int. 2022, 162, 107171. [Google Scholar] [CrossRef] [Scilit] [PubMed]
  11. Wohrley, J.D.; Bartlett, A.H. The Role of the Environment and Colonization in Healthcare-Associated Infections. In Healthcare-Associated Infections in Children; Springer International Publishing: Cham, Switzerland, 2019; pp. 17–36. [Google Scholar] [CrossRef] [Scilit]
  12. Weber, D.J.; Anderson, D.; Rutala, W.A. The role of the surface environment in healthcare-associated infections. Curr. Opin. Infect. Dis. 2013, 26, 338–344. [Google Scholar] [CrossRef] [Scilit] [PubMed]
  13. Craddock, H.A.; Kearney, A.; Fitzpatrick, F.; Finn, C.; Pryce, M.T.; Fitzgerald-Hughes, D. The challenge of reducing antimicrobial resistance (AMR) across the one health landscape: Diverse perspectives on AMR risks and their mitigation in sinks, drains, and wastewater. Sci. Total Environ. 2025, 992, 179935. [Google Scholar] [CrossRef] [Scilit] [PubMed]
  14. Smith, M.; King, C.; Davis, M.; Dickson, A.; Park, J.; Smith, F.; Currie, K.; Flowers, P.l. Pet owner and vet interactions: Exploring the drivers of AMR. Antimicrob. Resist. Infect. Control 2018, 7, 46. [Google Scholar] [CrossRef] [Scilit]
  15. Menezes, J.; Frosini, S.M.; Belas, A.; Marques, C.; da Silva, J.M.; Amaral, A.J.; Loeffler, A.; Pomba, C. Longitudinal study of ESBL/AmpC-producing Enterobacterales strains sharing between cohabiting healthy companion animals and humans in Portugal and in the United Kingdom. Eur. J. Clin. Microbiol. Infect. Dis. 2023, 42, 1011–1024. [Google Scholar] [CrossRef] [Scilit] [PubMed]
  16. Saputra, S.; Jordan, D.; Mitchell, T.; Wong, H.S.; Abraham, R.J.; Kidsley, A.; Turnidge, J.; Trott, D.J.; Abraham, S. Antimicrobial resistance in clinical Escherichia coli isolated from companion animals in Australia. Vet. Microbiol. 2017, 211, 43–50. [Google Scholar] [CrossRef] [Scilit] [PubMed]
  17. Pomba, C.; Rantala, M.; Greko, C.; Baptiste, K.E.; Catry, B.; van Duijkeren, E.; Mateus, A.; Moreno, M.A.; Pyörälä, S.; Ružauskas, M. Public health risk of antimicrobial resistance transfer from companion animals. J. Antimicrob. Chemother. 2017, 72, 957–968. [Google Scholar] [CrossRef] [Scilit] [PubMed]
  18. da Silva, J.M.; Menezes, J.; Marques, C.; Pomba, C.F. Companion Animals—An Overlooked and Misdiagnosed Reservoir of Carbapenem Resistance. Antibiotics 2022, 11, 533. [Google Scholar] [CrossRef] [Scilit] [PubMed]
  19. Scott Weese, J. Antimicrobial resistance in companion animals. Anim. Health Res. Rev. 2008, 9, 169–176. [Google Scholar] [CrossRef] [Scilit] [PubMed]
  20. Perry, M.; van Bunnik, B.; McNally, L.; Wee, B.; Munk, P.; Warr, A.; Moore, B.; Kalima, P.; Philip, C.; de Roda Husman, A.M.; et al. Antimicrobial resistance in hospital wastewater in Scotland: A cross-sectional metagenomics study. Lancet 2019, 394, S1. [Google Scholar] [CrossRef] [Scilit]
  21. Markkanen, M.A.; Haukka, K.; Pärnänen, K.M.M.; Dougnon, V.T.; Bonkoungou, I.J.O.; Garba, Z.; Tinto, H.; Sarakoski, A.; Karkman, A.; Kantele, A.; et al. Metagenomic Analysis of the Abundance and Composition of Antibiotic Resistance Genes in Hospital Wastewater in Benin, Burkina Faso, and Finland. mSphere 2023, 8, e00538-22. [Google Scholar] [CrossRef] [Scilit] [PubMed]
  22. Baker, K.S.; Jauneikaite, E.; Nunn, J.G.; Midega, J.T.; Atun, R.; Holt, K.E.; Walia, K.; Horden, B.P.; Tate, H.; Okeke, I.N.; et al. Evidence review and recommendations for the implementation of genomics for antimicrobial resistance surveillance: Reports from an international expert group. Lancet Microbe 2023, 4, e1035–e1039. [Google Scholar] [CrossRef] [Scilit]
  23. World Health Organization (WHO). GLASS Whole-Genome Sequencing for Surveillance of Antimicrobial Resistance: Global Antimicrobial Resistance and Use Surveillance System (GLASS); WHO: Geneva, Switzerland, 2020; 72p, Available online: https://www.who.int/health-topics/antimicrobial-resistance (accessed on 30 January 2026).
  24. Grundmann, H.; Klugman, K.P.; Walsh, T.; Ramon-pardo, P.; Sigauque, B.; Khan, W.; Laxminarayan, R.; Heddini, A.; Stelling, J. A framework for global surveillance of antibiotic resistance. Drug Resist. Updates 2011, 14, 79–87. [Google Scholar] [CrossRef] [Scilit]
  25. Elbehiry, A.; Marzouk, E.; Abalkhail, A.; Abdelsalam, M.H.; Mostafa, M.E.A.; Alasiri, M.; Ibrahem, M.; Ellethy, A.T.; Almuzaini, A.; Aljarallah, S.N.; et al. Detection of antimicrobial resistance via state-of-the-art technologies versus conventional methods. Front. Microbiol. 2025, 16, 1549044. [Google Scholar] [CrossRef] [Scilit]
  26. Ko, K.K.K.; Chng, K.R.; Nagarajan, N. Metagenomics-enabled microbial surveillance. Nat. Microbiol. 2022, 7, 486–496. [Google Scholar] [CrossRef] [Scilit] [PubMed]
  27. Shen, J.; McFarland, A.G.; Young, V.B.; Hayden, M.K.; Hartmann, E.M. Toward Accurate and Robust Environmental Surveillance Using Metagenomics. Front. Genet. 2021, 12, 600111. [Google Scholar] [CrossRef] [Scilit] [PubMed]
  28. Chen, X.; Yin, X.; Xu, X.; Zhang, T. Species-resolved profiling of antibiotic resistance genes in complex metagenomes through long-read overlapping with Argo. Nat. Commun. 2025, 16, 1744. [Google Scholar] [CrossRef] [Scilit] [PubMed]
  29. Acharya, K.; Blackburn, A.; Mohammed, J.; Tamiru, A.; Mekonnen, A.; Werner, D. Metagenomic water quality monitoring with a portable laboratory. Water Res. 2020, 184, 116112. [Google Scholar] [CrossRef] [Scilit]
  30. Shen, J.; McFarland, A.G.; Blaustein, R.A.; Rose, L.J.; Perry-Dow, K.A.; Moghadam, A.A.; Hayden, M.K.; Young, V.B.; Hartmann, E.M. An improved workflow for accurate and robust healthcare environmental surveillance using metagenomics. Microbiome 2022, 10, 206. [Google Scholar] [CrossRef] [Scilit] [PubMed]
  31. Wang, X.; Qian, Y.; Wang, Y.; Wang, S.; Bi, J.; Shi, C.; Han, Q.; Wan-Yan, R.; Yu, Q.; Li, H. Metagenomics reveals the potential transmission risk of resistomes from urban park environment to human. J. Hazard. Mater. 2024, 477, 135387. [Google Scholar] [CrossRef] [Scilit] [PubMed]
  32. Martin, C.; Stebbins, B.; Ajmani, A.; Comendul, A.; Hamner, S.; Hasan, N.A.; Colwell, R. Nanopore-based metagenomics analysis reveals prevalence of mobile antibiotic and heavy metal resistome in wastewater. Ecotoxicology 2021, 30, 1572–1585. [Google Scholar] [CrossRef] [Scilit] [PubMed]
  33. Tompson, A.C.; Mateus, A.L.P.; Brodbelt, D.C.; Chandler, C.I.R. Understanding Antibiotic Use in Companion Animals: A Literature Review Identifying Avenues for Future Efforts. Front. Vet. Sci. 2021, 8, 719547. [Google Scholar] [CrossRef] [Scilit]
  34. Department for Environment Food & Rural Affairs; Animal and Plant Health Agency. Notifiable Diseases in Animals. 2019. Available online: https://www.gov.uk/government/collections/notifiable-diseases-in-animals (accessed on 4 December 2025).
  35. UK Health Security Agency. Notifiable Diseases and How to Report Them. 2025. Available online: https://www.gov.uk/guidance/notifiable-diseases-and-how-to-report-them (accessed on 4 December 2025).
  36. Public Health England. List of Zoonotic Diseases. 2019. Available online: https://www.gov.uk/government/publications/list-of-zoonotic-diseases/list-of-zoonotic-diseases (accessed on 10 November 2025).
  37. Clausen, P.T.L.C.; Zankari, E.; Aarestrup, F.M.; Lund, O. Benchmarking of methods for identification of antimicrobial resistance genes in bacterial whole genome data. J. Antimicrob. Chemother. 2016, 71, 2484–2488. [Google Scholar] [CrossRef] [Scilit] [PubMed]
  38. Clausen, P.T.L.C.; Aarestrup, F.M.; Lund, O. Rapid and precise alignment of raw reads against redundant databases with KMA. BMC Bioinform. 2018, 19, 307. [Google Scholar] [CrossRef] [Scilit] [PubMed]
  39. Zhang, A.N.; Gaston, J.M.; Dai, C.L.; Zhao, S.; Poyet, M.; Groussin, M.; Yin, X.; Li, L.G.; van Loosdrecht, M.C.M.; Topp, E.; et al. An omics-based framework for assessing the health risk of antimicrobial resistance genes. Nat. Commun. 2021, 12, 4765. [Google Scholar] [CrossRef] [Scilit] [PubMed]
  40. Elton, L.; Williams, A.; Ali, S.; Heaphy, J.; Pang, V.; Commins, L.; O’Brien, C.; Yetiş, Ö.; Caine, E.; Ward, I.; et al. Tracing the transmission of carbapenem-resistant Enterobacterales at the patient: Ward environmental nexus. Ann. Clin. Microbiol. Antimicrob. 2024, 23, 108. [Google Scholar] [CrossRef] [Scilit] [PubMed]
  41. Elton, L.; Mateos, A.D.; Frosini, S.M.; Jepson, R.; Rofael, S.; McHugh, T.D. A metagenomic approach to One Health surveillance of antimicrobial resistance in a UK veterinary centre. Microb. Genom. 2025, 11, 001471. [Google Scholar] [CrossRef] [Scilit] [PubMed]
  42. Marascio, N.; Scarlata, G.G.M.; Romeo, F.; Cicino, C.; Trecarichi, E.M.; Quirino, A.; Torti, C.; Matera, G.; Russo, A. The Role of Gut Microbiota in the Clinical Outcome of Septic Patients: State of the Art and Future Perspectives. Int. J. Mol. Sci. 2023, 24, 9307. [Google Scholar] [CrossRef] [Scilit]
  43. Yi, L.; An, L.; Wang, R.; Niu, X.; Chen, J.; Zhang, B.; Pei, X.; Xu, X.; Chen, J. Antibiotic resistance genes in companion animals and humans driven by the gut microbial communities: Composition, distribution, and implications. BMC Vet. Res. 2026. [Google Scholar] [CrossRef] [Scilit]
  44. Hospodsky, D.; Qian, J.; Nazaroff, W.W.; Yamamoto, N.; Bibby, K.; Rismani-Yazdi, H. Human Occupancy as a Source of Indoor Airborne Bacteria. PLoS ONE 2012, 7, e34867. [Google Scholar] [CrossRef] [Scilit]
  45. Gupta, A.; Gupta, R.; Singh, R.L. Microbes and Environment. In Principles and Applications of Environmental Biotechnology for a Sustainable Future; Springer: Singapore, 2017; pp. 43–84. [Google Scholar] [CrossRef] [Scilit]
  46. Hayes, J.F. Fighting Back against Antimicrobial Resistance with Comprehensive Policy and Education: A Narrative Review. Antibiotics 2022, 11, 644. [Google Scholar] [CrossRef] [Scilit]
  47. Chng, K.R.; Li, C.; Bertrand, D.; Ng, A.H.Q.; Kwah, J.S.; Low, H.M.; Tong, C.; Natrajan, M.; Zhang, M.H.; Xu, L.; et al. Cartography of opportunistic pathogens and antibiotic resistance genes in a tertiary hospital environment. Nat. Med. 2020, 26, 941–951. [Google Scholar] [CrossRef] [Scilit]
  48. Nielsen, K.M.; Johnsen, P.J.; Bensasson, D.; Daffonchio, D. Release and persistence of extracellular DNA in the environment. Environ. Biosaf. Res. 2007, 6, 37–53. [Google Scholar] [CrossRef] [Scilit]
  49. UK Health Security Agency (UKHSA). English Surveillance Programme for Antimicrobial Utilisation and Resistance (ESPAUR) Report 2022 to 2023; UK Health Security Agency (UKHSA): London, UK, 2023. [Google Scholar]
  50. UK-VARSS UK Veterinary Antibiotic Resistance and Sales Surveillance Report 2023. 2024. Available online: www.nationalarchives.gov.uk/doc/open-government-licence/version/3/ (accessed on 13 January 2026).
  51. Papić, B.; Golob, M.; Zdovc, I.; Kušar, D.; Avberšek, J. Genomic insights into the emergence and spread of methicillin-resistant Staphylococcus pseudintermedius in veterinary clinics. Vet. Microbiol. 2021, 258, 109119. [Google Scholar] [CrossRef] [Scilit] [PubMed]
  52. Garneau-Tsodikova, S.; Labby, K.J. Mechanisms of resistance to aminoglycoside antibiotics: Overview and perspectives. Medchemcomm 2016, 7, 11–27. [Google Scholar] [CrossRef] [Scilit]
  53. World Health Organization. Critically Important Antimicrobials for Human Medicine: 6th Revision. 2019. Available online: https://www.who.int/publications/i/item/9789241515528 (accessed on 20 March 2026).
  54. Maskell, J.P.; Sefton, A.M.; Hall, L.M.C. Mechanism of Sulfonamide Resistance in Clinical Isolates of Streptococcus pneumoniae. Antimicrob. Agents Chemother. 1997, 41, 2121–2126. [Google Scholar] [CrossRef] [Scilit] [PubMed]
  55. Sköld, O. Sulfonamide resistance: Mechanisms and trends. Drug Resist. Updates 2000, 3, 155–160. [Google Scholar] [CrossRef] [Scilit]
  56. World Health Organization. Global Priority List of Antibiotic-Resistant Bacteria to Guide Research, Discovery and Development of New Antibiotics. 2017. Available online: https://www.aidsdatahub.org/sites/default/files/resource/who-global-priority-list-antibiotic-resistant-bacteria.pdf (accessed on 19 May 2026).
  57. Carattoli, A. Plasmids and the spread of resistance. Int. J. Med. Microbiol. 2013, 303, 298–304. [Google Scholar] [CrossRef] [Scilit]
  58. Flemming, H.C.; Wingender, J.; Szewzyk, U.; Steinberg, P.; Rice, S.A.; Kjelleberg, S. Biofilms: An emergent form of bacterial life. Nat. Rev. Microbiol. 2016, 14, 563–575. [Google Scholar] [CrossRef] [Scilit]
  59. Beggs, C.B. The Airborne Transmission of Infection in Hospital Buildings: Fact or Fiction? Indoor Built Environ. 2003, 12, 9–18. [Google Scholar] [CrossRef] [Scilit]
  60. Miłobedzka, A.; Ferreira, C.; Vaz-Moreira, I.; Calderón-Franco, D.; Gorecki, A.; Purkrtova, S.; Bartacek, J.; Dziewit, L.; Singleton, C.M.; Nielsen, P.H.; et al. Monitoring antibiotic resistance genes in wastewater environments: The challenges of filling a gap in the One-Health cycle. J. Hazard. Mater. 2022, 424, 127407. [Google Scholar] [CrossRef] [Scilit] [PubMed]
  61. Robinson, T.P.; Bu, D.P.; Carrique-Mas, J.; Fèvre, E.M.; Gilbert, M.; Grace, D.; Hay, S.I.; Jiwakanon, J.; Kakkar, M.; Kakkar, M.; et al. Antibiotic resistance is the quintessential One Health issue. Trans. R. Soc. Trop. Med. Hyg. 2016, 110, 377–380. [Google Scholar] [CrossRef] [Scilit]
  62. Damborg, P.; Broens, E.M.; Chomel, B.B.; Guenther, S.; Pasmans, F.; Wagenaar, J.A.; Wesse, J.S.; Wieler, L.H.; Windahl, U.; Vanrompay, D.; et al. Bacterial Zoonoses Transmitted by Household Pets: State-of-the-Art and Future Perspectives for Targeted Research and Policy Actions. J. Comp. Pathol. 2016, 155, S27–S40. [Google Scholar] [CrossRef] [Scilit]
  63. Noman, Z.; Tasnim, S.; Masud, R.; Anika, T.; Islam, M.; Rahman, A.; Rahman, M. A systematic review on reverse-zoonosis: Global impact and changes in transmission patterns. J. Adv. Vet. Anim. Res. 2024, 11, 601. [Google Scholar] [CrossRef] [Scilit] [PubMed]
  64. Zymo Research. ZymoBIOMICSTM DNA Miniprep Kit. Available online: https://files.zymoresearch.com/protocols/_d4300t_d4300_d4304_zymobiomics_dna_miniprep_kit.pdf (accessed on 22 August 2023).
  65. Zymo Research. ZymoBIOMICS® Microbial Community Standard. Available online: https://files.zymoresearch.com/protocols/_d6300_zymobiomics_microbial_community_standard.pdf (accessed on 22 August 2023).
  66. Oxford Nanopore Technologies. Rapid PCR Barcoding Kit (SQK-RPB004) Protocol. 2020, pp. 1–4. Available online: https://community.nanoporetech.com/protocols/rapid-pcr-barcoding/checklist_example.pdf (accessed on 28 June 2021).
  67. Zymo Research. ZymoBIOMICSTM Microbial Community DNA Standard. Available online: https://files.zymoresearch.com/protocols/_d6305_d6306_zymobiomics_microbial_community_dna_standard.pdf (accessed on 22 August 2023).
  68. Bruen, T.C.; Philippe, H.; Bryant, D. A simple and robust statistical test for detecting the presence of recombination. Genetics 2006, 172, 2665–2681. [Google Scholar] [CrossRef] [Scilit] [PubMed]
  69. Babraham Bioinformatics. FastQC. 2019. Available online: https://www.bioinformatics.babraham.ac.uk/projects/fastqc/ (accessed on 28 June 2021).
  70. Ewels, P.; Magnusson, M.; Lundin, S.; Käller, M. MultiQC: Summarize analysis results for multiple tools and samples in a single report. Bioinformatics 2016, 32, 3047–3048. [Google Scholar] [CrossRef] [Scilit] [PubMed]
  71. Carattoli, A.; Zankari, E.; Garciá-Fernández, A.; Larsen, M.V.; Lund, O.; Villa, L.; Aarestrup, F.M.; Hasman, H. In Silico detection and typing of plasmids using plasmidfinder and plasmid multilocus sequence typing. Antimicrob. Agents Chemother. 2014, 58, 3895–3903. [Google Scholar] [CrossRef] [Scilit] [PubMed]
  72. Wood, D.E.; Salzberg, S.L. Kraken: Ultrafast Metagenomic Sequence Classification Using Exact Alignments. 2014. Available online: http://ccb.jhu.edu/software/kraken/ (accessed on 9 January 2026).
  73. Wright, R.J.; Comeau, A.M.; Langille, M.G.I. From defaults to databases: Parameter and database choice dramatically impact the performance of metagenomic taxonomic classification tools. Microb. Genom. 2023, 9, 000949. [Google Scholar] [CrossRef] [Scilit] [PubMed]
  74. Sweeney, M.T.; Lubbers, B.V.; Schwarz, S.; Watts, J.L. Applying definitions for multidrug resistance, extensive drug resistance and pandrug resistance to clinically significant livestock and companion animal bacterial pathogens. J. Antimicrob. Chemother. 2018, 73, 1460–1463. [Google Scholar] [CrossRef] [Scilit] [PubMed]
  75. Magiorakos, A.; Srinivasan, A.; Carey, R.B.; Carmeli, Y.; Falagas, M.E.; Giske, C.G.; Harbrath, S.; Hindler, J.F.; Kahlmeter, G.; Olsson-Liljequist, B.; et al. Multidrug-resistant, extensively drug-resistant and pandrug-resistant bacteria: An international expert proposal for interim standard definitions for acquired resistance. Clin. Microbiol. Infect. 2012, 18, 268–281. [Google Scholar] [CrossRef] [Scilit]
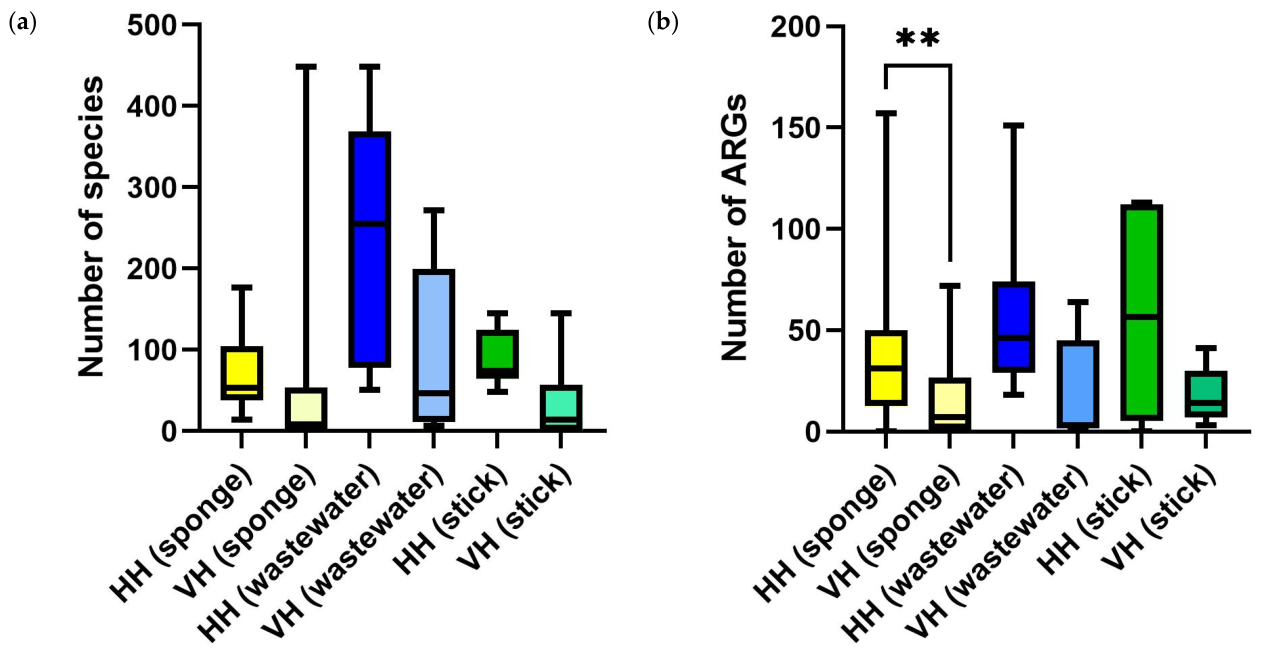
Figure 1. (a) The number of species and (b) number of ARGs were compared between the HH and VH samples and statistically analyzed using a t-test, ** = p = 0.0080. There was no significant difference between the HH and VH samples except for sponge swabs when identifying ARGs.
Antibiotics 15 00568 g001
Figure 2. HH samples show a greater variation in species than VH samples. Box plots illustrating key alpha-diversity indices, including (A) Pielou’s evenness (community uniformity), (B) Berger–Parker index (dominance of the most abundant species), (C) Fisher’s alpha, (species richness), (D) Simpson’s index (probability of two randomly selected individuals belonging to the same species), (E) Shannon diversity index (species richness and evenness) and (F) Observed Richness (total number of distinct species). These tests demonstrate a distinct set of species, with the HH group showing greater species richness (C,F) and the VH group showing greater community complexity and balance.
Antibiotics 15 00568 g002
Figure 3. Beta-diversity analysis demonstrates significant differences in microbial community structure and composition between HH and VH groups. (A) PCoA based on Jaccard distances shows complete separation along PC1 (100% variation explained), indicating distinct communities. (B) Distance metrics (Manhattan, Euclidean, Jaccard, Bray–Curtis, Binary Jaccard) confirm large differences in community composition, both in the species present and their relative abundances. (C) Bray–Curtis dissimilarity matrix highlights pronounced differences between the samples within the HH and VH groups (value = 0.7). (D) PCoA using Bray–Curtis distances reaffirm clear separation between communities along PC1 (100% variation explained).
Antibiotics 15 00568 g003
Figure 4. The VH group shows multi-kingdom diversity. (a) Ridge plot showing the distribution of log-transformed abundances across detected phyla, illustrating broad microbial diversity with dominant bacterial groups and lower contributions from archaeal, eukaryotic, and viral phyla. (b) Domain-level abundance summary, highlighting bacterial dominance (89.1%) alongside smaller proportions of eukaryota (5.7%), viruses (5.2%), and archaea (0.1%).
Antibiotics 15 00568 g004
Figure 5. HH microbiomes exhibited less diversity than VH microbiomes. (a) The phylum-level distribution and relative abundances of dominant taxa in the HH microbiome, highlighting the strong presence of bacterial groups such as Proteobacteria, Bacteroidetes, and Actinobacteria. (b) The domain-level abundance profile, illustrating nearly total bacterial dominance with minimal archaeal and viral representation, reflecting the highly uneven community structure of the HH group.
Antibiotics 15 00568 g005
Figure 6. (a) Total number of ARGs (**** p < 0.0001) and (b) environmental stressor resistance genes (** p = 0.0010) identified per sample in HH and VH samples. There were more total ARGs and environmental stressor genes across HH samples compared with VH samples. Statistical analysis undertaken using Welch’s t test. Dots represent individual samples.
Antibiotics 15 00568 g006
Figure 7. Comparison between the HH and environmental metagenomic samples for Rank I ARGs. The HH samples had significantly higher numbers of Rank I ARGs compared with the VH samples when an unpaired t test was used. **** = p < 0.0001. Dots represent individual samples.
Antibiotics 15 00568 g007
Figure 8. Mean number of Gram-Positive and Enterobacteriales plasmid types identified in the VH and HH samples. There was no significant difference between the HH and VH samples for Gram-Positive plasmid types, but the HH samples had significantly more Enterobacteriales plasmid types when compared with the VH samples (**** = p ≤ 0.0001) (Welch’s t test).
Antibiotics 15 00568 g008
Figure 9. Comparison of (a) Enterobacteriales and (b) Gram-Positive plasmid types identified across the VH (green) and HH (blue) metagenomic samples.
Antibiotics 15 00568 g009
Table 1. List of pathogenic species identified from HH and VH metagenomic samples that were either notifiable human or veterinary pathogens, and/or on the UK zoonotic diseases list (denoted by ✓). * Brucella is ‘reportable’ in dogs and cats but ‘notifiable’ in other species. ** Notifiable, if associated with food poisoning, but required to report in veterinary medicine.
DiseaseOrganismZoonotic ListNotifiable Human Notifiable VeterinaryVHHH
Number of Samples PresentPercentage PrevalenceNumber of Samples PresentPercentage Prevalence
Kennel coughBordetella bronchiseptica 0/48 (0.0%)n/a1/36 (2.8%)0.04
BrucellosisBrucella spp. *0/48 (0.0%)n/a4/36 (11.1%)0.01–0.10
GlandersBurkholderia mallei0/48 (0.0%)n/a1/36 (2.8%)0.02
CampylobacteriosisCampylobacter spp. 3/48 (6.3%)0.01–0.107/36 (19.4%)0.02–0.05
Salmonellosis **Salmonella spp.1/48 (2.1%)0.044/36 (11.1%)0.01–0.02
Table 2. Breakdown of ARGs in relation to the antibiotic and environmental stressor class they cause resistance to. Total individual genes in class describes the number of unique genes causing resistance to that class found across all samples for VH and HH samples. The cumulative number of genes describes the number of individual genes, multiplied by the number of times they were identified across all samples for VH and HH samples. ESR = environmental stressor resistance. Total individual genes in class describes the number of unique genes causing resistance to that class found across all samples for VH and HH samples. The colour scale represents increasing numbers (green = low, to red = high).
Total Individual Genes in Class Cumulative Number of Genes
Resistance Against Antibiotic ClassVHHHVHHH
Antibiotic resistance classAminoglycosides4491479130
β-lactams67243615161
Amphenicols78147
Polymyxin (colistin)0380
Phosphonic acid antibiotics (fosfomycin)0270
Glycopeptide antibiotics (bleomycin)1003
Lincosamides47818
Macrolides471712
Erythromycins1684732
Fluoroquinolones310254
Rifampicin0120
Streptogramin A and related antibiotics1111
Sulfonomides283227484
Tetracyclines32206857
Trimethoprims6256912
Efflux pump02110
ESR Peroxide resistance0110
Decreased susceptibility to chlorhexidine1024831
Heat and stress resistance1331
Table 3. High risk ARGs and the number of samples that resistance genes were found in for the VH and HH samples.
GeneVHHHGeneVHHH
AminoglycosidesMacrolide–Lincosamide–Streptogramin Group
aac(3)-II2/48 (4.2%)14/36 (38.9%)ermB5/48 (10.4%)0/36 (0.0%)
aac(3)-VI2/48 (4.2%)0/36 (0.0%)ermC7/48 (14.6%)0/36 (0.0%)
aac(6′)-I0/48 (0.0%)1/36 (2.8%)ermT0/48 (0.0%)1/36 (2.8%)
ant(2″)-I1/48 (2.1%)16/36 (44.4%)lnuA11/48 (22.9%)1/36 (2.8%)
aph(3′)-I9/48 (18.8%)23/36 (63.9%)mphA0/48 (0.0%)3/36 (8.3%)
aph(6)-I16/48 (33.3%)23/36 (63.9%)Multidrug
β-lactamemrB-qacA3/48 (6.3%)0/36 (0.0%)
blaZ5/48 (10.4%)0/36 (0.0%)Quinolones
blaCMY-60/48 (0.0%)1/36 (2.8%)qnrA0/48 (0.0%)2/36 (5.6%)
blaCTX-M-150/48 (0.0%)6/36 (16.7%)qnrB0/48 (0.0%)13/36 (36.1%)
blaCTX-M-550/48 (0.0%)2/36 (5.6%)qnrS2/48 (4.2%)4/36 (11.1%)
mecA5/48 (10.4%)0/36 (0.0%)Tetracyclines
blaOXA-10/48 (0.0%)12/36 (33.3%)tetL1/48 (2.1%)0/36 (0.0%)
blaOXA-100/48 (0.0%)7/36 (19.4%)tetM1/48 (2.1%)0/36 (0.0%)
blaSHV-50/48 (0.0%)1/36 (2.8%)Trimethoprim
blaTEM-111/48 (22.9%)11/36 (30.6%)dfrA15/48 (10.4%)9/36 (25.0%)
blaTEM-1563/48 (6.3%)0/36 (0.0%)fdfrA50/48 (0.0%)17/36 (47.2%)
blaVIM-10/48 (0.0%)2/36 (5.6%)dfrA120/48 (0.0%)3/36 (8.3%)
blaVIM-20/48 (0.0%)2/36 (5.6%)dfrA140/48 (0.0%)3/36 (8.3%)
ChlorampenicoldfrA170/48 (0.0%)1/36 (2.8%)
catA1/48 (2.1%)4/36 (11.1%)
catB2/48 (4.2%)0/36 (0.0%)
cmlA0/48 (0.0%)1/36 (2.8%)
Table 4. Number of ARGs conferring resistance to each antibiotic class and against environmental stressors that were unique to the VH metagenomic samples and HH metagenomic samples and that were present in both. * Streptogramin A and related antibiotics. The percentage is of the total genes identified for each class. QAC = quaternary ammonium compound.
Genes Unique to VH SamplesGenes Unique to HH SamplesGenes Present in Both
Antibiotic Class
Aminoglycosides17/103 (16.5%)57/103 (55.3%)29/103 (28.2%)
β-lactams52/295 (17.6%)228/295 (77.3%)15/295 (5.1%)
Amphenicols4/12 (33.3%)5/12 (41.7%)3/12 (25.0%)
Polymyxin (colistin)0/3 (0.0%)3/3 (100%)0/3 (0.0%)
Phosphonic acid antibiotics (fosfomycin)0/2 (0.0%)2/2 (100%)0/2 (0.0%)
Glycopeptide antibiotics (bleomycin)1/1 (100%)0/1 (0.0%)0/1 (0.0%)
Lincosamides3/10 (30.0%)6/10 (60.0%)1/10 (10.0%)
Macrolides2/9 (22.2%)5/9 (55.6%)2/0 (22.2%)
Erythromycins14/22 (63.6%)6/22 (27.3%)2/22 (9.1%)
Fluoroquinolones1/11 (9.1%)8/11 (72.7%)2/11 (18.2%)
Rifamycins0/1 (0.0%)1/1 (100%)0/1 (0.0%)
Streptogramin A *1/2 (50%)1/2 (50%)0/2 (0.0%)
Sulfonomides5/47 (10.6%)19/47 (40.4%)23/47 (48.9%)
Tetracyclines24/44 (54.5%)12/44 (27.3%)8/44 (18.2%)
Trimethoprim1/26 (3.8%)20/26 (76.9%)5/26 (19.2%)
Multiple classes0/2 (0.0%)2/2 (100%)0/2 (0.0%)
Efflux pumps0/2 (0.0%)2/2 (100%)0/2 (0.0%)
Environmental stressors
Peroxide resistance0/1 (0.0%)1/1 (100%)0/1 (0.0%)
QAC disinfectants8/10 (80.0%)0/10 (0.0%)2/10 (20.0%)
Heat and stress resistance0/3 (0.0%)2/3 (66.7%)1/3 (33.3.%)
Total (antibiotic classes)125/592 (21.1%)377/592 (63.7%)90/592 (15.2%)
Total (environmental stressors)8/14 (57.1%)3/14 (21.4%)3/14 (21.4%)
Total (both)133/606 (21.9%)380/606 (62.7%)93/606 (15.3%)
Table 5. Overview of plasmids found. Statistical analysis undertaken using Welch’s t test.
EnterobacterialesGram Positives
VHHHSignificanceVHHHSignificance
Mean number of plasmid types per samples (SD)0.1
(SD = 0.5)
3.4
(SD = 3.3)
p < 0.00010.8
(SD = 2.1)
0.2
(SD = 0.5)
No significance
No. samples that plasmid types identified from (%)2/48
(4.2%)
24/36
(66.7%)
n/a14/48
(29.2%)
6/36
(16.7%)
n/a
Total plasmid types identified4120p < 0.0001405p < 0.0001
Number of unique plasmid types3119p < 0.0001352p < 0.0001
Number of plasmid types in both1n/a3n/a
Disclaimer/Publisher’s Note: The statements, opinions and data contained in all publications are solely those of the individual author(s) and contributor(s) and not of MDPI and/or the editor(s). MDPI and/or the editor(s) disclaim responsibility for any injury to people or property resulting from any ideas, methods, instructions or products referred to in the content.