

Association Between Antimicrobials and Pump Proton Inhibitors Consumption with the Incidence of Nosocomial Clostridiodes difficile Infection in High Complexity Hospitals in Costa Rica
 , , , , and
Abstract
1. Introduction
2. Results
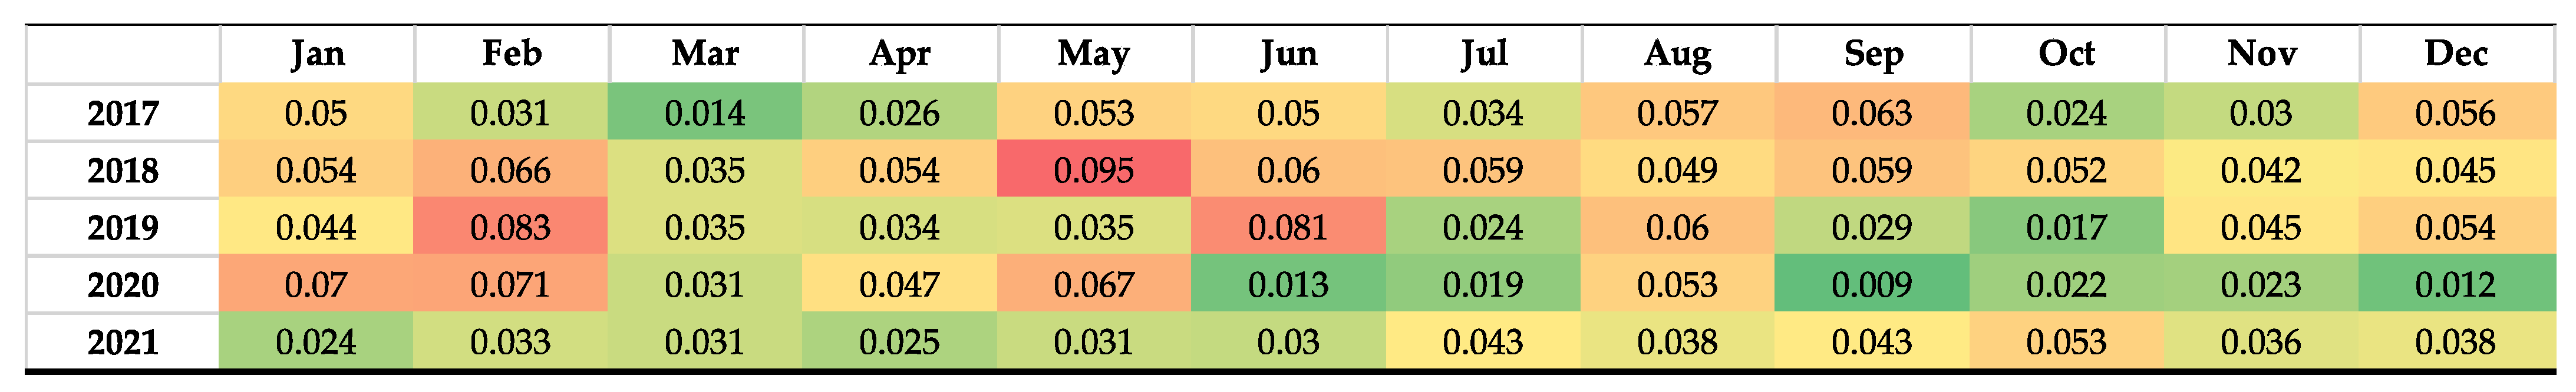
2.1. Incidence of Clostridiodes difficile Infection
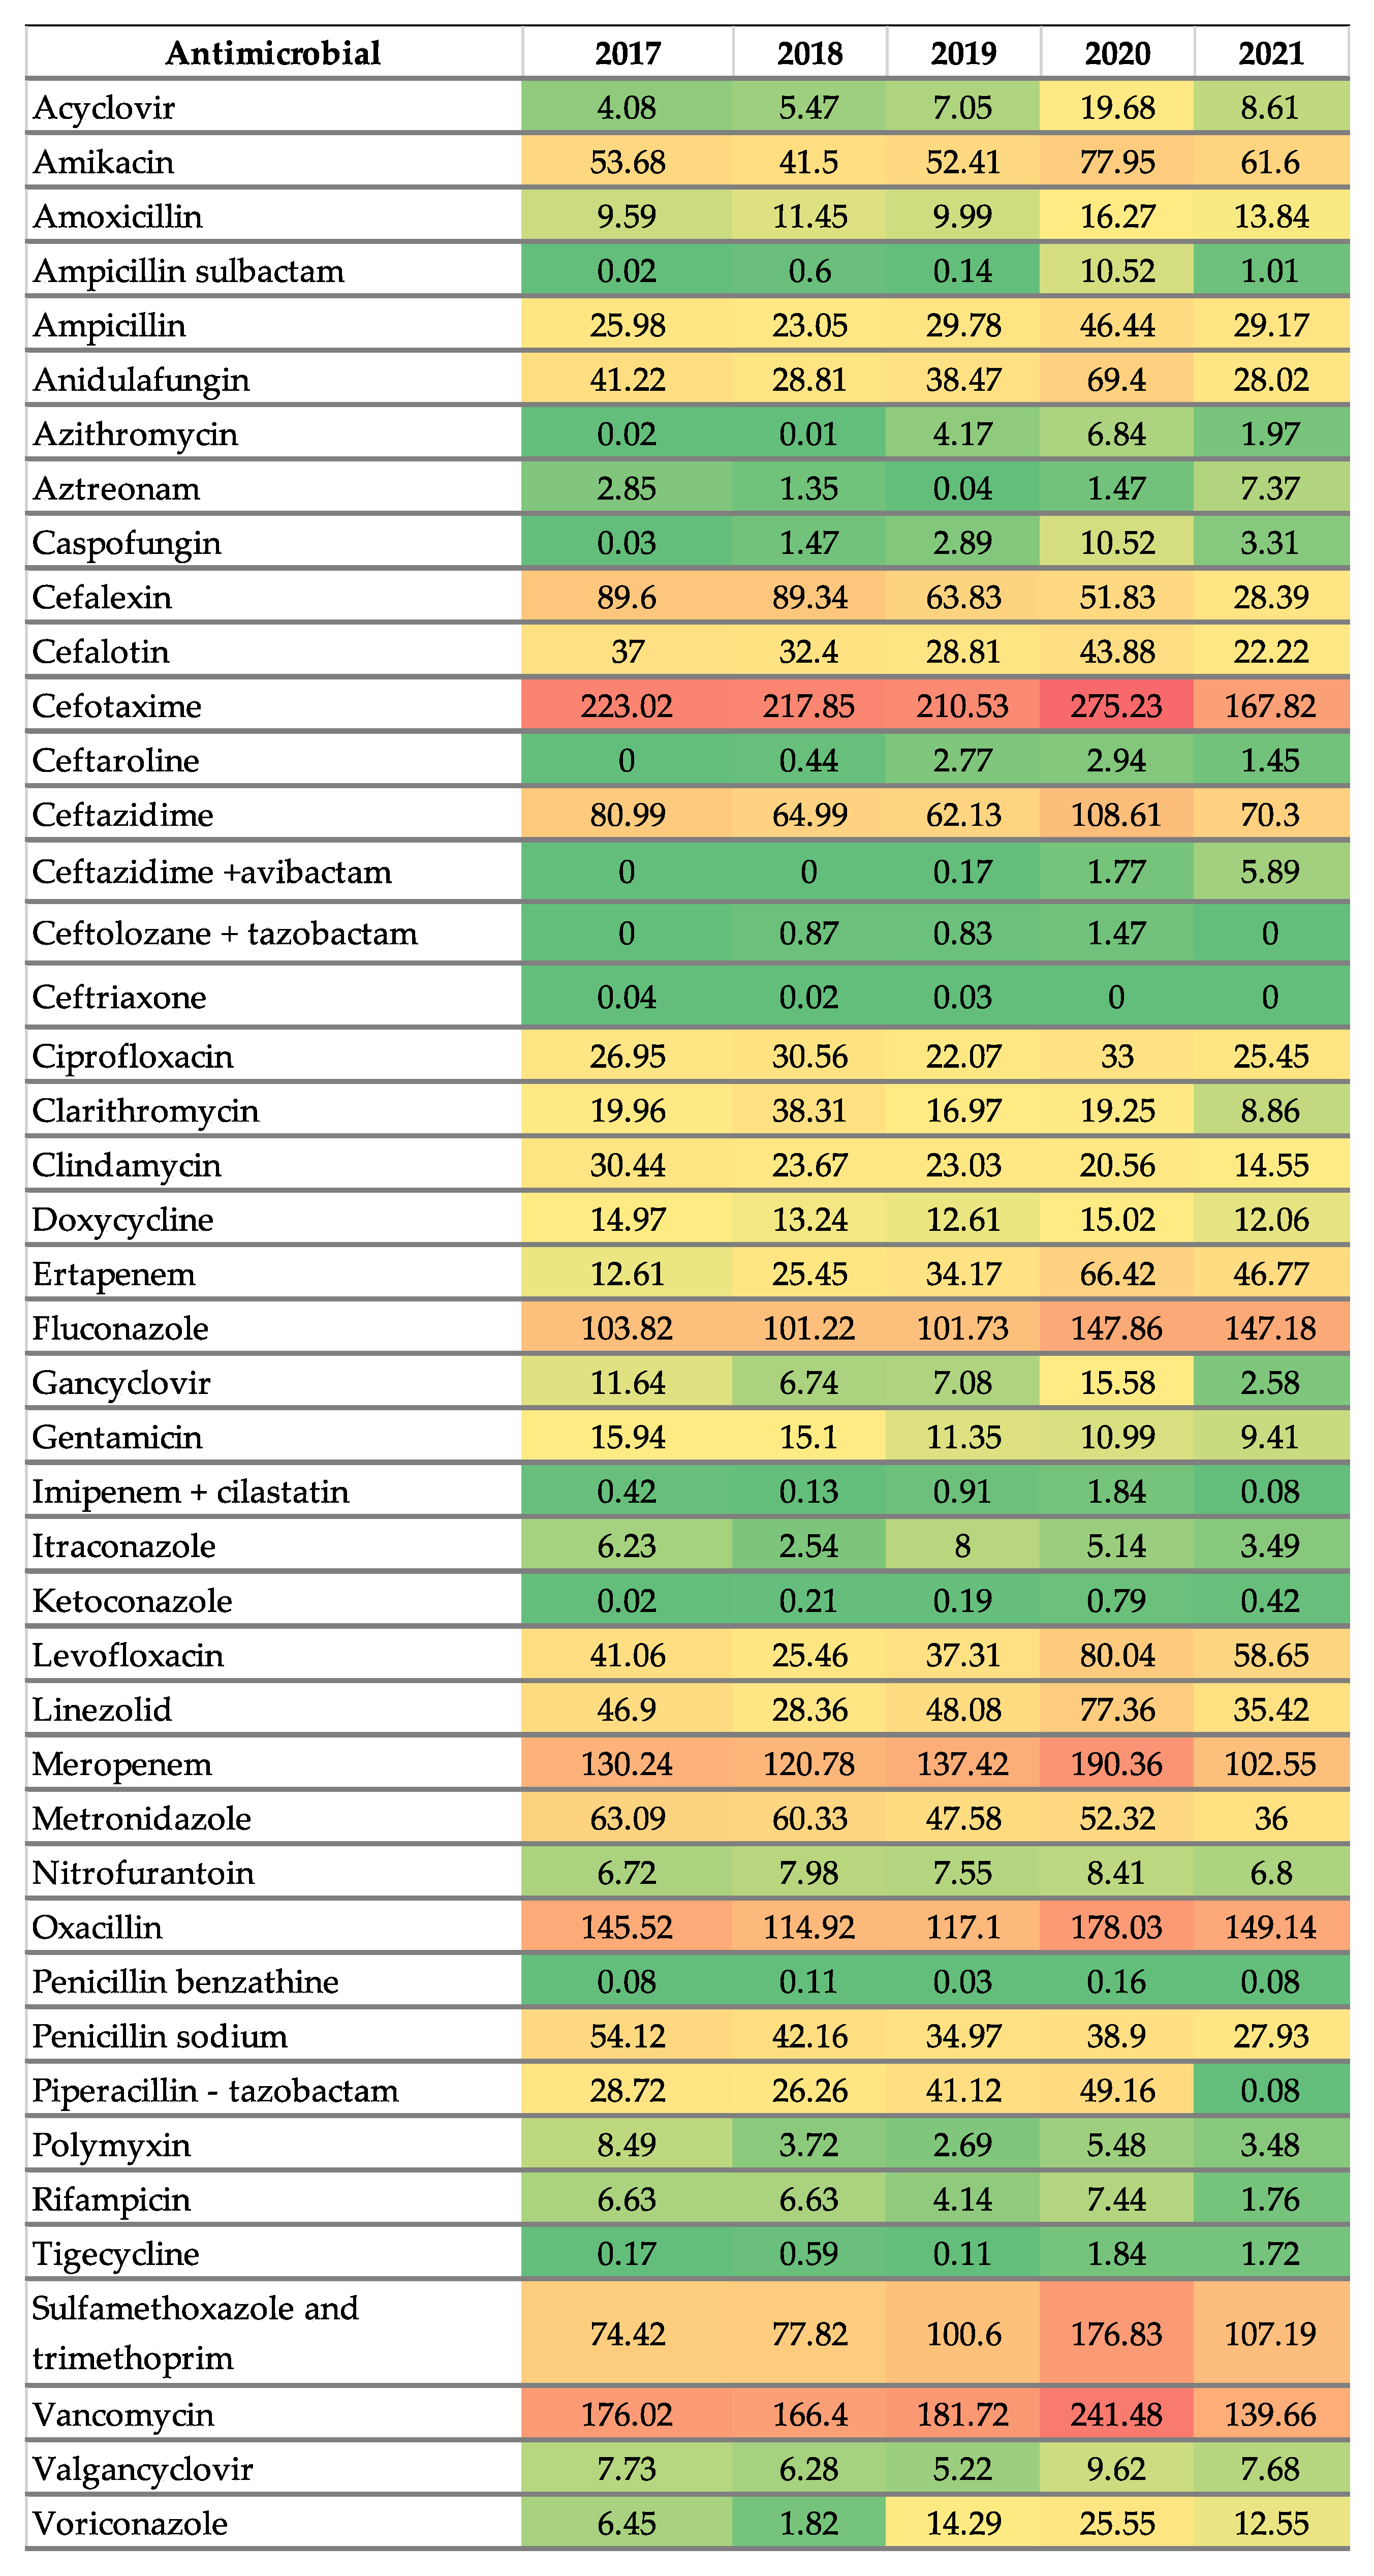
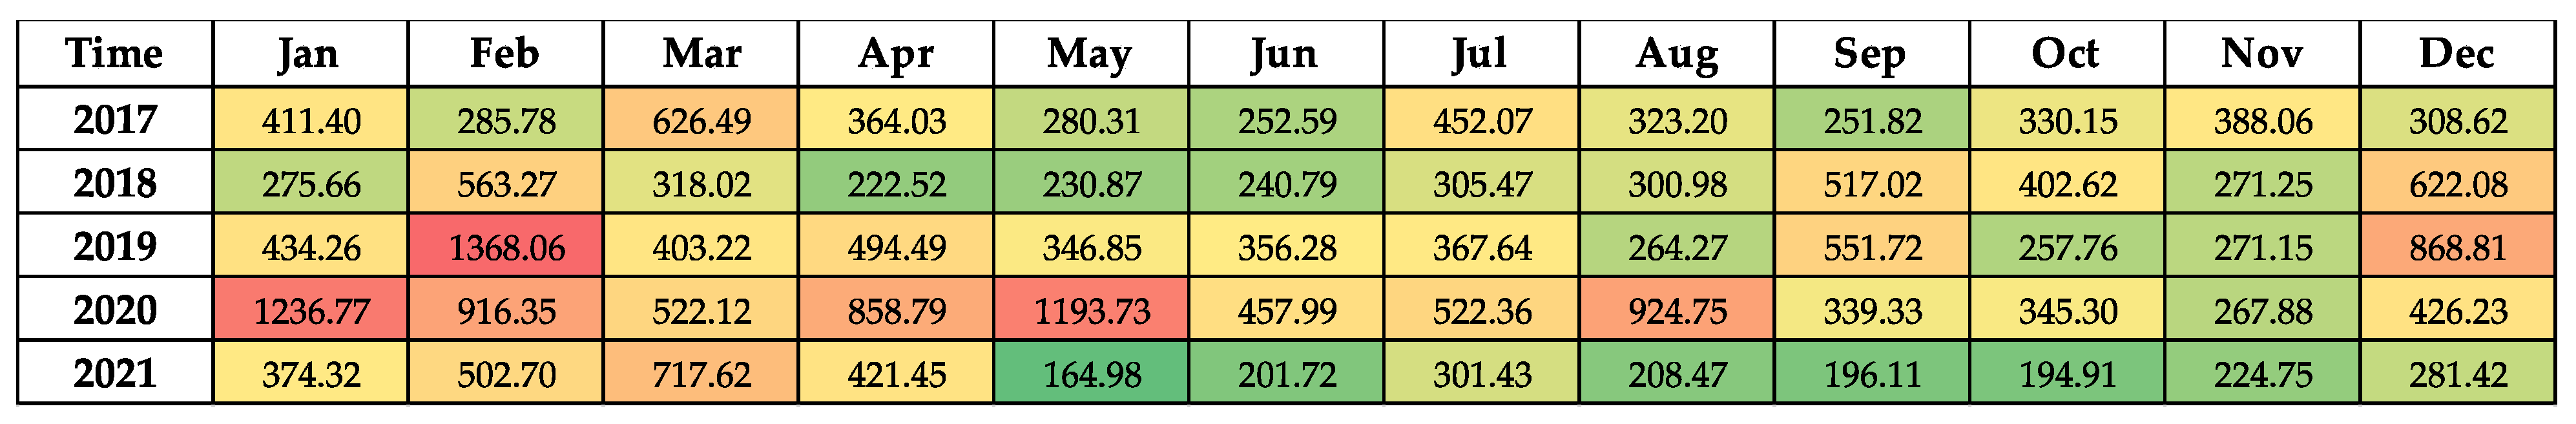
2.2. Antimicrobial Consumption
2.3. Correlation Between CDI Rates with Antimicrobial Consumption and PPI
2.4. Interrupted Time Series Analysis
3. Discussion
4. Materials and Methods
4.1. Study Design and Population
4.2. Definitions and Surveillance
4.3. Variables
4.4. Statistical Analysis
5. Conclusions
Author Contributions
Funding
Institutional Review Board Statement
Informed Consent Statement
Data Availability Statement
Acknowledgments
Conflicts of Interest
Abbreviations
| PPIs | Proton Pump Inhibitors |
| CDI | Clostridiodes difficile infection |
| CDC | The United Stated Center of Disease Control and Prevention |
| GIPCR | Gastrointestinal tractPolymerase chain reaction |
| ASP | Antimicrobial Stewardship Program |
| DDD | Defined Daily Dose |
| WHO | World Health Organization |
| AWaRe | Access, Watch and Reserve |
| AAPC | Average Annual Percent Change |
| SIFA | Integrated Pharmacy System |
Appendix A

| Antimicrobials | January 2019 | March 2020 | September 2020 | ||||||
|---|---|---|---|---|---|---|---|---|---|
| Hospital Onset CDI per Period | Breakpoint | Change in Trend at Breakpoint | Hospital Onset CDI per Period | Breakpoint | Change in Trend at Breakpoint | Hospital Onset CDI per Period | Breakpoint | Change in Trend at Breakpoint | |
| AWaRe | |||||||||
| Access | 0.0005 (−0.0095 to 0.0083) p = 0.91 | −0.2573 (−6.047 to 5.3939) p = 0.91 | −0.0353 (−0.3994 to 0.2945) p = 0.82 | 0.0008 (−0.0100 to 0.0089) p = 0.86 | −0.8528 (−9.6531 to 5.0836) p = 0.78 | 0.0214 (−0.4704 to 0.5136) p = 0.78 | 0.0003 (−0.0097 to 0.0080) p = 0.95 | −1.04 (−14.6290 to 4.6376) p = 0.77 | 0.0715 (−0.6724 to 1.0190) p = 0.82 |
| Reserve | 0.0036 (−0.0536 to 0.0363) p = 0.85 | −0.3486 (−6.3406 to 5.4375) p = 0.89 | −0.0378 (−0.3930 to 0.2941) p = 0.81 | 0.0050 (−0.0520 to 0.0500) p = 0.83 | −0.9107 (−9.7930 to 4.8564) p = 0.77 | 0.0267 (−0.4590 to 0.5351) p = 0.90 | 0.0016 (−0.0525 to 0.0382) p = 0.93 | −1.0131 (−14.6226 to 4.7297) p = 0.78 | 0.0708 (−0.6696 to 1.0243) p = 0.83 |
| Watch | 0.0003 (−0.0056 to 0.0041) p = 0.89 | −0.2667 (−6.0762 to 5.3863) p = 0.91 | −0.0328 (−0.3875 to 0.2964) p = 0.83 | 0.0006 (−0.0058 to 0.0054) p = 0.82 | −0.9156 (−9.7837 to 4.7265) p = 0.77 | 0.0318 (−0.4546 to 0.5595) p = 0.89 | 0.0003 (−0.0058 to 0.0048) p = 0.90 | −1.0178 (−14.6046 to 4.6610) p = 0.78 | 0.0779 (−0.6753 to 1.0312) p = 0.81 |
| Antivirals | |||||||||
| Antivirals | 0.0006 (−0.1114 to 0.0460) p = 0.98 | −0.2011 (−5.6816 to 5.4144) p = 0.93 | −0.0334 (−0.3876 to 0.2953) p = 0.83 | 0.0040 (−0.1130 to 0.0880) p = 0.92 | −0.7728 (−10.1954 to 4.8132) p = 0.82 | 0.0143 (−0.4587 to 0.5467) p = 0.94 | −0.0013 (−0.1134 to 0.0497) p = 0.97 | −1.0623 (−14.6450 to 4.8109) p = 0.77 | 0.0697 (−0.6772 to 1.0225) p = 0.83 |
| Acyclovir | −0.0023 (−0.3019 to 0.0650) p = 0.97 | −0.2011 (−5.6816 to 5.4144) p = 0.93 | −0.0334 (−0.3876 to 0.2953) p = 0.83 | 0.0048 (−0.3019 to 0.1549) p = 0.94 | −0.7324 (−11.8190 to 4.8138) p = 0.83 | 0.0114 (−0.4600 to 0.6259) p = 0.95 | 0.0008 (−0.3176 to 0.0723) p = 0.98 | −1.0550 (−14.6492 to 5.2825) p = 0.77 | 0.0677 (−0.6860 to 1.0219) p = 0.84 |
| Ganciclovir | 0.0096 (−0.1965 to 0.1369) p = 0.89 | −0.2743 (−6.0194 to 5.4043) p = 0.91 | −0.0360 (−0.3972 to 0.2945) p = 0.82 | 0.0104 (−0.1973 to 0.1552) p = 0.89 | −0.7208 (−9.4310 to 4.6557) p = 0.80 | 0.0137 (−0.4527 to 0.4991) p = 0.94 | 0.0067 (−0.1974 to 0.1386) p = 0.93 | −1.0444 (−14.6218 to 4.6417) p = 0.77 | 0.0715 (−0.6713 to 1.0187) p = 0.82 |
| Valganciclovir | −0.0077 (−0.3437 to 0.1892) p = 0.95 | −0.2069 (−5.4417 to 5.3905) p = 0.93 | −0.0327 (−0.3883 to 0.2973) p = 0.83 | −0.0001 (−0.0010 to 0.0007) p = 0.75 | −0.0243 (−0.0427 to −0.0059) p = 0.008 | 0.0000 (−0.0012 to 0.0013) p = 0.93 | −0.0050 (−0.3455 to 0.2012) p = 0.96 | −1.0311 (−14.6376 to 4.6705) p = 0.78 | 0.0649 (−0.6696 to 1.0143) p = 0.84 |
| Antifungals | |||||||||
| Antifungals | 0.0000 (−0.0244 to 0.0194) p = 0.99 | −0.1941 (−5.9013 to 5.4732) p = 0.93 | −0.0332 (−0.3911 to 0.2966) p = 0.84 | 0.0006 (−0.0258 to 0.0217) p = 0.96 | −0.6977 (−10.0415 to 4.9719) p = 0.83 | 0.0095 (−0.4546 to 0.5455) p = 0.96 | 0.0005 (−0.0261 to 0.0189) p = 0.95 | −1.1049 (−14.7746 to 5.2328) p = 0.77 | 0.0747 (−0.6901 to 1.0552) p = 0.83 |
| Anidulafungin | 0.0024 (0.0660 to 0.0399) p = 0.92 | −0.2628 (−6.0873 to 5.4242) p = 91 | −0.0342 (−0.3878 to 0.2951) p = 0.82 | 0.0047 (−0.065 to 0.0610) p = 0.87 | −0.8567 (−9.9297 to 4.7077) p = 0.79 | 0.0231 (−0.4529 to 0.5497) p = 0.92 | 0.0023 (−0.0658 to 0.0431) p = 0.92 | −1.0605 (−14.6330 to 4.6767) p = 0.77 | 0.0753 (−0.6761 to 1.0301) p = 0.82 |
| Caspofungin | 0.0128 (−0.4322 to 0.2290) p = 0.92 | −0.2431 (−5.9853 to 5.4011) p = 0.92 | −0.0325 (−0.3867 to 0.2993) p = 0.83 | 0.0354 (−0.4600 to 0.3618) p = 0.84 | −0.9395 (−9.7380 to 5.1209) p = 0.77 | 0.0322 (−0.4875 to 0.5582) p = 0.89 | 0.0090 (−0.4552 to 0.2759) p = 0.95 | −1.0202 (−14.6645 to 4.6453) p = 0.78 | 0.0708 (−0.6870 to 1.0178) p = 0.83 |
| Fluconazole | −0.0009 (−0.0366 to 0.0263) p = 0.95 | −0.1885 (−5.4794 to 5.4019) p = 0.93 | −0.0315 (−0.3888 to 0.2982) p = 0.84 | −0.0004 (−0.0373 to 0.0258) p = 0.97 | −0.5950 (−9.7314 to 4.6668) p = 0.84 | 0.0039 (−0.4515 to 0.5104) p = 0.98 | 0.0005 (−0.0390 to 0.0256) p = 0.97 | −1.1039 (−15.0177 to 5.3354) p = 0.78 | 0.0714 (−0.6781 to 1.0636) p = 0.84 |
| Itraconazole | 0.0054 (−0.3994 to 0.01881) p = 0.96 | −0.2359 (−5.8501 to 5.5260) p = 0.92 | −0.0338 (−0.3870 to 0.2952) p = 0.83 | −0.0015 (−0.3965 to 0.1625) p = 0.98 | −0.6241 (−9.3305 to 4.5433) p = 0.82 | 0.0047 (−0.4503 to 0.4819) p = 0.98 | 0.0037 (−0.3926 to 0.1705) p = 0.97 | −1.0524 (−14.6372 to 4.6629) p = 0.77 | 0.0670 (−0.6702 to 1.0140) p = 0.83 |
| Ketoconazole | 0.0467 (−3.1821 to 1.4258) p = 0.96 | −0.1981 (−5.4691 to 5.3960) p = 0.93 | −0.0332 (−0.3886 to 0.2957) p = 0.83 | 0.1021 (−3.1558 to 1.8541) p = 0.91 | −0.6988 (−9.4203 to 4.6571) p = 0.81 | 0.0097 (−0.4637 to 0.4878 p = 0.96 | 0.0561 (−3.1593 to 1.5261) p = 0.95 | −1.0519 (−14.6398 to 4.6383) p = 0.77 | 0.0683 (−0.6694 to 1.0169) p = 0.83 |
| Voriconazole | −0.0024 (−0.1727 to 0.0921) p = 0.89 | −0.1538 (−6.1370 to 5.6403) p = 0.95 | −0.0325 (−0.3878 to 0.2968) p = 0.83 | −0.0002 (−0.1794 to 0.1184) p = 0.99 | −0.6175 (−9.4550 to 5.4526) p = 0.84 | 0.0045 (−0.5070 to 0.4995) p = 0.98 | −0.0052 (−0.1707 to 0.0936) p = 0.92 | −1.0608 (−14.8026 to 4.7114) p = 0.77 | 0.0594 (−0.6986 to 1.0148) p = 0.85 |
| Antibiotics | |||||||||
| Antibiotics | 0.0002 (−0.0034 to 0.0027) p = 0.89 | −0.2759 (−6.1584 to 5.3900) p = 0.91 | −0.0341 (−0.3911 to 0.2951) p = 0.83 | 0.0004 (−0.0036 to 0.0035) p = 0.82 | −0.9326 (−9.8016 to 4.8605) p = 0.77 | 0.0309 (−0.4599 to 0.5469) p = 0.89 | 0.0002 (−0.0035 to 0.0029) p = 0.91 | −1.0244 (−14.6110 to 4.6520) p = 0.78 | 0.0759 (−0.6741 to 1.0271) p = 0.82 |
| Aminoglycosides | 0.0030 (−0.0153 to 0.0305) p = 0.87 | −0.2689 (−5.8877 to 5.3796) p = 0.91 | −0.0376 (−0.4007 to 0.2946) p = 0.81 | 0.0046 (−0.0571 to 0.0477) p = 84 | −0.8860 (−10.0507 to 4.7371) p = 0.78 | 0.0196 (−0.4505 to 0.5315) p = 0.92 | 0.0016 (−0.0569 to 0.0326) p = 0.93 | −1.0418 (−14.6712 to 4.6642) p = 0.77 | 0.0701 (−0.6691 to 1.0328) p = 0.83 |
| Amikacin | 0.0029 (−0.0572 to 0.0312) p = 0.88 | −0.2676 (−5.9186 to 5.3816) p = 0.91 | −0.0376 (−0.4007 to 0.2946) p = 0.81 | 0.0046 (−0.0571 to 0.0477) p = 0.84 | −0.8860 (−10.0507 to 4.7371) p = 0.78 | 0.0196 (−0.4505 to 0.5315) p = 0.92 | 0.0016 (−0.0569 to 0.0326) p = 0.93 | −1.0418 (−14.6712 to 4.6642) p = 0.77 | 0.0701 (−0.6691 to 1.0328) p = 0.83 |
| Gentamicin | 0.0075 (−0.2371 to 0.1844) p = 0.94 | −0.1954 (−5.4266 to 5.3899) p = 0.93 | −0.0333 (−0.3861 to 0.2952) p = 0.83 | 0.0067 (−0.2371 to 0.1840) p = 0.94 | −0.6146 (−9.3075 to 4.5515) p = 0.83 | 0.0042 (−0.4530 to 0.4816) p = 0.98 | 0.0091 (−0.2366 to 0.1872) p = 0.92 | −1.0626 (−14.6321 to 4.6383) p = 0.77 | 0.0664 (−0.6688 to 1.0128) p = 0.83 |
| Carbapenems | 0.0009 (−0.0216 to 0.0139) p = 0.91 | −0.2563 (−6.0278 to 5.3985) p = 0.91 | −0.033 (−0.3885 to 0.2970) p = 0.83 | 0.0021 (−0.0228 to 0.0227) p = 0.83 | −0.9612 (−10.0725 to 4.7836) p = 0.77 | 0.0331 (−0.4581 to 0.5886) p = 0.89 | 0.0009 (−0.0226 to 0.0164) p = 0.91 | −1.0445 (−14.6088 to 4.6325) p = 0.71 | 0.0786 (−0.6772 to 1.0280) p = 0.81 |
| Aztreonam | 0.0070 (−0.5594 to 0.3352) p = 0.97 | −0.1792 (−5.5257 to 5.4647) p = 0.94 | −0.0346 (−0.4447 to 0.3229) p = 0.84 | 0.0023 (−0.5844 to 0.3442) p = 0.99 | −0.6225 (−9.3228 to 4.5459) p = 0.82 | 0.0036 (−0.5077 to 0.5251) p = 0.98 | −0.0015 (−0.6073 to 0.3836) p = 0.99 | −1.0427 (−14.7872 to 4.7854) p = 0.78 | 0.0671 (−0.6886 to 1.0260) p = 0.84 |
| Ertapenem | 0.0038 (−0.0700 to 0.0413) p = 0.88 | −0.2265 (−5.6727 to 5.3886) p = 0.92 | −0.0311 (−0.3864 to 0.3051) p = 0.84 | 0.0082 (−0.0701 to 0.0716) p = 0.79 | −0.9865 (−10.1565 to 4.6538) p = 0.76 | 0.0323 (−0.4541 to 0.5656) p = 0.88 | 0.0030 (−0.0714 to 0.0495) p = 0.91 | −0.9810 (−14.6279 to 5.0792) p = 0.79 | 0.0716 (−0.6685 to 1.0404) p = 0.82 |
| Imipenem Cilastatin | 0.0258 (−1.1997 to 0.3109) p = 0.91 | −0.2397 (−5.7173 to 5.3882) p = 0.92 | −0.0329 (−0.3866 to 0.2970) p = 0.83 | 0.0444 (−1.1975 to 0.5158) p = 0.87 | −0.7682 (−9.5684 to 4.6221) p = 0.80 | 0.0164 (−0.4594 to 0.5074) p = 0.93 | 0.0124 (−1.2308 to 0.3410) p = 0.96 | −1.0225 (−14.6374 to 4.8281) p = 0.78 | 0.0670 (−0.6695 to 1.0153) p = 0.83 |
| Meropenem | 0.0009 (−0.0256 to 0.0196) p = 0.93 | −0.2458 (−6.0018 to 5.4393) p = 0.92 | −0.0332 (−0.3879 to 0.2956) p = 0.83 | 0.0019 (−0.0273 to 0.0271) p = 0.88 | −0.8254 (−9.7619 to 4.7843) p = 0.79 | 0.0233 (−0.4603 to 0.5497) p = 0.92 | 0.0011 (−0.0274 to 0.0221) p = 0.92 | −1.0670 (−14.6158 to 4.6710) p = 0.77 | 0.0789 (−0.6875 to 1.0223) p = 0.82 |
| Cephalosporins | 0.0010 (−0.0134 to 0.0118) p = 0.87 | −0.2691 (−5.9553 to 5.3721) p = 0.91 | −0.0328 (−0.3895 to 0.2955) p = 0.83 | 0.0014 (−0.0319 to 0.0126) p = 0.82 | −0.8180 (−9.5002 to 4.7667) p = 0.78 | 0.0254 (−0.4626 to 0.5167) p = 0.90 | 0.0008 (−0.4626 to 0.5167) p = 0.90 | −0.9912 (−14.5968 to 4.7190) p = 79 | 0.0748 (−0.6701 to 1.0233) p = 82 |
| Cephalexin | 0.0007 (−0.0560 to 0.0335) p = 0.97 | −0.1878 (−5.4345 to 5.4309) p = 0.93 | −0.0321 (−0.3861 to 0.3065) p = 0.84 | 0.0013 (−0.0530 to 0.0434) p = 0.95 | −0.6159 (−9.3160 to 4.5364) p = 0.82 | 0.0062 (−0.4606 to 0.4821) p = 0.97 | 0.0006 (−0.0510 to 0.0361) p = 0.97 | −1.0322 (−14.6544 to 4.9047) p = 0.78 | 0.0659 (−0.6708 to 1.0142) p = 0.83 |
| Cephalothin | 0.0031 (−0.1079 to 0.0474) p = 0.92 | −0.2308 (−5.7018 to 5.3955) p = 0.92 | −0.0336 (−0.3886 to 0.2946) p = 0.83 | 0.0040 (−0.1089 to 0.0676) p = 0.91 | −0.6909 (−9.3205 to 4.7441) p = 0.81 | 0.0131 (−0.4898 to 0.4908) p = 0.95 | 0.0003 (−0.1140 to 0.0504) p = 0.99 | −1.0408 (−14.7199 to 4.9238) p = 0.78 | 0.0664 (−0.6700 to 1.0145) p = 0.83 |
| Cefotaxime | 0.0009 (−0.0198 to 0.0162) p = 0.91 | −0.2547 (−5.8497 to 5.3967) p = 0.91 | −0.0323 (−0.3858 to 0.2955) p = 0.83 | 0.0014 (−0.0197 to 0.0177) p = 0.87 | −0.7515 (−9.5098 to 4.5944) p = 0.80 | 0.0188 (−0.4505 to 0.5188) p = 0.93 | 0.0008 (−0.0197 to 0.0165) p = 0.92 | −1.0258 (−14.6159 to 4.6675) p = 0.78 | 0.0739 (−0.6724 to 1.0241) p = 0.82 |
| Ceftazidime/Avibactam | 0.0149 (−0.9332 to 0.4016) p = 0.95 | −0.1759 (−5.4946 to 5.4344) p = 0.94 | −0.0364 (−0.4067 to 0.3120) p = 0.82 | 0.0194 (−1.0239 to 0.4358) p = 0.94 | −0.6469 (−9.4814 to 4.5897) p = 0.82 | 0.0001 (−0.4531 to 0.5139) p = 0.99 | 0.0083 (−1.0845 to 0.5016) p = 0.97 | −1.0599 (−14.8155 to 4.6740) p = 0.72 | 0.0642 (−0.6878 to 1.0166) p = 0.84 |
| Ceftaroline | 0.0003 (−0.6986 to 0.1869) p = 0.99 | −0.1957 (−5.5017 to 5.4136) p = 0.93 | −0.0332 (−0.3862 to 0.2957) p = 0.83 | −0.0001 (−0.7155 to 0.2331) p = 0.99 | −0.6215 (−9.3457 to 4.6171) p = 0.82 | 0.0048 (−0.4815 to 0.4819) p = 0.98 | −0.0103 (−0.7190 to 0.1975) p = 0.94 | −1.1012 (−14.7423 to 4.9203) p = 0.77 | 0.0676 (−0.6696 to 1.0160) p = 0.83 |
| Ceftazidime | 0.0211 (−0.0444 to 0.0426) p = 0.84 | −0.2729 (−5.8625 to 5.3586) p = 0.91 | −0.0407 (−0.4105 to 0.2951) p = 0.80 | 0.0050 (−0.0441 to 0.04711) p = 0.81 | −0.8657 (−9.6879 to 4.6134) p = 0.77 | 0.0166 (−0.4482 to 0.5021) p = 0.93 | 0.0032 (−0.0439 to 0.0427) p = 0.87 | −1.0732 (−14.6659 to 4.7119) p = 0.77 | 0.0747 (−0.6697 to 1.0276) p = 0.81 |
| Ceftolozane/Tazobactam | 0.0265 (−1.1830 to 0.3649) p = 0.92 | −0.2028 (−5.4502 to 5.3868) p = 0.93 | −0.0298 (−0.3877 to 0.3054) p = 0.85 | 0.0454 (−1.1748 to 0.5019) p = 0.87 | −0.6897 (−9.3541 to 4.5374) p = 0.81 | 0.0144 (−0.4564 to 0.5001) p = 0.94 | 0.0240 (−1.1725 to 0.4229) p = 0.93 | −1.0012 (−14.6202 to 4.9676) p = 0.78 | 0.0678 (−0.6689 to 1.0160) p = 0.83 |
| Ceftriaxone | −0.5503 (−50.6005 to 10.2708) p = 0.95 | −0.1941 (−5.4509 to 5.4293) p = 0.93 | −0.0336 (−0.4004 to 0.2975) p = 0.83 | −0.5907 (−50.4747 to 10.1571) p = 0.94 | −0.6290 (−9.3234 to 4.5381) p = 0.82 | 0.0052 (−0.4501 to 0.4824) p = 0.97 | −0.5627 (−50.6230 to 10.1139) p = 0.94 | −1.0503 (−14.6426 to 4.6402) p = 0.77 | 0.0668 (−0.6694 to 1.0147) p = 0.83 |
| Macrolides | 0.0025 (−0.1079 to 0.0630) p = 0.94 | −0.1506 (−5.4861 to 5.5395) p = 0.95 | −0.0293 (−0.3901 to 0.3156) p = 0.86 | 0.0059 (−0.0994 to 0.0593) p = 0.87 | −0.6899 (−9.3056 to 4.6110) p = 0.81 | 0.0137 (−0.4757 to 0.4854) p = 0.94 | 0.0024 (−0.1071 to 0.0589) p = 0.94 | −0.9884 (−14.6888 to 5.0126) p = 79 | 0.0658 (−0.6695 to 1.0136) p = 0.83 |
| Azithromycin | −0.0027 (−0.4889 to 0.1127) p = 0.98 | −0.1795 (−5.6446 to 5.5019) p = 0.94 | −0.0335 (−0.3865 to 0.2954) p = 0.83 | −0.0005 (−0.4987 to 0.1943) p = 0.99 | −0.6192 (−9.3150 to 4.6934) p = 0.83 | 0.0046 (−0.4864 to 0.4844) p = 0.98 | −0.0082 (−0.5044 to 0.1202) p = 0.94 | −1.0944 (−14.7725 to 4.6475) p = 0.77 | 0.0662 (−0.6857 to 1.0172) p = 0.83 |
| Clarithromycin | 0.0037 (−0.1169 to 0.0762) p = 0.93 | −0.1074 (−5.5663 to 5.8119) p = 0.96 | −0.0278 (−0.3897 to 0.3210) p = 0.87 | 0.0063 (−0.1039 to 0.0599) p = 0.86 | −0.6569 (−9.3037 to 4.5210) p = 0.81 | 0.0104 (−0.4521 to 0.4839) p = 0.95 | 0.0040 (−0.1103 to 0.0598) p = 0.92 | −0.9751 (−14.6237 to 4.9818) p = 0.79 | 0.0653 (−0.6699 to 1.0125) p = 0.83 |
| Penicillins | 0.0006 (−0.0162 to 0.0126) p = 0.93 | −0.2502 (−5.9861 to 5.4333) p = 0.91 | −0.0351 (−0.3935 to 0.2949) p = 0.82 | 0.0011 (−0.0167 to 0.0155) p = 0.88 | −0.8206 (−9.7186 to 5.0138) p = 0.79 | 0.0176 (−0.4630 to 0.5114) p = 0.93 | 0.0002 (−0.0164 to 0.0125) p = 0.98 | −1.0438 (−14.6543 to 4.6551) p = 0.77 | 0.0679 (−0.6701 to 1.0163) p = 0.83 |
| Amoxicillin | 0.0037 (−0.2388 to 0.2461) p = 0.97 | −0.1863 (−4.8462 to 4.4736) p = 0.93 | −0.0332 (−0.3431 to 0.2767) p = 0.83 | 0.0091 (−0.3166 to 0.2183) p = 0.94 | −0.6600 (−9.3043 to 4.6607) p = 0.82 | 0.0072 (−0.4579 to 0.4826) p = 0.97 | −0.0017 (−0.3143 to 0.2078) p = 0.98 | −1.0558 (−14.9566 to 4.6997) p = 0.77 | 0.0666 (−0.6712 to 1.0477) p = 0.83 |
| Ampicillin Sulbactam | −0.0025 (−0.4620 to 0.0389) p = 0.95 | −0.1884 (−5.4420 to 5.4000) p = 0.93 | −0.0335 (−0.3864 to 0.2948) p = 0.83 | 0.0002 (−0.4574 to 0.0810) p = 0.99 | −0.6265 (−9.8086 to 4.7564) p = 0.83 | 0.0052 (−0.4822 to 0.4979) p = 0.98 | −0.0041 (−0.4654 to 0.0420) p = 0.93 | −1.0840 (−14.6877 to 4.6890) p = 0.77 | 0.0664 (−0.6703 to 1.0143) p = 0.83 |
| Ampicillin | 0.0041 (−0.1093 to 0.0801) p = 0.92 | −0.2622 (−6.1881 to 5.4273) p = 0.91 | −0.0338 (−0.3886 to 0.2953) p = 0.83 | 0.0054 (−0.1098 to 0.0947) p = 0.91 | −0.7225 (−9.4998 to 4.6340) p = 0.81 | 0.0152 (−0.4531 to 0.5201) p = 0.94 | 0.0026 (−0.1101 to 0.0815) p = 0.95 | −1.0392 (−14.6312 to 4.6463) p = 0.77 | 0.0711 (−0.6730 to 1.0222) p = 0.83 |
| Oxacillin | 0.0005 (−0.0245 to 0.01777) p = 0.95 | −0.2183 (−5.6636 to 5.4175) p = 0.92 | −0.0353 (−0.3995 to 0.2992) p = 0.82 | 0.0008 (−0.0243 to 0.0196) p = 0.93 | −0.7108 (−9.7012 to 4.7101) p = 0.81 | 0.0081 (−0.4499 to 0.4958) p = 0.96 | 0.0002 (−0.0242 to 0.0166) p = 0.98 | −1.0566 (−14.6511 to 4.6507) p = 0.77 | 0.0678 (−0.6704 to 1.0189) p = 0.83 |
| Penicillin sodium | 0.0012 (−0.0829 to 0.0621) p = 0.97 | −0.1993 (−5.4415 to 5.3934) p = 0.93 | −0.0338 (−0.3897 to 0.2952) p = 0.83 | 0.0028 (−0.0822 to 0.0707) p = 0.93 | −0.6774 (−9.3499 to 4.6593) p = 0.81 | 0.0060 (−0.4513 to 0.4818) p = 0.97 | −0.0001 (−0.0832 to 0.0577) p = 0.99 | −1.0477 (−14.7006 to 4.6405) p = 0.77 | 0.0664 (−0.6700 to 1.0225) p = 0.83 |
| Penicillin benzathine | −0.4872 (−22.9761 to 7.6030) p = 0.94 | −0.2071 (−5.4255 to 5.3933) p = 0.92 | −0.0315 (−0.3889 to 0.2973) p = 0.84 | −0.1632 (−22.9182 to 10.3866) p = 0.98 | −0.5970 (−9.4315 to 4.8454) p = 0.84 | 0.0039 (−0.4656 to 0.4841) p = 0.98 | −0.3589 (−22.3922 to 8.0027) p = 0.95 | −1.0227 (−14.6305 to 4.8773) p = 0.78 | 0.0639 (−0.6752 to 1.0138) p = 0.84 |
| Piperacillin/Tazobactam | 0.0042 (−0.0788 to 0.0506) p = 0.88 | −0.3372 (−6.3895 to 5.4647) p = 0.89 | −0.0281 (−0.3866 to 0.3119) p = 0.86 | 0.0060 (−0.0821 to 0.0642) p = 0.85 | −0.7485 (−9.3739 to 4.6351) p = 0.79 | 0.0309 (−0.5079 to 0.5642) p = 0.90 | 0.0025 (−0.0910 to 0.0654) p = 0.94 | −0.9480 (−14.7637 to 5.2800) p = 0.81 | 0.0721 (−0.6824 to 1.0233) p = 0.82 |
| Fluoroquinolones | 0.0034 (−0.0490 to 0.0390) p = 0.87 | −0.2477 (−5.9084 to 5.3761) p = 0.91 | −0.0398 (−0.4155 to 0.2943) p = 0.80 | 0.0057 (−0.0493 to 0.0541) p = 0.81 | −0.9987 (−10.1611 to 4.7569) p = 0.76 | 0.0238 (−0.4465 to 0.5338) p = 0.91 | 0.0026 (−0.0490 to 0.0404) p = 0.89 | −1.0794 (−14.7321 to 4.6991) p = 0.77 | 0.0758 (−0.6692 to 1.0445) p = 0.81 |
| Ciprofloxacin | 0.0060 (−0.1373 to 0.0595) p = 0.88 | −0.1623 (−5.4154 to 5.4641) p = 0.94 | −0.0321 (−0.3885 to 0.2992) p = 0.83 | 0.0098 (−0.1267 to 0.0892) p = 0.82 | −0.7748 (−9.4248 to 4.5496) p = 0.79 | 0.0130 (−0.4516 to 0.4825) p = 0.94 | 0.0048 (−0.1301 to 0.0657) p = 0.90 | −0.9960 (−14.6064 to 4.7720) p = 0.78 | 0.0647 (−0.6688 to 1.0122) p = 0.84 |
| Levofloxacin | 0.0028 (−0.0610 to 0.0428) p = 0.90 | −0.2540 (−5.9819 to 5.3888) p = 0.91 | −0.0392 (−0.4158 to 0.2993) p = 0.81 | 0.0040 (−0.0602 to 0.0541) p = 0.88 | −0.8302 (−10.0717 to 4.7572) p = 0.79 | 0.0150 (−0.4489 to 0.5364) p = 0.94 | 0.0021 (−0.0612 to 0.0433) p = 0.92 | −1.0954 (−14.7874 to 4.9179) p = 0.77 | 0.0747 (−0.6721 to 1.0527) p = 0.82 |
| Tetracyclines | −0.0007 (−0.2322 to 0.1326) p = 0.99 | −0.1960 (−5.4300 to 5.4178) p = 0.93 | −0.0333 (−0.3864 to 0.2978) p = 0.83 | −0.0020 (−0.2359 to 0.1328) p = 0.98 | −0.6262 (−9.3176 to 4.5610) p = 0.82 | 0.0047 (−0.4505 to 0.4826) p = 0.98 | 0.0055 (−0.2223 to 0.1461) p = 0.94 | −1.0864 (−14.6932 to 4.7053) p = 0.77 | 0.0695 (−0.6700 to 1.0184) p = 0.83 |
| Doxycycline | −0.0034 (−0.2487 to 0.1328) p = 0.97 | −0.1976 (−5.4292 to 5.4082) p = 0.93 | −0.0334 (−0.3870 to 0.2976) p = 0.83 | −0.0037 (−0.2544 to 0.1350) p = 0.96 | −0.6251 (−9.3182 to 4.5419) p = 0.82 | 0.0046 (−0.4509 to 0.4818) p = 0.98 | 0.0024 (−0.2418 to 0.1495) p = 0.97 | −1.0615 (−14.6577 to 4.7202) p = 0.77 | 0.0673 (−0.6723 to 1.0148) p = 0.83 |
| Tigecycline | 0.0230 (−1.0965 to 0.3221) p = 0.92 | −0.1823 (−5.4245 to 5.3987) p = 0.93 | −0.0326 (−0.3876 to 0.2947) p = 0.83 | 0.0124 (−1.1002 to 0.3734) p = 0.96 | −0.6016 (−9.3097 to 4.7612) p = 0.83 | 0.0052 (−0.4506 to 0.4875) p = 0.97 | 0.0279 (−1.0802 to 0.3436) p = 0.90 | −1.0728 (−14.7052 to 4.6447) p = 0.77 | 0.0705 (−0.6716 to 1.0265) p = 0.82 |
| Clindamycin | 0.0063 (−0.1528 to 0.1220) p = 0.92 | −0.2619 (−5.7069 to 5.4470) p = 0.91 | −0.0369 (−0.4103 to 0.2983) p = 0.82 | 0.0025 (−0.1520 to 0.0981) p = 0.96 | −0.6220 (−9.3111 to 4.5506) p = 0.82 | 0.0052 (−0.4509 to 0.4818) p = 0.97 | 0.0014 (−0.1530 to 0.0958) p = 0.98 | −1.0422 (−14.6440 to 4.6435) p = 0.77 | 0.0661 (−0.6706 to 1.0144) p = 0.83 |
| Linezolid | 0.0031 (−0.0378 to 0.0439) p = 0.88 | −0.3288 (−5.3332 to 4.6755) p = 0.89 | −0.0352 (−0.3460 to 0.2756) p = 0.82 | 0.0051 (−0.0585 to 0.0546) p = 0.83 | −0.9266 (−10.0027 to 4.7608) p = 0.77 | 0.0290 (−0.4552 to 0.5611) p = 0.90 | 0.0014 (−0.0595 to 0.0377) p = 0.94 | −1.0183 (−14.6307 to 4.7429) p = 0.78 | 0.0708 (−0.6724 to 1.0240) p = 0.83 |
| Metronidazole | 0.0086 (−0.0837 to 0.0698) p = 0.81 | −0.1923 (−5.4642 to 5.4194) p = 0.93 | −0.0288 (−0.3845 to 0.3065) p = 0.85 | 0.0081 (−0.0829 to 0.0762) p = 0.82 | −0.5768 (−9.2517 to 4.5816) p = 0.84 | 0.0155 (−0.4470 to 0.4857) p = 0.95 | 0.0082 (−0.0838 to 0.0729) p = 0.82 | −0.9575 (−14.5238 to 4.9156) p = 0.79 | 0.0690 (−0.6719 to 1.0088) p = 0.83 |
| Nitrofurantoin | −0.0039 (−0.5718 to 0.3932) p = 0.98 | −0.1986 (−5.4531 to 5.3944) p = 0.93 | −0.0339 (−0.4006 to 0.2956) p = 0.83 | 0.0017 (−0.5305 to 0.3833) p = 0.99 | −0.6220 (−9.3190 to 4.5470) p = 0.82 | 0.0052 (−0.4598 to 0.4828) p = 0.97 | 0.0013 (−0.5313 to 0.3821) p = 0.99 | −1.0457 (−14.7024 to 4.6427) p = 0.77 | 0.0665 (−0.6754 to 1.0156) p = 0.83 |
| Polymyxin B | 0.0084 (−0.3206 to 0.1544) p = 0.93 | −0.2024 (−5.4773 to 5.3986) p = 0.93 | −0.0349 (−0.3883 to 0.2947) p = 0.82 | 0.0032 (−0.3188 to 0.1621) p = 0.97 | −0.6172 (−9.3126 to 4.5545) p = 0.83 | 0.0050 (−0.4504 to 0.4834) p = 0.97 | 0.0064 (−0.3186 to 0.1568) p = 0.95 | −1.0568 (−14.6559 to 4.6370) p = 0.77 | 0.0676 (−0.6704 to 1.0171) p = 0.83 |
| Rifampicin | −0.0140 (−0.4889 to 0.2730) p = 0.93 | −0.2180 (−5.4304 to 5.4267) p = 0.92 | −0.0356 (−0.3864 to 0.3053) p = 0.82 | 0.0067 (−0.4801 to 0.3678) p = 0.97 | −0.6649 (−9.5070 to 5.0639) p = 0.83 | 0.0079 (−0.5046 to 0.4958) p = 0.97 | −0.0157 (−0.4863 to 0.3025) p = 0.93 | −1.0939 (−14.7116 to 4.6694) p = 0.77 | 0.0630 (−0.6846 to 1.0128) p = 0.84 |
| Sulfamethoxazole and Trimethoprim | 0.0001 (−0.0382 to 0.0290) p = 0.99 | −0.1951 (−5.8733 to 5.4199) p = 0.93 | −0.0332 (−0.3880 to 0.2968) p = 0.83 | 0.0010 (−0.0386 to 0.0384) p = 0.95 | −0.6968 (−9.6623 to 4.7622) p = 0.82 | 0.0113 (−0.4554 to 0.5422) p = 0.96 | 0.0006 (−0.0386 to 0.0353) p = 0.97 | −1.0616 (−14.6365 to 4.9949) p = 0.77 | 0.0714 (−0.7402 to 1.0268) p = 0.83 |
| Vancomycin | 0.0009 (−0.0233 to 0.0157) p = 0.91 | −0.2509 (−5.9697 to 5.4052) p = 0.91 | −0.0326 (−0.3859 to 0.2958) p = 0.83 | 0.0015 (−0.0228 to 0.0174) p = 0.87 | −0.7914 (−9.5916 to 4.7207) p = 0.79 | 0.0218 (−0.4588 to 0.5312) p = 0.92 | 0.0007 (−0.0228 to 0.0166) p = 0.93 | −1.0279 (−14.6215 to 4.6666) p = 0.78 | 0.0738 (−0.6754 to 1.0275) p = 0.82 |
| Proton pump inhibitors | 0.0004 (−0.0059 to 0.0050) p = 0.86 | −0.3358 (−6.2083 to 5.4348) p = 0.89 | −0.0260 (−0.3920 to 0.3111) p = 0.87 | 0.0005 (−0.0061 to 0.0048) p = 0.84 | −0.6949 (−9.3610 to 4.5548) p = 0.80 | 0.0263 (−0.4669 to 0.5397) p = 0.90 | 0.0004 (−0.0062 to 0.0048) p = 87 | −0.9483 (−14.5743 to 5.0486) p = 0.80 | 0.0808 (−0.6678 to 1.0348) p = 0.81 |
References
- Czepiel, J.; Dróżdż, M.; Pituch, H.; Kuijper, E.J.; Perucki, W.; Mielimonka, A.; Goldman, S.; Wultańska, D.; Garlicki, A.; Biesiada, G. Clostridium difficile infection: Review. Eur. J. Clin. Microbiol. Infect. Dis. 2019, 38, 1211–1221. [Google Scholar] [PubMed]
- Center for Disease Control and Prevention (CDC). Antimicrobial Resistance. 2019 Antibiotic Resistance Threats Report. 2024. Available online: https://www.cdc.gov/antimicrobial-resistance/data-research/threats/index.html (accessed on 8 January 2025).
- Bella, S.D.; Sanson, G.; Monticelli, J.; Zerbato, V.; Principe, L.; Giuffrè, M.; Pipitone, G.; Luzzati, R. Clostridioides difficile infection: History, epidemiology, risk factors, prevention, clinical manifestations, treatment, and future options. Clin. Microbiol. Rev. 2024, 37, e0013523. [Google Scholar] [CrossRef] [PubMed]
- Slimings, C.; Riley, T.V. Antibiotics and healthcare facility-associated Clostridioides difficile infection: Systematic review and meta-analysis 2020 update. J. Antimicrob. Chemotherapy 2021, 76, 1676–1688. [Google Scholar]
- Owens, R.C. Clostridium difficile-Associated Disease. Drugs 2007, 67, 487–502. [Google Scholar]
- Britton, R.A.; Young, V.B. Role of the Intestinal Microbiota in Resistance to Colonization by Clostridium difficile. Gastroenterology 2014, 146, 1547–1553. [Google Scholar]
- Lawes, T.; Lopez-Lozano, J.M.; Nebot, C.A.; Macartney, G.; Subbarao-Sharma, R.; Wares, K.D.; Sinclair, C.; Gould, I.M. Effect of a national 4C antibiotic stewardship intervention on the clinical and molecular epidemiology of Clostridium difficile infections in a region of Scotland: A non-linear time-series analysis. Lancet Infect. Dis. 2017, 17, 194–206. [Google Scholar]
- Webb, B.J.; Subramanian, A.; Lopansri, B.; Goodman, B.; Jones, P.B.; Ferraro, J.; Stenehjem, E.; Brown, S.M. Antibiotic Exposure and Risk for Hospital-Associated Clostridioides difficile Infection. Antimicrob. Agents Chemother. 2020, 64, e02169-19. [Google Scholar]
- Brown, K.; Valenta, K.; Fisman, D.; Simor, A.; Daneman, N. Hospital Ward Antibiotic Prescribing and the Risks of Clostridium difficile Infection. JAMA Intern. Med. 2015, 175, 626–633. [Google Scholar]
- Kazakova, S.V.; Baggs, J.; McDonald, L.C.; Yi, S.H.; Hatfield, K.M.; Guh, A.; Reddy, S.C.; A Jernigan, J. Association Between Antibiotic Use and Hospital-onset Clostridioides difficile Infection in US Acute Care Hospitals, 2006–2012: An Ecologic Analysis. Clin. Infect. Dis. 2020, 70, 11–18. [Google Scholar]
- Leffler, D.A.; Lamont, J.T. Clostridium difficile Infection. N. Engl. J. Med. 2015, 372, 1539–1548. [Google Scholar]
- Zdravkovic, D.; Markovic-Denic, L.; Nikolic, V.; Todorovic, Z.; Brankovic, M.; Radojevic, A.; Radovanovic, D.; Toskovic, B. Antibiotic Usage and Healthcare-Associated Clostridioides difficile in patients with and Without COVID-19: A Tertiary Hospital Experience. Antibiotics 2025, 14, 303. [Google Scholar] [CrossRef] [PubMed]
- Mora-García, C.A.; Pearson, A.A.; Prado, A.M. Maintaining essential health services during a pandemic: Lessons from Costa Rica’s COVID-19 response. BMJ Glob. Health 2024, 8 (Suppl. S6), e014143. Available online: https://gh.bmj.com/content/8/Suppl_6/e014143 (accessed on 23 March 2025). [CrossRef] [PubMed]
- Azimirad, M.; Noori, M.; Raeisi, H.; Yadegar, A.; Shahrokh, S.; Asadzadeh Aghdaei, H.; Bentivegna, E.; Martelletti, P.; Petrosillo, N.; Zali, M.R. How Does COVID-19 Pandemic Impact on Incidence of Clostridioides difficile Infection and Exacerbation of Its Gastrointestinal Symptoms? Front. Med. 2021, 8, 775063. [Google Scholar] [CrossRef] [PubMed]
- Yu, H.; Flaster, N.; Casanello, A.L.; Curcio, D. Assessing risk factors, mortality, and healthcare utilization associated with Clostridioides difficile infection in four Latin American countries. Braz. J. Infect. Dis. 2021, 25, 101040. [Google Scholar] [CrossRef]
- Finn, E.; Andersson, F.L.; Madin-Warburton, M. Burden of Clostridioides difficile infection (CDI)-a systematic review of the epidemiology of primary and recurrent CDI. BMC Infect. Dis. 2021, 21, 456. [Google Scholar] [CrossRef]
- Clostridioides difficile Infections-Annual Epidemiological Report for 2018–2020. 2024. Available online: https://www.ecdc.europa.eu/en/publications-data/clostridioides-difficile-infections-annual-epidemiological-report-2018-2020 (accessed on 24 March 2025).
- Angulo, F.J.; Furtado, M.; Gonzalez, E.; Zhang, P.; Kelly, P.H.; Moïsi, J.C. Incidence of public health surveillance-reported Clostridioides difficile infections in thirteen countries worldwide: A narrative review. Anaerobe 2024, 88, 102878. [Google Scholar] [CrossRef]
- Braga, D.S.; Oliveira, D.F.; Lourenço, N.V.; Carvalho, G.M.; Rezende, V.M.L.R.; Lourenço, T.V.; Silva, R.O.; Kuijper, E.J.; Vilela, E.G. Incidence of healthcare-associated Clostridioides difficile infection in a quaternary referral university hospital in Brazil. Anaerobe 2023, 79, 102672. [Google Scholar] [CrossRef]
- Ray, M.J.; Strnad, L.C.; Tucker, K.J.; Furuno, J.P.; Lofgren, E.T.; McCracken, C.M.; Park, H.; Gerber, J.S.; McGregor, J.C. Influence of Antibiotic Exposure Intensity on the Risk of Clostridioides difficile Infection. Clin. Infect. Dis. 2024, 79, 1129–1135. [Google Scholar] [CrossRef]
- López-Ureña, D.; Quesada-Gómez, C.; Montoya-Ramírez, M.; Del Mar Gamboa-Coronado, M.; Somogyi, T.; Rodríguez, C.; Rodríguez-Cavallini, E. Predominance and high antibiotic resistance of the emerging Clostridium difficile genotypes NAPCR1 and NAP9 in a Costa Rican hospital over a 2-year period without outbreaks. Emerg. Microbes Infect. 2016, 5, e42. [Google Scholar] [CrossRef]
- Wong-McClure, R.A.; Guevara-Rodríguez, M.; Abarca-Gómez, L.; Solano-Chinchilla, A.; Marchena-Picado, M.; O’Shea, M.; Badilla-Vargas, X. Clostridium difficile outbreak in Costa Rica: Control actions and associated factors. Rev. Panam. Salud Publica 2012, 32, 413–418. [Google Scholar] [CrossRef]
- Fernández-Barrantes, C.; Ramos-Esquivel, A.; Hernández-Soto, L.E.; Ramírez-Cardoce, M.; Garro-Zamora, L.D.; Cordero, J.C.; Grau, S. Trends in Antimicrobial Consumption in Tertiary Care Hospitals in Costa Rica from 2017 to 2021: A Comparative Analysis of Defined Daily Doses per 100 Bed Days and per 100 Discharges. Antibiotics 2024, 13, 939. [Google Scholar] [CrossRef] [PubMed]
- Fortin, E.; Thirion, D.J.G.; Ouakki, M.; Garenc, C.; Lalancette, C.; Bergeron, L.; Moisan, D.; Villeneuve, J.; Longtin, Y.; Bolduc, D.; et al. Role of high-risk antibiotic use in incidence of health-care-associated Clostridioides difficile infection in Quebec, Canada: A population-level ecological study. Lancet Microbe 2021, 2, e182–e190. [Google Scholar] [CrossRef] [PubMed]
- Morales-Olvera, C.G.; Lanz-Zubiría, L.; Aguilar-Zamora, E.; Camorlinga-Ponce, M.; Aparicio-Ozores, G.; Aguilar-Zapata, D.; Chávez-Tapia, N.C.; Uribe, M.; Barbero-Becerra, V.J.; Juárez-Hernández, E. Clostridioides Difficile in Latin America: An Epidemiological Overview. Curr. Microbiol. 2023, 80, 357. [Google Scholar] [CrossRef]
- Balsells, E.; Shi, T.; Leese, C.; Lyell, I.; Burrows, J.; Wiuff, C.; Campbell, H.; Kyaw, M.H.; Nair, H. Global burden of Clostridium difficile infections: A systematic review and meta-analysis. J. Glob. Health 2018, 9, 010407. [Google Scholar] [CrossRef]
- Jazmati, N.; Mischnik, A.; Kern, W.V.; Behnke, M.; Chakraborty, T.; Dinkelacker, A.; Eisenbeis, S.; Falgenhauer, J.; Gastmeier, P.; Häcker, G.; et al. Occurrence and trends of Clostridioides difficile infections in hospitalized patients: A prospective multi-centre cohort study in six German university hospitals, 2016–2020. J. Hosp. Infect. 2024, 151, 161–172. [Google Scholar] [CrossRef]
- Merchante, N.; Chico, P.; Márquez-Saavedra, E.; Riera, G.; Herrero, R.; González-de-la-Aleja, P.; Aller, A.I.; Rodríguez, J.C.; Rodríguez-Fernández, M.; Ramos, J.M.; et al. Impact of COVID19 pandemic on the incidence of health-care associated Clostridioides difficile infection. Anaerobe 2022, 75, 102579. [Google Scholar] [CrossRef]
- Wright, L.M.; Skinner, A.M.; Cheknis, A.; McBurney, C.; Ge, L.; Pacheco, S.M.; Leehey, D.; Gerding, D.N.; Johnson, S. Effect of the COVID-19 Pandemic on Rates and Epidemiology of Clostridioides difficile Infection in One VA Hospital. Antibiotics 2023, 12, 1159. [Google Scholar] [CrossRef]
- Brown, K.A.; Langford, B.; Schwartz, K.L.; Diong, C.; Garber, G.; Daneman, N. Antibiotic Prescribing Choices and Their Comparative C. Difficile Infect. Risks: A Longitudinal Case-Cohort Study. Clin. Infect. Dis. 2021, 72, 836–844. [Google Scholar] [CrossRef]
- Nandi, A.; Pecetta, S.; Bloom, D.E. Global antibiotic use during the COVID-19 pandemic: Analysis of pharmaceutical sales data from 71 countries, 2020–2022. eClinicalMedicine 2023, 57, 101848. [Google Scholar] [CrossRef]
- Fukushige, M.; Ngo, N.H.; Lukmanto, D.; Fukuda, S.; Ohneda, O. Effect of the COVID-19 pandemic on antibiotic consumption: A systematic review comparing 2019 and 2020 data. Front. Public Health 2022, 10, 946077. Available online: https://www.frontiersin.org/journals/public-health/articles/10.3389/fpubh.2022.946077/full (accessed on 27 January 2025). [CrossRef]
- Salazar, C.L.; Reyes, C.; Atehortua, S.; Sierra, P.; Correa, M.M.; Paredes-Sabja, D.; Best, E.; Fawley, W.N.; Wilcox, M.; González, Á. Molecular, microbiological and clinical characterization of Clostridium difficile isolates from tertiary care hospitals in Colombia. PLoS ONE 2017, 12, e0184689. [Google Scholar]
- Gentamicin-related Clostridium difficile colitis. React. Weekly 2024, 2022, 7. [CrossRef]
- Lopardo, G.; Morfin-Otero, R.; Moran-Vazquez, I.I.; Noriega, F.; Zambrano, B.; Luxemburger, C.; Foglia, G.; Rivas, E.E. Epidemiology of Clostridium difficile: A hospital-based descriptive study in Argentina and Mexico. Braz. J. Infect. Dis. 2015, 19, 8–14. [Google Scholar] [CrossRef]
- Tleyjeh, I.M.; Abdulhak, A.A.B.; Riaz, M.; Alasmari, F.A.; Garbati, M.A.; AlGhamdi, M.; Khan, A.R.; Al Tannir, M.; Erwin, P.J.; Ibrahim, T.; et al. Association between Proton Pump Inhibitor Therapy and Clostridium difficile Infection: A Contemporary Systematic Review and Meta-Analysis. PLoS ONE 2012, 7, e508. [Google Scholar]
- Pierce, J.; Stevens, M.P. COVID-19 and antimicrobial stewardship: Lessons learned, best practices, and future implications. Int. J. Infect. Dis. 2021, 113, 103–108. [Google Scholar] [CrossRef]
- Wenzler, E.; Mulugeta, S.G.; Danziger, L.H. The Antimicrobial Stewardship Approach to Combating Clostridium Difficile. Antibiotics 2015, 4, 198–215. [Google Scholar] [CrossRef]
- Johnson, S.; Lavergne, V.; Skinner, A.M.; Gonzales-Luna, A.J.; Garey, K.W.; Kelly, C.P.; Wilcox, M.H. Clinical Practice Guideline by the Infectious Diseases Society of America (IDSA) and Society for Healthcare Epidemiology of America (SHEA): 2021 Focused Update Guidelines on Management of Clostridioides difficile Infection in Adults. Clin. Infect. Dis. 2021, 73, e1029–e1044. [Google Scholar] [CrossRef]
- GLASS Methodology for Surveillance of National Antimicrobial Consumption. Available online: https://www.who.int/publications/i/item/9789240012639 (accessed on 23 March 2025).
- Yun, J.H.; Park, G.E.; Ki, H.K. Correlation between antibiotic consumption and the incidence of healthcare facility-onset Clostridioides difficile infection: A retrospective chart review and analysis. Antimicrob. Resist. Infect. Control 2021, 10, 117. [Google Scholar] [CrossRef]
- Wagner, A.K.; Soumerai, S.B.; Zhang, F.; Ross-Degnan, D. Segmented regression analysis of interrupted time series studies in medication use research. J. Clin. Pharm. Ther. 2002, 27, 299–309. [Google Scholar] [CrossRef]
| Total | 2017 | 2018 | 2019 | 2020 | 2021 | % AAPC 2017–2021 | AAPC 95% CI | Trend (β1) | p Value |
|---|---|---|---|---|---|---|---|---|---|
| ACCESS | 621.18 | 553.66 | 539.78 | 748.08 | 519.41 | −4.4 | −47.6 to 45.0 | −0.91 | 0.97 |
| WATCH | 746.69 | 723.13 | 752.68 | 1079.66 | 623.95 | −4.4 | −55.3 to 56.4 | 11.1 | 0.81 |
| RESERVE | 58.42 | 35.33 | 54.68 | 92.34 | 55.34 | −1.3 | −82.8 to 104.8 | 5.08 | 0.34 |
| Total | 2017 | 2018 | 2019 | 2020 | 2021 | % AAPC 2017–2021 | AAPC 95% CI | Trend (β1) | p Value |
|---|---|---|---|---|---|---|---|---|---|
| Antibiotics | 30.36 | 27.92 | 28.67 | 40.86 | 25.51 | −3.42 | −32.78 to 25.94 | 0.32 | 0.84 |
| Aminoglycosides | 69.62 | 56.59 | 63.76 | 88.93 | 71.01 | 3.00 | −18.50 to 24.50 | 3.51 | 0.24 |
| Amikacin | 53.68 | 41.50 | 52.41 | 77.95 | 61.60 | 0.08 | −0.49 to 0.64 | 5.22 | 0.08 |
| Gentamicin | 15.94 | 15.10 | 11.35 | 10.99 | 9.41 | −0.12 | −0.28 to 0.04 | −1.71 | <0.0001 |
| Cephalosporins | 430.66 | 405.92 | 369.09 | 485.73 | 296.08 | −5.80 | −27.80 to 16.20 | −18.93 | 0.29 |
| Cephalexin | 89.60 | 89.34 | 63.83 | 51.83 | 28.39 | −0.23 | −0.53 to 0.07 | −15.99 | <0.0001 |
| Cephalothin | 37.00 | 32.40 | 28.81 | 43.88 | 22.22 | −0.05 | −0.72 to 0.62 | −1.81 | 0.40 |
| Cefotaxime | 223.02 | 217.85 | 210.53 | 275.23 | 167.82 | −0.03 | −0.49 to 0.42 | −5.30 | 0.61 |
| Ceftaroline | 0.00 | 0.44 | 2.77 | 2.94 | 1.45 | 1.21 | −3.14 to 5.56 | 0.53 | 0.06 |
| Ceftazidime | 80.99 | 64.99 | 62.13 | 108.61 | 70.30 | 0.04 | −0.74 to 0.82 | 2.22 | 0.67 |
| Ceftazidime + avibactam | 0.00 | 0.00 | 0.17 | 1.77 | 5.89 | 2.93 | −4.15 to 10.02 | 1.35 | 0.0004 |
| Ceftolozane + tazobactam | 0.00 | 0.87 | 0.83 | 1.47 | 0.00 | −0.07 | −1.22 to 1.09 | 0.059 | 0.73 |
| Ceftriaxone | 0.04 | 0.02 | 0.03 | 0.00 | 0.00 | −0.25 | −1.28 to 0.78 | −0.010 | <0.0001 |
| Carbapenems and Monobactams | 146.13 | 147.72 | 172.54 | 260.09 | 156.77 | 6.60 | −21.7 to 35.0 | 13.36 | 0.27 |
| Aztreonam | 2.85 | 1.35 | 0.04 | 1.47 | 7.37 | 9.57 | −18.44 to 37.57 | 0.91 | 0.18 |
| Ertapenem | 12.61 | 25.45 | 34.17 | 66.42 | 46.77 | 0.50 | −0.47 to 1.48 | 10.92 | 0.0006 |
| Imipenem + cilastatin | 0.42 | 0.13 | 0.91 | 1.84 | 0.08 | 1.34 | −3.79 to 6.48 | 0.10 | 0.61 |
| Meropenem | 130.24 | 120.78 | 137.42 | 190.36 | 102.55 | 0.00 | −0.57 to 0.57 | 1.41 | 0.87 |
| Fluoroquinolones | 68.01 | 56.02 | 59.38 | 113.04 | 84.09 | 13.20 | −27.10 to 53.50 | 8.91 | 0.08 |
| Ciprofloxacin | 26.95 | 30.56 | 22.07 | 33.00 | 25.45 | 0.03 | −0.54 to 0.60 | −0.056 | 0.96 |
| Levofloxacin | 41.06 | 25.46 | 37.31 | 80.04 | 58.65 | 0.24 | −0.89 to 1.37 | 8.97 | 0.04 |
| Macrolides | 50.42 | 61.99 | 44.17 | 46.65 | 25.39 | −14.30 | −40.00 to 11.40 | −6.54 | 0.005 |
| Azithromycin | 0.02 | 0.01 | 4.17 | 6.84 | 1.97 | 103.86 | −227.27 to 434.98 | 1.07 | 0.11 |
| Clarithromycin | 19.96 | 38.31 | 16.97 | 19.25 | 8.86 | −0.01 | −1.12 to 1.10 | −4.12 | 0.09 |
| Penicillins | 264.03 | 218.55 | 233.13 | 339.47 | 221.26 | 0.00 | −26.40 to 26.40 | 3.53 | 0.80 |
| Amoxicillin | 9.59 | 11.45 | 9.99 | 16.27 | 13.84 | 0.14 | −0.44 to 0.72 | 1.22 | 0.01 |
| Ampicillin + sulbactam | 0.02 | 0.60 | 0.14 | 10.52 | 1.01 | 25.37 | −31.01 to 81.74 | 1.19 | 0.30 |
| Ampicillin | 25.98 | 23.05 | 29.78 | 46.44 | 29.17 | 0.09 | −0.57 to 0.75 | 2.97 | 0.17 |
| Oxacillin | 145.52 | 114.92 | 117.10 | 178.03 | 149.14 | 0.04 | −0.49 to 0.57 | 7.03 | 0.29 |
| Penicillin benzathine | 0.08 | 0.11 | 0.03 | 0.16 | 0.08 | 0.87 | −2.88 to 4.62 | 0.0041 | 0.75 |
| Penicillin sodium | 54.12 | 42.16 | 34.97 | 38.90 | 27.93 | −0.14 | −0.42 to 0.14 | −5.56 | <0.0001 |
| Piperacillin + tazobactam | 28.72 | 26.26 | 41.12 | 49.16 | 0.08 | −0.08 | −1.14 to 0.98 | −3.43 | 0.49 |
| Sulfamethoxazole + trimethoprim | 74.42 | 77.82 | 100.60 | 176.83 | 107.19 | 15.90 | −20.30 to 52.10 | 16.45 | 0.06 |
| Tetracyclines | 15.14 | 13.83 | 12.72 | 16.86 | 13.78 | −0.80 | −18.00 to 16.40 | 0.031 | 0.94 |
| Doxycycline | 14.97 | 13.24 | 12.61 | 15.02 | 12.06 | −0.04 | −0.31 to 0.22 | −0.40 | 0.23 |
| Tigecycline | 0.17 | 0.59 | 0.11 | 1.84 | 1.72 | 4.33 | −7.97 to 16.63 | 0.43 | 0.001 |
| Clindamycin | 30.44 | 23.67 | 23.03 | 20.56 | 14.55 | −0.16 | −0.35 to 0.03 | −3.48 | <0.0001 |
| Linezolid | 46.90 | 28.18 | 47.76 | 76.56 | 34.61 | 1.80 | −41.70 to 45.30 | 2.47 | 0.62 |
| Nitrofurantoin | 6.72 | 7.98 | 7.55 | 8.41 | 6.80 | 0.01 | −0.26 to 0.28 | 0.058 | 0.77 |
| Polymyxin | 8.49 | 3.72 | 2.69 | 5.48 | 3.48 | −0.04 | −1.20 to 1.12 | −0.82 | 0.12 |
| Rifampicin | 6.63 | 6.63 | 4.14 | 7.44 | 1.76 | −0.09 | −1.14 to 0.97 | −0.89 | 0.09 |
| Vancomycin | 176.02 | 166.40 | 181.72 | 241.48 | 139.66 | −1.60 | −25.40 to 22.20 | 0.23 | 0.98 |
| Antifungals | 26.30 | 22.68 | 27.60 | 43.21 | 32.49 | 4.31 | −28.22 to 36.84 | 3.29 | 0.05 |
| Anidulafungin | 41.22 | 28.81 | 38.47 | 69.40 | 28.02 | 0.06 | −0.94 to 1.06 | 1.41 | 0.76 |
| Caspofungin | 0.03 | 1.47 | 2.89 | 10.52 | 3.31 | 12.73 | −24.75 to 50.21 | 1.56 | 0.08 |
| Fluconazole | 103.82 | 101.22 | 101.73 | 147.86 | 147.18 | 0.11 | −0.26 to 0.48 | 13.33 | 0.0003 |
| Itraconazole | 6.23 | 2.54 | 8.00 | 5.14 | 3.49 | 0.22 | −1.84 to 2.28 | −0.28 | 0.63 |
| Ketoconazole | 0.02 | 0.21 | 0.19 | 0.79 | 0.42 | 3.02 | −4.32 to 10.37 | 0.13 | 0.01 |
| Metronidazole | 63.09 | 60.33 | 47.58 | 52.32 | 36.00 | −0.12 | −0.41 to 0.17 | −6.21 | <0.0001 |
| Voriconazole | 6.45 | 1.82 | 14.29 | 25.55 | 12.55 | 1.60 | −4.06 to 7.27 | 3.59 | 0.06 |
| Antivirals | 4.69 | 3.70 | 3.87 | 8.98 | 3.77 | −4.27 | −74.42 to 65.88 | −0.34 | 0.57 |
| Acyclovir | 4.08 | 5.47 | 7.05 | 19.68 | 8.61 | 0.46 | −1.09 to 2.02 | 2.32 | 0.10 |
| Gancyclovir | 11.64 | 6.74 | 7.08 | 15.58 | 2.58 | 0.00 | −1.40 to 1.40 | −0.92 | 0.49 |
| Valgancyclovir | 7.73 | 6.28 | 5.22 | 9.62 | 7.68 | 0.07 | −0.75 to 0.89 | 0.32 | 0.47 |
| Proton pump inhibitors | 356.21 | 355.88 | 498.71 | 667.63 | 315.82 | 0.05 | −0.62 to 0.73 | 23.09 | 0.56 |
| Class of Antibiotics | DDD Per 100 Bed Days Spearman p Without Time Interval Matching | p Value | DDD Per 100 Bed Days Spearman p with a 1-Month Interval Matching | p Value |
|---|---|---|---|---|
| AWaRe | ||||
| Access | 0.07 | 0.57 | 0.041 | 0.75 |
| Reserve | −0.062 | 0.63 | −0.109 | 0.41 |
| Watch | 0.089 | 0.49 | −0.026 | 0.84 |
| Antivirals | ||||
| Antivirals | −0.113 | 0.38 | −0.186 | 0.15 |
| Acyclovir | −0.305 | 0.01 | −0.217 | 0.09 |
| Gancyclovir | 0.08 | 0.54 | −0.0151 | 0.90 |
| Valgancyclovir | −0.89 | 0.49 | −0.210 | 0.10 |
| Antifungals | ||||
| Antifungals | −0.202 | 0.12 | −0.26 | 0.04 |
| Anidulafungin | −0.070 | 0.59 | −0.20 | 0.11 |
| Caspofungin | −0.073 | 0.57 | −0.07 | 0.57 |
| Fluconazole | −0.201 | 0.12 | −0.27 | 0.03 |
| Itraconazole | 0.047 | 0.72 | −0.12 | 0.34 |
| Ketoconazole | 0.058 | 0.65 | −0.076 | 0.56 |
| Voriconazole | −0.38 | 0.0024 | −0.216 | 0.10 |
| Antibiotics | ||||
| Antibiotics | 0.07 | 0.56 | 0.015 | 0.90 |
| Aminoglycosides | 0.021 | 0.86 | −0.15 | 0.25 |
| Amikacin | −0.070 | 0.59 | −0.22 | 0.08 |
| Gentamicin | 0.203 | 0.12 | 0.28 | 0.02 |
| Carbapenems | −0.096 | 0.46 | −0.053 | 0.68 |
| Aztreonam | −0.22 | 0.08 | −0.116 | 0.37 |
| Ertapenem | −0.077 | 0.55 | −0.074 | 0.57 |
| Imipenem Cilastatin | 0.179 | 0.17 | 0.188 | 0.15 |
| Meropenem | 0.00214 | 0.98 | −0.020 | 0.87 |
| Cephalosporins | 0.27 | 0.035 | 0.14 | 0.28 |
| Cephalexin | 0.274 | 0.03 | 0.383 | 0.002 |
| Cephalotin | 0.28 | 0.028 | 0.334 | 0.0097 |
| Cefotaxime | 0.17 | 0.17 | −0.0315 | 0.81 |
| Ceftazidime/Avibactam | −0.318 | 0.013 | −0.38 | 0.002 |
| Ceftaroline | −0.122 | 0.35 | −0.17 | 0.17 |
| Ceftazidime | 0.087 | 0.50 | −0.056 | 0.67 |
| Ceftolozano/Tazobactam | 0.169 | 0.19 | −0.092 | 0.48 |
| Ceftriaxone | 0.024 | 0.85 | 0.070 | 0.59 |
| Macrolides | 0.338 | 0.0082 | 0.39 | 0.0023 |
| Azitromicina | −0.064 | 0.62 | −0.037 | 0.78 |
| Clarithromycin | 0.350 | 0.0061 | 0.35 | 0.006 |
| Penicilinas | 0.063 | 0.63 | 0.027 | 0.83 |
| Amoxicillin | 0.03 | 0.80 | −0.10 | 0.44 |
| Ampicillin Sulbactam | −0.15 | 0.25 | 0.09 | 0.49 |
| Ampicillin | −0.050 | 0.70 | −0.24 | 0.06 |
| Oxacillin | 0.028 | 0.82 | −0.116 | 0.38 |
| Penicillin sodium | 0.176 | 0.17 | 0.23 | 0.07 |
| Penicillin benzathine | −0.154 | 0.23 | 0.02 | 0.86 |
| Piperacillin/Tazobactam | 0.196 | 0.13 | 0.116 | 0.37 |
| Fluoroquinolones | −0.055 | 0.67 | −0.35 | 0.0051 |
| Ciprofloxacin | 0.208 | 0.10 | 0.244 | 0.06 |
| Levofloxacin | −0.200 | 0.12 | −0.47 | 0.0001 |
| Tetracyclines | 0.048 | 0.71 | 0.015 | 0.90 |
| Doxycycline | 0.058 | 0.65 | 0.057 | 0.66 |
| Tigecycline | −0.179 | 0.17 | −0.19 | 0.12 |
| Other antibiotics | ||||
| Clindamycin | 0.354 | 0.0055 | 0.128 | 0.33 |
| Linezolid | −0.123 | 0.35 | −0.117 | 0.37 |
| Metronidazole | 0.460 | 0.0002 | 0.30 | 0.01 |
| Nitrofurantoin | 0.024 | 0.85 | −0.033 | 0.80 |
| Polymyxin | −0.0120 | 0.92 | 0.0007 | 0.99 |
| Rifampicin | 0.072 | 0.58 | 0.25 | 0.05 |
| Sulfamethoxazole and Trimethoprim | −0.207 | 0.11 | −0.25 | 0.05 |
| Vancomycin | 0.0704 | 0.59 | 0.050 | 0.70 |
| Proton Pump Inhibitors | −0.139 | 0.28 | −0.14 | 0.26 |
Disclaimer/Publisher’s Note: The statements, opinions and data contained in all publications are solely those of the individual author(s) and contributor(s) and not of MDPI and/or the editor(s). MDPI and/or the editor(s) disclaim responsibility for any injury to people or property resulting from any ideas, methods, instructions or products referred to in the content. |
© 2025 by the authors. Licensee MDPI, Basel, Switzerland. This article is an open access article distributed under the terms and conditions of the Creative Commons Attribution (CC BY) license (https://creativecommons.org/licenses/by/4.0/).
Share and Cite
Fernández-Barrantes, C.; Ramos-Esquivel, A.; Hernández-Soto, L.E.; Ramírez-Cardoce, M.; Garro-Zamora, L.D.; Cordero, J.C.; Grau, S. Association Between Antimicrobials and Pump Proton Inhibitors Consumption with the Incidence of Nosocomial Clostridiodes difficile Infection in High Complexity Hospitals in Costa Rica. Antibiotics 2025, 14, 350. https://doi.org/10.3390/antibiotics14040350
Fernández-Barrantes C, Ramos-Esquivel A, Hernández-Soto LE, Ramírez-Cardoce M, Garro-Zamora LD, Cordero JC, Grau S. Association Between Antimicrobials and Pump Proton Inhibitors Consumption with the Incidence of Nosocomial Clostridiodes difficile Infection in High Complexity Hospitals in Costa Rica. Antibiotics. 2025; 14(4):350. https://doi.org/10.3390/antibiotics14040350
Chicago/Turabian StyleFernández-Barrantes, Cristina, Allan Ramos-Esquivel, Luis Esteban Hernández-Soto, Manuel Ramírez-Cardoce, Luis David Garro-Zamora, José Castro Cordero, and Santiago Grau. 2025. "Association Between Antimicrobials and Pump Proton Inhibitors Consumption with the Incidence of Nosocomial Clostridiodes difficile Infection in High Complexity Hospitals in Costa Rica" Antibiotics 14, no. 4: 350. https://doi.org/10.3390/antibiotics14040350
APA StyleFernández-Barrantes, C., Ramos-Esquivel, A., Hernández-Soto, L. E., Ramírez-Cardoce, M., Garro-Zamora, L. D., Cordero, J. C., & Grau, S. (2025). Association Between Antimicrobials and Pump Proton Inhibitors Consumption with the Incidence of Nosocomial Clostridiodes difficile Infection in High Complexity Hospitals in Costa Rica. Antibiotics, 14(4), 350. https://doi.org/10.3390/antibiotics14040350