Article

Effects of Broad-Spectrum Antibiotic (Florfenicol) on Resistance Genes and Bacterial Community Structure of Water and Sediments in an Aquatic Microcosm Model

1
Department of Veterinary Medicine, College of Coastal Agricultural Sciences, Guangdong Ocean University, Zhanjiang 524088, China
2
Department of Animal Science, College of Coastal Agricultural Sciences, Guangdong Ocean University, Zhanjiang 524088, China
3
Maoming Branch, Guangdong Laboratory for Lingnan Modern Agriculture, Maoming 525000, China
*
Authors to whom correspondence should be addressed.
These authors contributed equally to this work.
Antibiotics 2022, 11(10), 1299; https://doi.org/10.3390/antibiotics11101299
Submission received: 31 August 2022 / Revised: 19 September 2022 / Accepted: 21 September 2022 / Published: 23 September 2022

Abstract

:
This study evaluates the effects of a broad-spectrum antibiotic (florfenicol) on antibiotic resistance genes (ARGs) and bacterial community structure in aquatic environments. We constructed an indoor aquatic microcosm model, adding different concentrations of florfenicol (0.1, 1, 10, 100 mg L−1), and water and sediment samples were collected after 0, 7, 30, and 60 days. qPCR and 16S rDNA amplicon sequencing were used to study the changes in the ARGs and bacterial community structure of the collected samples. The results show that the inclusion of florfenicol resulted in an increased abundance of the floR and optrA genes. Adding 100 mg L−1 florfenicol to the water increased the abundance of optrA gene copies with the maximum on the Day 7, and increased the abundance of floR gene copies with the maximum on Day 30. Adding 100 mg L−1 florfenicol to the sediment increased the abundance of floR and optrA genes by one order of magnitude on Day 60. Meanwhile, the average number of operational taxonomic units (OTUs) in the water samples was 257, and the average number of OTUs in sediment samples was 823. The bacterial community diversity and richness in sediments were higher than those in water. The difference between the maximal and minimal values of the Shannon diversity index in the water and sediment samples was 4.36 and 1.95, respectively. The effect of florfenicol on the bacterial community structure in water was much higher than that in sediment. At 30 days, the diversity index and richness index of the florfenicol treatment groups with 1 and 10 mg L−1 concentrations began to increase; at 60 days, the diversity and richness indices of the 100 mg L−1 florfenicol treatment group began to increase. The samples at the same sampling time in the sediments clustered closer together. The results of this study provide a scientific basis for guiding the rational use of florfenicol in aquaculture, maintaining a healthy and stable microecological environment in aquaculture, and provide theoretical data for environmental ecological risk assessment and safety management caused by microbial resistance under the abuse of florfenicol.

1. Introduction

Antibiotics have played a vital role in human medical care and animal production in the past few decades. China is a large country in animal husbandry, and most of the produced antibiotics are used on animals [1,2,3]. According to the FAO report in 2020, the scale of global aquaculture is increasing, and China’s aquaculture industry is also at a stage of rapid development [4,5]. The use of antibiotics in intensive farming is currently universal. Florfenicol is one of the antibiotics approved by FAO for use in aquaculture and one of the most widely used antibiotics in the aquacultural industry [6]. Florfenicol binds to Site A on the 50S large subunit of the bacterial ribosome, thereby affecting the transpeptidase reaction of peptidyl transferase, inhibiting the production of bacterial proteins [7]. However, florfenicol has stable physical and chemical properties, it is not easy to degrade, and a large amount of unabsorbed florfenicol is continuously discharged, which leads to its persistent existence in the environment [8]. Different concentrations of florfenicol residues have been detected in coastal waters, sediments, and organisms [9]. After 6 months of antibiotic treatment in all salmon farms in Puyu Huapi Fjord, Chile, the detected concentration of florfenicol was as high as 23.1 ng·L−1 in aquacultural water [10]. The detected concentration of florfenicol in the Yangtze River basin was 89.5 ng·L−1, and the highest detected concentrations in the Three Gorges Reservoir and Songhua River basin were 46.6 and 3.3 ng·L−1, respectively [11,12]. Furthermore, the residual concentration of florfenicol was as high as 11 mg·L−1 in the waters around the Dalian Bay aquacultural farms in China [13]. Chen and Zhou [14] found that the highest concentrations of florfenicol in the water and sediment of the Huangpu River were 241.1 and 1.3 μg·kg−1, respectively. The drug residues caused by the irregular use of antibiotics can induce the emergence of antibiotic resistance genes (ARGs) [15]. ARGs are released into the environment after the death of microorganisms and are protected from deoxyribonuclease (DNAse) by tightly binding onto soil particles, and their persistent residual properties render them far more harmful than antibiotics themselves [16]. The floR gene is the earliest discovered and currently the most widespread florfenicol resistance gene, and the optrA gene can mediate oxazolidinones and amide alcohol drugs; once these genes spread into the human body through the food chain, they pose a huge threat to human public health [17].
Microorganisms are an important part of the ecosystem, and participate in the material cycle and energy flow in nature [18]. Florfenicol is a broad-spectrum antibiotic that can inhibit a variety of bacteria; therefore, the remaining antibiotics in the environment inevitably impact microorganisms [19]. When the antibiotic concentration in a water environment exceeds the limit, the activity of microorganisms is inhibited, and the community structure of microbiota changes accordingly, thus destroying the stability and resilience of the ecosystem [20]. Florfenicol is globally the most widely used antibiotic for aquaculture, and the amount of florfenicol used in China is as high as 10,000 tons per year [21]. Relevant studies show that florfenicol treatment has shifted the structure of the microbiota and reduced its biodiversity by acting as a strong stressor. Florfenicol treatment promotes the proliferation of florfenicol-resistant genes and induces mutation-driven resistance [22]. However, there are fewer reports on the effects of florfenicol on ARGs, and the microbial community structure of water and sediments in an aquatic microcosm model.
In this study, an indoor aquatic microcosm model was constructed to simulate an aquatic ecosystem, and florfenicol antibiotics were added exogenously to explore changes in the abundance of ARGs after different concentrations of florfenicol had entered the water environment, and their impact on the bacterial community structure, diversity, and abundance. The present study can provide a theoretical basis for the scientific use of florfenicol in aquaculture to maintain a healthy ecological environment.

2. Results

2.1. Abundance of Florfenicol ARGs

As shown in Figure 1, the abundance of the floR gene in the water body ranged from 3.24 × 10⁵ to 1.33 × 10⁹ copies·μL−1. On Day 7, after the addition of florfenicol, the abundance of the floR gene was one order of magnitude higher than that of the control group, and 0.1 mg·L−1 of florfenicol could significantly increase the abundance of the floR gene. The abundance of the floR gene decreased with time. The abundance of the floR gene in sediments ranged from 1.63 × 10⁵ to 9.86 × 10⁶ copies·μL−1. The abundance of the floR gene was one order of magnitude higher on Day 60 after the addition of 10 and 100 mg·L−1 florfenicol. The abundance of the optrA gene in water ranged from 3.34 × 10⁴ to 1.62 × 10⁷ copies·μL−1. On Day 7, after 10 and 100 mg·L−1 florfenicol supplementation, the abundance of the optrA gene increased by 1–2 orders of magnitude. With the change in time, the abundance of the optrA gene showed a downward trend, and the abundance of the optrA gene in the samples added with florfenicol at 60 days was basically the same as that in the control group. The abundance of the optrA gene in the sediments ranged from 4.24 × 10⁴ to 3.81 × 10⁵ copies·μL−1, and the abundance of the optrA gene increased by one order of magnitude on Days 30 and 60 after the addition of 100 mg·L−1 fluorobenzene. According to the statistical analysis results, concentrations of florfenicol and time significantly affected the abundance of ARGs in an aquatic microcosm model (p < 0.001).

2.2. Analysis of OTUs

After the quality optimization of the original data, the number of valid sequences obtained in water samples was 31,046,103,252, and the number of valid sequences in the sediment samples was 31,570–74,821. After OTU cluster analysis, a total of 580 OTUs were obtained from the water samples, with an average of 257 OTUs per sample, of which the W4D7 group had the fewest OTUs, 91; a total of 1235 OTUs were obtained from the sediments, and the average number of OTUs per sample was 823, of which the S4D60 group had the fewest OTUs, 590. According to the out cluster analysis results, a Venn diagram was drawn, and there were 7 OTUs in water samples and 224 OTUs in sediment samples. As shown in Figure 2, the number of common OTUs was the smallest when the concentration of florfenicol in the water samples was 100 mg·L−1 (Figure 2a), and the number of common OTUs in the sediment samples was the smallest when the concentration of florfenicol was added at 1 mg·L−1 (Figure 2b). The 30-day water samples shared the fewest OTUs (Figure 2c), and the 60-day sediment samples shared the fewest OTUs (Figure 2d).
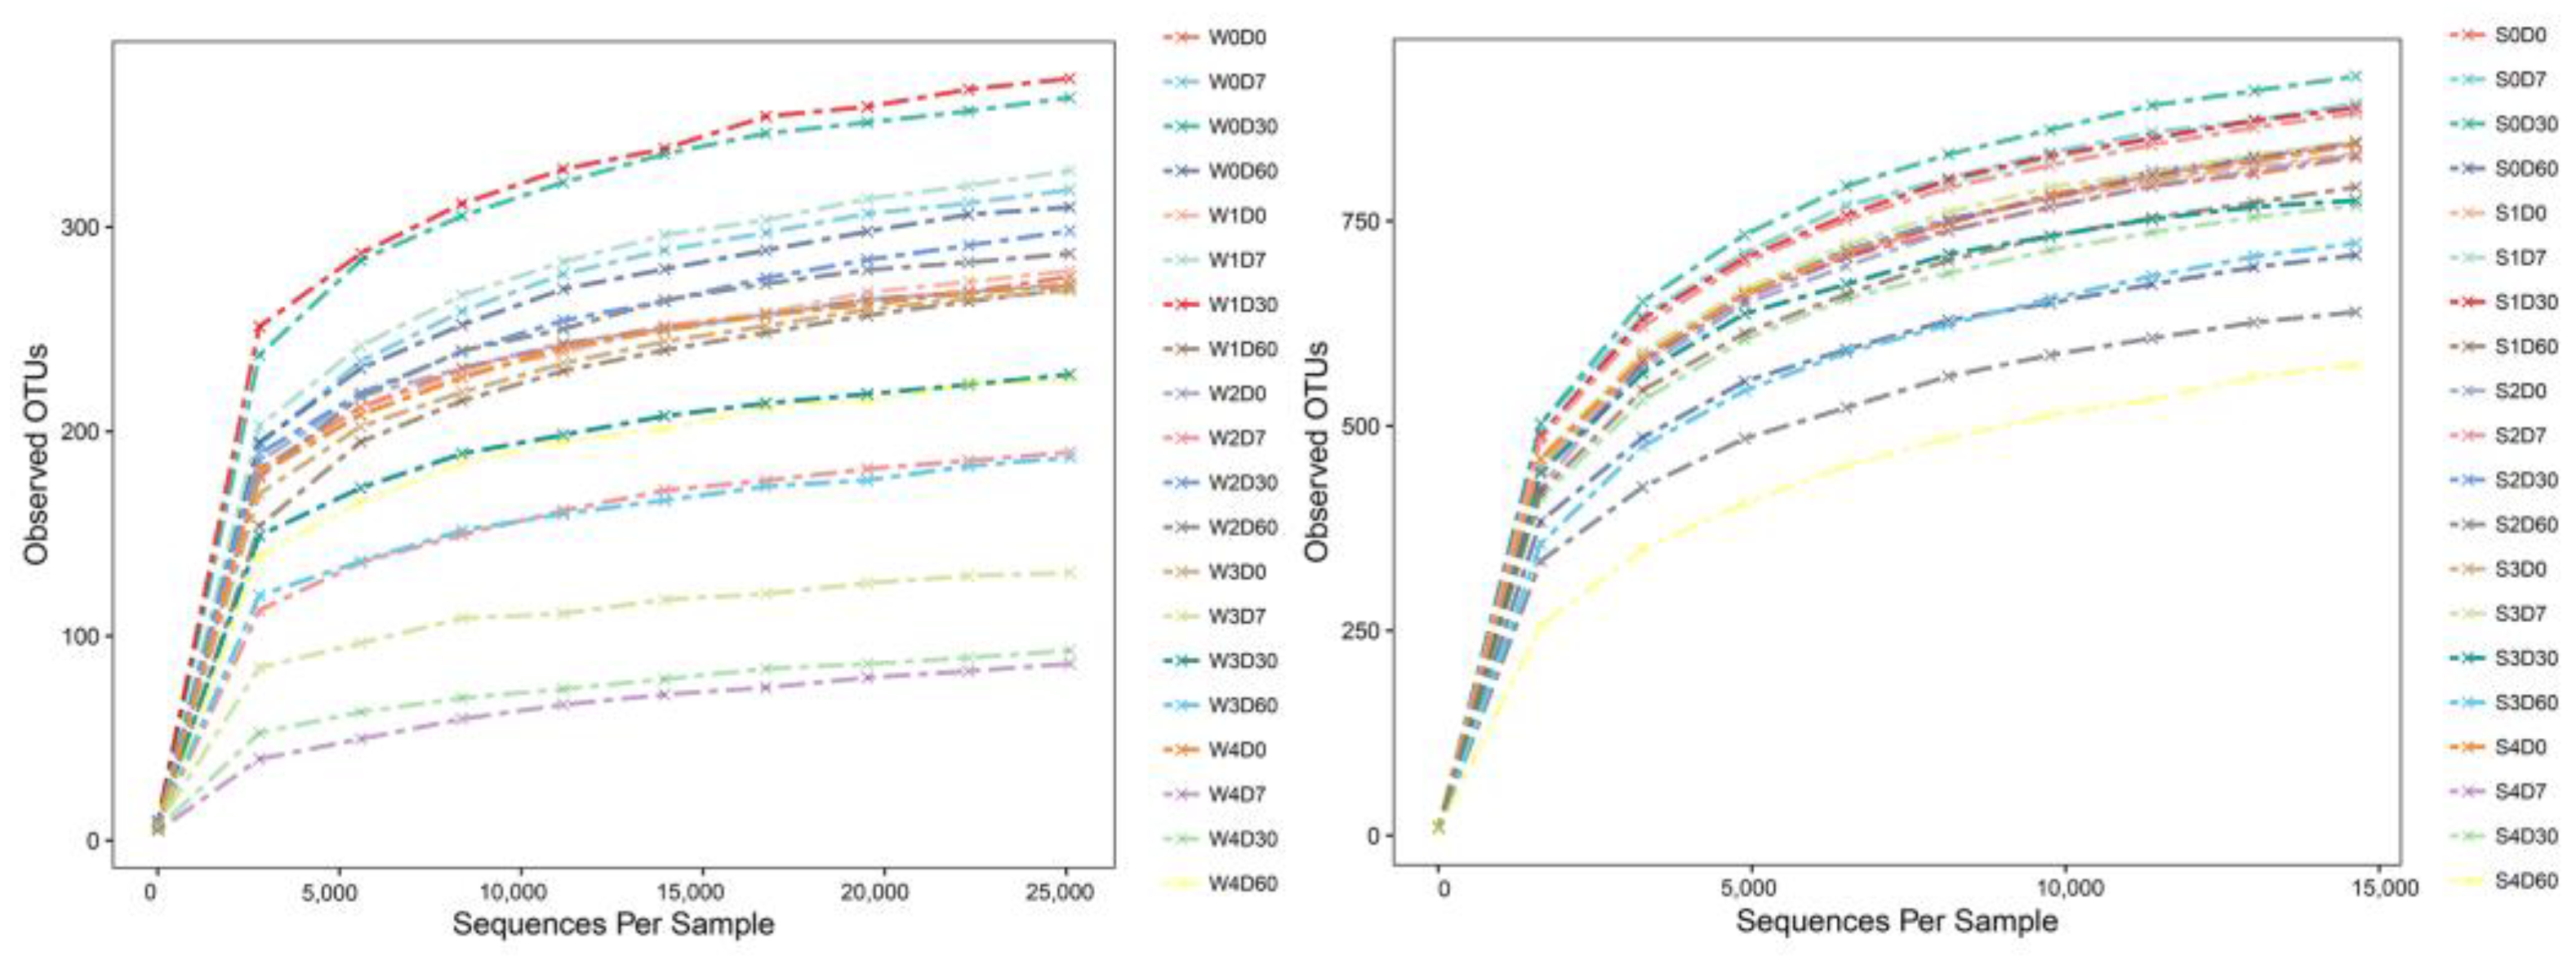
Sequences were randomly sampled, and a dilution curve was constructed with the number of valid sequences drawn from the sample (sequences per sample) as the abscissa and the number of (observed) OTUs as the ordinate. As presented in Figure 3, as the number of extracted sequences increased, the number of detected OTUs increased and gradually became flat, indicating that the sequencing tended to be saturated, the sampling was basically reasonable, and that the sequencing results contained the most microbial groups. This can more realistically reflect the microbial community structure in the sample through the addition of 100 mg·L−1 fluorobenzene.

2.3. Alpha Diversity Index Analysis

The community richness index mainly includes the Chao1 and ACE indices, and the bacterial community diversity index mainly includes the Shannon and Simpson indices. As shown in Table 1, with the increase in drug concentration, the species richness and diversity of the water samples showed a downward trend; with the change in time, the community richness and diversity were first suppressed and then gradually recovered. The diversity index of the W2 and W3 groups increased on Day 30, while the diversity index of the W4 group began to increase on Day 60, and the minimal value of the diversity index appeared in the W4 group. As shown in Table 2, among the sediment samples, only the S4 and D60 groups exhibited the inhibitory effect of florfenicol on the bacterial species richness and diversity, and the smallest value of the diversity index appeared in the 60-day sediment samples when the concentration of florfenicol was added at 100 mg·L−1.

2.4. Bacterial Community Structure Analysis

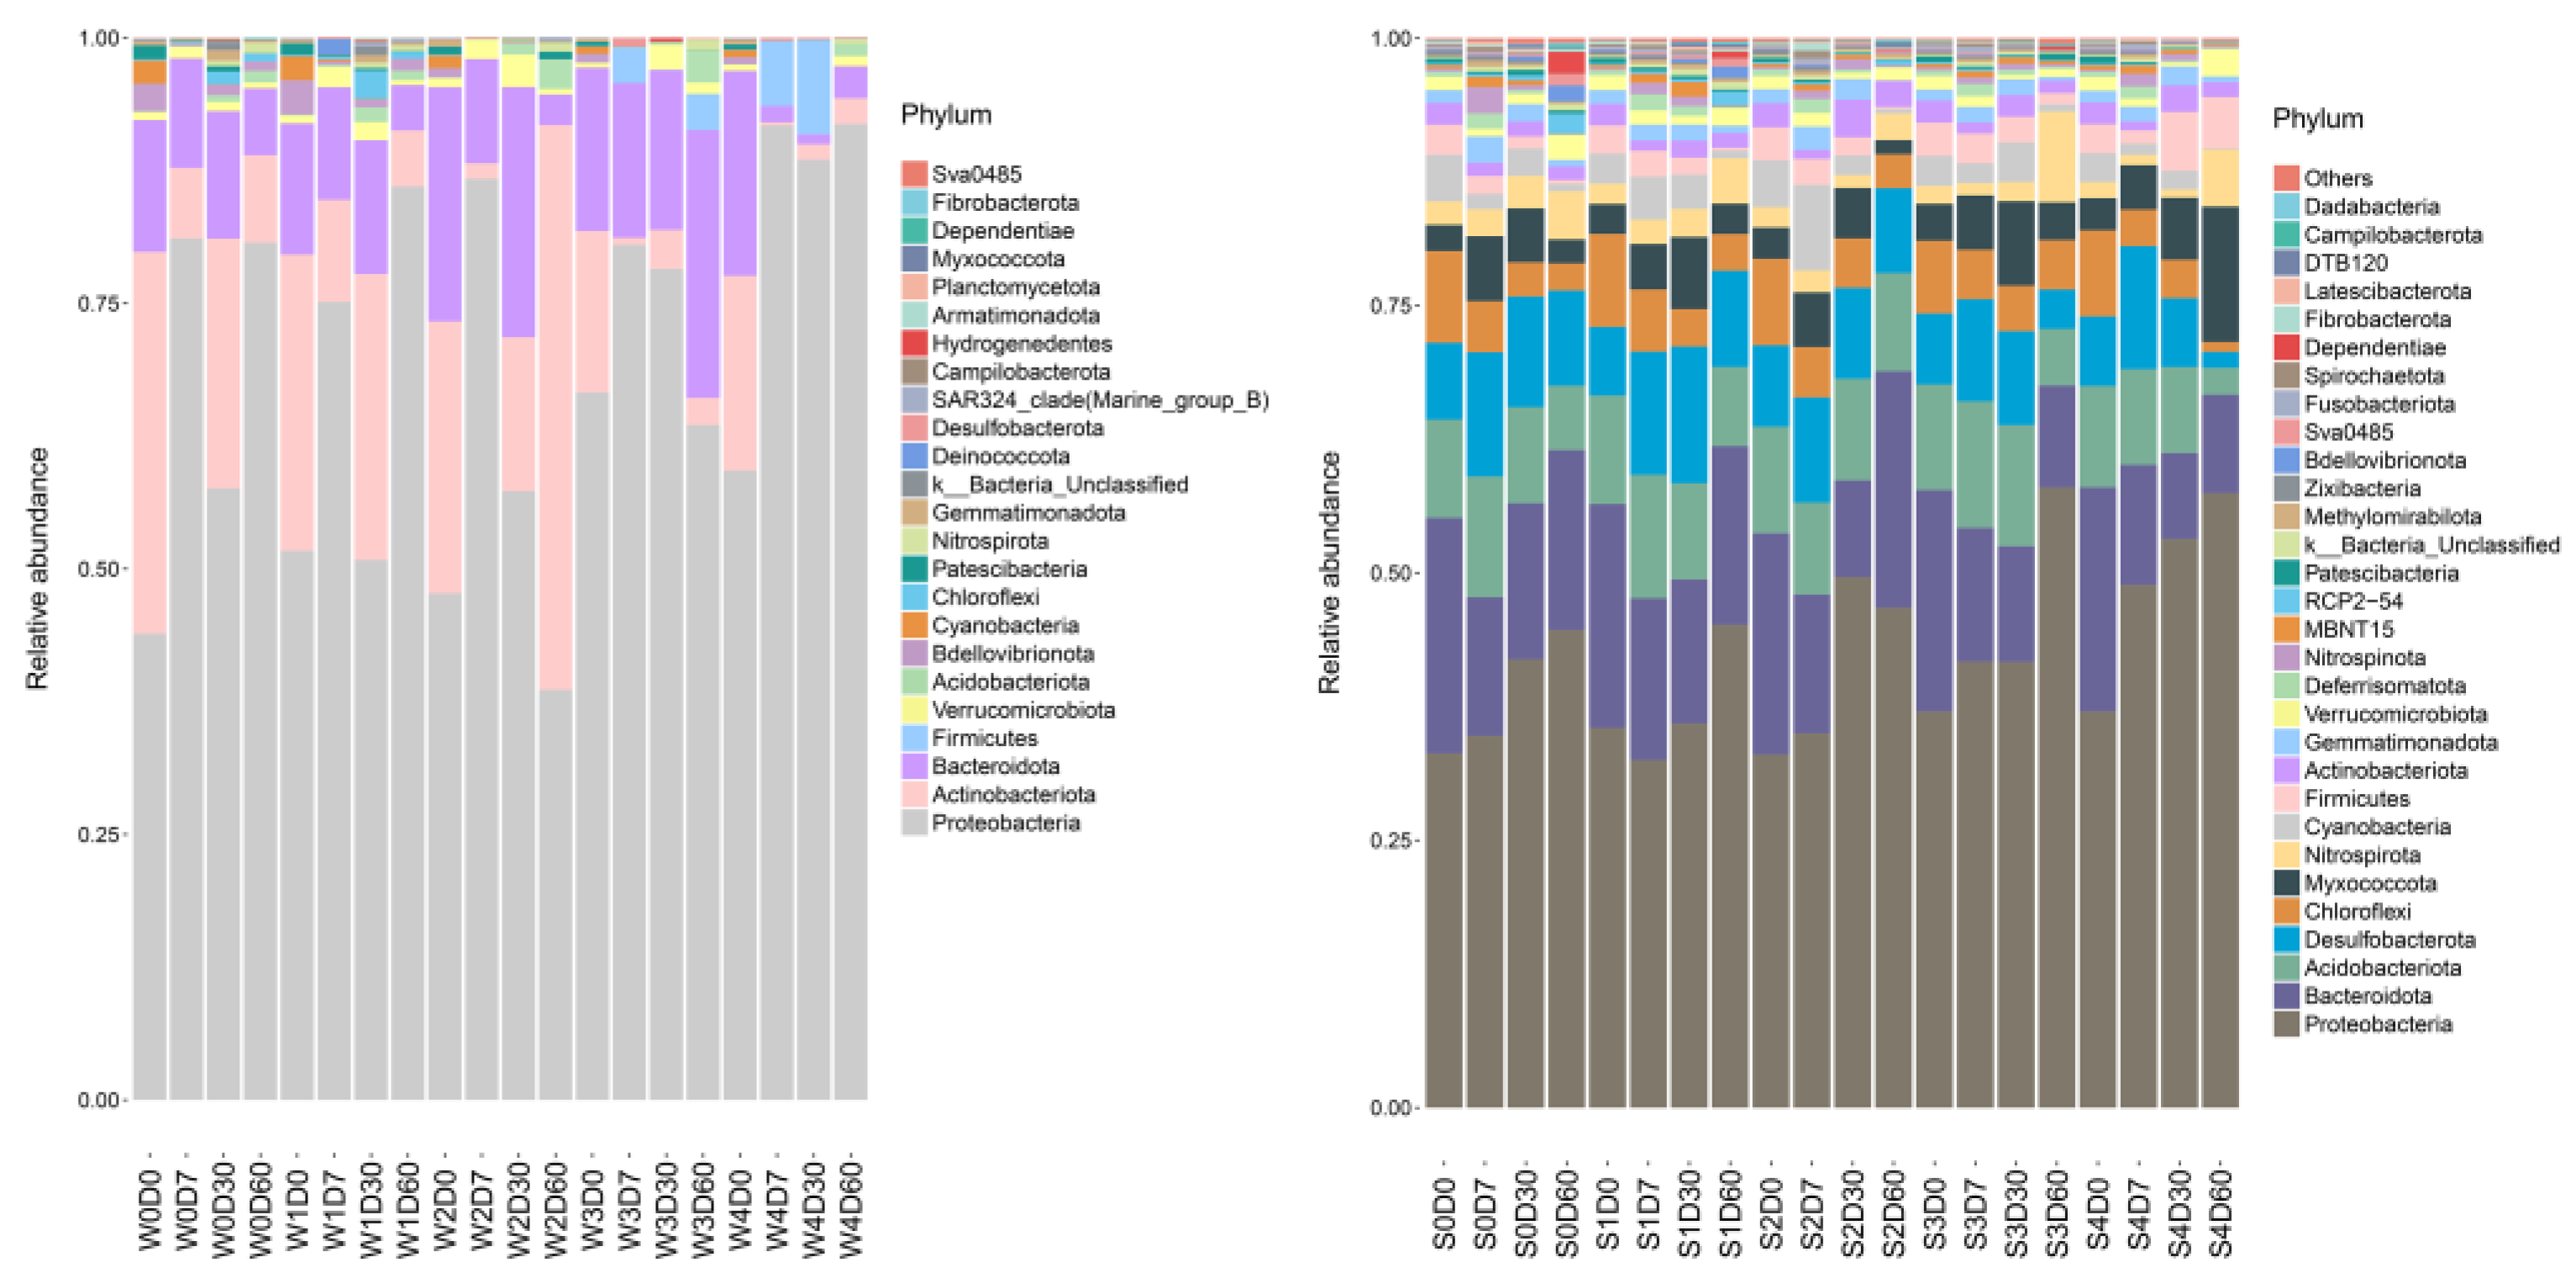
Species relative abundance analysis was performed at the phylum level, and a histogram of species information is indicated in Figure 4. A total of 24 gates were obtained for the water bodies, and 40 gates for sediments. The dominant bacteria in the water were Proteobacteria, Actinobacteriota and Bacteroidota, and the dominant bacteria in the sediment were Proteobacteria, Bacteroidota, Desulfobacteria (Desulfobacterota), and Acidobacteriota, Myxococcota. Proteobacteria were the dominant bacteria in all samples, with relative abundances ranging from 39% to 92% in water, and 33% to 57% in sediments. Compared with the control group, the relative abundance of Proteobacteria increased significantly, while the relative abundance of Actinobacteria and Bacteroidetes decreased significantly in the water samples. Significant changes in the microbial community structure of the sediments appeared on Days 30 and 60. The relative abundance of Proteobacteria and Myxococcota increased, and the relative abundance of Bacteroidota, Desulfobacterota, Acidobacteriota, and Chloroflexi decreased. The relative abundance of Firmicutes in the water samples of the control group was 0, while the relative abundance in the W4D7 and W4D30 samples was 6.1% and 8.9%, respectively.
At the genus level, a total of 257 genera were obtained from the water samples, with the number of each group ranging from 47 to 181; a total of 435 genera were obtained from the sediments, with the number of each group ranging from 270 to 367. The top 30 genus-level species were selected to draw a histogram. As shown in Figure 5, the main dominant bacterial genera in the water without florfenicol were hgcI-clade, CL500-29-marine-group, PeM15, Bacteroidota, and Kapabacteriales. On Day 7, florfenicol had a significant effect on the bacterial community structure in the water. With the increase in florfenicol concentration, the relative abundances of Vogesella, Hydrogenophaga, Comamonadaceae, and Cellvibrio in Proteobacteria were decreased. The dominant bacterial genera in the sediments were Dechloromonas, Geothrix, Anaeromyxobacter, Bacteroidetes-vadinHA17, Geobacteraceae, Steroidobacteraceae, Arenimonas, and Ellin6067. Compared with water, the bacterial diversity in the sediments was higher, the community structure was more complex and stable, and it was stronger in resisting antibiotic stress.

2.5. Multisample Comparative Analysis

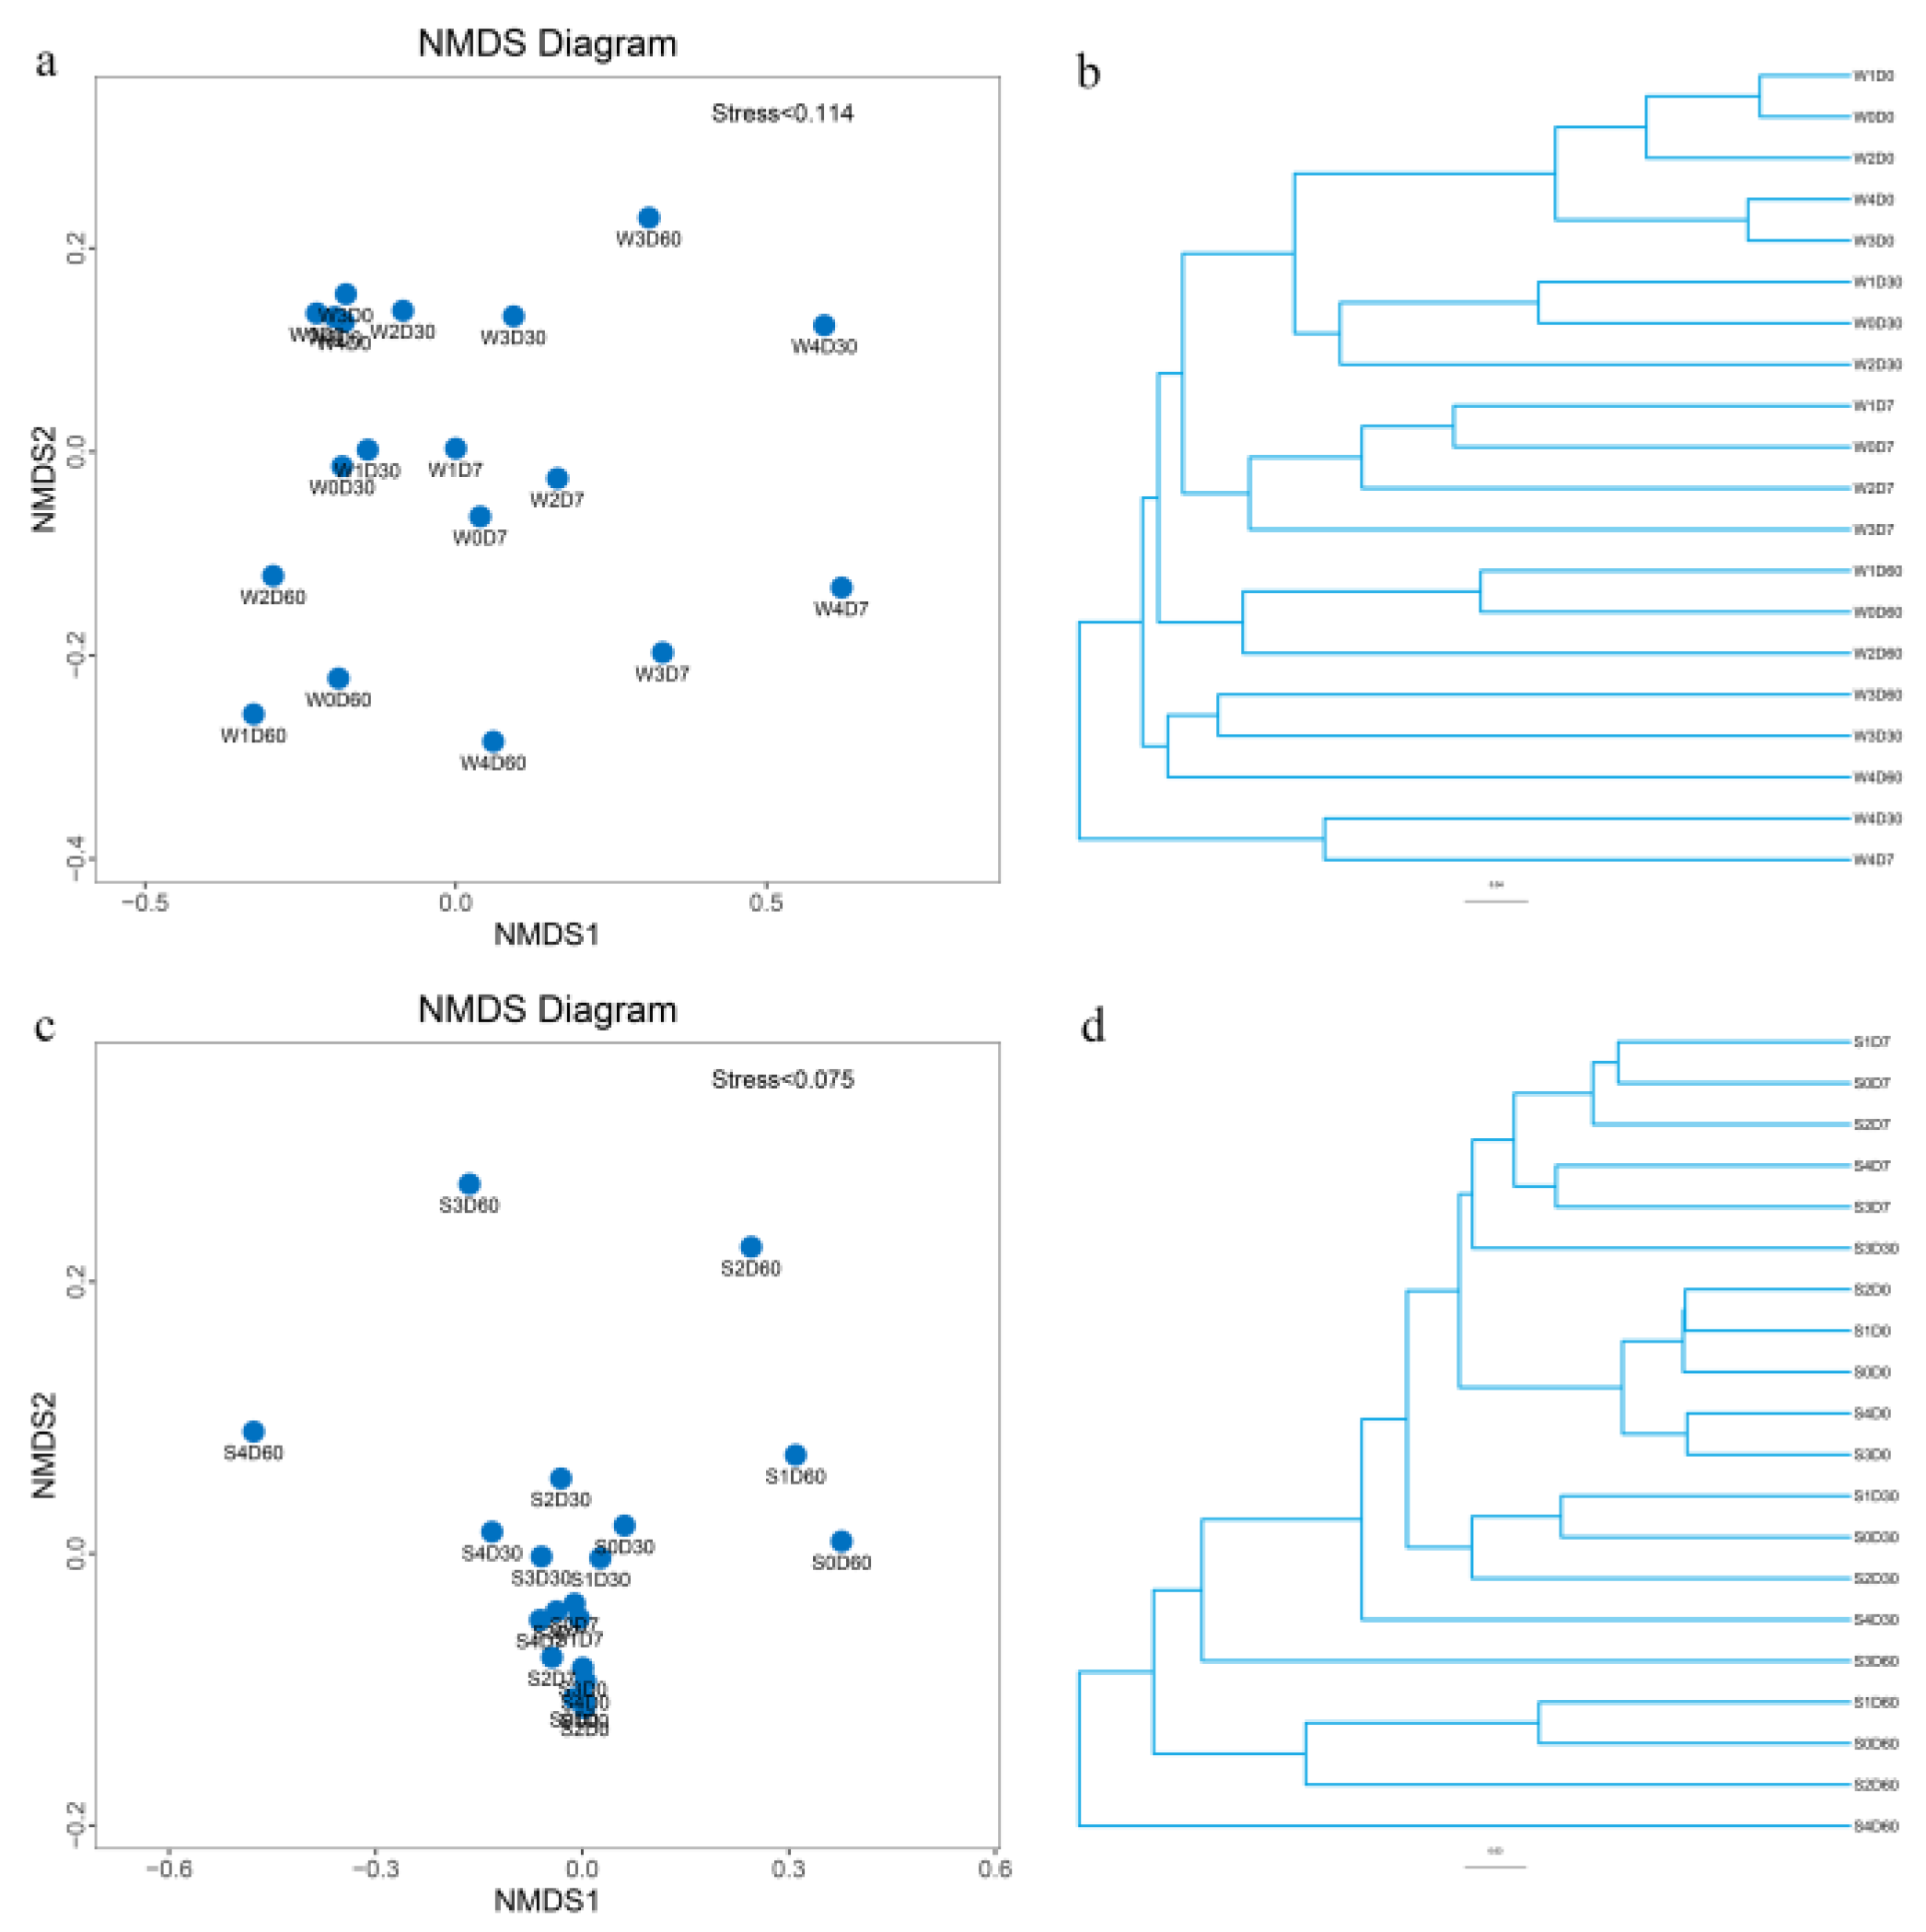
The nonmetric multidimensional scaling method (NMDS analysis) and unweighted pair group method with arithmetic mean (UPGMA) clustering were used to express the degree of similarity and difference between different samples. The results are shown in Figure 6. When stress is less than 0.2, NMDS analysis can accurately reflect the degree of difference between samples; water samples with similar microbial community structure were clustered together in cluster analysis. W4D7 and W4D30W, and W3D30 and W3D60 were clustered together, and NMDS analysis was farther away from other treatment groups. S2D60, S3D60, and S4D60 in the sediment samples were significantly separated from other treatment groups, cluster analysis shows obvious time differences, and the treatment groups with different sampling times had farther clustering distances regarding antibiotic stress.

2.6. Correlation Analysis between Bacterial Communities and ARGs

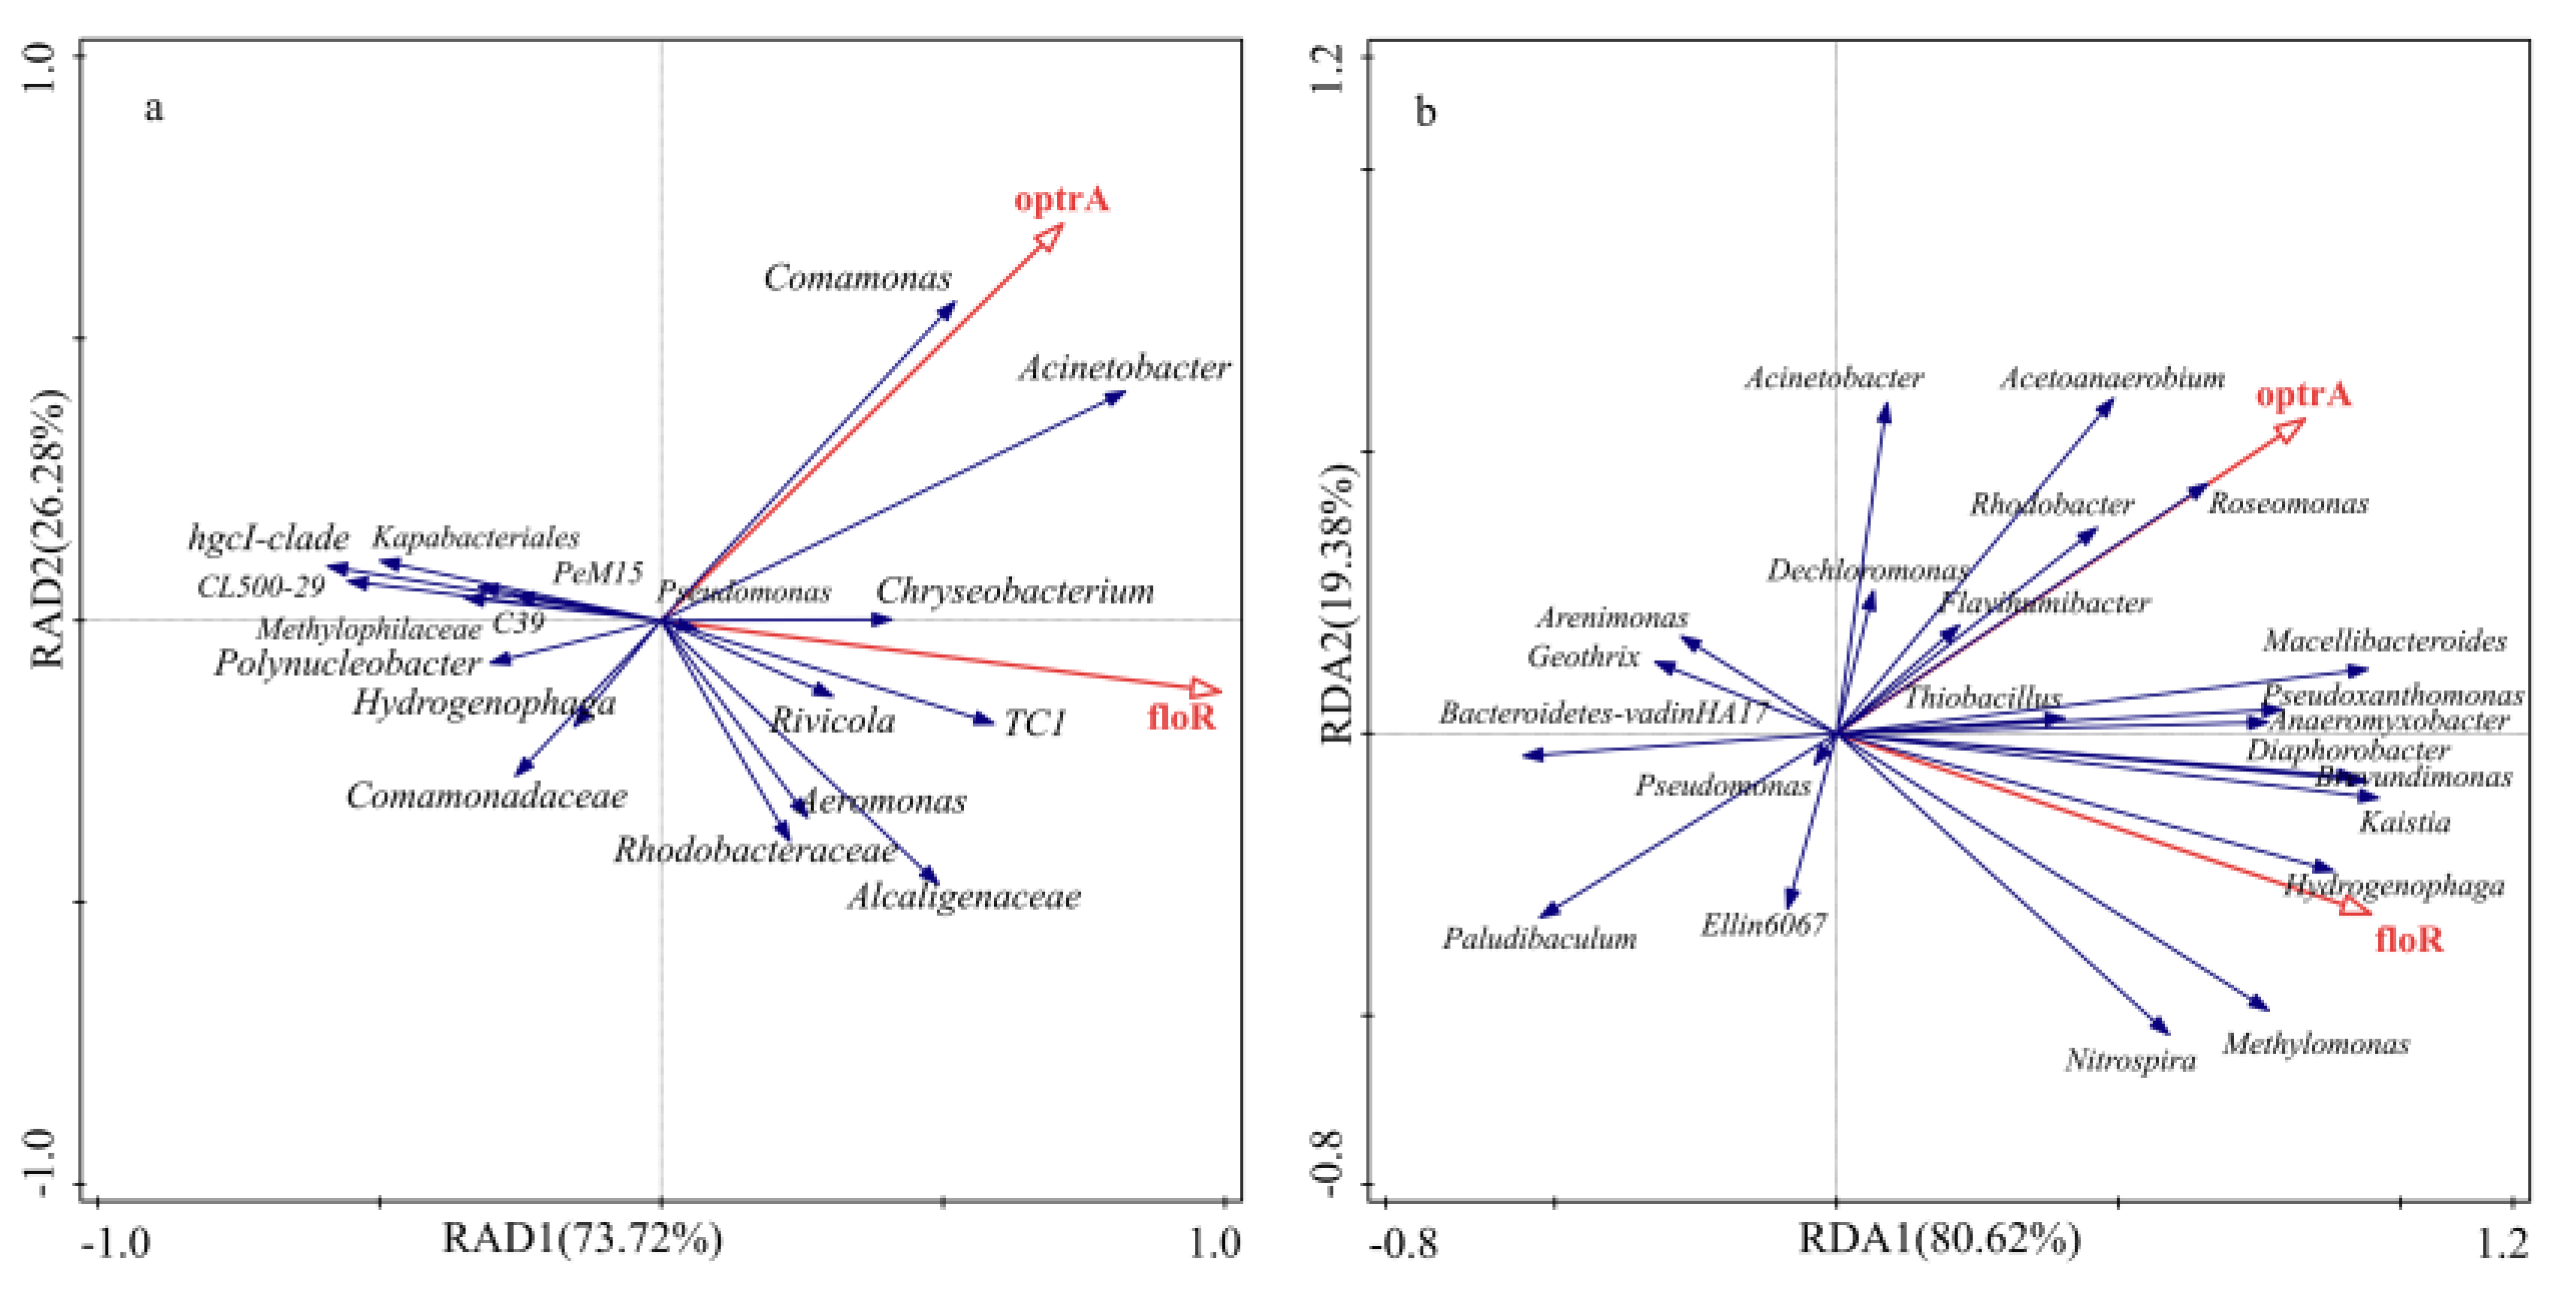
Taking ARGs as environmental factors, combined with the microbial community structure of each sample, bacteria with higher relative abundance were selected as samples, and redundancy analysis (RAD) was used to study the correlation between bacterial community structure and ARGs. The results of redundancy analysis of water samples are shown in Figure 7a. Spindles 1 and 2 explain 73.72% and 26.28% of the bacterial community structure and ARGs parameters, respectively. Among them, genera Comamonas, Acinetobacter, Chryseobacterium, Pesudomonas, and other genera in the bacterial community were positively correlated with the optrA resistance gene, and TC1, Rivicola, Acinetobacter, Chryseobacterium, Pseudomonas, Alcaligenaceae, and other genera were positively correlated with the floR resistance gene. The results of the redundancy analysis of sediment samples are shown in Figure 7b. Spindles 1 and 2 explain 80.62% and 19.38% of the bacterial community structure and ARGs parameters, respectively. In the bacterial community, genera Roseomonas, Rhodobacter, Flavihumibacter, Acetoanaerobium, Macellibacteroides were positively correlated with the optrA resistance gene, and genera such as Hydrogenophaga, Kaistia, Brevundimonas, Methylomonas, Nitrospira, and Diaphorobacter were positively correlated with the floR resistance gene.

3. Discussion

Under antibiotic pressure selection, bacteria in aquacultural environments develop drug resistance and ARGs, thereby destroying the environmental microecological balance [23]. Aquatic environments are vulnerable to contamination through the use of antibiotics in aquacultural wastewater, and the increased selective pressure caused by the extensive use of florfenicol in aquaculture has accelerated the development and spread of bacterial resistance to this antibiotic, resulting in potential public health risks [24,25]. Among the reported resistance genes of florfenicol, the floR gene mainly mediates the resistance of Gram-negative bacteria to florfenicol [26]. The optrA gene is involved in bacterial resistance to amide alcohols and oxazolidinones; oxazolidinones (e.g., linezolid and tedizolid) are currently only approved for human infection by superbugs such as methicillin-resistant Staphylococcus aureus and vancomycin-resistant Enterococcus, so they are the “last line of defense” against pathogenic bacteria [27]. In this experiment, the changes in florfenicol resistance genes floR and optrA were determined by qPCR. The results show that the addition of florfenicol had a greater impact on the abundance of ARGs in water, and 0.1 mg·L−1 florfenicol could increase floR gene abundance by 1–3 orders of magnitude, while 10 and 100 mg·L−1 florfenicol increased optrA gene abundance by 1–2 orders of magnitude. With the deposition at higher florfenicol concentration and longer time, the abundance of ARGs began to increase. In addition, the abundance of both ARGs in the water body decreased with time, and the abundance of the optrA drug resistance gene recovered to the control level at 60 days. A previous study showed that the floR gene is found on both chromosomes and plasmids, and plasmids carrying the floR gene can be spread between bacteria [28]. Miranda et al. [26] also isolated a large number of florfenib-resistant strains from two commercial scallop hatcheries in Chile carrying the floR gene. Furthermore, Fan et al. [29], and Torres et al. [30] found that the optrA resistance gene exists in both Staphylococcus and Enterococcus. Wang et al. [31] observed that the addition of florfenicol to soil significantly affected the four resistant genotypes of aminoglycosides, β-lactamases, tetracyclines, and trimethoprim, while the resistance to the amide alcohol genotype had no significant effect. However, other relevant findings suggested that the abundance of resistance genes did not decrease after antibiotics had been discontinued in aquaculture, but remained at a high level [32]. The inconsistencies with the present study may have been caused by the environmental differences and different host species of ARGs. They may also be related to the amount and period of used antibiotics [33].
Water environmental safety is closely associated with the bacterial community structure; when the water environment changes, the bacterial community structure is also altered [34]. The effects of antibiotics on microbial communities are mainly community diversity, abundance, composition, and function [35]. According to a previous report, the impact of antibiotics on the bacterial community structure can be roughly divided into three stages: the first stage has no obvious effect on bacterial abundance, but affects its physiological activity; the second stage has a significant inhibitory effect on bacterial abundance, and the bacterial community difference increases; in the third stage, the bacterial community structure basically returns to the control level [36]. The in vitro minimal inhibitory concentration (MIC) of florfenicol against common pathogens is 0.3–1.6 μg·mL−1. In the present study, 0.1 mg·L−1 florfenicol in the water environment did not affect the diversity and abundance of bacterial communities, but promoted the growth of some specific bacteria; 100 mg·L−1 florfenicol had a dramatic effect on the bacterial community structure, significantly reducing the diversity and abundance of the bacterial communities. The effect of florfenicol on bacterial diversity gradually decreased with time. When the addition of florfenicol was 100 mg·L−1, the bacterial community structure in the sediment was disturbed, and the community diversity and richness decreased. The relative abundance of Acinetobacter strains dominated after supplementing 100 mg·L−1 florfenicol, including Acinetobacter variabilis, Acinetobacter soli, and Acinetobacter baylyi. All three Acinetobacter species are resistant to carbapenems [37,38,39]. The study of Yong-Ji et al. [40] showed that florfenicol significantly affects the environmental bacterial community structure, leading to a complete subversion of the microbial community. Liu et al. [41] suggested that florfenicol is mainly degraded and eliminated in the form of a prototype in an aquacultural environment, most of the drugs persist in the water until degraded, and the content of the drugs in the sediment is less. This is consistent with the changing trend of the results in our experiment. In addition, some studies indicated that sediments have a strong adsorption capacity for certain antibiotics. With changes in the external environment, antibiotics adsorbed in sediments may be resolved and released into waters [42], which can also explain our findings.
ARGs affect the diversity index of soil bacterial communities [43]. Meanwhile, microbes serve as hosts for ARGs, and changes in their community structure are related to the expression of ARGs [44]. The correlation analysis of this study shows that Acinetobacter, Chryseobacterium, and Pseudomonas were positively correlated with the optrA and floR genes in water; these three bacteria are common opportunistic pathogens and may also be the potential host bacteria of florfenicol resistance genes. Acinetobacter has the ability to acquire OXA-type carbapenemases and metallo-β-lactamases, and develop rapid resistance to new antibiotics; therefore, it can become the dominant genus under antibiotic stress [45]. Chryseobacterium is widespread in water, soil, and hospital environments. Chryseobacterium is resistant to a variety of antibiotics, such as lactams, aminoglycosides, and quinolones [46,47,48]. Fu et al. [49] isolated multidrug-resistant Chryseobacterium sp. POL2 from livestock and poultry farming wastewater. The integrated engagement element of this strain can confer new drug resistance and pathogenicity to the host bacteria, allowing for the host bacteria to rapidly adapt to changing ecological niches, increasing the risk of transmission and infection. Pseudomonas has a variety of environmental adaptation mechanisms and is widely present in the environment [50]. In both veterinary and human medicine, resistance to commonly used antipseudomonal antibiotics such as carbapenems, cephalosporins, fluoroquinolones, and aminoglycosides was reported [51,52,53]. Pseudomonas has multiple drug-resistance mechanisms, including target gene mutations, changes in the expression of genes encoded by the efflux pump system, the production of inactivating enzymes, and the formation of biofilms [54,55]. The selection pressure of antibiotics makes these potential pathogenic bacteria acquire resistance genes and become dominant genera, accelerating the spread of ARGs and the risk of disease outbreaks. Hence, avoiding the misuse of broad-spectrum antibiotics such as florfenicol in aquaculture is imperative.

4. Materials and Methods

4.1. Reagents

Lake surface water (1–10 cm) and lake surface sediments (1–10 cm) in Guangdong Ocean University (Zhanjiang, China) were collected, and the debris was removed to construct an aquatic microcosm. Florfenicol (13021322) was purchased from North China Pharmaceutical Co., Ltd. (Hebei, China). Water DNA Kit (D5525), Soil DNA Kit (D5625), and MicroElute Gel Extraction Kit (D6294) were purchased from Omega Bio-Tek Company (Guangzhou, China). TIANprep Midi Plasmid Kit (DP106-02) was purchased from Tiangen Biochemical TechnologyCo., Ltd. (Beijing, China). pMDTM 19-T Vector Cloning Kit (6013) was purchased from Bao Bioengineering Co., Ltd. (Dalian, China). ChamQ Universal SYBR qPCR Master Mix (Q711- 02) was purchased from Nanjing Novizan Biotechnology Co., Ltd. (Nanjing, China). DH5α competent cells (B528413), Real-Time PCR Plates, 96-Well Transparent, Non Skirted (F603101) and primers were purchased from Sangon Bioengineering Co., Ltd. (Shanghai, China).

4.2. Experimental Design and Sampling

The indoor aquatic microcosm model was constructed to simulate the aquatic ecosystem. The collected lake water and sediment were picked out and packed in a transparent 50 × 40 × 30 cm plastic box. A total of 15 aquatic microcosm models were constructed. The sediment thickness of the group was about 10 cm, and the water body was about 30 L. After the aquatic microcosm system had basically stabilized, a florfenicol solution was added to the water body to concentrations of 0, 0.1, 1, 10 and 100 mg·L−1 (the numbers are water samples W0–W4 and sediment samples S0–S4), placed at room temperature of 25 ± 3 °C, and the water samples were collected at four points at 0, 7, 30, and 60 days (D0, D7, D30, D60) at a distance of about 10 cm from the water surface (W group) and surface sediment (1–5 cm) samples (group S); the sediment samples were mixed and centrifuged to remove the supernatant. The experiment was divided into 5 groups, each with 3 replications.

4.3. Detection of ARGs

The SYBR-primer method was used to determine the abundance of ARGs on the CFX Connect Real-Time System instrument (BIO-RAD). Primer-related information is shown in Table 3 and was based on the previous studies [56,57]. The purified product after PCR amplification was ligated into a 19-T vector, and the ligated product was transformed into competent E. coli. Positive clones were selected, plasmids were extracted from them, and the plasmid concentration was determined using a NanoDrop microspectrophotometer. The known plasmid concentration was diluted with fivefold gradient concentration, the logarithmic value of copy number was used as the abscissa, and the CT value was used as the ordinate to draw a standard curve. Three repetitions were performed for each group, and the average was taken.
DNA copy number (copies·μL−1) = [C × 10−9 × 6.02 × 1023]/[L × 660]
where C is the plasmid concentration (ng·μL−1), and L is the number of bases of the cloned product (bp). The qPCR reaction system was: 10 µL SYBR, 1 µL DNA template, 1 µL upstream and downstream primers (10 mol·L−1) each, and 8 µL ddH2O. The qPCR reaction program was: 94 °C, 5 min; 94 °C for 30 s, annealing for 30 s (annealing temperature is shown in the table), 72 °C for 30 s, 39 cycles; fluorescence was collected after each cycle. From 60 to 95 °C, the fluorescence was collected every 0.5 °C to generate the melting curve to test the specificity of the amplification results.

4.4. 16S rDNA Sequencing

The extraction of the total microbial genome DNA from water and sediments was according to the instructions of the commercial kits. The concentration and purity of the extracted DNA were determined with a nanodrop UV–vis spectrophotometer. The DNA samples extracted from each group of the 3 replicates were mixed into one sample and sent to Suzhou Jinweizhi Biotechnology Co., Ltd. (Suzhou, China) for the Illumina MiSeq paired-end sequencing of the V3–V4 amplicon regions of 16S rDNA. The sequencing details were based on a former report [58].

4.5. Statistical Analysis

QIIME 1.9.1 was used to optimize the high-throughput sequencing raw data: splicing the overlapping regions at the ends of the sequences, removing sequences with a length of less than 200 bp, and removing the chimeric sequences to obtain valid data. Operational taxonomic unit (OTU) cluster analysis was performed according to 97% similarity. Species taxonomic annotation was performed using the Silva 138 16S rDNA database. Excel 2016 was used to analyze the abundance of ARGs, QIIME 1.9.1 software was used for α diversity index analysis, R language was used for β diversity analysis, and CANOCO 5.0 software was used to analyze the correlation between ARGs and the community structure. GLMs followed by multiple comparisons using Duncan’s test were applied to test the effects of concentrations of florfenicol, time, and their interactions on the abundance of ARGs. Statistical analyses were performed with SAS 9.2 (SAS Institute Inc., Cary, NC, USA).

5. Conclusions

In this study, the addition of florfenicol increased the abundance of the floR and optrA genes by orders of magnitude. The bacterial community diversity and richness in sediment were higher than those in water. The addition of florfenicol reduced the diversity and richness of the bacterial community, and the effect on the bacterial community structure in water was much higher than that in the sediment. The richness and diversity of the bacterial communities gradually recovered over time. High concentrations of florfenicol break the original community structure and significantly increase the relative abundance of drug-resistant bacteria. Therefore, to reduce the risks of environmental safety and public health that are posed by florfenicol, the standardized use of broad-spectrum antibiotics such as florfenicol in aquaculture, and closely monitoring and unraveling alternatives to antibiotics are necessary.

Author Contributions

Funding acquisition, Y.M. and W.L.; investigation, T.Z. and Y.D. (Yuexia Ding); methodology, T.Z. and J.P.; project administration, T.Z. and Y.D. (Yue Dai); software, S.L.; supervision, Y.M.; writing-original draft, T.Z.; writing-review and editing, W.L. and Y.M. All authors have read and agreed to the published version of the manuscript.

Funding

This research was funded by the Guangdong Provincial Department of Education 2021 Special Project for Key Fields of Ordinary Colleges and Universities (2021ZDZX4003); the Zhanjiang Science and Technology Bureau 2021 Provincial Science and Technology Special Funds (“Big Special + Task List”) Competitive Allocation Project (2021A05231); and the Start-Up Research Project of Maoming Laboratory, Guangdong Laboratory for Lingnan Modern Agriculture (2021TDQD002).

Institutional Review Board Statement

Not applicable.

Informed Consent Statement

Not applicable.

Data Availability Statement

16S rDNA sequencing data were uploaded to the repository (National Center for Biotechnology Information, NCBI) that can be found at http://www.ncbi.nlm.nih.gov/bioproject/841751 (accession no., PRJNA841751).

Conflicts of Interest

The authors declare no conflict of interest.

References

  1. Guo, Y.; Zhao, Z.; Pan, Z.; An, L.; Balasubramanian, B.; Liu, W. New insights into the role of dietary marine-derived polysaccharides on productive performance, egg quality, antioxidant capacity, and jejunal morphology in late-phase laying hens. Poult. Sci. 2020, 99, 2100–2107. [Google Scholar] [CrossRef] [PubMed]
  2. Liu, W.; Zhu, Y.; Zhao, Z.; Jiang, P.; Yin, F. Effects of dietary supplementation of algae-derived polysaccharides on morphology, tight junctions, antioxidant capacity and immune response of duodenum in broilers under heat stress. Animals 2021, 11, 2279. [Google Scholar] [CrossRef] [PubMed]
  3. Xie, W.; Shen, Q.; Zhao, F. Antibiotics and antibiotic resistance from animal manures to soil: A review. Eur. J. Soil Sci. 2018, 69, 181–195. [Google Scholar] [CrossRef]
  4. Liu, W.; Zhou, S.; Balasubramanian, B.; Zeng, F.; Sun, C.; Pang, H. Dietary seaweed (Enteromorpha) polysaccharides improves growth performance involved in regulation of immune responses, intestinal morphology and microbial community in banana shrimp Fenneropenaeus merguiensis. Fish Shellfish Immun. 2020, 104, 202–212. [Google Scholar] [CrossRef] [PubMed]
  5. FAO. The State of World Fisheries and Aquaculture; Sustainability in Action; FAO: Rome, Italy, 2020. [Google Scholar] [CrossRef]
  6. Rozas, M.; Enríquez, R. Piscirickettsiosis and Piscirickettsia salmonis in fish: A review. J. Fish Dis. 2014, 37, 163–188. [Google Scholar] [CrossRef]
  7. Giguère, S.; Prescott, J.F.; Dowling, P.M. Antimicrobial Therapy in Veterinary Medicine; John Wiley & Sons: Hoboken, NJ, USA, 2013. [Google Scholar]
  8. Huang, X.; Feng, Y.; Hu, C.; Xiao, X.; Yu, D.; Zou, X. Mechanistic model for interpreting the toxic effects of sulfonamides on nitrification. J. Hazard. Mater. 2016, 305, 123–129. [Google Scholar] [CrossRef]
  9. Zong, H.; Ma, D.; Wang, J.; Hu, J. Research on florfenicol residue in coastal area of Dalian (northern China) and analysis of functional diversity of the microbial community in marine sediment. Bull. Environ. Contam. Toxicol. 2010, 84, 245–249. [Google Scholar] [CrossRef] [PubMed]
  10. Jara, B.; Tucca, F.; Srain, B.M.; Méjanelle, L.; Aranda, M.; Fernández, C.; Pantoja-Gutiérrez, S. Antibiotics florfenicol and flumequine in the water column and sediments of Puyuhuapi Fjord, Chilean Patagonia. Chemosphere 2021, 275, 130029. [Google Scholar] [CrossRef]
  11. Yan, C.; Yang, Y.; Zhou, J.; Liu, M.; Nie, M.; Shi, M.; Gu, L. Antibiotics in the surface water of the Yangtze Estuary: Occurrence, distribution and risk assessment. Environ. Pollut. 2013, 175, 22–29. [Google Scholar] [CrossRef]
  12. Zhang, Q.; Ying, G.; Pan, C.; Liu, Y.; Zhao, J. Comprehensive evaluation of antibiotics emission and fate in the river basins of China: Source analysis, multimedia modeling, and linkage to bacterial resistance. Environ. Sci. Technol. 2015, 49, 6772–6782. [Google Scholar] [CrossRef]
  13. Na, G.; Fang, X.; Cai, Y.; Ge, L.; Zong, H.; Yuan, X.; Yao, Z.; Zhang, Z. Occurrence, distribution, and bioaccumulation of antibiotics in coastal environment of Dalian, China. Mar. Pollut. Bull. 2013, 69, 233–237. [Google Scholar] [CrossRef] [PubMed]
  14. Chen, K.; Zhou, J. Occurrence and behavior of antibiotics in water and sediments from the Huangpu River, Shanghai, China. Chemosphere 2014, 95, 604–612. [Google Scholar] [CrossRef] [PubMed]
  15. Liang, Y.; Pei, M.; Wang, D.; Cao, S.; Xiao, X.; Sun, B. Improvement of soil ecosystem multifunctionality by dissipating manure-induced antibiotics and resistance genes. Environ. Sci. Technol. 2017, 51, 4988–4998. [Google Scholar] [CrossRef] [PubMed]
  16. Crecchio, C.; Ruggiero, P.; Curci, M.; Colombo, M.; Palumbo, G.; Stotzky, G. Binding of DNA from Bacillus subtilis on montmorillonite–humic acids–aluminum or iron hydroxypolymers: Effects on transformation and protection against DNase. Soil Sci. Soc. Am. J. 2005, 69, 834–841. [Google Scholar] [CrossRef]
  17. Ma, W.; Wang, L.; Xu, X.; Huo, M.; Zhou, K.; Mi, K.; Tian, X.; Cheng, G.; Huang, L. Fate and exposure risk of florfenicol, thiamphenicol, and antibiotic resistance genes during composting of swine manure. Sci. Total Environ. 2022, 839, 156243. [Google Scholar] [CrossRef]
  18. Li, Z.; Liu, Y.; Xie, J.; Wang, G.; Cheng, X.; Zhang, J.; Sang, C.; Liu, Z. Impact of microecological agents on water environment restoration and microbial community structures of trench system in a Baiyangdian wetland ecosystem. J. Appl. Microbiol. 2022, 132, 2450–2463. [Google Scholar] [CrossRef]
  19. Kim, J.; Hong, Y.; Yang, J.; Kwon, O.; Kim, S. Bioaccumulation and mass balance analysis of veterinary antibiotics in an agricultural environment. Toxics 2022, 10, 213. [Google Scholar] [CrossRef]
  20. Zeng, S.; Sun, J.; Chen, Z.; Xu, Q.; Wei, W.; Wang, D.; Ni, B. The impact and fate of clarithromycin in anaerobic digestion of waste activated sludge for biogas production. Environ. Res. 2021, 195, 110792. [Google Scholar] [CrossRef]
  21. Qiao, M.; Ying, G.; Singer, A.C.; Zhu, Y. Review of antibiotic resistance in China and its environment. Environ. Int. 2018, 110, 160–172. [Google Scholar] [CrossRef] [Green Version]
  22. Zeng, Q.; Liao, C.; Terhune, J.; Wang, L. Impacts of florfenicol on the microbiota landscape and resistome as revealed by metagenomic analysis. Microbiome 2019, 7, 155. [Google Scholar] [CrossRef]
  23. Xie, H.; Du, J.; Chen, J. Concerted efforts are needed to control and mitigate antibiotic pollution in coastal waters of China. Antibiotics 2020, 9, 88. [Google Scholar] [CrossRef]
  24. Jampani, M.; Gothwal, R.; Mateo-Sagasta, J.; Langan, S. Water quality modelling framework for evaluating antibiotic resistance in aquatic environments. J. Hazard. Mater. 2022, 3, 100056. [Google Scholar] [CrossRef]
  25. Lu, J.; Zhang, J.; Xu, L.; Liu, Y.; Li, P.; Zhu, T.; Cheng, C.; Lu, S.; Xu, T.; Yi, H.; et al. Spread of the florfenicol resistance floR gene among clinical Klebsiella pneumoniae isolates in China. Antimicrob. Resist. Infect. Control 2018, 7, 1–9. [Google Scholar] [CrossRef] [PubMed]
  26. Miranda, C.D.; Rojas, R.; Geisse, J.; Romero, J.; González-Rocha, G. Scallop larvae hatcheries as source of bacteria carrying genes encoding for non-enzymatic phenicol resistance. Mar. Pollut. Bull. 2015, 95, 173–182. [Google Scholar] [CrossRef] [PubMed]
  27. Wang, Y.; Lv, Y.; Cai, J.; Schwarz, S.; Cui, L.; Hu, Z.; Zhang, R.; Li, J.; Zhao, Q.; He, T.; et al. A novel gene, optrA, that confers transferable resistance to oxazolidinones and phenicols and its presence in Enterococcus faecalis and Enterococcus faecium of human and animal origin. J. Antimicrob. Chemother. 2015, 70, 2182–2190. [Google Scholar] [CrossRef] [PubMed]
  28. Da Silva, G.C.; Rossi, C.C.; Santana, M.F.; Langford, P.R.; Bossé, J.T.; Bazzolli, D.M.S. p518, a small floR plasmid from a South American isolate of Actinobacillus pleuropneumoniae. Vet. Microbiol. 2017, 204, 129–132. [Google Scholar] [CrossRef]
  29. Fan, R.; Li, D.; Wang, Y.; He, T.; Feßler, A.T.; Schwarz, S.; Wu, C. Presence of the optrA gene in methicillin-resistant Staphylococcus sciuri of porcine origin. Antimicrob. Agents Chemother. 2016, 60, 7200–7205. [Google Scholar] [CrossRef]
  30. Torres, C.; Alonso, C.A.; Ruiz-Ripa, L.; León-Sampedro, R.; Campo, R.D.; Coque, T.M.; Aarestrup, F.M.; Schwarz, S.; Shen, J.; Cavaco, L. Antimicrobial resistance in Enterococcus spp. of animal origin. Microbiol. Spectr. 2018, 6. [Google Scholar] [CrossRef]
  31. Wang, M.; Zhou, T.; Liang, Y.; Li, G.; Sun, Y. Response characteristics of nirS-type denitrifier Paracoccus denitrificans under florfenicol stress. Ecotox. Environ. Safe. 2021, 219, 112355. [Google Scholar] [CrossRef]
  32. Suzuki, S.; Nakanishi, S.; Tamminen, M.; Yokokawa, T.; Sato-Takabe, Y.; Ohta, K.; Chou, H.; Muziasari, W.I.; Virta, M. Occurrence of sul and tet (M) genes in bacterial community in Japanese marine aquaculture environment throughout the year: Profile comparison with Taiwanese and Finnish aquaculture waters. Sci. Total Environ. 2019, 669, 649–656. [Google Scholar] [CrossRef]
  33. Wang, M.; Xie, X.; Wang, M.; Wu, J.; Zhou, Q.; Sun, Y. The bacterial microbiota in florfenicol contaminated soils: The antibiotic resistome and the nitrogen cycle. Environ. Pollut. 2020, 259, 113901. [Google Scholar] [CrossRef] [PubMed]
  34. Yan, Q.; Bi, Y.; Deng, Y.; He, Z.; Wu, L.; Van, N.J.D.; Shi, Z.; Li, J.; Wang, X.; Hu, Z.; et al. Impacts of the Three Gorges Dam on microbial structure and potential function. Sci. Rep. 2015, 5, 1–9. [Google Scholar] [CrossRef] [PubMed]
  35. Zhang, L.; Zhang, C.; Lian, K.; Liu, C. Effects of chronic exposure of antibiotics on microbial community structure and functions in hyporheic zone sediments. J. Hazard. Mater. 2021, 416, 126141. [Google Scholar] [CrossRef] [PubMed]
  36. Ma, J.; Shu, L.; Mitchell, S.M.; Yu, L.; Zhao, Q.; Frear, C. Effects of different antibiotic operation modes on anaerobic digestion of dairy manure: Focus on microbial population dynamics. J. Environ. Chem. Eng. 2021, 9, 105521. [Google Scholar] [CrossRef]
  37. Al Hag, W.A.; Elbadawi, H.; Abdel, H.M.M.; A’Court, C.; Garrard, C.S.; AbdulWahab, A.; Taj Aldeen, S.J.; Ibrahim, E.B.; Akbar, M.; Zahid, M.; et al. Use of 16s rRNA to identify non-lactose-fermenting bacilli and molecular detection of ESBL resistance genes associated with hospital-acquired infection in Soba University Hospital, Sudan. F1000Research 2020, 9, 1311. [Google Scholar] [CrossRef]
  38. Endo, S.; Yano, H.; Kanamori, H.; Inomata, S.; Aoyagi, T.; Hatta, M.; Gu, Y.; Tokuda, K.; Kitagawa, M.; Kaku, M. High frequency of Acinetobacter soli among Acinetobacter isolates causing bacteremia at a tertiary hospital in Japan. J. Clin. Microbiol. 2014, 52, 911–915. [Google Scholar] [CrossRef]
  39. Luo, J.; McIntyre, E.A.; Bedore, S.R.; Santala, V.; Neidle, E.L.; Santala, S. Characterization of highly ferulate-tolerant Acinetobacter baylyi ADP1 isolates by a rapid reverse engineering method. Appl. Environ. Microb. 2022, 88, e0178021. [Google Scholar] [CrossRef]
  40. Wu, Y.; Liu, Z.; Pang, Z.; Sun, Y.; Zhao, Y.; Hu, M.; Lin, L.; Yan, Z.; Huang, K.; Si, H. Study on the effects of stephania delavayi diels water extracts combined with antibiotics on NDM-1-producing Acinetobacter in Vitro. China Anim. Husb. Vet. Med. 2016, 43, 1092–1097. [Google Scholar]
  41. Liu, C.; Meng, Y.; Zhu, X.; Li, B.; Xia, L.; Xu, Z.; Shen, M.; Chen, X.; Bian, W. Elimination and migration of florfenicol and its metabolic residues in Letaurus punetaus and aquaculture environment under pond conditions. Chin. Fish. Qual. Stand. 2019, 9, 30–40. [Google Scholar]
  42. Li, S.; Huang, Z.; Wang, Y.; Liu, Y.; Luo, R.; Shang, J.; Liao, Q. Migration of two antibiotics during resuspension under simulated wind-wave disturbances in a water-sediment system. Chemosphere 2018, 192, 234–243. [Google Scholar] [CrossRef]
  43. Wang, F.; Stedtfeld, R.D.; Kim, O.; Chai, B.; Yang, L.; Stedtfeld, T.M.; Hong, S.G.; Kim, D.; Lim, H.S.; Hashsham, S.A.; et al. Influence of soil characteristics and proximity to Antarctic research stations on abundance of antibiotic resistance genes in soils. Environ. Sci. Technol. 2016, 50, 12621–12629. [Google Scholar] [CrossRef] [PubMed]
  44. Forsberg, K.J.; Patel, S.; Gibson, M.K.; Lauber, C.L.; Knight, R.; Fierer, N.; Dantas, G. Bacterial phylogeny structures soil resistomes across habitats. Nature 2014, 509, 612–616. [Google Scholar] [CrossRef]
  45. Cao, J.; Zhang, H. First report of carbapenem-resistant Acinetobacter soli isolates coharboring blaNDM-1 and blaOXA-58 genes from China. Diagn. Microbiol. Infec. Dis. 2015, 83, 407–408. [Google Scholar] [CrossRef] [PubMed]
  46. Hantsis-Zacharov, E.; Senderovich, Y.; Halpern, M. Chryseobacterium bovis sp. nov., isolated from raw cow’s milk. Int. J. Syst. Evol. Microbiol. 2008, 58, 1024–1028. [Google Scholar] [CrossRef] [PubMed]
  47. Mwanza, E.P.; Hugo, A.; Charimba, G.; Hugo, C.J. Pathogenic potential and control of Chryseobacterium species from clinical, fish, food and environmental sources. Microorganisms 2022, 10, 895. [Google Scholar] [CrossRef] [PubMed]
  48. Zhang, W.; Li, J.; Zhang, Y.; Wu, X.; Zhou, Z.; Huang, Y.; Zhao, Y.; Mishra, S.; Bhatt, P.; Chen, S. Characterization of a novel glyphosate-degrading bacterial species, Chryseobacterium sp. Y16C, and evaluation of its effects on microbial communities in glyphosate-contaminated soil. J. Hazard. Mater. 2022, 432, 128689. [Google Scholar] [CrossRef]
  49. Fu, J.; Zhong, C.; Zhou, Y.; Lu, M.; Zong, G.; Zhang, P.; Cheng, M.; Cao, G. The integrative and conjugative element ICECspPOL2 contributes to the outbreak of multi-antibiotic-resistant bacteria for Chryseobacterium Spp. and Elizabethkingia Spp. Microbiol. Spectr. 2021, 9, e02005–e02021. [Google Scholar] [CrossRef]
  50. Nadimpalli, M.L.; Marks, S.J.; Montealegre, M.C.; Gilman, R.H.; Pajuelo, M.J.; Saito, M.; Tsukayama, P.; Njenga, S.M.; Kiiru, J.; Swarthout, J.; et al. Urban informal settlements as hotspots of antimicrobial resistance and the need to curb environmental transmission. Nat. Microbiol. 2020, 5, 787–795. [Google Scholar] [CrossRef]
  51. Cabassi, C.S.; Sala, A.; Santospirito, D.; Alborali, G.L.; Carretto, E.; Ghibaudo, G.; Taddei, S. Activity of AMP2041 against human and animal multidrug resistant Pseudomonas aeruginosa clinical isolates. Ann. Clin. Microb. Anti. 2017, 16, 1–9. [Google Scholar] [CrossRef]
  52. Cazares, A.; Moore, M.P.; Hall, J.P.J.; Wright, L.L.; Grimes, M.; Emond-Rhéault, J.; Pongchaikul, P.; Santanirand, P.; Levesque, R.C.; Fothergill, J.L.; et al. A megaplasmid family driving dissemination of multidrug resistance in Pseudomonas. Nat. Commun. 2020, 11, 1–13. [Google Scholar] [CrossRef]
  53. Haenni, M.; Bour, M.; Châtre, P.; Madec, J.; Plésiat, P.; Jeannot, K. Resistance of animal strains of Pseudomonas aeruginosa to carbapenems. Front. Microbiol. 2017, 8, 1847. [Google Scholar] [CrossRef] [PubMed]
  54. Jones, F.; Hu, Y.; Coates, Y. The efficacy of using combination therapy against multi-drug and extensively drug-resistant Pseudomonas aeruginosa in clinical settings. Antibiotics 2022, 11, 323. [Google Scholar] [CrossRef] [PubMed]
  55. Kracalik, I.; Ham, D.C.; McAllister, G.; Smith, A.R.; Vowles, M.; Kauber, K.; Zambrano, M.; Rodriguez, G.; Garner, K.; Chorbi, K.; et al. Extensively drug-resistant carbapenemase-producing Pseudomonas aeruginosa and medical tourism from the United States to Mexico, 2018–2019. Emerg. Infect. Dis. 2022, 28, 51. [Google Scholar] [CrossRef] [PubMed]
  56. Faldynova, M.; Pravcova, M.; Sisak, F.; Havlickova, H.; Kolackova, I.; Cizek, A.; Karpiskova, R.; Rychlik, I. Evolution of antibiotic resistance in Salmonella enterica serovar typhimurium strains isolated in the Czech Republic between 1984 and 2002. Antimicrob. Agents Chemother. 2003, 47, 2002–2005. [Google Scholar] [CrossRef] [PubMed]
  57. Ying, Y.; Wu, F.; Wu, C.; Jiang, Y.; Yin, M.; Zhou, W.; Zhu, X.; Cheng, C.; Zhu, L.; Li, K.; et al. Florfenicol resistance in Enterobacteriaceae and whole-genome sequence analysis of florfenicol-resistant Leclercia adecarboxylata Strain R25. Int. J. Genom. 2019, 2019, 9828504. [Google Scholar] [CrossRef]
  58. Jin, Y.; Guo, Y.; Zheng, C.; Liu, W. Effect of heat stress on ileal microbial community of indigenous yellow-feather broilers based on 16S rRNA gene sequencing. Vet. Med. Sci. 2022, 8, 642–653. [Google Scholar] [CrossRef]
Figure 1. Effects of different concentrations of florfenicol on the abundance of antibiotic resistance genes (ARGs) in an aquatic microcosm model. W, water; S, sediments.
Antibiotics 11 01299 g001
Figure 2. Effects of different concentrations of florfenicol on operational taxonomic units (OTUs) of bacteria (Venn diagram) in an aquatic microcosm model. (a) Effect of sampling time on OUTs of bacteria in group W4 samples. (b) Effects of different concentrations of florfenicol on OTUs of bacteria in water samples at 30 days. (c) Effect of sampling time on the OUTs of bacteria in group S2 samples. (d) Effects of different concentrations of florfenicol on OTUs of bacteria in sediment samples at 60 days. W, water; S, sediments. Differently colored circles represent different samples, and the numbers represent the number of unique OTUs in each sample or the number of common OTUs to all samples.
Antibiotics 11 01299 g002
Figure 3. Effects of different concentrations of florfenicol on dilution curve of operational taxonomic units (OTUs) of bacteria in an aquatic microcosm model. W, water; S, sediments.
Antibiotics 11 01299 g003
Figure 4. Effects of different concentrations of florfenicol on phylum-level bacterial abundance in an aquatic microcosm model. W, water; S, sediments.
Antibiotics 11 01299 g004
Figure 5. Effects of different concentrations of florfenicol on genus-level bacterial abundance in an aquatic microcosm model. W, water; S, sediments.
Antibiotics 11 01299 g005
Figure 6. Nonmetric multidimensional scaling method (NMDS) analysis reveals the degree of similarity and difference of bacteria between different samples in an aquatic microcosm model. W, water; S, sediments. (a) The results of the NMDS analysis of water samples; (b) The results of the UPGMA analysis of water samples; (c) The results of the NMDS analysis of sediment samples. (d) The results of the UPGMA analysis of sediment samples.
Antibiotics 11 01299 g006
Figure 7. Correlation analysis between bacterial communities and ARGs in an aquatic microcosm model. W, water; S, sediments; (a) The results of the redundancy analysis of water samples; (b) The results of the redundancy analysis of sediment samples.
Antibiotics 11 01299 g007
Table 1. Alpha diversity index of bacteria in water.
SampleOTUsACEChao1ShannonSimpson
W0D0279320.58328.795.990.97
W1D0283328.62334.045.860.96
W2D0275293.72294.335.960.97
W3D0273300.98302.645.050.90
W4D0275296.88304.535.360.92
W0D7323350.91349.285.480.95
W1D7333376.69396.585.850.96
W2D7194219.66217.624.900.94
W3D7135164.48164.254.620.93
W4D791152.33137.752.590.73
W0D30368396.82397.136.500.98
W1D30379424.92438.116.950.99
W2D30303349.49340.506.120.97
W3D30231261.72260.755.730.96
W4D3095127.48131.112.960.76
W0D60314351.89351.605.310.91
W1D60274308.32308.144.050.85
W2D60291308.85307.534.930.89
W3D60191230.08217.255.240.95
W4D60230261.66267.054.130.84
Table 2. Alpha diversity index of bacteria in sediments.
SampleOTUsACEChao1ShannonSimpson
S0D0841922.03955.248.370.99
S1D0847918.58939.268.411.00
S2D0844928.59941.048.360.99
S3D0857953.93977.288.370.99
S4D0858944.58952.108.390.99
S0D7904982.03996.368.671.00
S1D79081002.841017.908.611.00
S2D79021004.741049.358.581.00
S3D7862941.05954.558.280.99
S4D7860944.85947.537.830.98
S0D309401016.881027.788.671.00
S1D30900970.75967.228.581.00
S2D30859942.94965.218.310.99
S3D30785825.71829.698.310.99
S4D30782848.19860.477.870.99
S0D60721810.66817.407.950.99
S1D60806896.28908.758.160.99
S2D60653748.21733.687.530.99
S3D60741865.00877.077.570.99
S4D60590727.29731.816.720.98
Table 3. Primer information of antibiotic resistance genes (ARGs) for qPCR.
GenesSequences (5′-3′)Product size (bp)Annealing
Temperature (°C)
floRF: GCGATATTCATTACTTTGGC42554
R: TAGGATGAAGGTGAGGAATG
optrAF: CTTATGGATGGTGTGGCAGC31059
R: CCATGTGGTTTGTCGGTTCA
Publisher’s Note: MDPI stays neutral with regard to jurisdictional claims in published maps and institutional affiliations.