Abstract
Background: In order to establish the clinical breakpoint (CBP) of danofloxacin against G. parasuis, three cutoff values, including epidemiological cutoff value (ECV), pharmacokinetic-pharmacodynamic (PK-PD) cutoff value (COPD) and clinical cutoff value (COCL), were obtained in the present study. Methods: The ECV was calculated using ECOFFinder base on the MIC distribution of danfloxacin against 347 G. parasuis collected from disease pigs. The COPD was established based on in vivo and ex vivo PK-PD modeling of danofloxacin both in plasma and pulmonary epithelial lining fluid (PELF) using Hill formula and Monte Carlo analysis. The COCL was established based on the relationship between the possibility of cure (POC) and MIC in the clinical trials using the “WindoW” approach, nonlinear regression and CART analysis. Results: The MIC50 and MIC90 of danofloxacin against 347 G. parasuis were 2 μg/mL and 8 μg/mL, respectively. The ECV value was set to 8 μg/mL using ECOFFinder. Concentration-time curves of danofloxacin were fitted with a two-compartment PK model. The PK parameters of the maximum concentration (Cmax) and area under concentration-time curves (AUC) in PELF were 3.67 ± 0.25 μg/mL and 24.28 ± 2.70 h·μg/mL, higher than those in plasma (0.67 ± 0.01 μg/mL and 4.47 ± 0.51 h·μg/mL). The peak time (Tmax) in plasma was 0.23 ± 0.07 h, shorter than that in PELF (1.61 ± 0.15 h). The COPD in plasma and PELF were 0.125 μg/mL and 0.5 μg/mL, respectively. The COCL calculated by WindoW approach, nonlinear regression and CART analysis were 0.125–4 μg/mL, 0.428 μg/mL and 0.56 μg/mL, respectively. The 0.5 μg/mL was selected as eligible COCL. The ECV is much higher than the COPD and COCL, and the clinical breakpoint based on data in plasma was largely different from that of PELF. Conclusions: Our study firstly established three cutoff values of danofloxacin against G. parasuis. It suggested that non-wild-type danofloxacin-resistant G. parasuis may lead to ineffective treatment by danofloxacin.
1. Introduction
Glaesserella parasuis, a gram-negative respiratory pathogen, can colonize the upper respiratory tract in swine and cause Glasser’s disease with clinical manifestations such as fibrinous polyserositis, arthritis, meningitis and pneumonia [1]. The serotypes 1, 5, 10, 12, 13 and 14 exhibit higher virulence and pathogenicity [2]. Serotypes 5 and 4 are dominant in China [3]. With the abuse of antibiotics, antimicrobial-resistant G. parasuis emerge in different degrees, which bring serious threat to the global economy and public health [4].
Quinolones are effective for treating G. parasuis infection because of their strong bactericidal activity and good absorption into the blood and great distribution in the lung [5]. When intravenous injection of danofloxacin 2.5 mg/kg, the distribution half-life was 0.21 ± 0.004 h and Vd area was 6.41 ± 0.0.94 L/kg in sheep plasma [6]. Danofloxacin, one of the most important fluoroquinolones, has a broad spectrum of antimicrobial activity and has been widely used in different animals, such as in sheep [7], bees [8], rabbits [9], turkeys [10], cattle and swine [11]. However, the clinical breakpoint (CBP) for danofloxacin against G. parasuis had not yet been established by the clinical laboratory of standard Institute (CLSI) and the European Commission of antimicrobial susceptibility testing (EUCAST).
CBP is set on the basis of epidemiological cutoff values (ECV) or wide-type cutoff (COWT), PK-PD cutoff values (COPD) and clinical cutoff values (COCL) [12]. For a given microbial species and antimicrobial agent, the ECV is the upper bound of the wild-type MIC distribution for organisms with no detectable acquired resistance mechanisms, which can be calculated by nonlinear regression analysis using ECOFFinder software [13,14,15]. COPD considers the PK-PD parameters of special antimicrobial agents in target animals and uses Monte Carlo simulation to determine the MIC with a 90% possibility of reaching the PK-PD target [16]. COCL is decided based on the relationship between clinical outcomes and antimicrobial susceptibility using several statistical approaches [17]. The present study aimed to establish the ECV, COPD and COCL values for the decision of the final CBP of danofloxacin against G. parasuis and evaluation of the efficiency of danofloxacin for treatment of G. parasuis.
2. Materials and Methods
2.1. Strains
From March to May in 2017, a total of 347 G. parasuis strains were collected from disease animals. Thirty-five G. parasuis strains were isolated from pig lungs provided by Keqian clinical diagnostic center; 8 G. parasuis strains were donated by Xiaojuan Xu from State Key Laboratory of Agricultural Microbiology in Huazhong Agricultural University; 204 G. parasuis strains were isolated from disease pigs by Peng Zhang in China Agricultural University; 100 G. parasuis strains were stored in National Reference Laboratory of Veterinary Drug Residues. All these strains were isolated from the lungs and pericardium of weak or moribund pigs showing respiratory distress or arthritis in different provinces of China. All bacterial isolates were confirmed by PCR amplification of 16S rRNA (Figure S1) [18]. E. coli (ATCC 25922) was used as the quality control strain (QC).
2.2. Animals
Seventy-eight six-week-old healthy crossbred (Duroc × Large × white × Landrace) pigs weighing 20 ± 2 kg were purchased from Huazhong Agricultural University pig breeding farm. Prior to experiments, pigs were raised for 7 days to acclimatize. Sixteen–twenty g healthy Balb/c mice were purchased from the Experimental Animal Center of Huazhong Agricultural University. Prior to experiments, mice were raised for 7 days to acclimatize. All the animal experiments were approved by the Animal Ethics Committee of Huazhong Agricultural University (hzauch 2014-003) and the Animal Care Center, Hubei Science and Technology Agency in China (SYXK2013-0044). All animal experiments were conducted according to the committee guidelines for the Laboratory Animal Use and Care Committee in Hubei Science and Technology Agency. All efforts were used to reduce the pain and adverse effect of the animals.
2.3. Establishment of ECV
Susceptibility testing was performed by agar dilution method according to CLSI M07-A9 standard with some modification [19]. A 2 μL G. parasuis suspension (107 CFU/mL measured by Mcfarland Turbidimetric Method) was inoculated onto TSA-FCS-NAD agar plates containing two-fold dilutions (0.008, 64 μg/mL) of danofloxacin (Dr. Ehrenstorfer Standards, Augsburg, Germany). The MICs were converted to Log scale, ECV was simulated using ECOFFinder software [20]. ECV at 95%, 97.5%, 99%, 99.5% and 99% confidence intervals were simulated. Generally, the ECV with the 95% confidence interval is selected as the final ECV.
2.4. Establishment of COPD Based on PK-PD Modeling
2.4.1. Selection of Pathogenic G. parasuis
The serotype of 81 strains whose MIC was the same as MIC90 and higher than MIC90 were determined by ERIC-PCR (Enterobacterial Repetitive Intergenic Consensus - PCR) using ERIC primer (5′-ATG TAA GCT CCT GGG GAT TCA C-3′ and 5′-AAG TAA GTG ACT GGG GTG AGC G-3′) following previous study (Figure S2) [21,22]. SH 0165 (serotype 5) was the positive control.
The 18 strains of serotype 5 were selected for the mouse pathogenicity test. The 16–20 g healthy Balb/c mice were randomly divided into 19 groups (5 mice/group) with one blank control group. The mice were inoculated with 1 × 10⁹ cfu bacteria by abdominal cavity injection, and the control group was injected with TSB broth. Mice were monitored daily for 7 days post-inoculation (dpi). The pathogenicity of G. parasuis was compared according to the survival time [23].
2.4.2. Pharmacodynamics In Vitro and Ex-Vivo
The MIC and MBC of G. parasuis H80 in broth and pulmonary epithelial lining fluid (PELF) were determined using the broth dilution method according to the CLSI M07-A9 standard with some modification.
The in vitro and ex vivo killing curves of danofloxacin in broth and in PELF were drawn by monitoring the Colony formed unite (CFU) changes during the incubation of G. parasuis H80 under a series concentration of danofloxacin (1/2 to 32 MIC) for a continuous time period (0, 1, 2, 4, 6, 8, 12 and 24 h).
2.4.3. Animal Experiment and Sample Collection for Pharmacokinetics Study
Danofloxacin was administrated to twelve pigs at a single dose of 2.5 mg/kg b.w. by intramuscular injection. After administration, 2 mL blood samples were obtained at 0, 0.08, 0.17, 0.25, 0.5, 0.75, 1, 1.5, 2, 3, 4, 6, 8, 10, 12, 24, 36 and 48 h. Plasma was obtained by centrifuging the blood sample at 3500 r/min for 10 min, and the sample was stored at −80 °C before processing.
To collect PELF samples, atropine (0.05 mg/kg) and propofol (9–15 mg/kg) were given intramuscularly and intravenously for 30 min for anesthesia. Standardized Bronchoalveolar Lavage (BAL) was performed as previously described [24,25], with an electronic fiber optic bronchoscope (KangmeiGU-180VET) inserted in the right middle lung lobe. The 50 mL of normal saline was instilled into the lobe and was aspirated into a 50 mL centrifugal tube. The PELF samples were collected at 0, 0.5, 1, 1.5, 2, 4, 6, 8, 10, 12, 24, 36 and 48 h. The PELF was centrifuged at 800 r/min for 10 min, and the sample was stored at −80 °C before processing.
2.4.4. Quantitation Analysis of Danofloxacin by HPLC
Quantitation analyses of danofloxacin in PELF and plasma were conducted using high-performance liquid chromatography (HPLC). Agent SB-Aq reverse-phase column (250 mm, 4.6 mm i.d., 5 mm; Agilent) was used to perform HPLC at 30 °C. The detection wavelength was 280 nm. The mobile phase consisted of 0.05% phosphoric acid (phase A) and acetonitrile (phase B) with gradient elute. The peak time of danofloxacin was 10.64 min. 0.5 mL Plasma and 0.5 mL PELF were extracted with 2 mL acetonitrile twice.
The urea dilution method was used to determine the volume of PELF as described previously [26,27]. The concentration of urea in plasma (UreaPLASMA) and PELF (UreaPELF) were determined by using a urea test kit (Urea test kit; Sigma Chemical, St. Louis, MO, USA) and the absorbance values measured by using a spectrophotometer (Agilent 8453, Wuhan, China). The final concentration of danofloxacin in PELF (CPELF) was derived from the following equation: ; CBAL was the diluted concentration of danofloxacin in PELF determined by the HPLC method.
2.4.5. Pharmacokinetics-Pharmacodynamics Modeling
PK-PD parameters were estimated using Winnonlin (v.5.2.1 US Certara Pharsight®) with a two-compartment model. According to the ex vivo time-killing curve, the Sigmoid Emax model () was used to calculate the AUC24/MIC (AUIC) of danofloxacin at different concentrations, E is the summary PD endpoint, and E0 is the effect representing the value of the PD endpoint without drug treatment (i.e., the value of the summary endpoint when the PK-PD index is 0). X is one of the three PK-PD indices as defined above, and PDmax is the maximum effect (in relation to E0) indicated by the plateau where increased exposures result in no further kill. EC50 is the magnitude of X that is needed to achieve 50% of PDmax, and γ is the sigmoidicity factor. The PD target under different efficiency (E = 0, −3 and −4 (bacteriostasis, bactericidal and eradication)) was determined with Sigmoid Emax equation [28,29]. The dosage regimen was derived from the concentration-dependent dosage equation () [30,31,32]. In the equation, the CL (mL/h) was the plasma (total) clearance per day, AUIC (h) was the targeted endpoint for optimal efficacy, fu was the free fraction of the drug in PELF (from 0 to 1), and F was the bioavailability factor (from 0 to 1). In this study, fu was 0.8974, which was obtained by measuring the protein binding rate by the equilibrium dialysis method.
2.4.6. Monte Carlo Simulation to Set up COPD
Crystal Ball v7.2.2 was used to perform the Monte Carlo simulation. The distribution of the PK-PD parameter was assumed to be log-normal. A total of 10,000 subjects were simulated. The PD target was selected to calculate the probability of target attainment (PTA). COPD was defined as the MIC at which the PTA was ≥90%.
2.5. Clinical Trial and Establishment of COCL
2.5.1. Infection Model and Clinical Trials
Sixty-six healthy weaned piglets (20 ± 2 kg) were divided into 11 groups: 5 groups were the experimental group, 5 groups were the negative control group, and 1 group was the blank control group, with 6 piglets in each group. The 5 experimental groups and 5 negative control groups were challenged with 5 representative strains, H42, H80, H12, H83 and H17, by intranasal inoculation of 1 × 10¹⁰ CFU bacterial suspension twice a day. The blank control group was inoculated with blank TSB broth. The dosage regimens were recommended by the PK-PD therapeutic dosage regimen. After challenging, these pigs were monitored daily for two weeks.
2.5.2. Statistical Analysis for Establishment of COCL
The probability of cure (POC) was calculated based on the clinical outcomes and bacteriological prognosis. Clinical outcomes included treatment success and failure, and each MIC should have a corresponding clinical outcome. The bacteriological prognosis was to determine the presence or eradication of the bacteria after administration. The data were analyzed by three different analysis methods.
The “WindoW” approach [17] included two parameters: “MaxDiff” and “CAR”. “MaxDiff (the method of maximum difference, MaxDiff)” represents the difference between higher and lower POC at a certain MIC. “CAR” was based on the clinical outcome and the corresponding MIC distribution. “CAR” could not be set as the lowest MIC or the highest MIC if “CAR” was gradually increasing with MIC, then the “CAR” should choose the second small “CAR”.
Nonlinear regression analysis was a new method based on the formula between EUCAST proposed POC with MIC. Log2MIC was the independent variable, and the POC was the dependent variable. The model with the highest correlation coefficient was selected to simulate its COCL.
The classification and regression tree (CART) model (Salford Predictive Modeler software) was also used for the establishment of COCL. MIC was used as the predictive variable, and the POC was the target variable. The Gini coefficient minimization criterion was used to select the MIC node automatically.
3. Results
3.1. ECV for Danofloxacin against G. parasuis
The MIC distribution for danofloxacin against G. parasuis is shown in Figure 1. The MIC of danofloxacin ranged from 0.008 to 64 μg/mL. As shown in Figure 1, the MIC distribution was as follows: 0.008 µg/mL (2.88%), 0.015 µg/mL (1.15%), 0.03 µg/mL (5.19%), 0.06 µg/mL (6.34%), 0.125 µg/mL (7.20%), 0.25 µg/mL (5.48%), 0.5 µg/mL (2.88%), 1 µg/mL (8.36%), 2 µg/mL (27.09%), 4 µg/mL (19.60%), 8 µg/mL (8.65%), 16 µg/mL (4.33%), 32 µg/mL (0.58%) and 64 µg/mL (0.29%). The MIC50 and MIC90 were 2 μg/mL and 8 μg/mL, respectively.
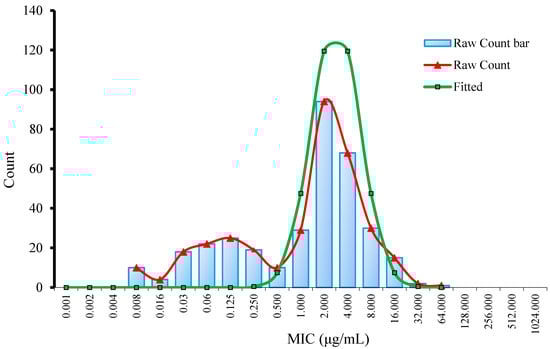
Figure 1.
Nonlinear regression of MIC distribution for danofloxacin against G. parasuis.
3.2. COPD for Danofloxacin against G. parasuis
3.2.1. Pathogenic G. parasuis
Eighteen strains belonging to serotype 5 were selected from ERIC-PCR amplification and pathogenicity test in mice, and five strains (H42, H80, H12, H83 and H17) showed the highest pathogenicity and exhibited different MIC. The strain H80 with MIC close to MIC50 was selected for the PK-PD study. The five respective strains H42 (MIC = 16 µg/mL), H80 (MIC = 4 µg/mL), H12 (MIC = 1 µg/mL), H83 (MIC = 0.125 µg/mL) and H17 (MIC = 0.015 µg/mL) were selected for clinical trial.
3.2.2. Pharmacodynamics of Danofloxacin against G. parasuis
The MICs of danofloxacin in broth and pulmonary epithelial lining fluid (PELF) were 4 μg/mL and 2 μg/mL, respectively. The MBC in broth and PELF were 8 μg/mL and 4 μg/mL, respectively. The antibacterial activity of danofloxacin in PELF is stronger than that of in broth.
As displayed in Figure 2, the in vitro and ex vivo bactericidal effect of danofloxacin against G. parasuis was similar. The lower concentrations (≤MIC) of danofloxacin exhibited similar antibacterial activity to G. parasuis. However, when danofloxacin concentrations were higher than MIC, the inhibitory efficiency gradually strengthened following the increased drug concentration. The time-killing curve showed that the activity of danofloxacin against G. parasuis was concentration-dependent. The Aera Under Curve/Minimum Inhibitory Concentration (AUC/MIC) was selected as the PK-PD parameter.
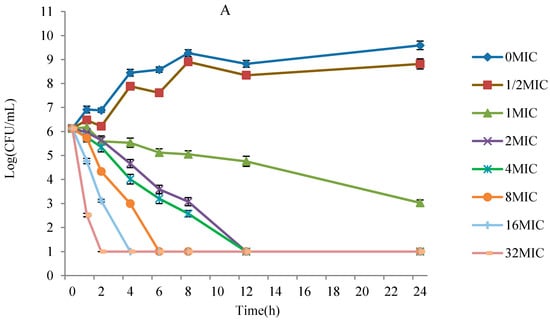
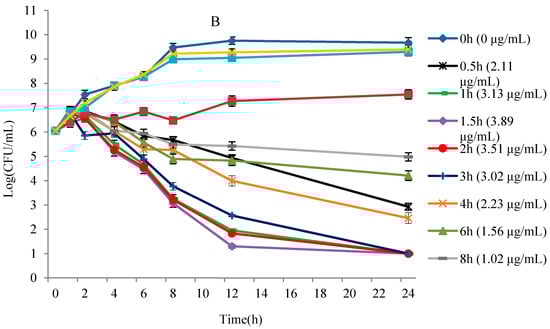
Figure 2.
The killing curve of G. parasuis in PELF and plasma. (A) is the killing curve of G. parasuis in TSB broth, and (B) is the killing curve of G. parasuis in PELF.
3.2.3. Sensitivity and Accuracy of HPLC Method for Determination of Danofloxacin
The limit of determination (LOD) was 0.01 μg/mL, and the limit of quantification (LOQ) was 0.025 μg/mL in PELF. The LOD was 0.02 μg/mL, and the LOQ was 0.05 μg/mL in plasma. Standard curves were linear from 0.05 μg/mL to 5 μg/mL in plasma (R2 = 0.9994) and 0.025 μg/mL to 2.5 μg/mL in PELF (R2 = 0.9996). The inter-day variation for determination in plasma and PELF ranged from 1.94% to 2.37% and 1.36% to 2.71%, respectively. The recovery of danofloxacin in plasma and PELF ranged from 90.79 ± 2.15 to 94.36 ± 1.83 and 91.91 ± 2.49 to 95.73 ± 1.30, respectively.
3.2.4. PK Characteristics of Danofloxacin in Plasma and PELF
The concentration-time curves in plasma and PELF after administration of danofloxacin at a single dose of 2.5 mg/kg b.w. are shown in Figure 3. Concentrations of danfloxacin in plasma and PELF at various time points are shown in Table S2. A striking difference is observed between drug concentrations in plasma and in PELF.
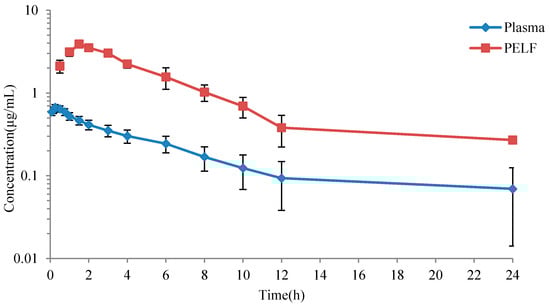
Figure 3.
The mean concentration versus time curves for danofloxacin in PELF and plasma.
The estimated pharmacokinetic parameters in plasma and PELF were shown in Table 1. Distribution of danofloxacin in simulated drug time curve in plasma and in PELF were shown in Figures S3 and S4. In plasma, the peak time (Tmax) was 0.23 ± 0.07 h, the peak concentration (Cmax) was 0.67 ± 0.01 μg/mL, the area under the concentration-time curves (AUC) was 4.47 ± 0.51 h·μg/mL; in PELF, Tmax was 1.61 ± 0.15 h, Cmax was 3.67 ± 0.25 μg/mL, AUC was 24.28 ± 2.70 h·μg/mL.

Table 1.
PK parameters of danofloxacin in plasma and PELF (n = 6).
Combined with the killing curve in PELF, the PD target (AUIC in ex vivo) under different efficiency was calculated by Sigmoid Emax equation simulation (Table 2). The values of AUIC (h) at E = 0, −3 and −4 (bacteriostasis, bactericidal and eradication) were 12.73, 28.68 and 44.38, respectively.
Table 2.
The PD target of danofloxacin against G. parasuis.
3.2.5. Monte Carlo Simulation and COPD
According to the AUC (24.28 ± 2.70 h·μg/mL) and PD target (12.73, 28.68, 44.38) in PELF, Monte Carlo analysis simulated the possibility of target achievement (PTA) under different MICs (Table 3 and Figure S5). When the PTA in PELF was upon 90%, the COPD (E = 0, −3, −4) for danofloxacin against G. parasuis in PELF was 1 μg/mL, 0.5 μg/mL, 0.25 μg/mL, respectively.
Table 3.
The PTA of danofloxacin against G. parasuis at different MICs in PELF and plasma.
According to the AUC (4.47 ± 0.51 h·μg/mL) and PD target (12.73, 28.68 and 44.38) in plasma, Monte Carlo analysis simulated the PTA under different MICs (Table 3 and Figure S6). When the PTA in plasma was upon 90%, the COPD (E = 0, −3, −4) for danofloxacin against G. parasuis in plasma was 0.25 μg/mL, 0.125 μg/mL and 0.03 μg/mL, respectively.
3.3. COCL of Danofloxacin against G. parasuis
The dosage under different efficiency (bacteriostasis, bactericidal and eradication) were 4.58 mg/kg, 10.32 mg/kg and 15.97 mg/kg. The given dosages were simulated by Mlxplore software (Figure S7). The modified dosage regimen was 12.49 mg/kg danofloxacin twice a day. Three methods were used to obtain COCL according to the relationship between POC and MIC distribution (Table 4).
Table 4.
POC and “WindoW” for danofloxacin against G. parasuis at different MIC.
Following the “WindoW” method, the parameters of MaxDiff (0.28) and CAR (0.78) was corresponding with the MIC of 0.125 μg/mL and 4 μg/mL, respectively. Therefore, the COCL selection window range is 0.125 μg/mL to 4 μg/mL. The nonlinear regression model was set up as with a correlation coefficient of 0.996. When POC was 90%, the recommended COCL (MIC) was less than 0.428 μg/mL. The CART regression tree indicated that the COCL was less than 0.56 μg/mL (Figure S8). Combined with the above three results, the COCL of danofloxacin against G. parasuis was selected as 0.25 μg/mL.
4. Discussion
G. parasuis is an important respiratory pathogen in swine. Antimicrobial treatment is the more effective way to control this pathogen due to vaccine deficiency. However, antimicrobial resistance in G. parasuis had been found in Germany [33], the United Kingdom, Spain [34] and China [35,36,37]. In order to rationally use antimicrobials agents to control G. parasuis, some studies have been conducted to establish the ECVs and/or COPD of marbofloxacin, cefquinome and tilmicosin against G. parasuis [29,38,39]. Danofloxacin is very effective against Actinobacillus pleuropneumoniae [40], Pasteurella multocida [41] and Mannheimia haemolytica [42]. However, the clinical breakpoint of danofloxacin against G. parasuis had not yet been established.
Statistical analysis had been widely used for the determination of ECVs. Turnidge [13] recommends using nonlinear regression to analyze the obtained MIC data and determined the ECVs of various drugs. Kronvall [43] used NRI (Normalized Resistance Interpretation) method to analyze MIC data obtained by E test for the establishment of ECVs. European Commission of Antimicrobial Susceptibility Testing (EUCAST) recommended ECOFFinder software on the basis of Turnidge’s nonlinear regression [44]. Van Vliet [45] used NRI and ECOFFinder analysis method to analyze wild-type cutoff values of ampicillin, florfenicol, gentamicin and enrofloxacin. In our study, the ECV of danofloxacin determined by nonlinear regression analysis was the same as that simulated by ECOFFinder software, suggesting that ECOFFinder software is a convenient tool for the establishment of ECVs. In the present study, the MIC distribution of danofloxacin against G. parasuis appeared three peaks (0.008 μg/mL, 0.125 μg/mL and 2 μg/mL), suggesting that some G. parasuis isolates may be resistant to danofloxacin. Zhang et al. [46] examined the resistance of 138 G. parasuis strains against fluoroquinolone drugs and showed that 60.1% of isolates were resistant to enrofloxacin, and 5.8% of isolates were resistant to levofloxacin. It suggested that G. parasuis may also be resistant to danofloxacin due to the cross-resistance between fluoroquinolone drugs.
The COPD was established based on pharmacokinetic data, MIC distribution and PK-PD target. Our present study establishes the COPD based on the PK data from healthy animals because of the stability and repeatability of a healthy animal model. Considering the drug concentrations in the target sites were directly correlated with clinical efficacy, the PK data both in plasma and in PELF were included in our study [47]. Similar to previous studies, our results indicated that the concentration and AUC of danofloxacin in PELF (in the lung) was 4–7 times higher than that in plasma [11]. The COPD of danofloxacin in PELF was subsequently higher than the COPD in plasma, indicating that the COPD was different between in the target tissue and in plasma. As danofloxacin can be accumulated at the infection site (lung), the COPD in plasma may not represent the critical value of the target tissue. It was of great significance to establish the COPD in target tissue and plasma simultaneously. The differences in pharmacokinetic parameters between different studies may be due to differences in pig breeds or individuals. In this study, the Tmax of pigs after i.m. administration of danofloxacin at a dose of 2.5 mg/kg b.w. was 0.23 ± 0.07 h, and this result is different from the result reported by Yang [48] at 0.97 ± 0.08 h; Cmax was 0.67 ± 0.01 μg/mL, which is in good agreement with the previously reported 0.76 ± 0.08 μg/mL; the AUC24h was 4.47 ± 0.51 h·μg/mL, which is less than 5.25 ± 1.35 h·μg/mL, as reported by Yang et al.
Previously, a study exhibited good clinical outcomes of danofloxacin in the treatment of respiratory disease caused by Haemophilus somnus and Pasteurella multocida in European cattle [49]. The clinical data in our study also showed the good clinical outcome of danofloxacin in the treatment of G. parasuis in pigs because the success rate for treatment of G. parasuis with MIC of 1 μg/mL was still as high as 83.33%. The COCL was established based on the relationship between MIC and POC under modified therapeutic dosage. Since there was no standard approach for the establishment of COCL, the COCL in the present study was established by the combination of the three approaches, which included the “WindoW” approach [17], the nonlinear regression [50] and the CART analysis [51,52]. The “WindoW” approach was recommended by CLSI [17]. The nonlinear regression with the formula of POC = 1/(1 + e-a+bf (MIC)) was proposed by VetCAST to calculate the relation between the dependent variable of POC and the independent variable of MIC [50]. The CART method was previously used to develop clinical breakpoints of cefepime [53], and this method was recommended by Dr. Cuesta [54] and Prof. Toutain [12] because the CART obtained the best statistical results when it was compared with other four supervised classifiers (J48, the OneR decision rule, the naïve Bayes classifier and simple logistic regression).
A large difference was observed between three cutoff values with ECV higher than COPD and COCL. In previous studies, there was data that showed the MIC breakpoint of danofloxacin against Mannheimia haemolytica and Pasteurella multocida was 1 μg/mL [55], while Yang’s data showed that the epidemiologic cutoff value of danofloxacin against E. coli was 8 μg/mL [48], which was in accordance with our study. The difference of ECV between different studies may be due to the epidemiological characteristic of a different bacterial in different geography. Additionally, previous data showed that some of G. parasuis isolates exhibited decreased sensitivity to fluoroquinolones [56]. Three peaks of MIC distribution in the present data also suggested that some G. parasuis isolates may be resistant to danofloxacin. The higher MIC of the resistant isolates may contribute to the higher ECV value, and further studies may need to confirm the relationship between MIC phenotype and resistance genotype.
5. Conclusions
This study firstly established the ECV (8 μg/mL) at 95% confidence intervals, COPD in PELF (0.5 μg/mL), COPD in plasma (0.125 μg/mL) and COCL (0.25 μg/mL) of danofloxacin against G. parasuis. Based on the CLSI decision tree, the final CBP in plasma and PELF was 0.25 μg/mL and 8 μg/mL, respectively (Figure S9). The ECV value was higher than COPD and COCL, indicating that some G. parasuis isolates may be resistant to danofloxacin.
Supplementary Materials
The following are available online at https://www.mdpi.com/article/10.3390/antibiotics10070808/s1, Figure S1: Amplification of G. parasuis 16S rRNA with PCR, Figure S2: Results of ERIC-PCR for G. parasuis, Figure S3: Distribution of danofloxacin in simulated drug time curve in plasma, Figure S4: Distribution of danofloxacin in simulated drug time curve in PELF, Figure S5: PTA of danofloxacin against G. parasuis in PELF, Figure S6: PTA of danofloxacin against G. parasuis in plasma, Figure S7: Forecast growth of G. parasuis at different dosage regimens, Figure S8: CART tree showing values of clinical outcome, Figure S9: Susceptibility breakpoint decision tree, Table S1: Epidemiological MIC for danofloxacin against G. parasuis, Table S2: Concentrations of danfloxacin in plasma and PELF at various time points (n = 6).
Author Contributions
Conceptualization, Z.X., A.H., H.H. and Z.Y.; methodology, Z.X. and A.H.; software, Z.X., A.H., X.L. and K.M.; validation, Z.X., A.H., X.L. and K.M.; formal analysis, Z.X., A.H., X.L. and K.M.; investigation, Z.X., A.H., X.L., K.M., S.F., X.H. and J.L.; resources, P.Z., L.H., X.W. and H.H.; data curation, Z.X. and A.H.; writing—original draft preparation, Z.X. and A.H.; writing—review and editing, Z.X., A.H. and H.H.; visualization, Z.X., A.H. and H.H.; supervision, H.H. and Z.Y.; project administration, H.H. and Z.Y.; funding acquisition, H.H. and Z.Y. All authors have read and agreed to the published version of the manuscript.
Funding
This work was funded by grants from National key research and development program (2016YFD0501302/2017YFD0501406), National natural science foundation of China (31772791), Fundamental Research Funds for the Central Universities (2662018JC001).
Institutional Review Board Statement
The study was conducted according to the guidelines of the Declaration of Helsinki, and approved by the Animal Ethics Committee of Huazhong Agricultural University (hzauch 2014-003).
Informed Consent Statement
Informed consent was obtained from all subjects involved in the study.
Data Availability Statement
Data is contained within the article.
Acknowledgments
We appreciated all the participants for their participation and trust and thank Xiaojuan Xu and Hongyan Yu from the State Key Laboratory of Agricultural Microbiology in Huazhong Agricultural University for freely providing G. parasuis isolates and epidemic materials.
Conflicts of Interest
The authors declare no conflict of interest.
References
- Oliveira, S.; Pijoan, C. Haemophilus parasuis: New trends on diagnosis, epidemiology and control. Vet. Microbiol. 2004, 99, 1–12. [Google Scholar] [CrossRef] [PubMed]
- Kielstein, P.; Rapp-Gabrielson, V.J. Designation of 15 serovars of Haemophilus parasuis on the basis of immunodiffusion using heat-stable antigen extracts. J. Clin. Microbiol. 1992, 30, 862–865. [Google Scholar] [CrossRef]
- Cai, X.; Chen, H.; Blackall, P.J.; Yin, Z.; Lei, W.; Liu, Z.; Jin, M. Serological characterization of Haemophilus parasuis isolates from China. Vet. Microbiol. 2005, 111, 231–236. [Google Scholar] [CrossRef]
- Nedbalcova, K.; Zouharova, M.; Sperling, D. The determination of minimum inhibitory concentrations of selected antimicrobials for porcine Haemophilus parasuis isolates from the Czech Republic. Acta Vet. Brno 2017, 86, 175–181. [Google Scholar] [CrossRef]
- Drlica, K.; Zhao, X.L. DNA Gyrase, Topoisomerase IV, and the 4Quinolones. Microbiol. Mol. Biol. Rev. 1997, 61, 377–392. [Google Scholar] [PubMed]
- Manzoor, Z.; Munawar, S.H.; Iqbal, Z. Pharmacokinetics and pharmacokinetic/pharmacodynamic integration of danofloxacin in Lohi sheep. Int. J. Infect. Dis. 2020, 101, 117. [Google Scholar] [CrossRef]
- Aliabadi, F.S.; Landoni, M.F.; Lees, P. Pharmacokinetics (PK), pharmacodynamics (PD), and PK-PD integration of danofloxacin in sheep biological fluids. Antimicrob. Agents Chemother. 2003, 47, 626–635. [Google Scholar] [CrossRef] [PubMed]
- Cherif, K.T.; Peris-Vicente, J.; Carda-Broch, S.; Esteve-Romero, J. Analysis of danofloxacin, difloxacin, ciprofloxacin and sarafloxacin in honey using micellar liquid chromatography and validation according to the 2002/657/EC decision. Anal. Methods 2015, 7, 6165–6172. [Google Scholar] [CrossRef]
- Fernandez-Varon, E.; Marin, P.; Escudero, E.; Vancraeynest, D.; Cárceles, C.M. Pharmacokinetic-pharmacodynamic integration of danofloxacin after intravenous, intramuscular and subcutaneous administration to rabbits. J. Vet. Pharmacol. Ther. 2007, 30, 18–24. [Google Scholar] [CrossRef]
- Haritova, A.M.; Rusenova, N.V.; Parvanov, P.R.; Lashev, L.D.; Fink-Gremmels, J. Pharmacokinetic-pharmacodynamic modelling of danofloxacin in turkeys. Vet. Res. Commun. 2006, 30, 775–789. [Google Scholar] [CrossRef]
- Mann, D.D.; Frame, G.M. Pharmacokinetic study of danofloxacin in cattle and swine. Am. J. Vet. Res. 1992, 53, 1022–1026. [Google Scholar]
- Toutain, P.L.; Bousquet-Mélou, A.; Damborg, P.; Ferran, A.A.; Mevius, D.; Pelligand, L.; Veldman, K.T.; Lees, P. En Route towards European Clinical Breakpoints for Veterinary Antimicrobial Susceptibility Testing: A Position Paper Explaining the VetCAST Approach. Front. Microbiol. 2017, 8, 2344. [Google Scholar] [CrossRef] [PubMed]
- Turnidge, J.; Kahlmeter, G.; Kronvall, G. Statistical characterisation of bacterial wild-type MIC value distributions and the determination of epidemiological cut-off values. Clin. Microbiol. Infect. 2006, 12, 418–425. [Google Scholar] [CrossRef]
- Kronvall, G. Normalized Resistance Interpretation as a Tool for Establishing Epidemiological MIC Susceptibility Breakpoints. J. Clin. Microbiol. 2010, 48, 4445–4452. [Google Scholar] [CrossRef]
- Canton, E.; Peman, J.; Hervas, D.; Iniguez, C.; Navarro, D.; Echeverria, J.; Martinez-Alarcon, J.; Fontanals, D.; Gomila-Sard, B.; Buendia, B. Comparison of Three Statistical Methods for Establishing Tentative Wild-Type Population and Epidemiological Cutoff Values for Echinocandins, Amphotericin B, Flucytosine, and Six Candida Species as Determined by the Colorimetric Sensititre YeastOne Method. J. Clin. Microbiol. 2012, 50, 3921–3926. [Google Scholar] [CrossRef] [PubMed]
- Rey, J.E.; Laffont, C.M.; Croubels, S.; Backer, P.D.; Zemirline, C.; Bousquet, E.; Guyonnet, J.; Ferran, A.A.; Bousquet-Melou, A.; Toutain, P.L. Use of Monte Carlo simulation to determine pharmacodynamic cutoffs of amoxicillin to establish a breakpoint for antimicrobial susceptibility testing in pigs. Am. J. Vet. Res. 2014, 75, 124–131. [Google Scholar] [CrossRef]
- Turnidge, J.D.; Martinez, M.N. Proposed method for estimating clinical cut-off (COCL) values: An attempt to address challenges encountered when setting clinical breakpoints for veterinary antimicrobial agents. Vet. J. 2017, 228, 33–37. [Google Scholar] [CrossRef] [PubMed]
- Oliveira, S.; Galina, L.; Pijoan, C. Development of a PCR test to diagnose Haemophilus parasuis infections. J. Vet. Diagn Investig. 2001, 13, 495–501. [Google Scholar] [CrossRef]
- Ferraro, M.J. Methods for Dilution Antimicrobial Susceptibility Tests for Bacteria That Grow Aerobically; Clinical and Laboratory Standards Institute: Annapolis Junction, MD, USA, 2000; pp. 24–25. [Google Scholar]
- Espinel-Ingroff, A.; Turnidge, J.; Alastruey-Izquierdo, A.; Dannaoui, E.; Tortorano, A.M. Posaconazole MIC distributions for Aspergillus fumigatus SC by four methods: Impact of Cyp51A mutations on estimation of epidemiological cutoff values (ECVs/ECOFFs). Antimicrob. Agents Chemother. 2018, 62, e01916-17. [Google Scholar] [CrossRef]
- Rafiee, M.; Bara, M.; Stephens, C.P.; Blackall, P.J. Application of ERIC-PCR for the comparison of isolates of Haemophilus parasuis. Aust. Vet. J. 2000, 78, 846–849. [Google Scholar] [CrossRef]
- Versalovic, J.; Koeuth, T.; Lupski, J.R. Distribution of repetitive DNA sequences in eubacteria and application to fingerprinting of bacterial genomes. Nucleic Acids Res. 1991, 19, 6823–6831. [Google Scholar] [CrossRef] [PubMed]
- Yu, J.; Zhang, Y.Y.; Du, Y.J.; Li, J.; Huang, B.H.; Sun, W.B.; Cong, X.Y.; Peng, J.; Ren, S.F.; Gou, L.H.; et al. The BALB/c mouse infection model for improving the Haemophilus parasuis serotyping scheme. Res. Vet. Sci. 2016, 109, 166–168. [Google Scholar] [CrossRef] [PubMed]
- Zhang, L.H.; Li, Y.; Dai, K.; Wen, X.T.; Wu, R.; Huang, X.B.; Jin, J.; Xu, K.; Yan, Q.G.; Huang, Y.; et al. Establishment of a Successive Markerless Mutation System in Haemophilus parasuis through Natural Transformation. PLoS ONE 2015, 10, e0127393. [Google Scholar] [CrossRef]
- Giguere, S.; Huang, R.; Malinski, T.J.; Dorr, P.M.; Tessman, R.K.; Somerville, B.A. Disposition of gamithromycin in plasma, pulmonary epithelial lining fluid, bronchoalveolar cells, and lung tissue in cattle. Am. J. Vet. Res. 2011, 72, 326–330. [Google Scholar] [CrossRef]
- Kiem, S.; Schentag, J.J. Interpretation of antibiotic concentration ratios measured in epithelial lining fluid. Antimicrob. Agents Chemother. 2008, 52, 24–36. [Google Scholar] [CrossRef]
- Conte, J.E., Jr.; Golden, J.A.; McQuitty, M.; Kipps, J.; Lin, E.T.; Zurlinden, E. Effects of AIDS and gender on steady-state plasma and intrapulmonary ethionamide concentrations. Antimicrob. Agents Chemother. 2000, 44, 1337–1341. [Google Scholar] [CrossRef][Green Version]
- Mouton, J.W. Breakpoints: Current practice and future perspectives. Int. J. Antimicrob. Agents 2002, 19, 323–331. [Google Scholar] [CrossRef]
- Xiao, X.; Sun, J.; Chen, Y.; Huang, R.J.; Huang, T.; Qiao, G.G.; Zhou, Y.F.; Liu, Y.H. In Vitro dynamic pharmacokinetic/pharmacodynamic (PK/PD) modeling and PK/PD cutoff of cefquinome against Haemophilus parasuis. BMC Vet. Res. 2015, 11, 33. [Google Scholar] [CrossRef]
- Potter, T.; Illambas, J.; Pelligand, L.; Rycroft, A.; Lees, P. Pharmacokinetic and pharmacodynamic integration and modelling of marbofloxacin in calves for Mannheimia haemolytica and Pasteurella multocida. Vet. J. 2013, 195, 53–58. [Google Scholar] [CrossRef] [PubMed]
- Sidhu, P.; Rassouli, A.; Illambas, J.; Potter, T.; Pelligand, L.; Rycroft, A.; Lees, P. Pharmacokinetic-pharmacodynamic integration and modelling of florfenicol in calves. J. Vet. Pharm. 2014, 37, 231–242. [Google Scholar] [CrossRef]
- Toutain, P.L.; Del Castillo, J.R.E.; Bousquet-Melou, A. The pharmacokinetic-pharmacodynamic approach to a rational dosage regimen for antibiotics. Res. Vet. Sci. 2002, 73, 105–114. [Google Scholar] [CrossRef]
- Aarestrup, F.M.; Seyfarth, A.M.; Angen, O. Antimicrobial susceptibility of Haemophilus parasuis and Histophilus somni from pigs and cattle in Denmark. Vet. Microbiol. 2004, 101, 143–146. [Google Scholar] [CrossRef]
- De la Fuente, A.J.; Tucker, A.W.; Navas, J.; Blanco, M.; Morris, S.J.; Gutierrez-Martin, C.B. Antimicrobial susceptibility patterns of Haemophilus parasuis from pigs in the United Kingdom and Spain. Vet. Microbiol. 2007, 120, 184–191. [Google Scholar] [CrossRef]
- Zhou, X.; Xu, X.J.; Zhao, Y.X.; Chen, P.; Zhang, X.; Chen, H.C.; Cai, X.W. Distribution of antimicrobial resistance among different serovars of Haemophilus parasuis isolates. Vet. Microbiol. 2010, 141, 168–173. [Google Scholar] [CrossRef]
- Xu, C.; Zhang, J.M.; Zhao, Z.Q.; Guo, L.L.; Zhang, B.; Feng, S.X.; Zhang, L.Y.; Liao, M. Antimicrobial susceptibility and PFGE genotyping of Haemophilus parasuis isolates from pigs in South China (2008–2010). J. Vet. Med. Sci. 2011, 73, 1061–1065. [Google Scholar] [CrossRef] [PubMed]
- Wang, Z.H.; Zhao, Q.; Wei, H.L.; Wen, X.T.; Cao, S.J.; Huang, X.B.; Wu, R.; Yan, Q.G.; Huang, Y.; Wen, Y.P. Prevalence and seroepidemiology of Haemophilus parasuis in Sichuan province. China PeerJ 2017, 5, e3379. [Google Scholar] [CrossRef] [PubMed]
- Sun, J.; Xiao, X.; Huang, R.J.; Yang, T.; Chen, Y.; Fang, X.; Huang, T.; Zhou, Y.F.; Liu, Y.H. In vitro Dynamic Pharmacokinetic/Pharmacodynamic (PK/PD) study and COPD of Marbofloxacin against Haemophilus parasuis. BMC Vet. Res. 2015, 11, 293. [Google Scholar] [CrossRef] [PubMed]
- Zhang, P.; Hao, H.H.; Li, J.; Ahmad, I.; Cheng, G.Y.; Chen, D.M.; Tao, Y.F.; Huang, L.L.; Wang, Y.L.; Dai, M.H. The Epidemiologic and Pharmacodynamic Cutoff Values of Tilmicosin against Haemophilus parasuis. Front. Microbiol. 2016, 7, 385. [Google Scholar] [CrossRef] [PubMed]
- Lauritzen, B.; Lykkesfeldt, J.; Friis, C. Evaluation of a single dose versus a divided dose regimen of danofloxacin in treatment of Actinobacillus pleuropneumoniae infection in pigs. Res. Vet. Sci. 2003, 74, 271–277. [Google Scholar] [CrossRef]
- Zeng, Z.; Deng, G.; Shen, X.; Rizwan-ul-Haq, M.; Zeng, D.; Ding, H. Plasma and tissue pharmacokinetics of danofloxacin in healthy and in experimentally infected chickens with Pasteurella multocida. J. Vet. Pharm. 2011, 34, 101–104. [Google Scholar] [CrossRef]
- Fajt, V.R.; Apley, M.D.; Brogden, K.A.; Skogerboe, T.L.; Shostrom, V.K.; Chin, Y.L. Effect of danofloxacin and tilmicosin on body temperatures of beef calves with pneumonia experimentally induced by inoculation with Mannheimia haemolytica. Am. J. Vet. Res. 2004, 65, 610–615. [Google Scholar] [CrossRef] [PubMed]
- Kronvall, G.; Karlsson, I.; Walder, M.; Sorberg, M.; Nilsson, L.E. Epidemiological MIC cut-off values for tigecycline calculated from Etest MIC values using normalized resistance interpretation. J. Antimicrob. Chemother. 2006, 57, 498–505. [Google Scholar] [CrossRef] [PubMed]
- Ismail, N.A.; Omar, S.V.; Joseph, L.; Govender, N.; Blows, L.; Ismail, F.; Koornhof, H.; Dreyer, A.W.; Kaniga, K.; Ndjeka, N. Defining Bedaquiline Susceptibility, Resistance, Cross-Resistance and Associated Genetic Determinants: A Retrospective Cohort Study. EBioMedicine 2018, 28, 136–142. [Google Scholar] [CrossRef]
- Van Vliet, D.; Loch, T.P.; Smith, P.; Faisal, M. Antimicrobial Susceptibilities of Flavobacterium psychrophilum Isolates from the Great Lakes Basin, Michigan. Microb. Drug Resist. 2017, 23, 791–798. [Google Scholar] [CrossRef] [PubMed]
- Zhang, Q.; Zhou, M.G.; Song, D.S.; Zhao, J.P.; Zhang, A.D.; Jin, M.L. Molecular characterisation of resistance to fluoroquinolones in Haemophilus parasuis isolated from China. Int. J. Antimicrob. Agents 2013, 42, 87–89. [Google Scholar] [CrossRef]
- Barbour, A.; Scaglione, F.; Derendorf, H. Class-dependent relevance of tissue distribution in the interpretation of anti-infective pharmacokinetic/pharmacodynamic indices. Int. J. Antimicrob. Agents 2010, 35, 431–438. [Google Scholar] [CrossRef]
- Yang, Y.; Zhang, Y.X.; Li, J.R.; Cheng, P.; Xiao, T.S.; Muhammad, I.; Yu, H.X.; Liu, R.M.; Zhang, X.Y. Susceptibility breakpoint for Danofloxacin against swine Escherichia coli. BMC Vet. Res. 2019, 15, 51. [Google Scholar] [CrossRef]
- Rowan, T.G.; Sarasola, P.; Sunderland, S.J.; Giles, C.J.; Smith, D.G. Efficacy of danofloxacin in the treatment of respiratory disease in European cattle. Vet. Rec. 2004, 154, 585–589. [Google Scholar] [CrossRef]
- Toutain, P.L. Setting clinical breakpoint Methodological aspects. European Committee on Antimicrobial Susceptibility Testing. France. 2015. Available online: https://eucast.org/ast_of_veterinary_pathogens/ (accessed on 30 April 2021).
- Esterly, J.S.; Wagner, J.; McLaughlin, M.M.; Postelnick, M.J.; Qi, C.; Scheetz, M.H. Evaluation of Clinical Outcomes in Patients with Bloodstream Infections Due to Gram-Negative Bacteria According to Carbapenem MIC Stratification. Antimicrob. Agents Chemother. 2012, 56, 4885–4890. [Google Scholar] [CrossRef]
- Zheng, X.; Zheng, R.R.; Hu, Y.; Werngren, J.; Forsman, L.D.; Mansjo, M.; Xu, B.; Hoffner, S. Determination of MIC Breakpoints for Second-Line Drugs Associated with Clinical Outcomes in Multidrug-Resistant Tuberculosis Treatment in China. Antimicrob. Agents Chemother. 2016, 60, 4786–4792. [Google Scholar] [CrossRef]
- Bhat, S.V.; Peleg, A.Y.; Lodise, T.P.; Shutt, K.A.; Capitano, B.; Potoski, B.A.; Paterson, D.L. Failure of current cefepime breakpoints to predict clinical outcomes of bacteremia caused by gram-negative organisms. Antimicrob. Agents Chemother. 2007, 51, 4390–4395. [Google Scholar] [CrossRef] [PubMed]
- Cuesta, I.; Bielza, C.; Cuenca-Estrella, M.; Larranaga, P.; Rodriguez-Tudela, J.L. Evaluation by data mining techniques of fluconazole breakpoints established by the Clinical and Laboratory Standards Institute (CLSI) and comparison with those of the European Committee on Antimicrobial Susceptibility Testing (EUCAST). Antimicrob. Agents Chemother. 2010, 54, 1541–1546. [Google Scholar] [CrossRef] [PubMed]
- Sweeney, M.T.; Papich, M.G.; Watts, J.L. New interpretive criteria for danofloxacin antibacterial susceptibility testing against Mannheimia haemolytica and Pasteurella multocida associated with bovine respiratory disease. J. Vet. Diagn Investig. 2017, 29, 224–227. [Google Scholar] [CrossRef] [PubMed]
- Guo, L.; Zhang, J.M.; Xu, C.G.; Zhao, Y.D.; Ren, T.; Zhang, B.; Fan, H.Y.; Liao, M. Molecular characterization of fluoroquinolone resistance in Haemophilus parasuis isolated from pigs in South China. J. Antimicrob. Chemother. 2011, 66, 539–542. [Google Scholar] [CrossRef][Green Version]
Publisher’s Note: MDPI stays neutral with regard to jurisdictional claims in published maps and institutional affiliations. |
© 2021 by the authors. Licensee MDPI, Basel, Switzerland. This article is an open access article distributed under the terms and conditions of the Creative Commons Attribution (CC BY) license (https://creativecommons.org/licenses/by/4.0/).