Article

Dynamic Adaptive Response of Pseudomonas aeruginosa to Clindamycin/Rifampicin-Impregnated Catheters

1
National Center for Toxicological Research, Division of Microbiology, US FDA, Jefferson, AR 72079, USA
2
Office of Scientific Coordination, National Center for Toxicological Research, US FDA, Jefferson, AR 72079, USA
3
NCTR-ORA Nanotechnology Core Facility, US FDA, Jefferson, AR 72079, USA
4
Division of Biology, Chemistry, and Materials Science, Center for Devices and Radiological Health, US FDA, Silver Spring, MD 20993, USA
*
Author to whom correspondence should be addressed.
Antibiotics 2021, 10(7), 752; https://doi.org/10.3390/antibiotics10070752
Submission received: 26 May 2021 / Revised: 17 June 2021 / Accepted: 18 June 2021 / Published: 22 June 2021
(This article belongs to the Special Issue Efficacy of Combinations of Different Antibiotics)

Abstract

:
Pseudomonas aeruginosa is the most common Gram-negative pathogen causing nosocomial multidrug resistant infections. It is a good biofilm producer and has the potential for contaminating medical devices. Despite the widespread use of antibacterial-impregnated catheters, little is known about the impacts of antibacterial coating on the pathogenesis of P. aeruginosa. In this study, we investigated the adaptive resistance potential of P. aeruginosa strain PAO1 in response to continuous antibiotic exposure from clindamycin/rifampicin-impregnated catheters (CR-IC). During exposure for 144 h to clindamycin and rifampicin released from CR-IC, strain PAO1 formed biofilms featuring elongated and swollen cells. There were 545 and 372 differentially expressed proteins (DEPs) identified in the planktonic and biofilm cells, respectively, by ultra-high performance liquid chromatography-tandem mass spectrometry (UHPLC-MS/MS). Both Cluster of Orthologous Groups (COG) and Kyoto Encyclopedia of Genes and Genomes (KEGG) analyses showed that the planktonic cells responded to the released antibiotics more actively than the biofilm cells, with metabolism and ribosomal biosynthesis-associated proteins being significantly over-expressed. Exposure to CR-IC increased the invasion capability of P. aeruginosa for Hela cells and upregulated the expression of certain groups of virulence proteins in both planktonic and biofilm cells, including the outer membrane associated (flagella, type IV pili and type III secretion system) and extracellular (pyoverdine) virulence proteins. Continuous exposure of P. aeruginosa to CR-IC also induced the overexpression of antibiotic resistance proteins, including porins, efflux pumps, translation and transcription proteins. However, these upregulations did not change phenotypic minimum inhibitory concentration (MIC) during the experimental timeframe. The concerning association between CR-IC and overexpression of virulence factors in P. aeruginosa suggests the need for additional investigation to determine if it results in adverse clinical outcomes.

1. Introduction

More than 30 million urinary tract catheters and five million central venous catheters are annually used in the US [1]. Although medical devices are widely used for therapeutic treatments, infections associated with the presence of a device result in significant morbidity and mortality for patients [2]. Nosocomial bacteria can contaminate the surgical site surrounding implants and adhere to their surface to form biofilm, resulting in the evasion of the host immune response and strong resistance to many antimicrobials [3]. If antibacterial therapy is discontinued, persister cells can detach from the biofilm and cause recurrent infections [4]. Host factors and material surface characteristics influence biofilm formation [5,6]. Biofilm can also prevent devices from functioning properly [2]. Biofilms formed on intravascular catheters or central lines are recognized to be the most common cause of hospital acquired bloodstream infections [7].
Pseudomonas aeruginosa is responsible for more than two million nosocomial infections, especially in immunocompromised patients, and about 90,000 deaths each year [8]. P. aeruginosa biofilm is found in the lungs of cystic fibrosis patients, surgical sites, chronic wounds, mechanical heart valves, central venous catheters and Foley catheters [9]. P. aeruginosa is capable of building biofilm not only on biotic or abiotic surfaces but also on air–liquid interfaces [10]. Antibiotic treatment for P. aeruginosa infections is a matter of concern because it is not susceptible to many antibiotics [11]. The imprudent or excessive use of antibiotics exacerbates the emergence of multidrug resistant P. aeruginosa [12].
Intrinsic and acquired resistances of P. aeruginosa are stable and result from irreversible genetic changes [13]. By contrast, adaptive antibacterial resistance is temporary and result in gene or protein expression changes due to exposures to sub-lethal doses of antibiotics [14,15]. P. aeruginosa treated with sub-inhibitory concentrations of antibacterial agents for extended time periods resulted in alterations of gene expression profiles, which allowed the microorganisms to survive following exposure to normally efficacious doses of antibiotics [14]. The induction of adaptive resistance through prolonged courses with antibiotics reduced antibiotic effectiveness, resulting in the failure of antibacterial therapy [14].
In order to control biofilm colonization, the internal and external surfaces of venous catheters may be coated with antibiotics [16,17,18]. Two commercially available catheters impregnated with combinations of clindamycin/rifampicin and minocycline/rifampicin have been approved by the US Food and Drug Administration (FDA) [16,17]. It has been reported that clindamycin/rifampicin-coated and minocycline/rifampicin-coated catheters had no effect on the growth of P. aeruginosa [16,17,18]. These results have increased concern over the possible contamination of P. aeruginosa and the development of microbial resistance to the antibiotics-impregnated in the catheters. Therefore, it is important to understand how P. aeruginosa may overcome these antibiotic-impregnated catheters and whether the presence of the antimicrobial in devices can enable antibacterial resistance.
To the best of our knowledge, no studies have been conducted to investigate the potential of adaptive resistance and cross-resistance to antibiotics after exposure of P. aeruginosa to the antibiotic-coated catheters. In this study, we investigated the response of P. aeruginosa PAO1 to the antibiotics eluted from clindamycin/rifampicin-impregnated catheters (CR-IC) by using genetic, minimum inhibitory concentration (MIC) and proteomic analyses to evaluate the potential development of adaptive-resistance and cross-resistance.

2. Materials and Methods

2.1. In Vitro Continuous Culture

Overnight-grown P. aeruginosa strain PAO1, Staphylococcus aureus strains ATCC 25923 and ATCC BAA-1717 were inoculated into fresh tryptic soy broth (TSB) (Thermo Fisher Scientific, Waltham, MA, USA) and grown at 37 °C for 7 h. The bacterial culture was centrifuged (Eppendorf, Framingham, MA, USA) at 10,000 rpm at 4 °C for 10 min and washed three times with phosphate-buffered saline (PBS) (Thermo Fisher Scientific). The bacterial cell density was adjusted to 1.3 × 10⁷ CFU/mL and inoculated into a CDC biofilm bioreactor (BioSurface Technologies, Bozeman, MT, USA) containing clindamycin/rifampicin-impregnated catheters (CR-IC, Integra LifeSciences, Plainsboro, NJ, USA) or control catheters (without antibiotic impregnation). The culture was stirred at 150 rpm at 37 °C for 144 h and the fresh medium continuously flowed through the reactor at 15 mL/min.
Following the completion of the continuous culture, cells were taken for proteomic and phenotypic analyses. For the bacterial count, 10 mm catheter segments were washed with PBS three times, sonicated for 5 min at 40 kHz and vigorously vortexed for 5 min before and after sonication. Then, the bacterial suspension was serially diluted and plated in triplicate onto tryptic soy agar (TSA) plates and the number of CFU was counted. The bacterial contamination was verified by colony morphology, VITEK 2 GN I card (bioMerieux, Durham, NC, USA) and MALDI Biotyper CA System (Bruker Daltonics, Billerica, MA, USA).

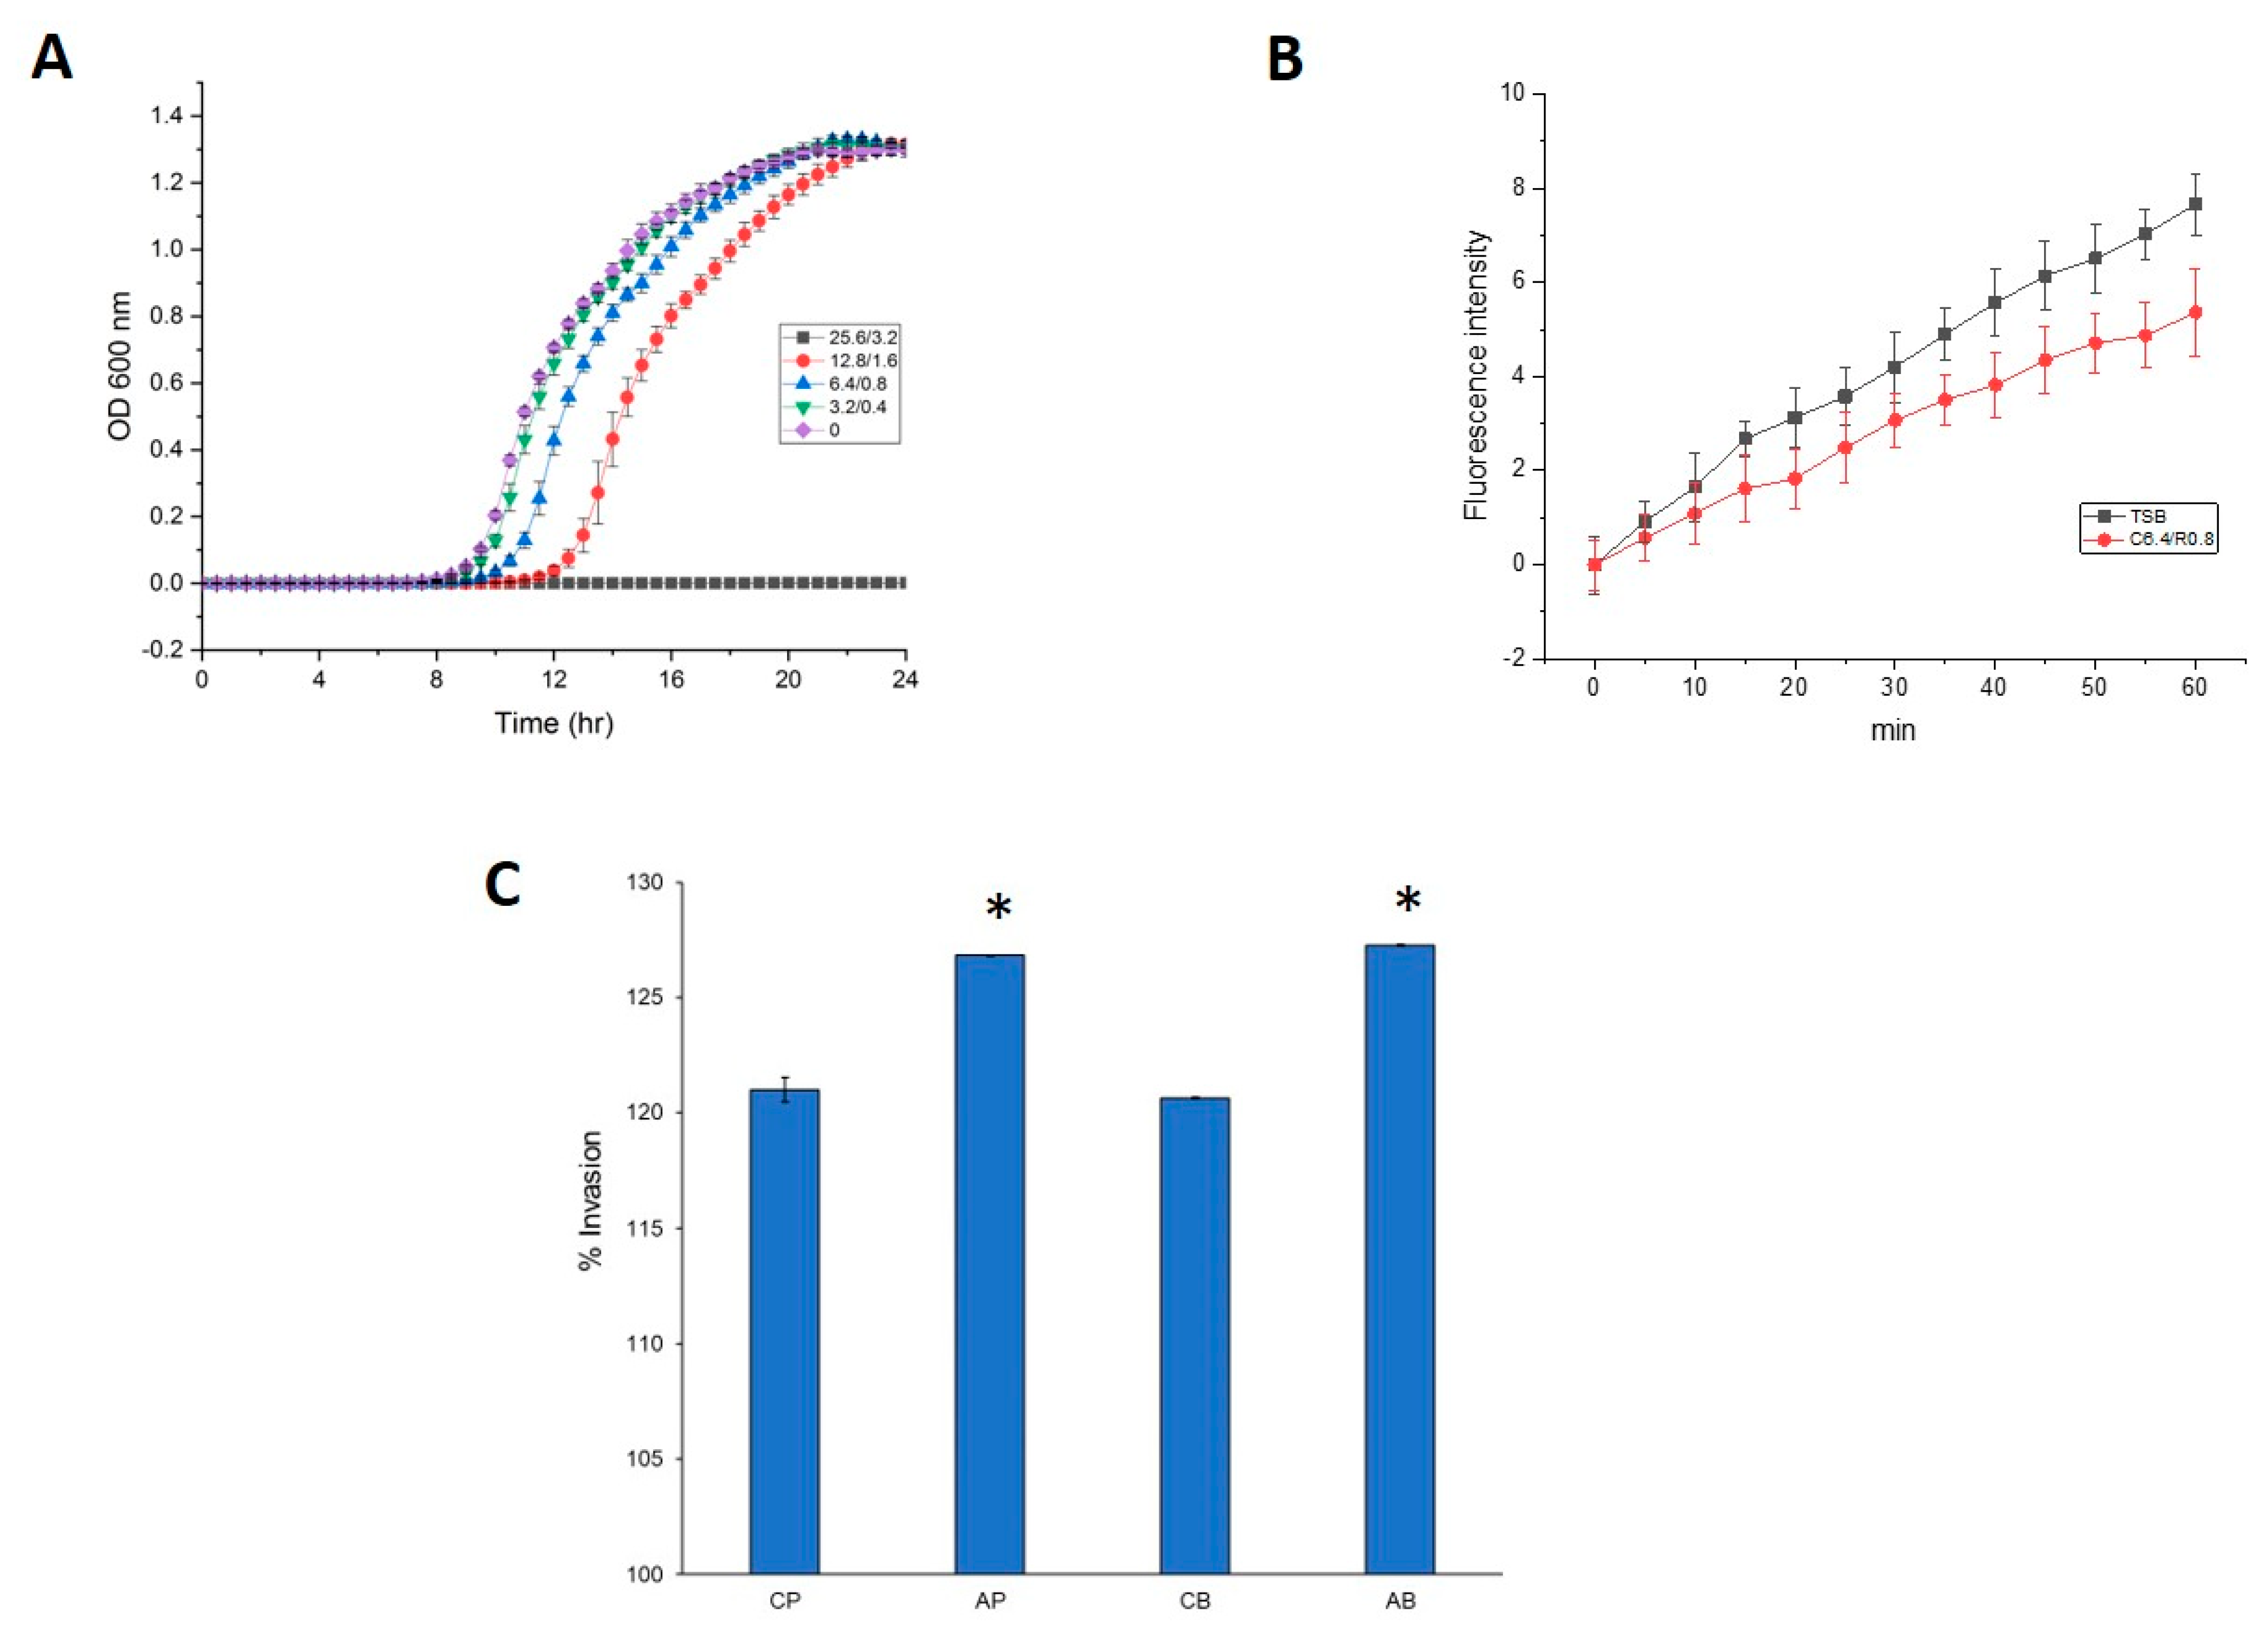
2.2. Measurement of Growth Curves

Strain PAO1 culture was suspended in PBS after overnight growth and adjusted to an optical density at 600 nm of 0.1. This suspension was diluted 1:100 in TSB (control) or TSB containing various mixtures of clindamycin and rifampicin (3.2 and 0.4, 6.4 and 0.8, 12.8 and 1.6 and 25.6 and 3.2 µg/mL, respectively) in a 96-well plate. The 96-well plate was incubated in a Synergy 2 Multi-Mode Microplate Reader (BIOTEK Instruments, Winooski, VT, USA) at 37 °C and then shaken continuously. Bacterial growth was monitored by reading an absorbance of 600 nm every 30 min for 24 h. All experiments were performed in triplicate.

2.3. Antimicrobial Susceptibility Testing

At the end of the continuous culture in the CDC biofilm bioreactor, P. aeruginosa strain PAO1 was harvested and inoculated on Mueller-Hinton agar (MHA, Hardy Diagnostics, Santa Maria, CA, USA) plates. After 24 h incubation at 37 °C, the colonies were suspended in 0.45% sterile sodium chloride solution and the turbidity was adjusted to a McFarland 0.5 standard by using the Densichek system (bioMérieux). VITEK 2 AST-GN69 and AST-XN06 antimicrobial susceptibility cards (bioMérieux) were placed in the VITEK 2 instrument and read by fluorescence measurement. Antimicrobial susceptibility of clindamycin and rifampicin was measured by the broth dilution method described by Shakir et al. [19].

2.4. Detection of Mutations

The target genes, such as ampC (positions and amplicon sizes: 921,961–921,147, 815 bp and 920,537–921,331, 795 bp), gyrB (position and amplicon size: 5321–5831, 511 bp), oprD (positions and amplicon sizes: 4,469,794–4,470,534, 741 bp and 4,470,514–4,471,184, 671 bp) and rpoB (position and amplicon size: 736,499–737,288, 790 bp), associated with avibactam, ceftazidime, ceftolozane, fluoroquinolones, imipenem, meropenem, rifampicin and tazobactam resistance were amplified by PCR and purified by the QIAquick PCR purification kit (Qiagen, Germantown, MD, USA). Both strands of the purified PCR amplicons were sequenced and the mutations were analyzed using EditSeq, MegAlign and SeqMan programs from the DNASTAR Lasergene 12 package (DNASTAR, Madison, WI, USA). Mutations of the protein sequences were compared to strain PAO1 reference protein sequences by BLASTx (http://blast.ncbi.nlm.nih.gov/Blast.cgi).

2.5. Determination of Efflux Pump Activity

Accumulation of ethidium bromide was assayed as described previously [20]. Strain PAO1 was grown in TSB overnight and washed with 50 mM sodium phosphate buffer (pH 7.0). In order to measure the presence of active efflux, ethidium bromide (10 µg/mL) was added to control (TSB only) and antibiotic-containing wells (6.4 µg/mL clindamycin and 0.8 µg/mL rifampicin) and fluorescence was read every 5 min at excitation 500 nm and emission 590 nm for 60 min in a fluorescence microplate reader using SoftMax Pro software (Molecular Devices, San Jose, CA, USA). All experiments were performed in triplicate. Error bars indicate standard deviation from the mean.

2.6. Invasion Assay

HeLa cells (ATCC CCL-2) were grown to approximately 5 × 10⁵ cells in a 24-well plate at 37 °C with 5% CO2. Strain PAO1 harvested from the continuous culture was inoculated into TSB and grown to mid-logarithmic phase. After centrifugation and washing, strain PAO1 was added to a monolayer of epithelial cells at a multiplicity of infection (MOI) of 100:1. Bacterial numbers spiked to HeLa cells were confirmed by a plate count method. The human cells were incubated for 2 h and washed with PBS. Thereafter, 300 μg/mL of gentamicin (Sigma-Aldrich, St. Louis, MO, USA) was added to the growth medium and incubated for another 2 h. Triton X-100 (0.25%, Sigma-Aldrich) was employed to lyse the monolayers and the released intracellular bacteria were counted. The invasion percentage was calculated by dividing the number of invading cells of strain PAO1 by the initial number of inoculated bacteria. The assays were performed in quadruplicate and data were represented as mean ± standard deviation.

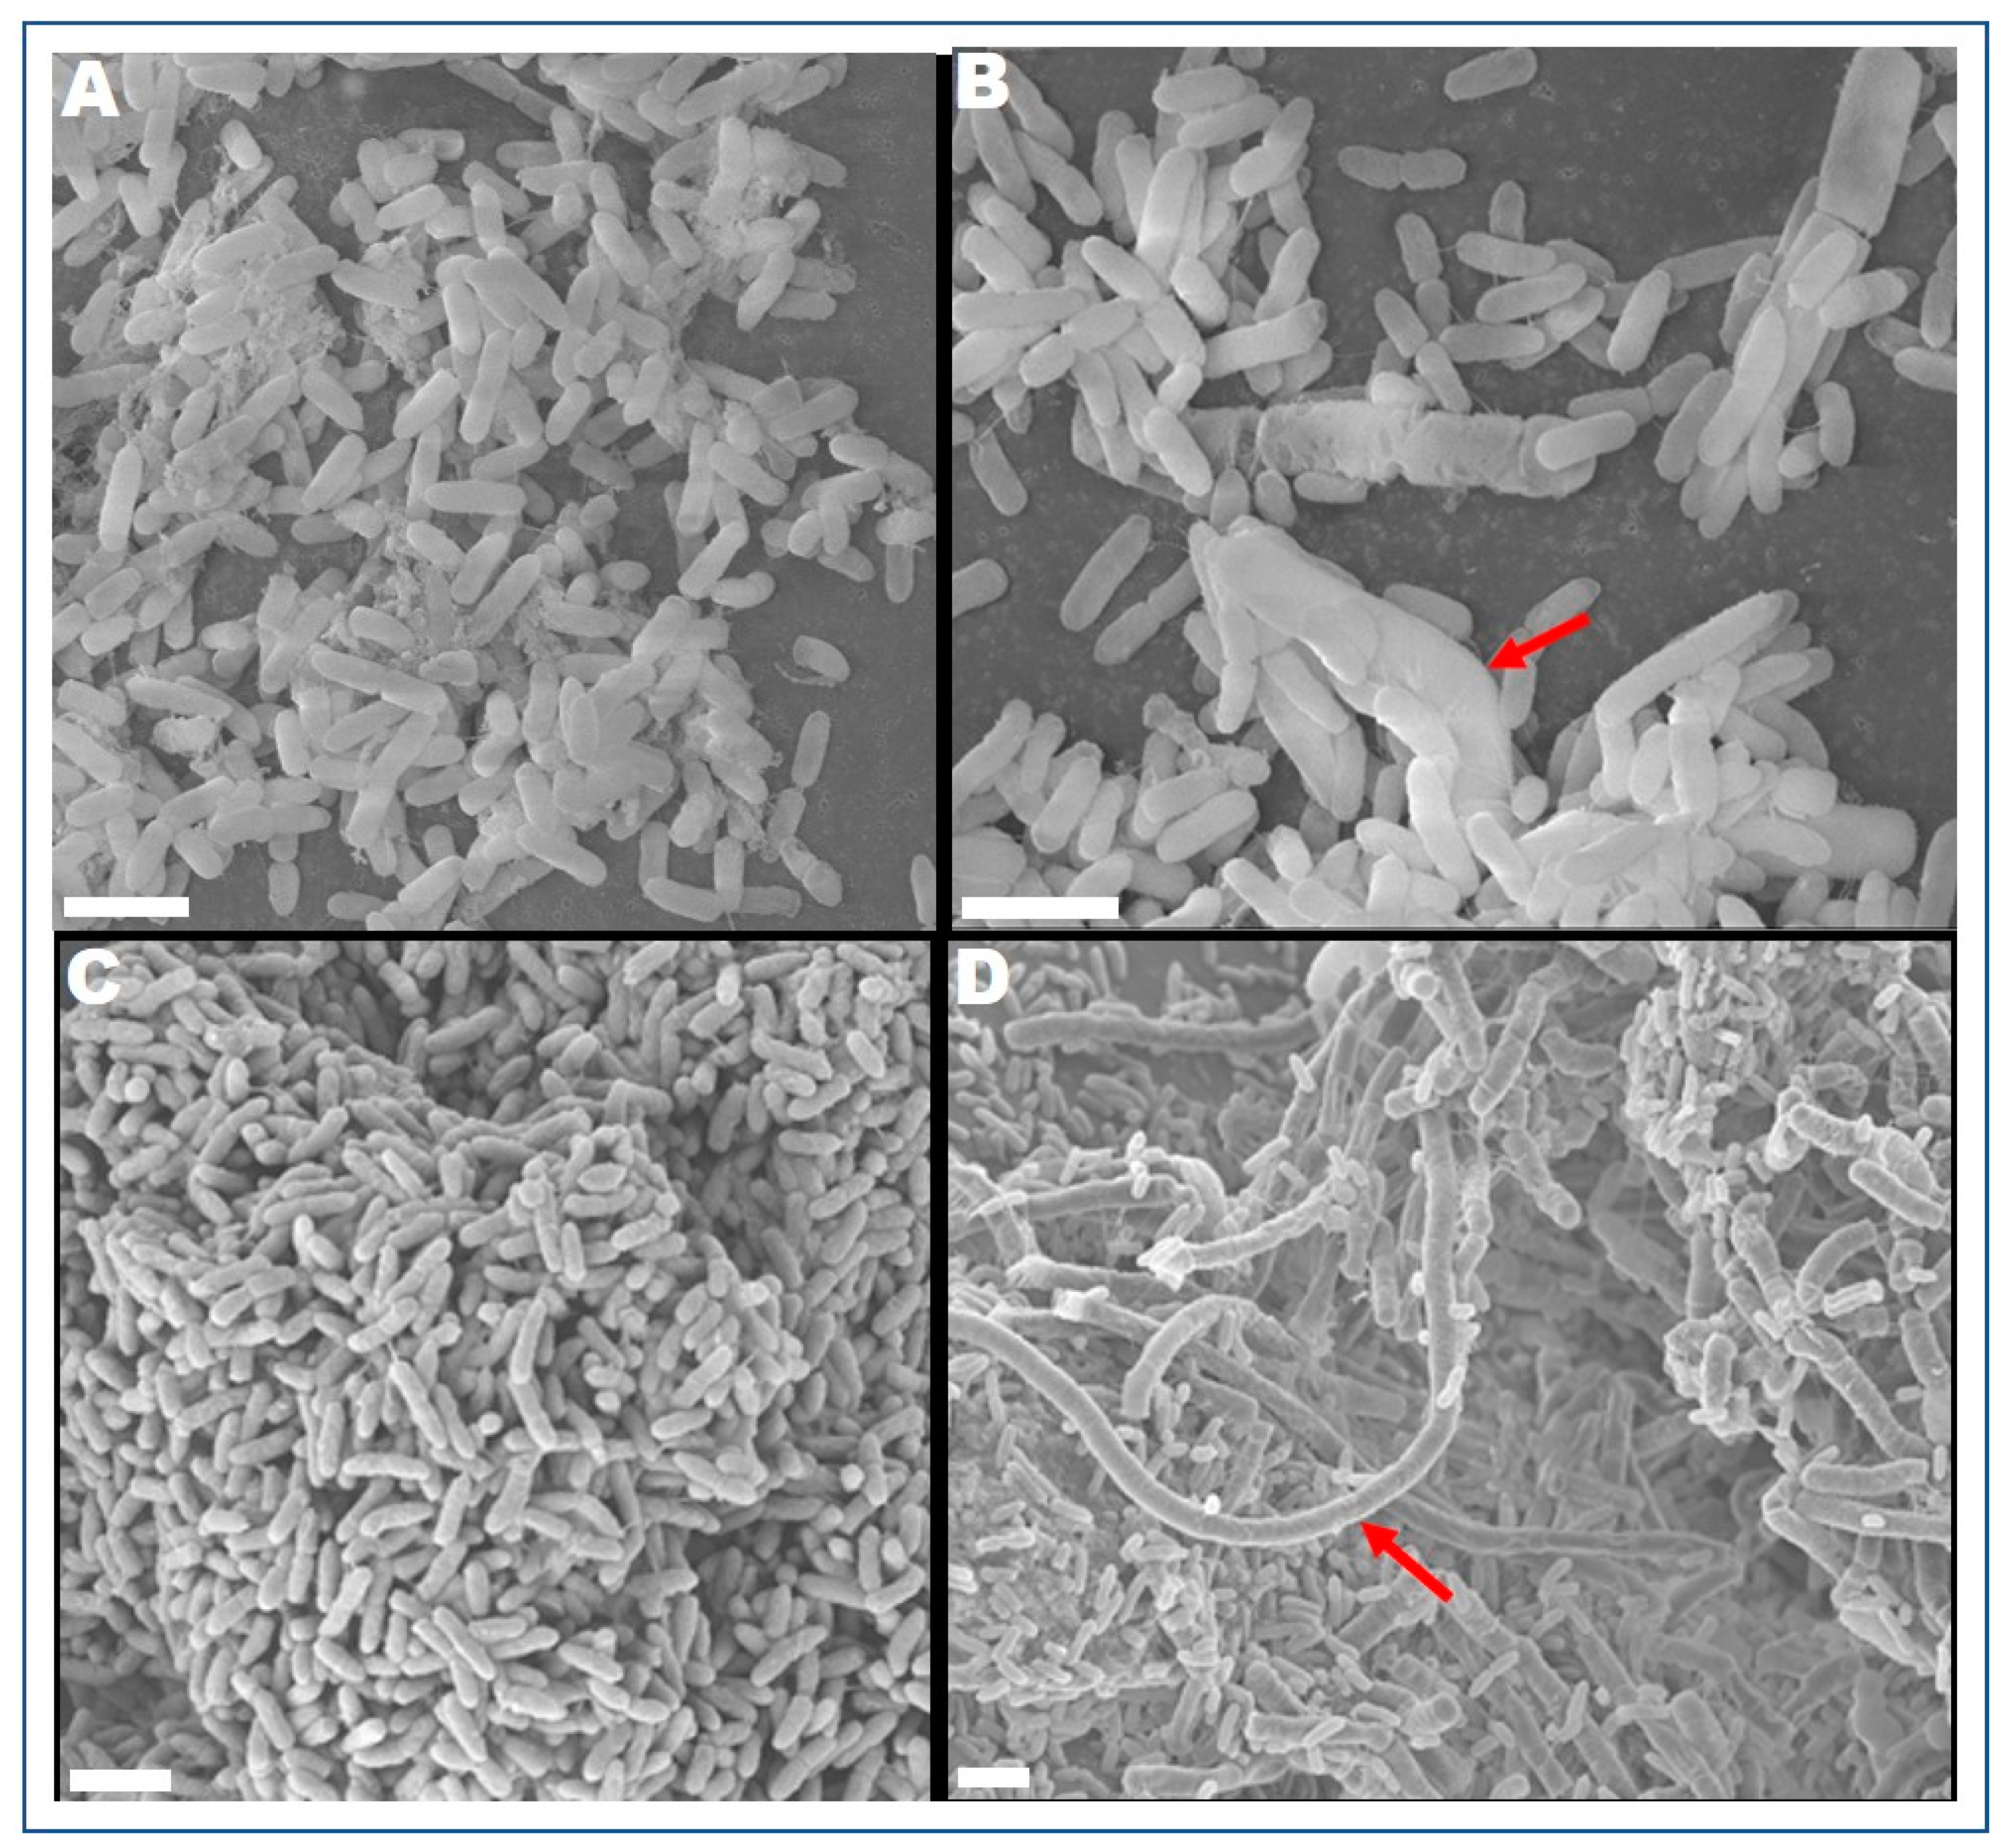
2.7. Field Emission Scanning Electron Microscope (FESEM)

Harvested planktonic and biofilm cells were rinsed three times with PBS for 10 min and dehydrated using 15%, 50%, 90% and 95% ethanol for 10 min and 100% ethanol for 30 min. The cells were dried in an Autosamdri-815 Series A automatic critical point drier (Tousimis Research Corporation, Rockville, MD, USA) and sputter-coated using gold (Denton Vacuum, Moorestown, NJ, USA). FESEM images were obtained by a Zeiss-Merlin FESEM (Carl Zeiss Microscopy, Thornwood, NY, USA).

2.8. Protein Extraction and Liquid Chromatography-Tandem Mass Spectrometry

Planktonic and biofilm cells were harvested after in vitro continuous culture. Cells were placed in Lysing Matrix B tubes (MP Biomedicals, Santa Ana, CA, USA) containing 100 µL of BugBuster Plus Lysonase kit (Millipore Sigma, Burlington, MA, USA). Using an FP120 reciprocator (MP Biomedicals), cells were broken down by bead beating and boiling. The concentration of extracted protein was quantified by a Micro BCA Protein Assay Kit (Thermo Fisher Scientific). Reconstitution of the protein sample was performed in 5% SDS, 50 mM Tris-HCl (pH 8.0), 5 mM Tris (2-carboxyethyl) phosphine and 20 mM 2-chloroacetamide. Then, the sample was digested by the single-pot solid-phase-enhanced sample preparation method and analyzed by ultra-high performance liquid chromatography-tandem mass spectrometry (UHPLC-MS/MS) (Thermo Fisher Scientific) [21]. LC was carried out on an EASY-nLC 1200 (Thermo Fisher Scientific) connected to a Q-Exactive HF-X quadrupole-Orbitrap mass spectrometer (Thermo Fisher Scientific). MS was set to perform with the top 12 ions and a scan range of 350–1400 m/z. Normalized collision energy was set at 27, automatic gain control to 3 × 10⁶, maximum fill MS to 45 ms and maximum fill MS/MS to 22 ms. Data processing and library searching were performed as described by Jean-Toussaint et al. [22]. MS1-based isotopic features were detected and peptide peak areas were calculated using OpenMS (http://dx.doi.org/10.1186/1471-2105-9-163). Proteins were required to have one or more unique peptides across the analyzed samples with E-value scores of 0.0001 or less. If a fold ratio between the control and treated groups was ≥2.0 (up) and ≤0.5 (down), they were considered to be differentially expressed. The Cluster of Orthologous Groups (COG) was employed to classify the function of proteins [23] and the Kyoto Encyclopedia of Genes and Genomes (KEGG) database was used to map the potential pathway [24]. Protein interaction network analysis was performed using STRING version 11.0 (http://string-db.org/) [25]. The heatmap function in R (https://www.r-project.org/) was used to build a heatmap of the proteomic data.

3. Results and Discussion

3.1. Cell Morphology and Antimicrobial Susceptibility of P. aeruginosa PAO1

P. aeruginosa PAO1 survived well when it was grown with CR-IC in the continuous culture but S. aureus strains ATCC 25923 and ATCC BAA-1717 did not. After 144 h of culture, the average counts of strain PAO1 biofilm cells per control segment and CR-IC segment were 7.31 ± 0.23 and 7.33 ± 0.42 log CFU, respectively. Morphologies of strain PAO1 biofilm cells grown on catheter sections and the air–liquid interface were compared (Figure 1A–D). The biofilm cells grown with CR-IC were elongated up to approximately 25 µm, showing swollen and filamentous growth. Moreover, the biofilm cells formed on CR-IC were more elongated than those on the air–liquid interface. Elongation of biofilm cells has been observed when Gram negative bacteria, including Escherichia coli and P. aeruginosa, were exposed to antibacterial agents [26,27]. By modifying its cell morphology, strain PAO1 probably responded to stress caused by the antibiotics released from CR-IC.
The MICs of aminoglycosides (amikacin, gentamicin and tobramycin), cephalosporins (cefazolin, cefepime, cefotaxime and ceftazidime), carbapenems (doripenem, imipenem and meropenem), penicillin (piperacillin), fluoroquinolones (ciprofloxacin, levofloxacin and norfloxacin) and glycylcycline (tigecycline), including clindamycin and rifampicin against strain PAO1 cultivated in the presence of control catheters and CR-IC, were not significantly different (Supplementary Table S1). Although antibiotics eluted from CR-IC could not change the MICs of P. aeruginosa strain PAO1, they exhibited an antibacterial effect with large inhibition zone diameters (10–15 mm) against S. aureus ATCC 25923 over 144 h. This indicates that antibiotics eluted from CR-IC do not possess the antibacterial potency to increase the MICs against P. aeruginosa but can sustain antibacterial activity against S. aureus. Mutations in ampC, gyrB, oprD and rpoB were not found. These genes were known to have mutations when P. aeruginosa was exposed to avibactam, ceftazidime, ceftolozane, fluoroquinolones, imipenem, meropenem, rifampicin and tazobactam [28].

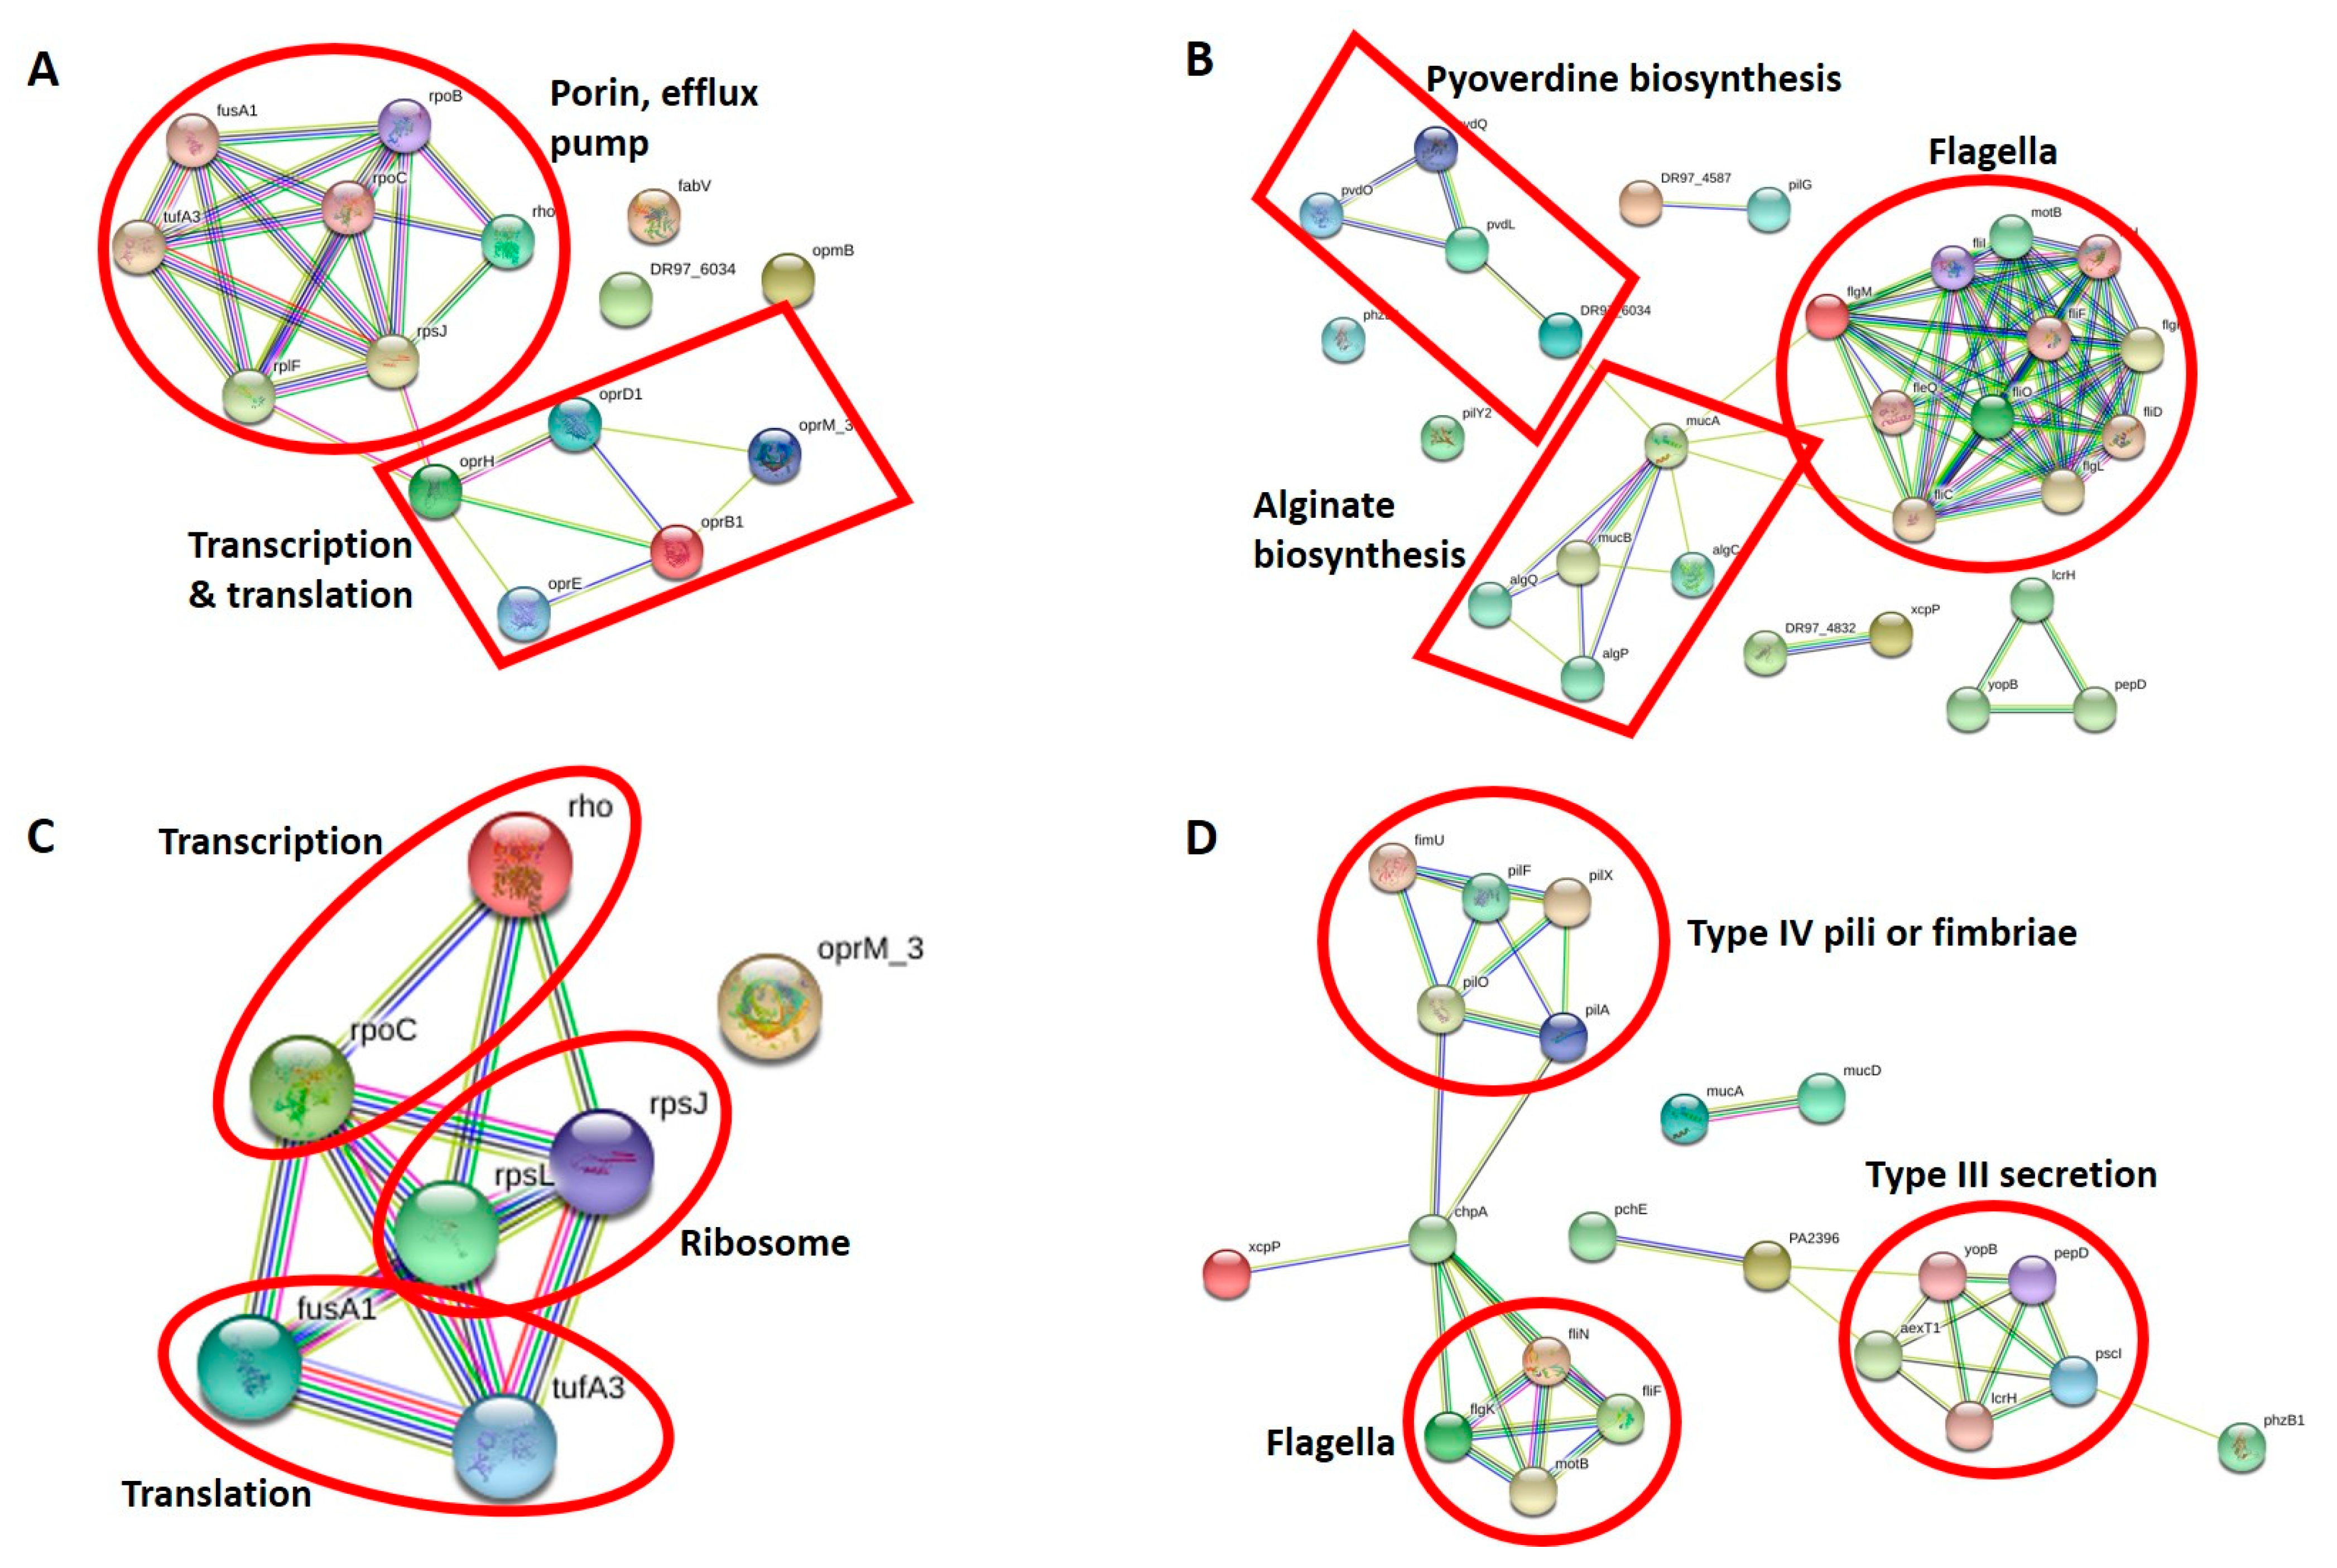
3.2. Proteomic Insights into the Global Cellular Response to Clindamycin/Rifampicin

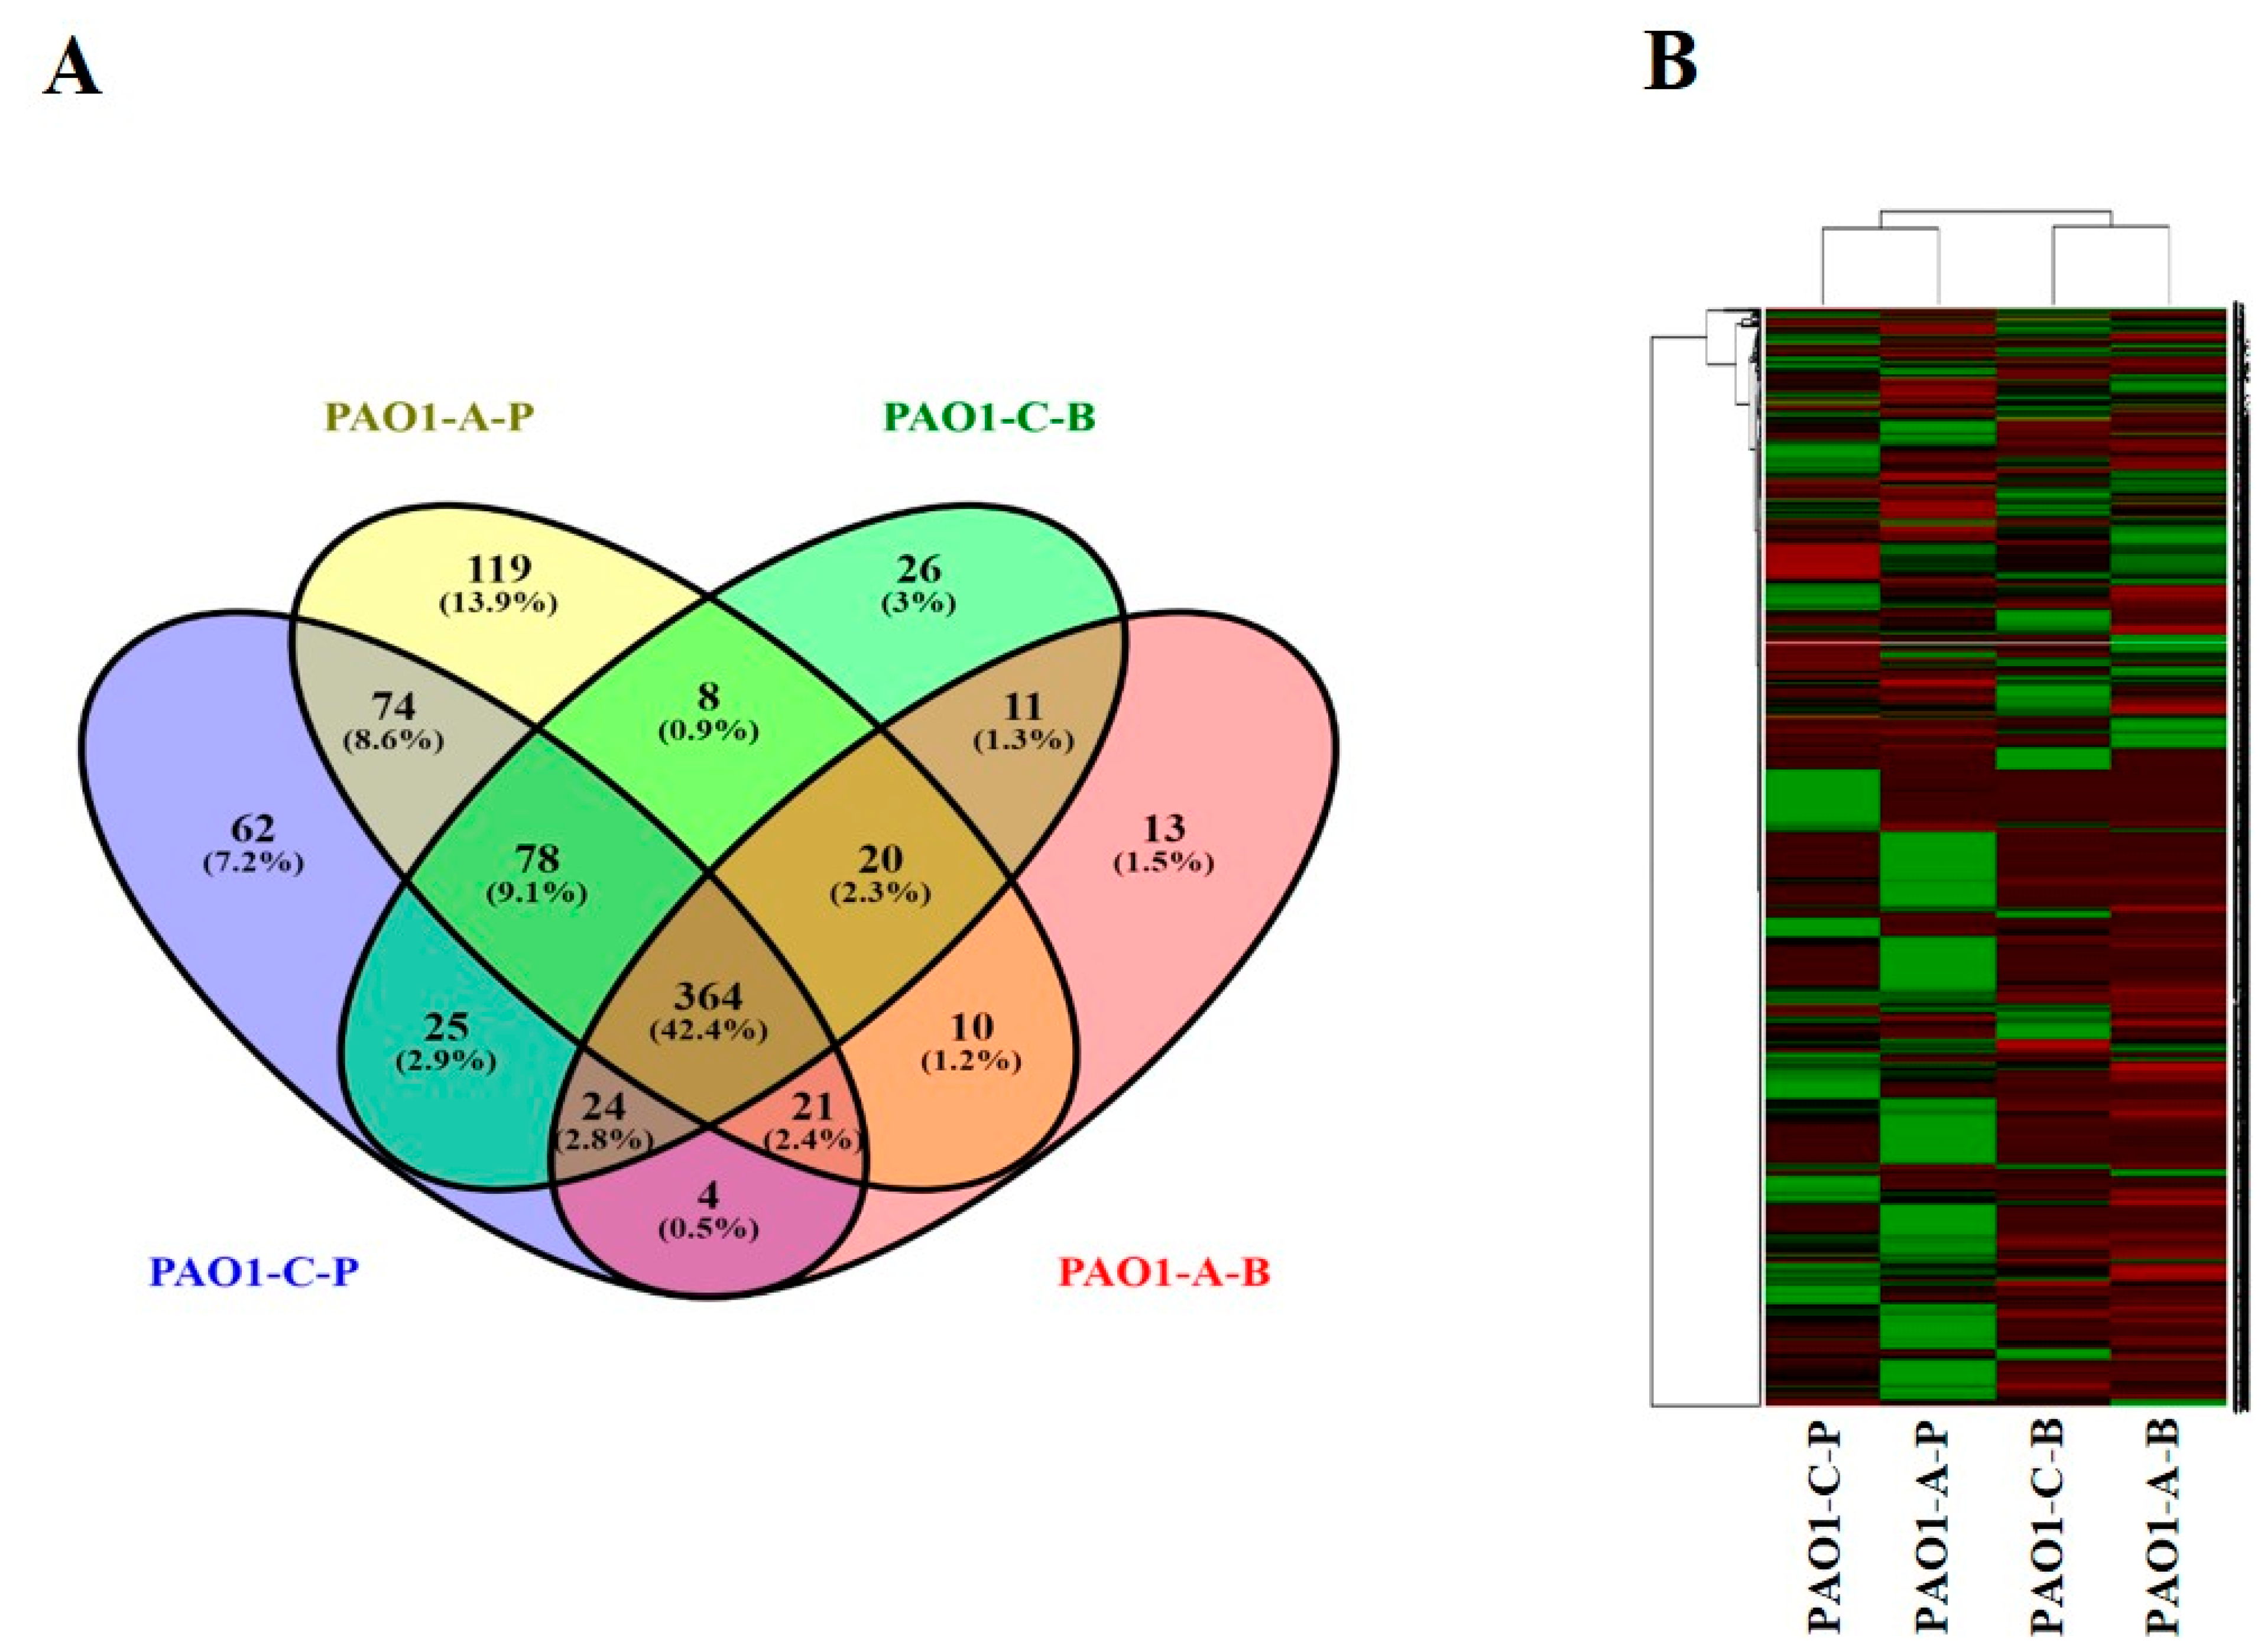
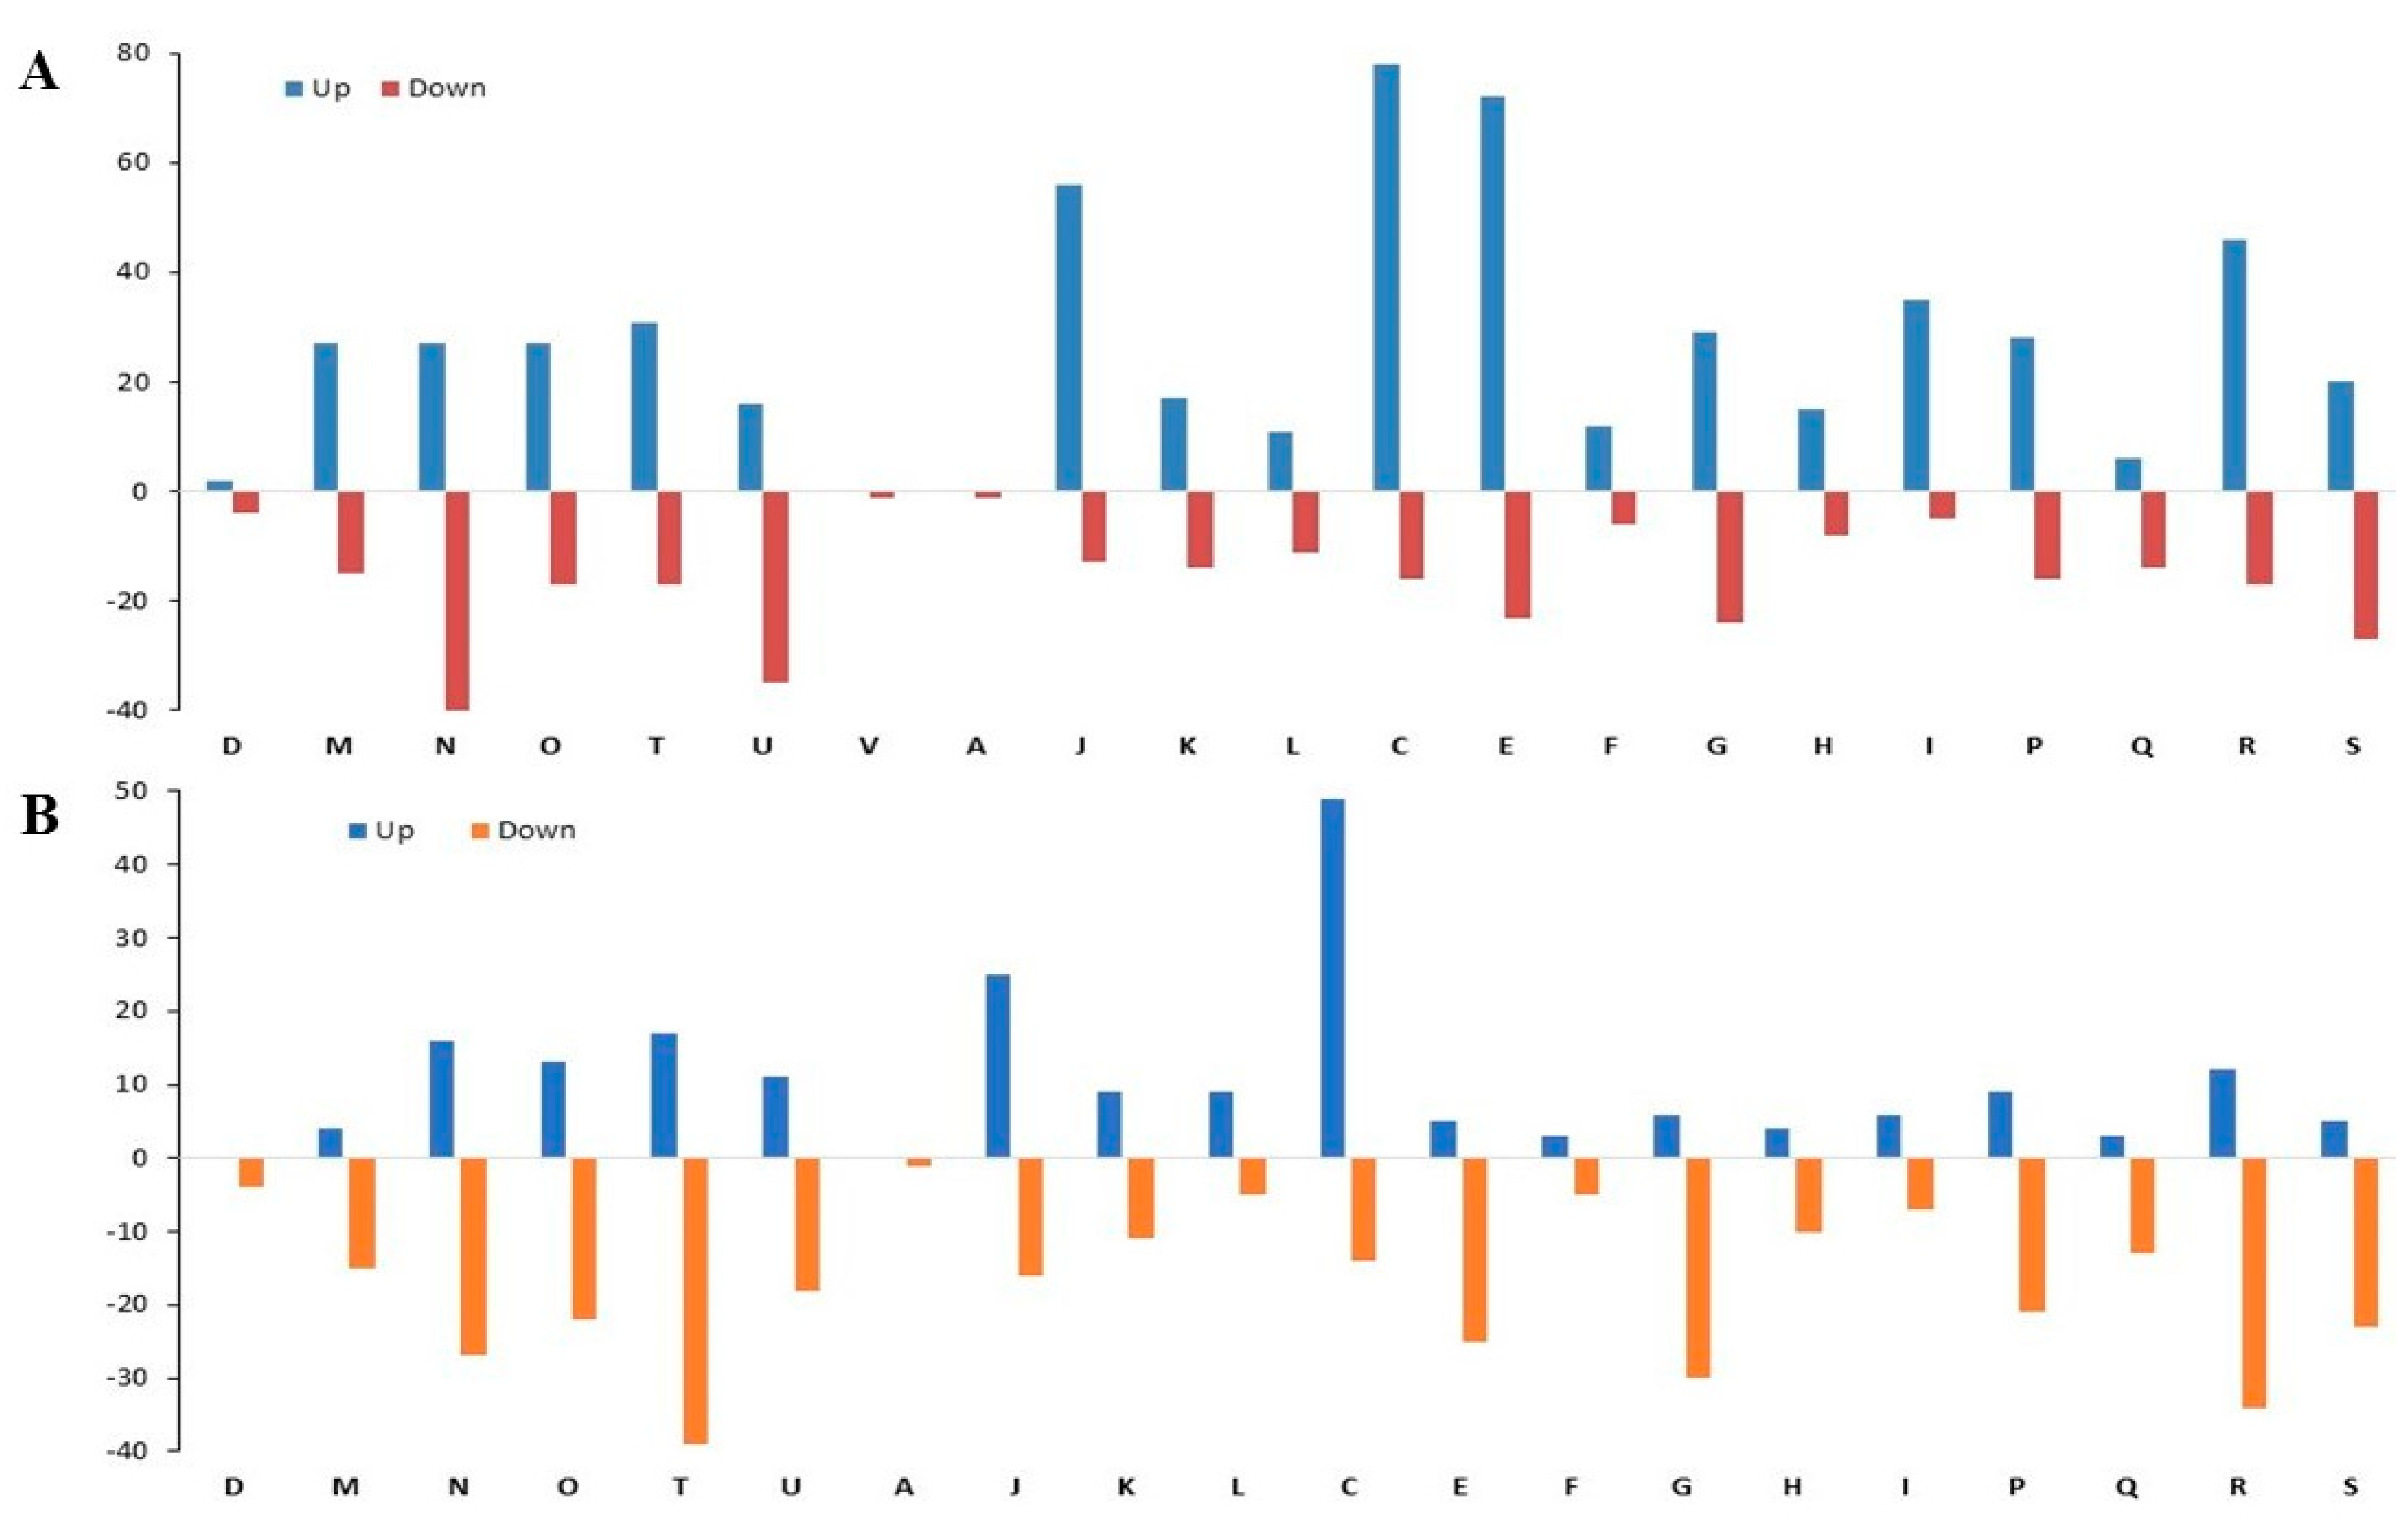
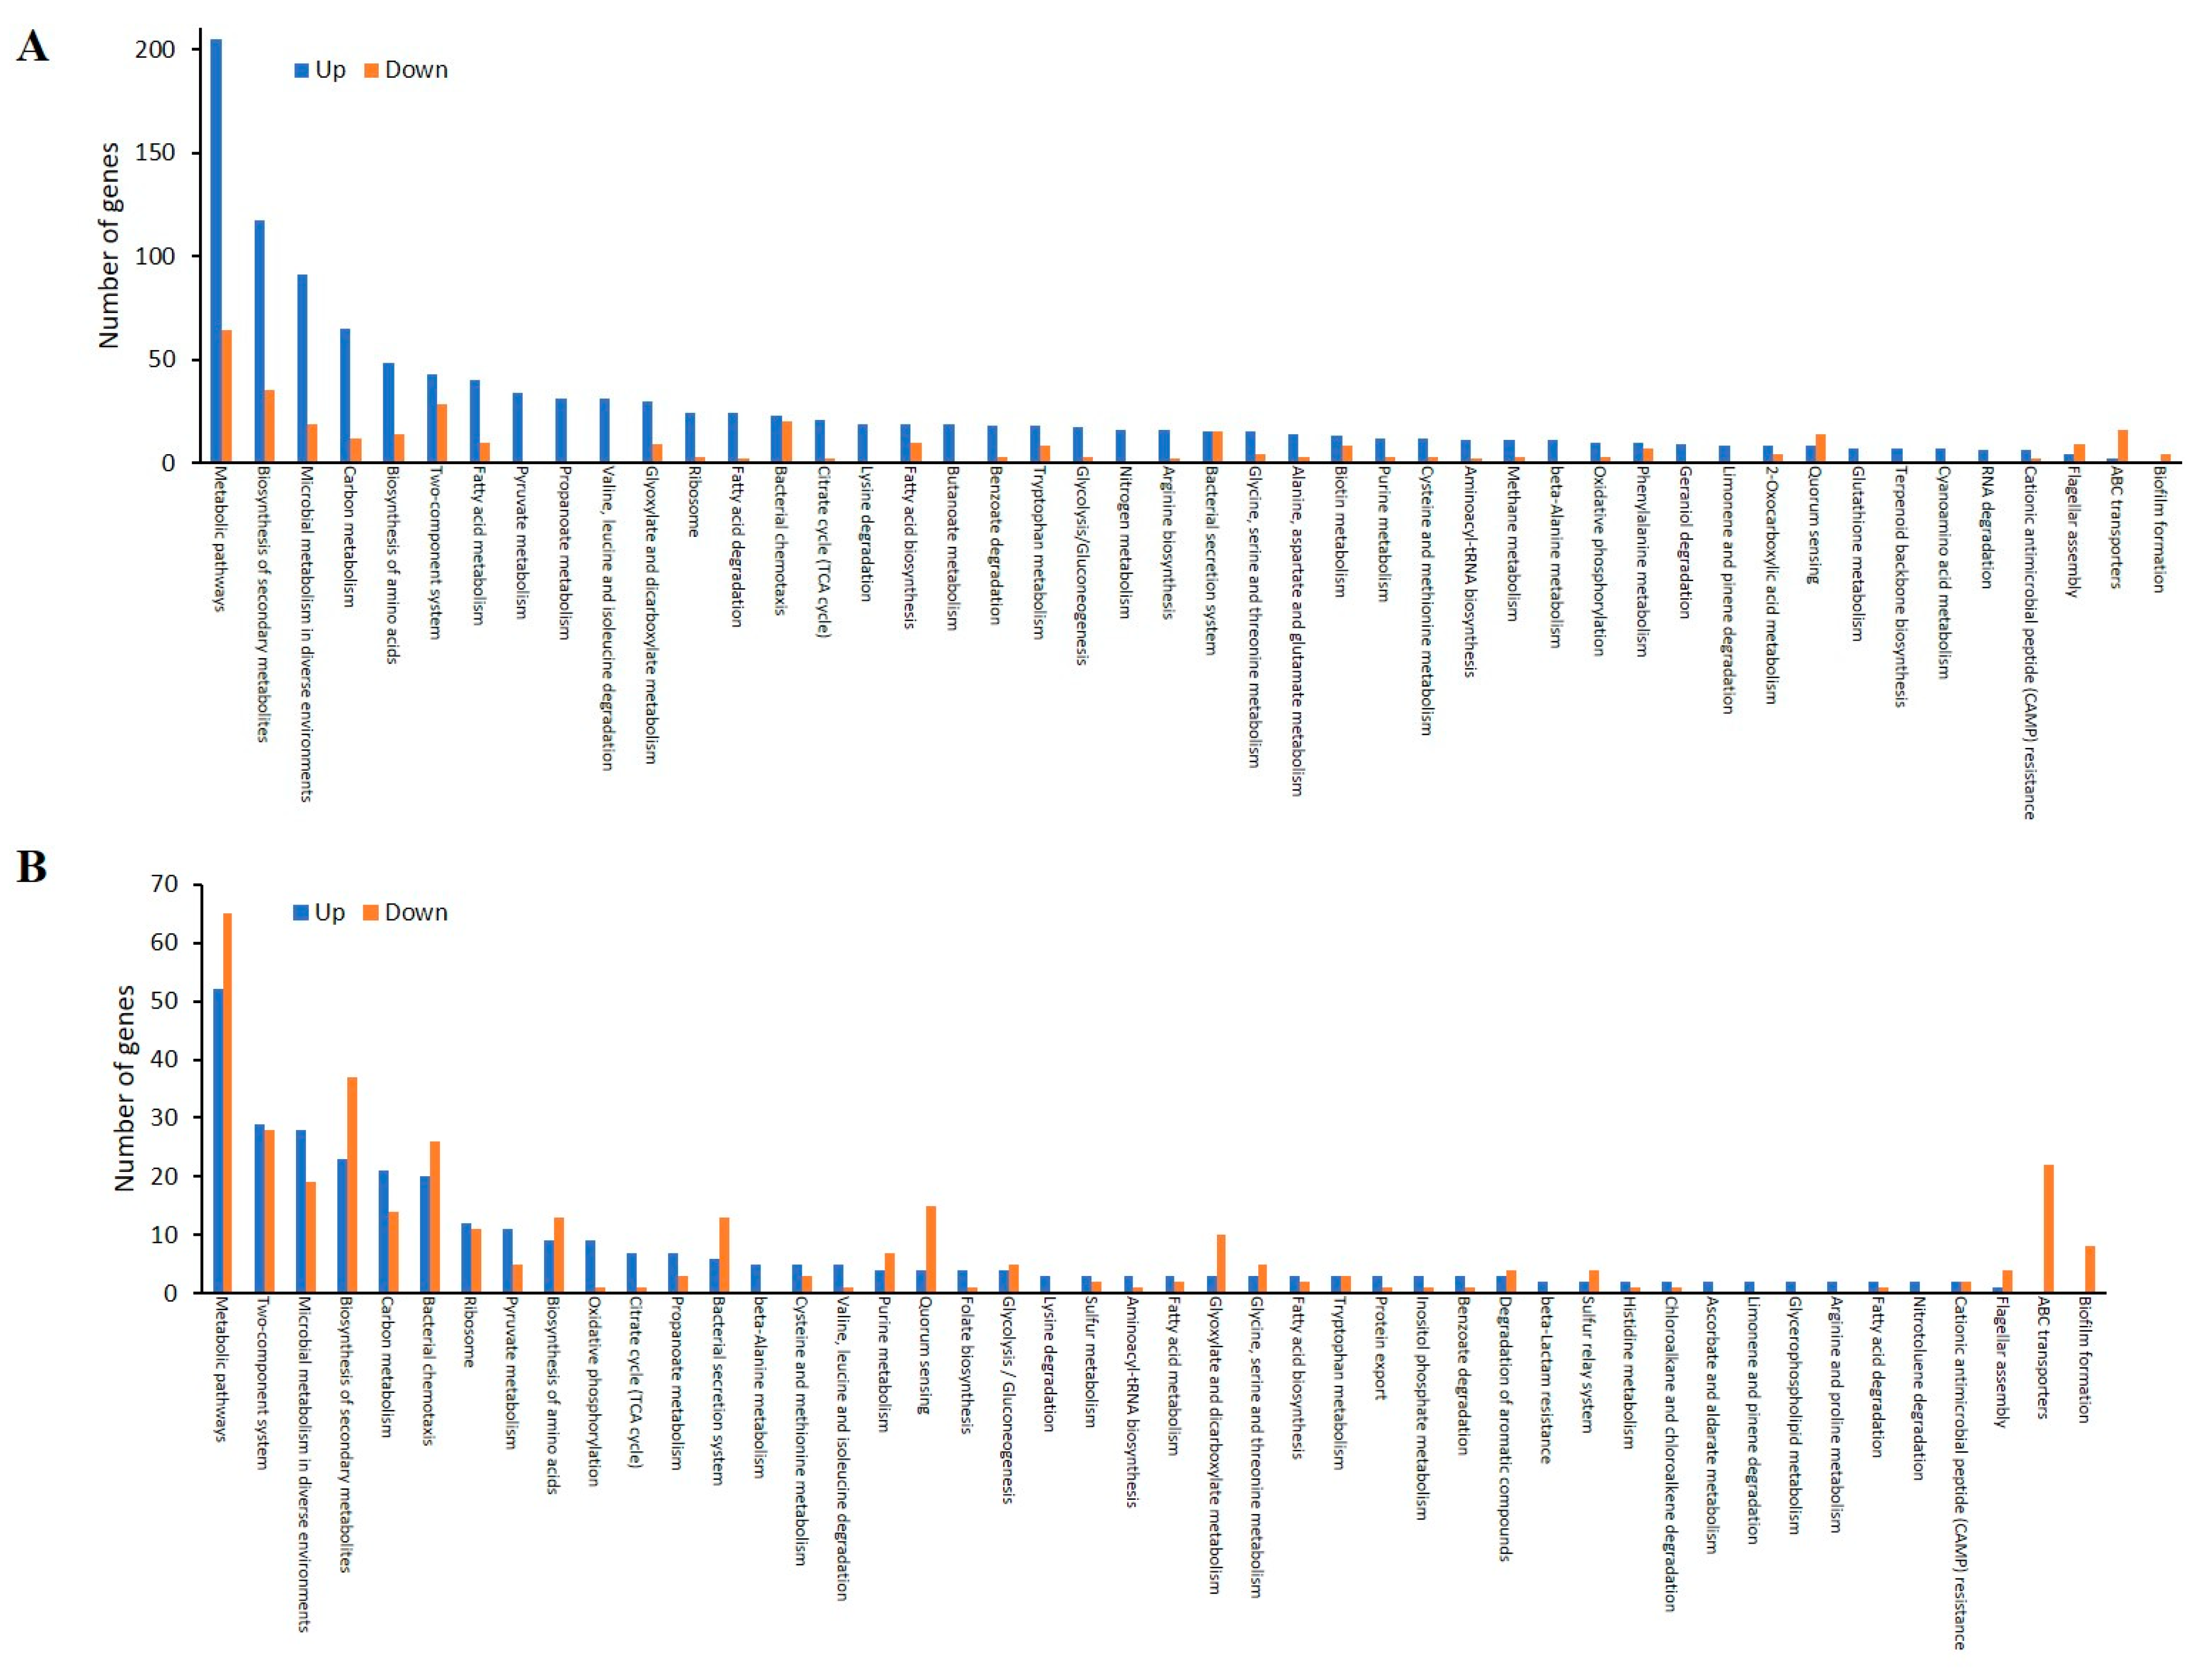
3.2.1. Global Overview of the Proteome Data

From the proteomic data analysis, 694 and 556 proteins were identified from the planktonic (CP) and biofilm (CB) cells, respectively, grown with control catheters and 652 and 467 proteins from the planktonic (AP) and biofilm (AB) cells, respectively, grown with CR-IC (Figure 2A). A Venn diagram indicated that 364 proteins were commonly identified in all comparison groups, whereas 62, 119, 26 and 13 proteins were uniquely detected in CP, AP, CB and AB, respectively. The heatmap showed that proteins identified from the planktonic and the biofilm cells were clustered into each single branch, respectively (Figure 2B). Differentially regulated proteins of 545 in planktonic cells were identified, 326 of which displayed upregulation and 219 displayed downregulation (Table S2). On the other hand, 372 proteins were differentially expressed in biofilm cells containing 137 that were upregulated and 235 that were downregulated (Table S3).
According to COG functional category analysis [29], the differentially expressed proteins (DEPs) were classified into four main functional categories: (1) Cellular processes and signaling; (2) Information storage and processing; (3) Metabolism; and (4) Poorly characterized (Figure 3A,B). There were more proteins in each COG category that were upregulated than downregulated in AP/CP (Figure 3A); however, in the COG analysis of AB/CB, more proteins were repressed (Figure 3B). The predominant COGs of upregulated proteins in AP/CP were energy production and conversion (C, 78); amino acid transport and metabolism (E, 72); and translation, ribosomal structure and biogenesis (J, 56), while those in under-expressed proteins were cell motility (N, 40); intracellular trafficking; secretion and vesicular transport (U, 35); and function unknown (S, 27). The main COGs of downregulated proteins in AB/CB included signal transduction mechanisms (T, 39); general function prediction only (R, 34); and carbohydrate transport and metabolism (G, 30), while the most upregulated proteins were found in energy production and conversion (C, 49).
While upregulated and downregulated proteins of AP/CP were mapped into 99 and 64 KEGG pathways, respectively, AB/CB revealed 68 upregulated and 65 downregulated pathways (Tables S4–S7, Figures S1–S4). Among five main KEGG categories including “metabolism”, “cellular processes”, “environmental information processing”, “genetic information processing” and “human diseases”, the “metabolism” pathway accounted for the majority of DEPs. Within the metabolism group, in addition to “global and overview map” category, the “carbohydrate metabolism” and “amino acid metabolism” categories were the most populated. In general, more proteins were enriched in upregulated proteins of AP/CP than AB/CB KEGG pathways, showing elevated dynamic responses of the planktonic cells than the biofilm cells to the released antibiotics from CR-IC, as shown in the COG data. Interestingly, cell motility (bacterial secretion system and flagellar assembly), membrane transport (bacterial secretion system, ATP-binding cassette (ABC) transporters and phosphotransferase system) and cellular community (quorum sensing and biofilm formation) pathways had more downregulated proteins than upregulated proteins in both AP/CP and AB/CB (Figure 4A,B). Clindamycin and rifampicin eluted from CR-IC promoted the pathways associated with metabolism and genetic information processing in the planktonic cells, but repressed the pathways associated with environmental information processing and cellular processes in the biofilm cells. A mixture of clindamycin (3.2 µg/mL) and rifampicin (0.4 µg/mL) inhibited the planktonic growth of strain PAO1 and this phenomenon was significant as the concentration increased (Figure 5A). This result supports the observation that the sublethal pressure of clindamycin and rifampicin eluted from CR-IC results in changes in the proteome profile mentioned above.

3.2.2. Antibiotic Resistance Proteins of CR-IC-Treated Planktonic Cells

From the planktonic cells of strain PAO1, 21 antibacterial resistance proteins were identified, including 14 upregulated and 2 downregulated proteins (Table 1) [30]. These DEPs primarily belonged to porins, efflux pumps, translation and transcription. Porins are outer membrane proteins that mediate cellular permeability and antibiotic resistance [31,32,33]. P. aeruginosa has four different classes of porins: nonspecific (OprF), specific (OprB, OprD, OprE, OprO and OprP), gated (OprC, OprH and FpvA) and efflux porins (OprM, OprN and OprJ) [34]. FpvA, OprB, PA2291 (encoding OprB2) and OprH were only expressed in the planktonic cells challenged with CR-IC. OprB and PA2291 are outer membrane channel porins that play essential roles in glucose uptake and tobramycin resistance in P. aeruginosa [31,35]. FpvA, a ferripyoverdine receptor, and OprH, a low Mg2+ inducible porin, have been reported to be involved in resistance to a thiopeptide antibiotic, thiostrepton, polymyxin B and gentamicin [36]. OprD, which is a specific porin for translocating amino acids, peptides and carbapenem [32], was highly upregulated at a fold ratio of 13.2. However, OprE (OccK8), a channel-forming outer membrane porin related to cefepime, ceftazidime and chromate resistance, which is induced under oxygen-depleted conditions, was downregulated [33]. In our study, the presence of CR-IC led to the differential expression of specific and gated porin groups, such as OprB, OprB2, OprD, OprE, OprH and FpvA, which have been reported to cause resistance to a variety of antibiotics [31,32,33,35,36]. Although OprF is known as the major porin in P. aeruginosa [37], it was not significantly expressed (fold ratio 1.41). Treatment of E. coli, Aeromonas hydrophila and Acinetobacter baumannii strains with low concentrations of chloramphenicol and tetracycline to inhibit protein synthesis changed the expression of porin proteins and contributed to an increase in antibacterial resistance [38,39,40].
Multidrug efflux systems for pumping antibacterial molecules out of the bacterial cell reduce accumulation of antimicrobials within the cell [41]. MexAB-OprM and MexXY-OprM efflux pump operons of P. aeruginosa have been reported to export incoming antibacterial compounds across the membranes and contribute to the resistance against macrolides, β-lactams, tetracycline and chloramphenicol [42,43]. In this study, expression of OprM was significantly increased at a fold ratio of 18.4. Prior work demonstrated that P. aeruginosa cultivated under azithromycin, colistin and tobramycin over-expressed OprM [44,45]. However, MexA, MexB, MexX and MexY were either not differentially regulated (fold ratio 0.71) or not identified. Expression of OpmB, which is an outer membrane efflux protein that confers resistance to ampicillin, aztreonam, carbenicillin, macrolides, novobiocin and tetracycline [46], was suppressed at the highest fold ratio. Collectively, the antibiotics eluted from CR-IC, despite the low concentrations of clindamycin (0.2–24.58 µg/µL) and rifampicin (0.01–3.25 µg/µL) [47], are considered to selectively influence various porin and efflux pump proteins, which is consistent with the high efflux activities of strain PAO1 under the antibiotic pressure (Figure 5B).
Ribosomes are central components of protein biosynthesis and versatile targets for macrolides [48]. The 30S (RpsJ) and 50S (RplF) ribosomal proteins, as well as translation elongation factor proteins (TufB and FusA1), were abundantly increased under antibiotic stress, which implies the induction of the translational process by the binding of the released clindamycin of CR-IC to the ribosomal subunits. These results are in agreement with Ding et al. [49], who found that the same ribosomal proteins of strain PAO1 were up-regulated following sublethal azithromycin treatment. Moreover, many ribosomal proteins, including 30S, 50S and the translation elongation factor, were over-expressed in tetracycline-exposed A. hydrophila [50].
RpoB and RpoC are β subunits of DNA-directed RNA polymerase, which is the pivotal enzyme for transcription regulation [51]. Rifampicin binds to RpoB and hinders mRNA elongation [51]. We found that exposure of CR-IC, including clindamycin and rifampicin, to P. aeruginosa resulted in a significant up-expression of RpoB (fold ratio 13.15) and RpoC (fold ratio 6.81), but no mutation was detected. Similarly, when Mycobacterium tuberculosis or M. smegmatis was treated with sub-inhibitory doses of rifampicin, the expression levels of RpoB and RpoC were significantly increased [51,52]. In our results, the eluted rifampicin concentration was not high enough to cause mutations but influenced the transcription processes by targeting RpoB and RpoC proteins.
Construction of a functional protein–protein network using STRING in DEPs [25] revealed two distinct clusters (Figure 6A). The proteins of the two clusters were grouped into porin and efflux pump and transcription and translation proteins, respectively. Notably, strong upregulation (fold ratio 6.6) of FabV, which is an enoyl-acyl-carrier-protein reductase that is responsible for triclosan resistance [53], was observed, although not linked to any STRING cluster.

3.2.3. Virulence Proteins of CR-IC-Treated Planktonic Cells

A total of 46 virulence proteins, including 15 upregulated and 22 downregulated proteins from 244 P. aeruginosa PAO1 virulence protein database [30], were found from the control and treated planktonic cells (Table 2). STRING network analysis of differentially expressed virulence proteins upon the prolonged exposure of CR-IC to the planktonic cells found that three major protein clusters, containing flagella, alginate production and pyoverdine production, were connected to one another (Figure 6B). However, types II and III secretion systems and type IV pili formed independent clusters. MucA, which is an anti-sigma factor [54], was found to be the most interactive protein connecting the three clusters. It is involved in alginate biosynthesis and flagella motility in P. aeruginosa [54] and STRING network analysis clearly demonstrated its functional role. Flagella are pivotal virulence factors because they facilitate adherence of bacteria to host cell tissues and bacterial movement toward nutrients [55]. By the type III secretion system, flagellar proteins are pumped from the inside of the cell to the outside [56]. Early investigations showed that the exposure of bacteria to sub-inhibitory concentrations of antibacterial agents repressed flagellar expression [55,57]. Furthermore, sub-lethal concentrations of rifampicin or macrolides interfered with the production of flagellar proteins in P. aeruginosa, Proteus mirabilis and Salmonella Typhimurium [55,58]. Consistent with these previous reports, most flagellar proteins, including flagella transcriptional regulator (FleQ), flagella biosynthesis (FliO and FlgM) and flagella basal body (FliD, FliF, FliH, FliI, FlgK and FlgL) proteins, were downregulated.
The type III secretion system of P. aeruginosa is reported to antagonize flagellar biosynthesis [59], which is in agreement with our result that type III regulatory (PcrH) and type III translocator outer membrane (PopD) proteins were only expressed in the CR-IC-treated planktonic cells. Type I through VI secretion systems of P. aeruginosa play a role in delivering the proteins into the host or bacterial cells [60]. Both type II and VI secretion proteins, such as XcpP, XcpT, TagQ1 and TssB1, were suppressed when the planktonic cells were continuously adapted to the eluted antimicrobials of CR-IC. Our results are in contrast to the previous reports of other investigators who reported an over-expression of proteins related to type II and VI secretion systems in other Gram-negative bacteria after treatment with antibacterial compounds [61,62,63,64]. Although many type IV pili proteins such as ChpA, PilA, PilF, PilG, PilH, PilJ, PilO and FimV were identified, they were neither mapped in the STRING network nor differentially regulated (fold ratios 0.56–1.21). Interference with the assembly of type IV pili on the surface of P. aeruginosa treated with a sub-lethal concentration of macrolide has been reported and some researchers have noted an over-expression of PilA, PilH and PilY1 [65,66,67].
Alginate has been shown to be involved in the resistance to antibiotics, the host immune system and biofilm formation in P. aeruginosa [68]. Previous reports revealed that, following exposure to macrolides and epigallocatechin gallate, alginate biosynthesis genes were under-expressed [66,69]. However, our results were unique in the sense that we observed a downregulation of alginate regulatory proteins (AlgP and MucB) but an upregulation of an alginate structural protein (AlgC) and alginate regulatory proteins (AlgQ and MucA). Phenazine (PhzB1 and PhzB2) and pyoverdine (PvdL, PvdO, PvdP and PvdQ) biosynthesis proteins were differentially expressed with varied fold changes.
Invasion into human cervical epithelial adenocarcinoma cells by strain PAO1 cells harvested from the control and CR-IC-treated cultures was compared (Figure 5C). CR-IC-treated planktonic and biofilm cells had levels of invasion significantly higher than the control (p < 0.05). Taken together, our results indicate that the antibiotics released from CR-IC not only altered the phenotypic invasion potential to the HeLa epithelial cell lines but also selectively influenced cell-associated and secreted virulence proteins, including type IV pili, flagella, alginate, pyoverdine, phenazine and protein secretion systems.

3.2.4. Antibiotic Resistance Proteins of CR-IC-Treated Biofilm Cells

Compared to the planktonic cells, fewer antibacterial resistance proteins (11 proteins) were identified from the biofilm cells that were cultured with CR-IC (Table 3). Among seven DEPs, six were upregulated. Even though most proteins were identified in the biofilm cells, except RpsL which were commonly found in the planktonic cells, many proteins found in the planktonic cells such as FabV, FusA2, MexA, OpmB, OprB, OprB2, OprD, OprE and RpoB were not identified in the biofilm cells. These outcomes suggest that the biofilm cells responded in different manners compared to how the planktonic cells responded to the antibiotic pressure from CR-IC.
STRING network analysis of seven differentially expressed antibacterial resistance proteins in the biofilm showed a single cluster composed of six proteins associated with transcription (Rho and RpoC), translation (FusA1 and TufB) and ribosomal proteins (RpsJ and RpsL) (Figure 6C). RpsL and OprM were expressed only in the biofilm cells under the given antibiotic stress, suggesting that they are the key proteins responding to the antibiotics released from the catheters. It is interesting that RpsL, upon conferring resistance to streptomycin, was highly over-expressed under macrolide and rifampicin stresses [70]. In contrast to the planktonic cells, where many porin proteins were over-expressed, only OprM was upregulated in the biofilm cells. However, OprM did not interact with the cluster. We noticed that fold ratios of several proteins between the planktonic and the biofilm cells were generally decreased in RpoC (fold ratio from 6.8 to 2.7), RpsJ (fold ratio from 19.1 to 2.2), TufB (fold ratio from 3.5 to 2.1), RplF (fold ratio from 3.2 to 1.7) and Rho (fold ratio from 6.6 to 0.08). The reduced expression of these transcriptional and translational proteins may imply the slow adaptation of the biofilm cells with reduced protein synthesis to the antibiotic stress caused by CR-IC.

3.2.5. Virulence Proteins of CR-IC-Treated Biofilm Cells

From the strain PAO1 biofilm cells adapted to clindamycin and rifampicin released from CR-IC, 45 virulence proteins were identified and contained 9 upregulated and 15 downregulated proteins (Table 4). Although more antibiotic resistance proteins were identified in the planktonic cells than compared to the biofilm cells, there were no significant differences between the total number of identified virulence proteins in the planktonic and the biofilm cells. The most remarkable difference in virulence proteins between the planktonic and the biofilm cells was the smaller number of proteins (PvdF and PA2393) related to alginate and pyoverdine biosynthesis found in the biofilm cells. Likewise, in the proteomic study of Park et al. that compared planktonic and biofilm cells, various virulence-associated proteins were found less during biofilm growth [71].
STRING network analysis revealed three independent clusters that consisted of 21 proteins (Figure 6D). The first two clusters are primarily composed of 11 proteins linked to type IV pili or fimbriae (FimU, PilA, PilF, PilO and PilX) and flagella (FlgK, FliF, FliN and MotB) proteins. Most of them exhibited decreased expression in CR-IC-adapted biofilm cells compared to those in the unadapted cells, as the planktonic cells showed. ChpA interacted with the highest number of proteins, including FlgK, FliF, FliN, MotB, PilA, PilO and XcpP, suggesting that it may play a paramount role in virulence upon the antibiotic adaptation of the biofilm cells. The production, assembly and twitching motility in type IV pili are controlled by various signal transduction systems, including a chemosensory (Chp) system, in P. aeruginosa and one of the central signaling components of the Chp system is ChpA [72]. Therefore, it indicates that the downregulation of ChpA is closely associated with the suppression of type IV pili proteins. Major protein components of the second cluster in STRING network are type III secretion system (ExoT, PcrH, PopB, PopD and PscI), which are differentially expressed. Interestingly, we observed that ExoT and PscI proteins were not identified in the proteome analysis of the planktonic cells, but they were tremendously over-expressed in the biofilm cells. Moreover, the proteins PopD and PcrH that over-expressed in the planktonic cells at the highest fold ratio were also identified in the biofilm cells but with the decreased fold ratios of 0.41 and 2.5, respectively. There were conflicting reports regarding the alteration of type III secretion proteins following the treatment of antibacterial agents [44,73]. Most type III secretion proteins were repressed following the treatment of P. aeruginosa biofilm with coumarin [73], but exhibited the opposite result after azithromycin exposure [44].

4. Conclusions

Phenotypic feedback of P. aeruginosa PAO1 after an exposure to antibiotics included morphological changes and increased invasion potency. Virulence proteins including flagella, pili, alginate, pyoverdine, phenazine and protein secretion pathways were distinctly over-expressed in both planktonic and biofilm cells. The invasion capability for human cervical cancer cells was also increased, suggesting a potential risk in the clinical use of CR-IC. CR-IC-treated cells changed their protein expression related to antibiotic resistance but not their phenotypic MICs. This difference between gene/protein expression and antibacterial resistance phenotype should be further studied to better understand the relationship between epigenetic factors and MIC.

Supplementary Materials

The following are available online at https://www.mdpi.com/article/10.3390/antibiotics10070752/s1, Figure S1. Top 25 KEGG pathways of up-regulated proteins from the planktonic cells grown in control and antibiotic-impregnated catheters, Figure S2. Top 25 KEGG pathways of down-regulated proteins from the planktonic cells grown in control and antibiotic-impregnated catheters, Figure S3. Top 25 KEGG pathways of up-regulated proteins from the biofilm cells grown in control and antibiotic-impregnated catheters, Figure S4. Top 25 KEGG pathways of down-regulated proteins from the biofilm cells grown in control and antibiotic-impregnated catheters, Table S1. Minimum inhibitory concentration (MIC) of planktonic and biofilm cells grown with control and antibiotic-impregnated catheters in the continuous culture system, Table S2. Differentially regulated proteins of planktonic cells grown with control (CP) and antibiotic-coated (AP) catheters, Table S3. Differentially regulated proteins of biofilm cells grown with control (CB) and antibiotic-coated (AB) catheters, Table S4. KEGG pathways of up-regulated proteins from the planktonic cells grown in control and antibiotic-impregnated catheters, Table S5. KEGG pathways of down-regulated proteins from the planktonic cells grown in control and antibiotic-impregnated catheters, Table S6. KEGG pathways of up-regulated proteins from the biofilm cells grown in control and antibiotic-impregnated catheters.

Author Contributions

Conceptualization, K.S. and J.C.; methodology, K.S. and J.C.; software, K.S. and O.K.; validation, K.S., J.C. and O.K.; formal analysis, K.S.; investigation, J.C., S.N., S.K., M.P., S.A.K., A.P. and J.-H.L.; resources, K.S.; data curation, K.S.; writing—original draft preparation, K.S.; writing—review and editing, K.S., J.C., M.P., S.N., S.K., S.A.K., A.P., J.-H.L., K.S.P., C.E.C. and O.K.; visualization, K.S., M.P. and A.P.; supervision, K.S. and C.E.C.; project administration, K.S., K.S.P. and C.E.C.; funding acquisition, K.S., K.S.P. and C.E.C. All authors have read and agreed to the published version of the manuscript.

Funding

This research was funded by US FDA, grant number E0759901.

Data Availability Statement

Acknowledgments

We thank John Sutherland, Jin Han and Jinshan Jin for reviewing the manuscript.

Conflicts of Interest

The views expressed herein do not necessarily reflect those of the US Food and Drug Administration or the US Department of Health and Human Services. Any mentions of commercial products are for clarification and are not intended as an endorsement.

References

  1. Darouiche, R.O. Device-Associated Infections: A Macroproblem that Starts with Microadherence. Clin. Infect. Dis. 2001, 33, 1567–1572. [Google Scholar] [CrossRef]
  2. Von Eiff, C.; Jansen, B.; Kohnen, W.; Becker, K. Infections associated with medical devices: Pathogenesis, management and prophylaxis. Drugs 2005, 65, 179–214. [Google Scholar] [CrossRef]
  3. Costerton, J.W.; Stewart, P.S.; Greenberg, E.P. Bacterial Biofilms: A Common Cause of Persistent Infections. Science 1999, 284, 1318–1322. [Google Scholar] [CrossRef] [PubMed] [Green Version]
  4. Cole, S.J.; Records, A.R.; Orr, M.W.; Linden, S.B.; Lee, V.T. Catheter-Associated Urinary Tract Infection by Pseudomonas aeruginosa Is Mediated by Exopolysaccharide-Independent Biofilms. Infect. Immun. 2014, 82, 2048–2058. [Google Scholar] [CrossRef] [Green Version]
  5. Pascual, A. Pathogenesis of catheter-related infections: Lessons for new designs. Clin. Microbiol. Infect. 2002, 8, 256–264. [Google Scholar] [CrossRef] [PubMed] [Green Version]
  6. Murga, R.; Miller, J.M.; Donlan, R.M. Biofilm Formation by Gram-Negative Bacteria on Central Venous Catheter Connectors: Effect of Conditioning Films in a Laboratory Model. J. Clin. Microbiol. 2001, 39, 2294–2297. [Google Scholar] [CrossRef] [Green Version]
  7. System, N. National Nosocomial Infections Surveillance (NNIS) System Report, Data Summary from January 1990-May 1999, Issued June 1999. Am. J. Infect. Control 1999, 27, 520–532. [Google Scholar] [CrossRef]
  8. Cross, A.; Allen, J.R.; Burke, J.; Ducel, G.; Harris, A.; John, J.; Johnson, D.; Lew, M.; MacMillan, B.; Meers, P.; et al. Nosocomial infections due to Pseudomonas aeruginosa: Review of recent trends. Rev. Infect. Dis. 1983, 5 (Suppl. 5), S837–S845. [Google Scholar] [CrossRef] [PubMed]
  9. Mulcahy, L.R.; Isabella, V.M.; Lewis, K. Pseudomonas aeruginosa Biofilms in Disease. Microb. Ecol. 2014, 68, 1–12. [Google Scholar] [CrossRef] [PubMed] [Green Version]
  10. Olejnickova, K.; Hola, V.; Ruzicka, F. Catheter-related infections caused byPseudomonas aeruginosa: Virulence factors involved and their relationships. Pathog. Dis. 2014, 72, 87–94. [Google Scholar] [CrossRef] [Green Version]
  11. Lister, P.D.; Wolter, D.J.; Hanson, N.D. Antibacterial-resistant Pseudomonas aeruginosa: Clinical impact and complex regulation of chromosomally encoded resistance mechanisms. Clin. Microbiol. Rev. 2009, 22, 582–610. [Google Scholar] [CrossRef] [Green Version]
  12. Aslam, B.; Wang, W.; Arshad, M.I.; Khurshid, M.; Muzammil, S.; Rasool, M.H.; Nisar, M.A.; Alvi, R.F.; Aslam, M.A.; Qamar, M.U.; et al. Antibiotic resistance: A rundown of a global crisis. Infect. Drug Resist. 2018, 11, 1645–1658. [Google Scholar] [CrossRef] [PubMed] [Green Version]
  13. Pang, Z.; Raudonis, R.; Glick, B.R.; Lin, T.-J.; Cheng, Z. Antibiotic resistance in Pseudomonas aeruginosa: Mechanisms and alternative therapeutic strategies. Biotechnol. Adv. 2019, 37, 177–192. [Google Scholar] [CrossRef] [PubMed]
  14. Fernández, L.; Breidenstein, E.B.; Hancock, R.E. Creeping baselines and adaptive resistance to antibiotics. Drug Resist. Updat. 2011, 14, 1–21. [Google Scholar] [CrossRef]
  15. Machado, I.; Coquet, L.; Jouenne, T.; Pereira, M.O. Proteomic approach to Pseudomonas aeruginosa adaptive resistance to benzalkonium chloride. J. Proteom. 2013, 89, 273–279. [Google Scholar] [CrossRef] [PubMed] [Green Version]
  16. Secer, H.I.; Kural, C.; Kaplan, M.; Kilic, A.; Duz, B.; Gönül, E.; Izci, Y. Comparison of the Efficacies of Antibiotic-Impregnated and Silver-Impregnated Ventricular Catheters on the Prevention of Infections. Pediatr. Neurosurg. 2008, 44, 444–447. [Google Scholar] [CrossRef]
  17. Munson, E.L.; Heard, S.O.; Doern, G.V. In Vitro Exposure of Bacteria to Antimicrobial Impregnated-Central Venous Catheters Does Not Directly Lead to the Emergence of Antimicrobial Resistance. Chest 2004, 126, 1628–1635. [Google Scholar] [CrossRef]
  18. Sampath, L.A.; Tambe, S.M.; Modak, S.M. In Vitro and In Vivo Efficacy of Catheters Impregnated With Antiseptics or Antibiotics: Evaluation of the Risk of Bacterial Resistance to the Antimicrobials in the Catheters. Infect. Control Hosp. Epidemiol. 2001, 22, 640–646. [Google Scholar] [CrossRef]
  19. Shakir, Z.; Khan, S.; Sung, K.; Khare, S.; Khan, A.; Steele, R.; Nawaz, M. Molecular Characterization of Fluoroquinolone-Resistant Aeromonas spp. Isolated from Imported Shrimp. Appl. Environ. Microbiol. 2012, 78, 8137–8141. [Google Scholar] [CrossRef] [Green Version]
  20. Nawaz, M.; Sung, K.; Kweon, O.; Khan, S.; Nawaz, S.; Steele, R. Characterisation of novel mutations involved in quinolone resistance in Escherichia coli isolated from imported shrimp. Int. J. Antimicrob. Agents 2015, 45, 471–476. [Google Scholar] [CrossRef] [PubMed]
  21. Moggridge, S.; Sorensen, P.H.; Morin, G.B.; Hughes, C.S. Extending the Compatibility of the SP3 Paramagnetic Bead Processing Approach for Proteomics. J. Proteome Res. 2018, 17, 1730–1740. [Google Scholar] [CrossRef]
  22. Jean-Toussaint, R.; Tian, Y.; Chaudhuri, A.D.; Haughey, N.J.; Sacan, A.; Ajit, S.K. Proteome characterization of small extracellular vesicles from spared nerve injury model of neuropathic pain. J. Proteom. 2020, 211, 103540. [Google Scholar] [CrossRef] [PubMed]
  23. Tatusov, R.L.; Fedorova, N.D.; Jackson, J.D.; Jacobs, A.R.; Kiryutin, B.; Koonin, E.V.; Krylov, D.M.; Mazumder, R.; Mekhedov, S.L.; Nikolskaya, A.N.; et al. The COG database: An updated version includes eukaryotes. BMC Bioinform. 2003, 4, 41. [Google Scholar] [CrossRef] [PubMed] [Green Version]
  24. Kanehisa, M.; Sato, Y. KEGG Mapper for inferring cellular functions from protein sequences. Protein Sci. 2020, 29, 28–35. [Google Scholar] [CrossRef] [Green Version]
  25. Szklarczyk, D.; Gable, A.L.; Lyon, D.; Junge, A.; Wyder, S.; Huerta-Cepas, J.; Simonovic, M.; Doncheva, N.T.; Morris, J.H.; Bork, P.; et al. STRING v11: Protein–protein association networks with increased coverage, supporting functional discovery in genome-wide experimental datasets. Nucleic Acids Res. 2019, 47, D607–D613. [Google Scholar] [CrossRef] [PubMed] [Green Version]
  26. Gomes, L.C.; Mergulhão, F.J. SEM Analysis of Surface Impact on Biofilm Antibiotic Treatment. Scanning 2017, 2017, 1–7. [Google Scholar] [CrossRef] [PubMed] [Green Version]
  27. She, P.; Luo, Z.; Chen, L.; Wu, Y. Efficacy of levofloxacin against biofilms of Pseudomonas aeruginosa isolated from patients with respiratory tract infections in vitro. Microbiologyopen 2019, 8, e00720. [Google Scholar] [CrossRef] [PubMed]
  28. López-Causapé, C.; Cabot, G.; Del Barrio-Tofiño, E.; Oliver, A. The Versatile Mutational Resistome of Pseudomonas aeruginosa. Front. Microbiol. 2018, 9, 685. [Google Scholar] [CrossRef] [PubMed]
  29. Tatusov, R.L.; Galperin, M.Y.; Natale, D.A.; Koonin, E.V. The COG database: A tool for genome-scale analysis of protein functions and evolution. Nucleic Acids Res. 2000, 28, 33–36. [Google Scholar] [CrossRef] [Green Version]
  30. Winsor, G.L.; Griffiths, E.J.; Lo, R.; Dhillon, B.K.; Shay, J.A.; Brinkman, F.S.L. Enhanced annotations and features for comparing thousands ofPseudomonasgenomes in the Pseudomonas genome database. Nucleic Acids Res. 2016, 44, D646–D653. [Google Scholar] [CrossRef] [Green Version]
  31. Raneri, M.; Pinatel, E.; Peano, C.; Rampioni, G.; Leoni, L.; Bianconi, I.; Jousson, O.; Dalmasio, C.; Ferrante, P.; Briani, F. Pseudomonas aeruginosa mutants defective in glucose uptake have pleiotropic phenotype and altered virulence in non-mammal infection models. Sci. Rep. 2018, 8, 16912. [Google Scholar] [CrossRef] [PubMed]
  32. Li, H.; Luo, Y.-F.; Williams, B.J.; Blackwell, T.S.; Xie, C.-M. Structure and function of OprD protein in Pseudomonas aeruginosa: From antibiotic resistance to novel therapies. Int. J. Med. Microbiol. 2012, 302, 63–68. [Google Scholar] [CrossRef] [Green Version]
  33. Samanta, S.; Bodrenko, I.; Acosta-Gutierrez, S.; D’Agostino, T.; Pathania, M.; Ghai, I.; Schleberger, C.; Bumann, D.; Wagner, R.; Winterhalter, M.; et al. Getting Drugs through Small Pores: Exploiting the Porins Pathway in Pseudomonas aeruginosa. ACS Infect. Dis. 2018, 4, 1519–1528. [Google Scholar] [CrossRef] [PubMed] [Green Version]
  34. Chevalier, S.; Bouffartigues, E.; Bodilis, J.; Maillot, O.; Lesouhaitier, O.; Feuilloley, M.G.J.; Orange, N.; Dufour, A.; Cornelis, P. Structure, function and regulation of Pseudomonas aeruginosa porins. FEMS Microbiol. Rev. 2017, 41, 698–722. [Google Scholar] [CrossRef] [PubMed]
  35. MacLeod, D.L.; Velayudhan, J.; Kenney, T.F.; Therrien, J.H.; Sutherland, J.L.; Barker, L.M.; Baker, W.R. Fosfomycin Enhances the Active Transport of Tobramycin in Pseudomonas aeruginosa. Antimicrob. Agents Chemother. 2012, 56, 1529–1538. [Google Scholar] [CrossRef] [Green Version]
  36. Ranieri, M.R.M.; Chan, D.C.K.; Yaeger, L.N.; Rudolph, M.; Karabelas-Pittman, S.; Abdo, H.; Chee, J.; Harvey, H.; Nguyen, U.; Burrows, L.L. Thiostrepton Hijacks Pyoverdine Receptors to Inhibit Growth of Pseudomonas aeruginosa. Antimicrob. Agents Chemother. 2019, 63. [Google Scholar] [CrossRef] [Green Version]
  37. Fito-Boncompte, L.; Chapalain, A.; Bouffartigues, E.; Chaker, H.; Lesouhaitier, O.; Gicquel, G.; Bazire, A.; Madi, A.; Connil, N.; Véron, W.; et al. Full virulence of Pseudomonas aeruginosa requires OprF. Infect. Immun. 2011, 79, 1176–1186. [Google Scholar] [CrossRef] [Green Version]
  38. Lin, L.; Sun, L.; Ali, F.; Guo, Z.; Zhang, L.; Lin, W.; Lin, X. Proteomic Analysis of Alterations in Aeromonas hydrophila Outer Membrane Proteins in Response to Oxytetracycline Stress. Microb. Drug Resist. 2018, 24, 1067–1074. [Google Scholar] [CrossRef] [PubMed]
  39. Lin, X.-M.; Yang, J.-N.; Peng, X.-X.; Li, H. A Novel Negative Regulation Mechanism of Bacterial Outer Membrane Proteins in Response to Antibiotic Resistance. J. Proteome Res. 2010, 9, 5952–5959. [Google Scholar] [CrossRef]
  40. Kesavan, D.; Vasudevan, A.; Wu, L.; Chen, J.; Su, Z.; Wang, S.; Xu, H. Integrative analysis of outer membrane vesicles proteomics and whole-cell transcriptome analysis of eravacycline induced Acinetobacter baumannii strains. BMC Microbiol. 2020, 20, 1–19. [Google Scholar] [CrossRef] [PubMed] [Green Version]
  41. Laborda, P.; Alcalde-Rico, M.; Blanco, P.; Martínez, J.L.; Hernando-Amado, S. Novel Inducers of the Expression of Multidrug Efflux Pumps That Trigger Pseudomonas aeruginosa Transient Antibiotic Resistance. Antimicrob. Agents Chemother. 2019, 63. [Google Scholar] [CrossRef] [PubMed]
  42. Wang, H.; Meng, J.; Jia, M.; Ma, X.; He, G.; Yu, J.; Wang, R.; Bai, H.; Hou, Z.; Luo, X. oprM as a new target for reversion of multidrug resistance in Pseudomonas aeruginosa by antisense phosphorothioate oligodeoxynucleotides. FEMS Immunol. Med. Microbiol. 2010, 60, 275–282. [Google Scholar] [CrossRef] [PubMed] [Green Version]
  43. Masuda, N.; Sakagawa, E.; Ohya, S.; Gotoh, N.; Tsujimoto, H.; Nishino, T. Substrate specificities of MexAB-OprM, MexCD-OprJ, and MexXY-oprM efflux pumps in Pseudomonas aeruginosa. Antimicrob. Agents Chemother. 2000, 44, 3322–3327. [Google Scholar] [CrossRef] [PubMed] [Green Version]
  44. Gillis, R.J.; White, K.G.; Choi, K.-H.; Wagner, V.E.; Schweizer, H.P.; Iglewski, B.H. Molecular Basis of Azithromycin-Resistant Pseudomonas aeruginosa Biofilms. Antimicrob. Agents Chemother. 2005, 49, 3858–3867. [Google Scholar] [CrossRef] [Green Version]
  45. Pamp, S.J.; Gjermansen, M.; Johansen, H.K.; Tolker-Nielsen, T. Tolerance to the antimicrobial peptide colistin in Pseudomonas aeruginosa biofilms is linked to metabolically active cells, and depends on the pmr and mexAB-oprM genes. Mol. Microbiol. 2008, 68, 223–240. [Google Scholar] [CrossRef]
  46. Yang, L.; Chen, L.; Shen, L.; Surette, M.; Duan, K. Inactivation of MuxABC-OpmB transporter system in Pseudomonas aeruginosa leads to increased ampicillin and carbenicillin resistance and decreased virulence. J. Microbiol. 2011, 49, 107–114. [Google Scholar] [CrossRef]
  47. Bayston, R.; Ashraf, W.; Ortori, C. Does release of antimicrobial agents from impregnated external ventricular drainage catheters affect the diagnosis of ventriculitis? J. Neurosurg. 2016, 124, 375–381. [Google Scholar] [CrossRef]
  48. Dinos, G.P. The macrolide antibiotic renaissance. Br. J. Pharmacol. 2017, 174, 2967–2983. [Google Scholar] [CrossRef]
  49. Ding, Y.; Teo, J.W.P.; Drautz-Moses, D.I.; Schuster, S.C.; Givskov, M.; Yang, L. Acquisition of resistance to carbapenem and macrolide-mediated quorum sensing inhibition by Pseudomonas aeruginosa via ICETn43716385. Commun. Biol. 2018, 1, 1–10. [Google Scholar] [CrossRef] [Green Version]
  50. Lin, X.; Lin, L.; Yao, Z.; Li, W.; Sun, L.; Zhang, D.; Luo, J.; Lin, W. An integrated quantitative and targeted proteomics reveals fitness mechanisms of Aeromonas hydrophila under oxytetracycline stress. J. Proteome Res. 2015, 14, 1515–1525. [Google Scholar] [CrossRef]
  51. Zhu, J.-H.; Wang, B.-W.; Pan, M.; Zeng, Y.-N.; Rego, H.; Javid, B. Rifampicin can induce antibiotic tolerance in mycobacteria via paradoxical changes in rpoB transcription. Nat. Commun. 2018, 9, 1–13. [Google Scholar] [CrossRef] [Green Version]
  52. Giddey, A.; De Kock, E.; Nakedi, K.C.; Garnett, S.; Nel, A.J.M.; Soares, N.C.; Blackburn, J.M. A temporal proteome dynamics study reveals the molecular basis of induced phenotypic resistance in Mycobacterium smegmatis at sub-lethal rifampicin concentrations. Sci. Rep. 2017, 7, srep43858. [Google Scholar] [CrossRef] [Green Version]
  53. Morita, Y.; Tomida, J.; Kawamura, Y. Responses of Pseudomonas aeruginosa to antimicrobials. Front. Microbiol. 2014, 4, 422. [Google Scholar] [CrossRef] [Green Version]
  54. Tart, A.H.; Wolfgang, M.C.; Wozniak, D.J. The Alternative Sigma Factor AlgT Represses Pseudomonas aeruginosa Flagellum Biosynthesis by Inhibiting Expression of fleQ. J. Bacteriol. 2005, 187, 7955–7962. [Google Scholar] [CrossRef] [Green Version]
  55. Kawamura-Sato, K.; Iinuma, Y.; Hasegawa, T.; Horii, T.; Yamashino, T.; Ohta, M. Effect of Subinhibitory Concentrations of Macrolides on Expression of Flagellin in Pseudomonas aeruginosa and Proteus mirabilis. Antimicrob. Agents Chemother. 2000, 44, 2869–2872. [Google Scholar] [CrossRef] [PubMed] [Green Version]
  56. Diepold, A.; Armitage, J.P. Type III secretion systems: The bacterial flagellum and the injectisome. Philos. Trans. R. Soc. Lond. B Biol. Sci. 2015, 370. [Google Scholar] [CrossRef] [PubMed] [Green Version]
  57. Bader, M.W.; Navarre, W.; Shiau, W.; Nikaido, H.; Frye, J.; McClelland, M.; Fang, F.; Miller, S.I. Regulation of Salmonella typhimurium virulence gene expression by cationic antimicrobial peptides. Mol. Microbiol. 2003, 50, 219–230. [Google Scholar] [CrossRef] [PubMed]
  58. Yim, G.; de la Cruz, F.; Spiegelman, G.B.; Davies, J. Transcription Modulation of Salmonella enterica Serovar Typhimurium Promoters by Sub-MIC Levels of Rifampin. J. Bacteriol. 2006, 188, 7988–7991. [Google Scholar] [CrossRef] [Green Version]
  59. Soscia, C.; Hachani, A.; Bernadac, A.; Filloux, A.; Bleves, S. Cross Talk between Type III Secretion and Flagellar Assembly Systems in Pseudomonas aeruginosa. J. Bacteriol. 2007, 189, 3124–3132. [Google Scholar] [CrossRef] [Green Version]
  60. Filloux, A. Protein Secretion Systems in Pseudomonas aeruginosa: An Essay on Diversity, Evolution, and Function. Front. Microbiol. 2011, 2, 155. [Google Scholar] [CrossRef] [Green Version]
  61. Zhu, J.; Weng, X.; Jiang, R.; Wu, J.; Mi, Z. Transcriptomic response of uropathogenic Escherichia coli to Taraxacum mongolicum. Int. J. Clin. Exp. Med. 2017, 10, 12030–12043. [Google Scholar]
  62. Losada, L.; Shea, A.A.; DeShazer, D. A MarR family transcriptional regulator and subinhibitory antibiotics regulate type VI secretion gene clusters in Burkholderia pseudomallei. Microbiology 2018, 164, 1196–1211. [Google Scholar] [CrossRef] [PubMed]
  63. Liu, L.; Ye, M.; Li, X.; Li, J.; Deng, Z.; Yao, Y.-F.; Ou, H.-Y. Identification and Characterization of an Antibacterial Type VI Secretion System in the Carbapenem-Resistant Strain Klebsiella pneumoniae HS11286. Front. Cell. Infect. Microbiol. 2017, 7, 442. [Google Scholar] [CrossRef] [PubMed] [Green Version]
  64. Penesyan, A.; Nagy, S.S.; Kjelleberg, S.; Gillings, M.R.; Paulsen, I. Rapid microevolution of biofilm cells in response to antibiotics. NPJ Biofilms Microb. 2019, 5, 1–14. [Google Scholar] [CrossRef] [Green Version]
  65. Wozniak, D.J.; Keyser, R. Effects of Subinhibitory Concentrations of Macrolide Antibiotics on Pseudomonas aeruginosa. Chest 2004, 125, 62S–69S. [Google Scholar] [CrossRef] [PubMed]
  66. Nalca, Y.; Jänsch, L.; Bredenbruch, F.; Geffers, R.; Buer, J.; Häussler, S. Quorum-Sensing Antagonistic Activities of Azithromycin in Pseudomonas aeruginosa PAO1: A Global Approach. Antimicrob. Agents Chemother. 2006, 50, 1680–1688. [Google Scholar] [CrossRef] [Green Version]
  67. Swatton, J.E.; Davenport, P.W.; Maunders, E.A.; Griffin, J.L.; Lilley, K.S.; Welch, M. Impact of Azithromycin on the Quorum Sensing-Controlled Proteome of Pseudomonas aeruginosa. PLoS ONE 2016, 11, e0147698. [Google Scholar] [CrossRef] [Green Version]
  68. Wei, Q.; Ma, L.Z. Biofilm matrix and its regulation in Pseudomonas aeruginosa. Int. J. Mol. Sci. 2013, 14, 20983–21005. [Google Scholar] [CrossRef]
  69. Liu, X.; Shen, B.; Du, P.; Wang, N.; Wang, J.; Li, J.; Sun, A. Transcriptomic analysis of the response of Pseudomonas fluorescens to epigallocatechin gallate by RNA-seq. PLoS ONE 2017, 12, e0177938. [Google Scholar] [CrossRef] [Green Version]
  70. Springer, B.; Kidan, Y.G.; Prammananan, T.; Ellrott, K.; Bottger, E.C.; Sander, P. Mechanisms of streptomycin resistance: Selection of mutations in the 16S rRNA gene conferring resistance. Antimicrob. Agents Chemother. 2001, 45, 2877–2884. [Google Scholar] [CrossRef] [Green Version]
  71. Park, A.J.; Murphy, K.; Krieger, J.R.; Brewer, D.; Taylor, P.; Habash, M.; Khursigara, C.M. A temporal examination of the planktonic and biofilm proteome of whole cell Pseudomonas aeruginosa PAO1 using quantitative mass spectrometry. Mol. Cell Proteom. 2014, 13, 1095–1105. [Google Scholar] [CrossRef] [PubMed] [Green Version]
  72. Burrows, L.L. Pseudomonas aeruginosaTwitching Motility: Type IV Pili in Action. Annu. Rev. Microbiol. 2012, 66, 493–520. [Google Scholar] [CrossRef] [PubMed] [Green Version]
  73. Zhang, Y.; Sass, A.; Van Acker, H.; Wille, J.; Verhasselt, B.; Van Nieuwerburgh, F.; Kaever, V.; Crabbe, A.; Coenye, T. Coumarin Reduces Virulence and Biofilm Formation in Pseudomonas aeruginosa by Affecting Quorum Sensing, Type III Secretion and C-di-GMP Levels. Front. Microbiol. 2018, 9, 1952. [Google Scholar] [CrossRef] [PubMed] [Green Version]
Figure 1. FESEM images of P. aeruginosa PAO1 biofilm cells after 144 h. The scale bar in all the images corresponds to 2.0 μm. (A) Air–liquid interface biofilm grown with control catheters, (B) air–liquid interface biofilm grown with antibiotic-impregnated catheters (Arrow indicates a swollen cell), (C) biofilm cells on control catheters and (D) biofilm cells on antibiotic-impregnated catheters (Arrow indicates an elongated cell).
Antibiotics 10 00752 g001
Figure 2. Venn diagram (A) and heatmap analysis (B) of P. aeruginosa PAO1 proteomic data. PAO1-C-P: planktonic cells grown with control catheters; PAO1-A-P: planktonic cells grown with antibiotic-coated catheters; PAO1-C-B: biofilm cells grown with control catheters; PAO1-A-B: biofilm cells grown with antibiotic-coated catheters.
Antibiotics 10 00752 g002
Figure 3. COG functional classification of the planktonic (A) and biofilm (B) cells grown with control and antibiotic-impregnated catheters. Y-axis with positive and negative values referring to upregulated and downregulated proteins, respectively. CELLULAR PROCESSES AND SIGNALING; (D) cell cycle control, cell division and chromosome partitioning; (M) cell wall/membrane/envelope biogenesis; (N) cell motility; (O) post-translational modification, protein turnover and chaperones; (T) signal transduction mechanisms; (U) intracellular trafficking, secretion and vesicular transport; (V) defense mechanisms. INFORMATION STORAGE AND PROCESSING; (A) RNA processing and modification; (J) translation, ribosomal structure and biogenesis; (K) transcription; (L) replication, recombination and repair. METABOLISM; (C) energy production and conversion, (E) amino acid transport and metabolism; (F) nucleotide transport and metabolism; (G) carbohydrate transport and metabolism; (H) coenzyme transport and metabolism; (I) lipid transport and metabolism; (P) inorganic ion transport and metabolism; (Q) secondary metabolites biosynthesis, transport and catabolism; POORLY CHARACTERIZED; (R) general function prediction only; (S) function unknown.
Antibiotics 10 00752 g003
Figure 4. Comparison of KEGG pathways of over-expressed proteins from the planktonic (A) and biofilm (B) cells grown in control and antibiotic-impregnated catheters.
Antibiotics 10 00752 g004
Figure 5. (A) Growth curve of strain PAO1 containing various mixtures of clindamycin and rifampicin (3.2 and 0.4, 6.4 and 0.8, 12.8 and 1.6 and 25.6 and 3.2 µg/mL, respectively) in TSB. Experiments were performed in triplicate to calculate the mean and standard deviation. (B) Accumulation of ethidium bromide in strain PAO1 containing a mixture of clindamycin (6.4 µg/mL) and rifampicin (0.8 µg/mL) in TSB. The natural fluorescence of the cells was subtracted and the fluorescence intensity was expressed in relative fluorescence units (RFU). All experiments were performed in triplicate. Error bars indicate standard deviation from the mean. (C) Invasion of P. aeruginosa PAO1 in the human cervical epithelial adenocarcinoma HeLa (ATCC CCL-2) cells. The % of invasion was calculated by dividing the number of invaded cells by the initial number of inoculated bacteria. The assays were performed in quadruplicate and data are represented as mean ± SD. Data were subjected to a one-way analysis of variance followed by a Tukey’s post hoc test. Differences were considered statistically significant (*) when p < 0.05. CP: planktonic cells grown with control catheter; CB: biofilm cells grown with control catheters; AP: planktonic cells grown with antibiotic-impregnated catheter; AB: biofilm cells grown with antibiotic-impregnated catheter.
Antibiotics 10 00752 g005
Figure 6. (A) Protein–protein interaction network analysis of DEPs associated with antibiotic resistance of planktonic cells grown with the control and antibiotic-impregnated catheters using STRING. The following proteins of P. aeruginosa were matched with input proteins: oprB: oprB1, oprM: oprM_3, oprD: oprD1, tufB: tufA3, fpvA: DR97-6034 and fusA2: fusB. Proteins that STRING could not find in the database: oprB2. (B) Protein–protein interaction network analysis of DEPs associated with virulence of planktonic cells grown with control and antibiotic-impregnated catheters using STRING. The following proteins of P. aeruginosa were matched with input proteins: pcrH: lcrH, popD: pepD, fpvA: DR97_6034, phzB2: phzB1, fimV: DR97_4587, xcpT: DR97_4832 and popB: yopB. Proteins STRING could not find in the database: PA1096, PA2412, PA2393, PA3352, pvdP, tagQ1 and tssB1. (C) Protein–protein interaction network analysis of DEPs associated with antibiotic resistance of biofilm cells grown with control and antibiotic-impregnated catheters using STRING. The following proteins of P. aeruginosa were matched with input proteins: tufB: tufA3 and oprM: oprM_3. (D) Protein–protein interaction network analysis of DEPs associated with the virulence of biofilm cells grown with control and antibiotic-impregnated catheters using STRING. The following proteins of P. aeruginosa were matched with input proteins: exoT: aexT1, pvdF: PA2396, pcrH: lcrH, popD: pepD and popB: yopB. Proteins that STRING could not find in the database: PA2393, PA3352 and tssB1.
Antibiotics 10 00752 g006
Table 1. Identified proteins associated with antibiotic resistance of planktonic cells grown with control and antibiotic-impregnated catheters.
Locus TagGeneProductFold Ratio
PA0156triAMultidrug efflux system, membrane fusion component0.97
PA0291oprEOuter membrane low permeability porin, OprD family 0.00
PA0425mexAMultidrug efflux system, membrane fusion component0.71
PA0427oprMMultidrug efflux system, outer membrane factor lipoprotein18.38
PA0958oprDOuter membrane low permeability porin, OprD family 13.16
PA1178oprHPhoP/Q and low Mg2+ inducible outer membrane protein H1 precursor1000.00
PA1777oprFNonspecific porin and structural outer membrane protein OprF1.41
PA2071fusA2Translation elongation factor G1.37
PA2291oprB2Probable glucose-sensitive porin1000.00
PA2398fpvAFerripyoverdine receptor1000.00
PA2525opmBOuter membrane factor (OMF) lipoprotein associated with MdtABC efflux system0.00
PA2950fabVEnoyl-[acyl-carrier-protein] reductase [NADH] 6.63
PA3186oprBGlucose/carbohydrate outer membrane porin OprB precursor 1000.00
PA4248rplFLSU ribosomal protein L6p (L9e)3.21
PA4264rpsJSSU ribosomal protein S10p (S20e)19.09
PA4266fusA1Translation elongation factor G3.45
PA4269rpoCDNA-directed RNA polymerase beta subunit 6.81
PA4270rpoBDNA-directed RNA polymerase beta subunit 13.15
PA4277tufBTranslation elongation factor Tu3.46
PA4974 Outer membrane channel TolC (OpmH)1.04
PA5239rhoTranscription termination factor Rho6.61
Table 2. Identified proteins associated with virulence of planktonic cells grown with control and antibiotic-impregnated catheters.
Locus TagGeneProductFold Ratio
PA0070 Autotransporter adhesin0.46
PA0083tssB1T6SS component TssB (ImpB/VipA)0.28
PA0408pilGTwitching motility protein PilG0.00
PA0409pilHTwitching motility protein PilH0.79
PA0411pilJTwitching motility protein PilJ0.74
PA0413chpAStill frameshift probable component of chemotactic signal transduction system1.00
PA0763mucASigma factor RpoE negative regulatory protein RseA1000.00
PA0764mucBSigma factor RpoE negative regulatory protein RseB precursor0.00
PA0766mucDHtrA protease/chaperone protein0.72
PA1086flgKFlagellar hook-associated protein FlgK0.00
PA1087flgLFlagellar hook-associated protein FlgL0.25
PA1092fliCFlagellin protein FlaB7.01
PA1094fliDFlagellar cap protein FliD0.13
PA1096 Two-component system sensor histidine kinase0.00
PA1097fleQFlagellar regulatory protein FleQ0.21
PA1101fliFFlagellar M-ring protein FliF0.00
PA1103fliHFlagellar assembly protein FliH0.06
PA1104fliIFlagellum-specific ATP synthase FliI0.00
PA1445fliOFlagellar biosynthesis protein FliO0.00
PA1707pcrHType III secretion chaperone protein for YopD (SycD)1000.00
PA1708popBType III secretion host injection protein (YopB)0.00
PA1709popDType III secretion host injection and negative regulator protein (YopD)1000.00
PA1900phzB2Phenazine biosynthesis protein PhzB1000.00
PA2385pvdQAcyl-homoserine lactone acylase PvdQ 24.33
PA2392pvdPPyoverdine biosynthesis related protein PvdP0.00
PA2393 Putative dipeptidase, pyoverdin biosynthesis PvdM7.82
PA2395pvdOPvdO, pyoverdine responsive serine/threonine kinase (predicted by OlgaV)2.22
PA2396pvdFPyoverdine synthetase PvdF, N5-hydroxyornithine formyltransferase1.05
PA2398fpvAOuter membrane ferripyoverdine receptor FpvA1000.00
PA2412 MbtH-like NRPS chaperone1000.00
PA2424pvdLPyoverdine chromophore precursor synthetase PvdL 0.00
PA3101xcpTGeneral secretion pathway protein G0.32
PA3104xcpPGeneral secretion pathway protein C0.00
PA3115fimVProbable type IV pilus assembly FimV-related transmembrane protein0.43
PA3351flgMNegative regulator of flagellin synthesis FlgM (anti-sigma28)0.44
PA3352 Flagellar biosynthesis protein FlgN4.30
PA3805pilFType IV pilus biogenesis protein PilF0.56
PA4211phzB1Phenazine biosynthesis protein PhzB1000.00
PA4230pchBIsochorismate pyruvate-lyase 0.69
PA4525pilAType IV pilin PilA1.21
PA4555pilY2Type IV fimbrial biogenesis protein PilY20.00
PA4953motBFlagellar motor rotation protein MotB15.08
PA5042pilOType IV pilus biogenesis protein PilO0.90
PA5253algPAlginate regulatory protein AlgP0.07
PA5255algQAlginate regulatory protein AlgQ1000.00
PA5322algCPhosphoglucomutase 1000.00
Table 3. Identified proteins associated with antibiotic resistance of biofilm cells grown with control and antibiotic-impregnated catheters.
Locus TagGeneProductFold Ratio
PA0156 Multidrug efflux system, membrane fusion component0.97
PA0427oprMMultidrug efflux system, outer membrane factor lipoprotein1000.00
PA1777oprFNonspecific porin and structural outer membrane protein OprF1.29
PA4248rplFLSU ribosomal protein L6p (L9e)1.69
PA4264rpsJSSU ribosomal protein S10p (S20e)2.17
PA4266fusA1Translation elongation factor G4.60
PA4268rpsLSSU ribosomal protein S12p (S23e)1000.00
PA4269rpoCDNA-directed RNA polymerase beta subunit 2.68
PA4277tufBTranslation elongation factor Tu2.06
PA4974 Outer membrane channel TolC (OpmH)1.13
PA5239rhoTranscription termination factor Rho0.08
Table 4. Identified proteins associated with virulence of biofilm cells grown with control and antibiotic-impregnated catheters.
Locus TagGeneProductFold Ratio
PA0044exoTHypothetical protein1000.00
PA0070 Autotransporter adhesin0.69
PA0083 T6SS component TssB (ImpB/VipA)0.00
PA0408pilGTwitching motility protein PilG0.77
PA0409pilHTwitching motility protein PilH0.66
PA0411pilJTwitching motility protein PilJ0.92
PA0413chpAStill frameshift probable component of chemotactic signal transduction system0.27
PA0763mucASigma factor RpoE negative regulatory protein RseA0.00
PA0766mucDHtrA protease/chaperone protein2.88
PA1086flgKFlagellar hook-associated protein FlgK0.40
PA1087flgLFlagellar hook-associated protein FlgL0.95
PA1092fliCFlagellin protein FlaB1.67
PA1094fliDFlagellar cap protein FliD0.74
PA1096 Two-component system sensor histidine kinase1.29
PA1097fleQFlagellar regulatory protein FleQ0.73
PA1101fliFFlagellar M-ring protein FliF0.00
PA1103fliHFlagellar assembly protein FliH0.77
PA1444fliNFlagellar motor switch protein FliN1000.00
PA1707pcrHType III secretion chaperone protein for YopD (SycD)2.54
PA1708popBType III secretion host injection protein (YopB)0.00
PA1709popDType III secretion host injection and negative regulator protein (YopD)0.41
PA1722pscIType III secretion cytoplasmic protein (YscI)1000.00
PA2385pvdQAcyl-homoserine lactone acylase PvdQ0.96
PA2393 Putative dipeptidase4.00
PA2395pvdOPvdO, pyoverdine responsive serine/threonine kinase 0.59
PA2396pvdFPyoverdine synthetase PvdF, N5-hydroxyornithine formyltransferase5.19
PA2412 MbtH-like NRPS chaperone1.69
PA2413pvdHPyoverdin biosynthesis protein PvdH1.18
PA3101xcpTGeneral secretion pathway protein G1.31
PA3104xcpPGeneral secretion pathway protein C0.00
PA3115fimVProbable type IV pilus assembly FimV-related transmembrane protein0.69
PA3351flgMNegative regulator of flagellin synthesis FlgM (anti-sigma28)0.81
PA3352 Flagellar biosynthesis protein FlgN0.07
PA3805pilFType IV pilus biogenesis protein PilF0.18
PA4211phzB1Phenazine biosynthesis protein PhzB1000.00
PA4226pchEDihydroaeruginoate synthetase PchE0.00
PA4230pchBIsochorismate pyruvate-lyase0.75
PA4525pilAType IV pilin PilA21.73
PA4550fimUtype 4 fimbrial biogenesis protein FimU0.00
PA4553pilXType IV fimbrial biogenesis protein PilX0.00
PA4953motBFlagellar motor rotation protein MotB0.00
PA5041pilPType IV pilus biogenesis protein PilP1.31
PA5042pilOType IV pilus biogenesis protein PilO0.00
PA5253algPAlginate regulatory protein AlgP1.29
Publisher’s Note: MDPI stays neutral with regard to jurisdictional claims in published maps and institutional affiliations.

