Abstract
Staphylococcus aureus (S. aureus) infections are notoriously complicated by the ability of the organism to grow in biofilms and are difficult to eradicate with antimicrobial therapy. The purpose of the current study was to clarify the influence of sub-inhibitory concentrations (sub-MICs) of daptomycin and tigecycline antibiotics on biofilm adhesion factors and exoproteins expressions by S. aureus clinical isolates. Six clinical isolates representing positive biofilm S. aureus clones (3 methicillin-sensitive S. aureus (MSSA) and 3 methicillin-resistant S. aureus (MRSA)) were grown with sub-MICs (0.5 MIC) of two antibiotics (daptomycin and tigecycline) for 12 h of incubation. RNA extracted from culture pellets was used via relative quantitative real-time-PCR (qRT-PCR) to determine expression of specific adhesion (fnbA, fnbB, clfA, clfB, fib, ebps, cna, eno) and biofilm (icaADBC) genes. To examine the effect of sub-MIC of these antibiotics on the expression of extracellular proteins, samples from the culture supernatants of six isolates were collected after 12 h of treatment with or without tigecycline in order to profile protein production via 2D gel sodium dodecyl sulfate-polyacrylamide gel electrophoresis (2D gel-SDS-PAGE). Sub-MIC treatment of all clinical MRSA and MSSA strains with daptomycin or tigecycline dramatically induced or suppressed fnbA, fnbB, clfA, clfB, fib, ebps, cna, eno, and icaADBC gene expression. Furthermore, sub-MIC use of tigecycline significantly reduced the total number of separated protein spots across all the isolates, as well as decreasing production of certain individual proteins. Collectively, this study showed very different responses in terms of both gene expression and protein secretion across the various isolates. In addition, our results suggest that sub-MIC usage of daptomycin and tigecycline could signal virulence induction by S. aureus via the regulation of biofilm adhesion factor genes and exoproteins. If translating findings to the clinical treatment of S. aureus, the therapeutic regimen should be adapted depending on antibiotic, the virulence factor and strain type.
1. Introduction
Staphylococcus aureus (S. aureus) is a major problem in many clinical situations, and antibiotic-resistant forms are classified as a “high priority” pathogen by the World Health Organization (WHO) [1]. Additionally, most S. aureus infections are thought to involve biofilm-forming isolates [2]. Since adherence is the initial step of many infectious processes [3], the ability of antibiotics to affect this property may be an important criterion in selecting an antibiotic for clinical therapy [4]. Current strategies for treating S. aureus infections reduce its virulence rather than directly killing it [5]. However, whether sub-inhibitory antibiotics can effectively reduce the rate of S. aureus resistance is still controversial [6]. For example, in vitro data has shown that S. aureus α-toxin production is significantly decreased by sub-inhibitory concentrations of amoxicillin, gentamicin, and moxifloxacin [7], whereas sub-inhibitory concentrations of β-lactam antibiotics have been shown to lead to an increase in α-toxin production [8]. Linezolid has also been shown to suppress several virulence proteins [9]. A similar study conducted by Stevens et al. [10] found both clindamycin and linezolid markedly suppressed translation, but not transcription, of toxin genes in S. aureus. Their results suggest that protein-synthesis inhibition is an important consideration when selecting antimicrobial agents to treat infections caused by toxin-producing Gram-positive pathogens and that enhanced toxin production contributes to worse outcomes.
Vancomycin is known to inhibit the biosynthesis of the bacterial cell wall and is the most ideal drug to treat S. aureus infections [11]. However, increased use of vancomycin has led to the development of isolates with reduced susceptibility. The effects of sub-MIC vancomycin on adhesion factors and biofilm genes have been tested [12] as has daptomycin and tigecycline, which have been shown to be active against S. aureus when in biofilm formation [13]. Daptomycin is a cyclic lipopeptide antibiotic with potent bactericidal activity whose destruction of the cell membrane makes it an ideal antibiotic against most Gram-positive pathogens including vancomycin-resistant enterococci and MRSA [14]. It consists of a 13-member amino acid cyclic lipopeptide with a decanoyl side chain, which is inserted into the bacterial cell membrane, causing rapid membrane depolarization and potassium ion efflux [15]. Tigecycline is a new class of broad-spectrum antimicrobial agents known as a bacteriostatic glycylcyclines, which inhibit protein synthesis in both Gram-positive and Gram-negative organisms [16]. Using these two agents as sentinel examples of cell membrane and protein synthesis inhibitors, in the current study, we tested the in vitro effects of sub-MIC daptomycin and tigecycline on selected microbial surface components recognizing adhesive matrix molecules (MSCRAMMs) and biofilm formation, using RT-qPCR. Furthermore, the effect of sub-MIC tigecycline on the secretion of extracellular proteins produced by S. aureus was also assessed using 2D gel-SDS-PAGE.
2. Materials and Methods
2.1. Bacterial Isolates and Preparation of Antibiotics
Six different clinical isolates of S. aureus were utilized in this study. These isolates were received in the form of stock culture from the Medical Microbiology Laboratory, Faculty of Medicine and Health Sciences, University Putra Malaysia (UPM). They were previously garnered from Kuala Lumpur General Hospital (HKL), Malaysia. The sources of the isolates were from different infection sites of clinically ill patients. These isolates were previously characterized as different clones using SCCmec typing, spa sequencing, and MLST [17] and were sensitive to daptomycin and tigecycline. The isolates are known for their ability to form stable biofilms and were positive for the genes, fnbA, fnbB, clfA, clfB, fib, ebps, cna, eno and icaADBC (Table 1) [18]. Lyophilized daptomycin and tigecycline were purchased commercially (BOIRON, Selangor, Malaysia) and both were serially diluted in Mueller Hinton broth (MHB, Difco, Detroit, MI, USA) in 12-well microtiter plates to obtain final MICs for all the isolates. Daptomycin was also supplemented with Mueller Hinton broth containing calcium at 75 mg/L (physiological ionized Ca2+ concentration) and magnesium at 12.5 mg/L (SMHB-PCA). Stock solutions were then kept at −20 °C until required.

Table 1.
The S. aureus isolates used in this study.
2.2. Quantitation of Biofilms
The ability to form biofilms was investigated for all six MSSA and MRSA isolates using the safranin microtiter plate assay according to our previously described method [19].
2.3. MIC Determination
Daptomycin and tigecycline were serially diluted to obtain final concentrations ranging from 0.03–16 µg/mL. An equal volume of 100 µL with ~106 CFU/mL final inoculum of S. aureus was then added to each well containing a 1 ml stock solution of each antibiotic. Culture wells were incubated at 37 °C with constant shaking for 24 h. After incubation, concentrations at 0.5 × MIC for each respective isolate was then analyzed following Clinical and Laboratory Standards Institute (CLSI) guidelines [20]. The MIC was then read as the lowest concentration that completely inhibited bacterial growth. All experiments were done in triplicate.
2.4. Effects of Sub-MIC Daptomycin and Tigecycline on S. aureus Growth
An initial representative standard growth curve was established for each isolate using absorbance readings at 600 nm. Here, Mueller Hinton broth (MHB) media was inoculated with an overnight culture to achieve an inoculum of 106 CFU/mL (OD600 = 0.03), and cultures were divided into two flasks (50 mL each). Daptomycin and tigecycline were then added to one flask at the concentration determined for each antibiotic at 0.5 MIC. The second untreated flask was used as the control. Cultures were incubated at 37 °C with gentle shaking (150 rpm) and growth monitored every ~2 h for 24 h using absorbance readings. Cells in post-exponential phase were then taken for RT-qPCR and protein studies.
2.5. Effect of Sub-MIC Daptomycin and Tigecycline on S. aureus Adhesion and Biofilm Gene Expression.
This experiment was designed to test the effect of cell membrane and protein synthesis inhibitors on mRNA levels of adhesion and biofilm genes mentioned (Table 2). Six different S. aureus isolates were grown with and without 0.5 daptomycin or tigecycline for 12 h using the same steps described above to establish a growth curve. RNA was then extracted from each isolate, purified as described [19] and immediately converted to cDNA using the RevertAidTMfirst strand cDNA synthesis kit (Fermentas).
Table 2.
Sequences of oligonucleotide primers used for qPCR.
2.6. Primers and Their Specificities for qPCR
Gene-specific primers (Table 2) designed and synthesized in a previous study were utilized for this study. Annealing temperatures were optimized for each primer pair by the use of melting curve analysis and by post-PCR agarose gel electrophoresis for the products obtained, and all PCR products were confirmed by sequencing (Supplementary Section S1A,B) [21].
2.7. Quantitative Real-Time PCR and Analysis
Transcript levels of 12 genes were measured by qPCR (Eppendorf, Selangor, Malaysia), utilizing Power SYBR Green Master Mix (Bio-Rad, Shah Alam, Malaysia), following the manufacturer’s recommended protocol. Reactions were performed in triplicate using 96-well plates and the reaction volume was set at 20 µL per sample. All reactions contained 2 µL of cDNA, 10 µL of SYBR Green Master Mix, 0.5 µL of 100 µM of each primer, and 7 µL of sterile double RNase treated water. The reaction was started with an initial denaturation at 95 °C for 5 min and 40 amplification cycles of 95 °C for 30 s, 60 °C for 20 s and 72 °C for 30 s. Expression of the 12 target genes from the antibiotic treated samples were calculated relative to the untreated samples and an endogenous control (16S rRNA) to normalize the sample input. Transcription levels were determined using the relative standard curve method [22] and expressed as fold change. Resultant data were then analyzed using the Relative Expression Software Tool (REST) program [23]. The experiment was performed at least twice, and values were presented as the means of triplicate measured.
2.8. Effects of Sub-MIC Tigecycline on Secreted Proteins
In this study, we examined the effect of tigecycline on secreted proteins of six different isolates of S. aureus. Here, clinical isolates of S. aureus were treated with tigecycline (0.06–0.25 µg/mL) for 12 h or left untreated as a control. Supernatants were then collected and analyzed using 2D gel SDS-PAGE. Protein sample preparation was conducted as previously described (Atshan et al., 2015), where proteins were concentrated via tri-chloroacetic acid (TCA) precipitation. Protein concentration was then determined, where 25 µg of purified solubilized exoproteins was passively rehydrated in 125 µl rehydration buffer containing 1% DTT (Bio-Rad Laboratories, Ltd., Shah Alam, Malaysia) for 14 h on a 7 cm IPG strip (GE Healthcare Biosciences, Kuala Lumpur, Malaysia). Each strip was then overlaid with 2 mL of mineral oil to prevent evaporation and urea crystallization. IPG strips were placed in an isoelectric focusing instrument (PROTEAN IEF cell) and run using the three-step protocol (Table 3). Upon completion, strips were removed from the focusing unit, rinsed with ddH2O, and incubated with equilibration buffer I and II as recommended by the manufacturer (Bio-Rad). Crude protein mixtures were then separated using 12% acrylamide resolving gels. These were stained using silver stain plus kit (Bio-Rad Laboratories, Ltd.), and scanned using a GS-800 Mode Imager (Bio-Rad). Comparative secretomic analysis of the six clinical isolates of S. aureus was then conducted using the PDQuest software package (Bio-Rad).
Table 3.
Program parameters used in the Protean IEF Cell.
2.9. Liquid Chromatography-Mass Spectrometry (LC-MS)
Protein spots that were significantly dampened during treatment with sub-MIC tigecycline were identified and carefully excised as were their control counterparts. Excised gel pieces were then kept at −80 °C until analyzed using liquid chromatography-mass spectrometry by Proteomics International Pty. Ltd. (Nedlands, Australia).
2.10. Statistical Analysis
Student t-tests (Microsoft Excel 2007) were used to determine significant differences in the relative gene expression of treated and untreated isolates determined by qPCR. However, for comparative secretomic analysis, the PDQuest advanced 8.0.1 2D gel analysis software was used to normalize gel intensities. Student’s t-test (95% confidence interval) were then employed to determine any significant differences in spot intensity (p < 0.05) between treated and untreated samples. These experiments were performed in triplicate and repeated at least twice.
3. Results
3.1. Biofilm Quantitative Assay
Six isolates of MRSA and MSSA (Figure 1) were grown and found to be strongly adherent to inert surfaces. All isolates were found to have an OD490 values of >2.0, with MRSA-527 having the highest OD490 value, exceeding >3.0.
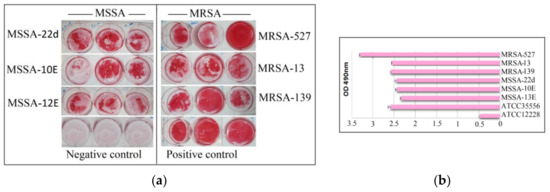
Figure 1.
Total biofilm formation of clinical MSSA and MRSA isolates. Biofilms from all isolated were successfully formed after sufficient incubation time on microtiter plates and stained with safranin for 48 h (a). Semi Quantitative analysis of biofilm production measured via the optical density of destained biofilms at 490 nm (b). Control: indicates reference positive biofilm producer ATCC 35556 and negative biofilm producer ATCC 12228 (a,b). Columns are mean readings from triplicate wells ± SD.
3.2. MIC Determination
All isolates assessed were found to be susceptible to daptomycin and tigecycline according to CLSI, [20] break points (Table 4). Furthermore, a very narrow range of 0.5 × MIC of both antibiotics, namely 0.06–0.25 µg/mL, was observed.
Table 4.
MIC and 0.5 MIC of daptomycin and tigecycline for the individual S. aureus isolates used in this study.
3.3. Effects of sub-MIC Daptomycin and Tigecyclineon Growth of S. aureus Isolates
As shown in Figure 2, growth curves were established for each isolate prior to and following the addition of sub-MIC levels of daptomycin and tigecycline. Untreated MRSA and MSSA isolates all actively grew over the course of the experiment (Figure 2; black curve). However, the addition of sub-MIC levels of both antibiotics resulted in slower bacterial growth, which became significant at 8 to 24 h later compared to the untreated antibiotics. Of note, 0.5 daptomycin had the best inhibitory effect on MRSA isolates (Figure 2; red curve) compared to tigecycline, while 0.5 tigecycline was more effective than daptomycin on MSSA isolates (Figure 2; blue curve).
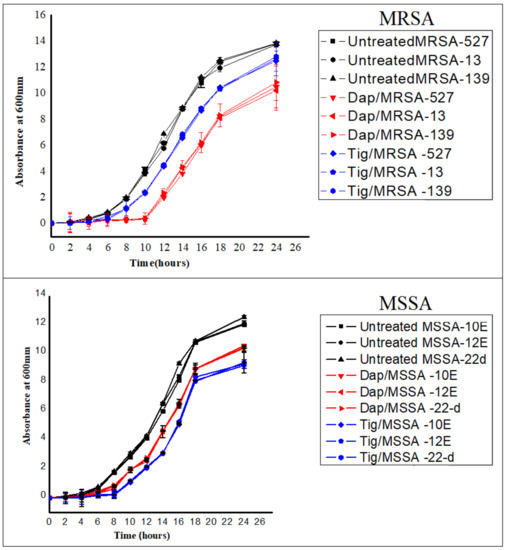
Figure 2.
Growth curves for six different isolates of S. aureus [three methicillin-resistant S. aureus (MRSA) and three methicillin-sensitive S. aureus (MSSA)]. No antibiotic (untreated), 0.5 Tig (tigecycline), 0.5 Dap (daptomycin). Cultures were started with an inoculum size of 106 cfu/mL and A600 nm of ~0.03, antibiotics at a concentration of 0.5 MIC were added at the early exponential phase (time zero), and cells were allowed to grow with and without antibiotics for ~24 h. Absorbances were then measured every 2 h. Values are presented as means ± SD from triplicate experiments.
3.4. Effects of Sub-MIC Daptomycin and Tigecycline Treatment on the Expression of Adhesion and Biofilm Genes
The relative expression of 12 adhesion and biofilms genes in treated isolates were calculated relative to the calibration of untreated isolates. Expression levels of adhesion and biofilm target genes were either up-regulated or down-regulated in response to the treatment among all isolates. Specifically, treatment with daptomycin induced overall target gene expression by 83.33%, 66.66%, 58.33% and 41.6% in MRSA isolate (13), MRSA (527), MSSA (10E) and MSSA (12E), respectively. Interestingly, it down regulated 83.33% of all target gene expression in MRSA (139) and 75% in MSSA (22d) (Table 5 and Supplementary Section S2A1–A6). In addition, some genes were highly up-regulated compared to other genes in the same isolate including: fib (22.98), eno (22.94), ebps (10.90) and cna (7.89) in MRSA (13), icaA (4.88), fib (2.38), fnbB (2.52) in MRSA (527), can (2.95) and icaC (2.57) in MSSA (10E), and eno (7.99), ebps (2.95) and finbB (2.79) in MSSA (12E). Sub-MIC tigecycline treatment of MSSA and MRSA was also found to modulate adhesion and biofilm gene expression in all isolates tested (Table 5 and Supplementary Section S2B1–B6). Here, tigecycline treatment caused an increase in mRNA levels in 100% of genes in MRSA (13), 83.33% of genes in MRSA (527), 58.3% of genes in MSSA (12E), 38.2% of genes in MSSA (10E). Treatment with tigecycline also caused the down regulation of 91.7% of all genes in MRSA (139) and 83.3% of genes in MSSA (22d). Minor, non-significant differences were observed with the remaining biofilm genes among the remaining isolates.
Table 5.
Relative expression of adhesion and biofilm target genes in cultures of six different isolates of S. aureus grown in the presence of sub- MIC daptomycinand sub-MIC tigecycline.
3.5. Effects of Sub-MIC Tigecycline Treatment on the Expression of Extracellular Proteins
Scans from three independent experiments were compared to determine differences in protein quantities between treated and untreated isolates (Figure 3 and Figure 4; Supplementary Section S3A,B). A comparison between secreted protein quantification pre- and post- treatment with tigecycline was then made (Figure 5). Secreted proteins displayed marked differences both in number as well as in spot intensity after treatment with tigecycline. For example, 40 secreted proteins were decreased in MSSA (10E) after treatment with tigecycline. Similar trends were observed in all other isolates with 6, 41, 30, 26, and 18 secreted proteins decreased in MSSA (12E), MSSA (22d), MRSA (13), MRSA (139), and MRSA (527), respectively. In addition, the intensity of each protein expressed pre- and post- treatment was also assessed. Results generated found that there was only a decrease in the number and intensity of the protein spots after treatment with tigecycline. Here, 10 strongly expressed spots were then identified via LC-MS, like Putative uncharacterized protein, Alkaline shock protein 23, Alkyl hydroperoxide reductase subunit C, protein SA21194_0967, Superoxide dismutase, Arabinose efflux permease family protein, Alcohol dehydrogenase, propanol-preferring, Exotoxin 15, Putative Cytochrome c4, and Putative septation protein spoVG (Table 6, Figure 6).
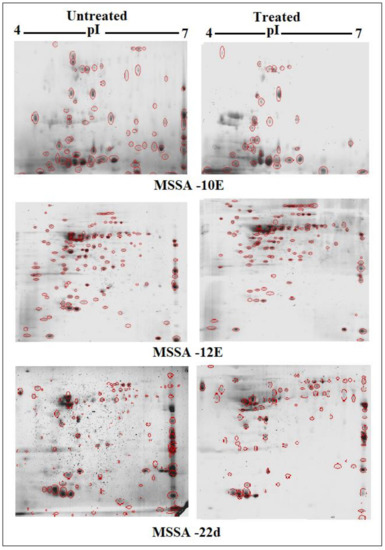
Figure 3.
Comparison of 2D gel protein patterns of three MSSA clinical isolates with and without tigecycline treatment. In total, 25 μg of the protein extract of each isolate was separated on 2D gels, using IPG strips (pI 4–7). Protein spots were stained with silver stain and scanned using Densitometer GS-800 Mode Imager. Red circles in each gel indicate protein spots of MSSA isolates before and after treatment with 0.5 tigecycline that were separated on 2D gels. These were then calculated by using PDQuest analyses software.
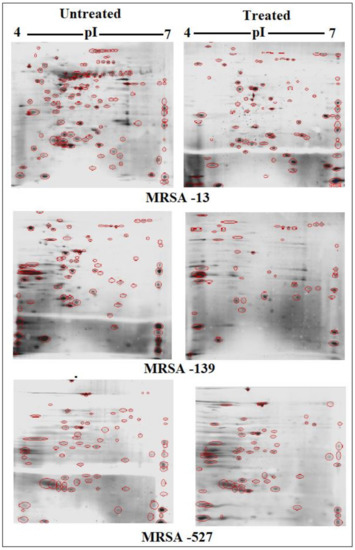
Figure 4.
Comparison of 2DE gel protein patterns of three MRRA clinical isolates with and without tigecycline treatment. In total, 25 μg of the protein extract of each isolate was separated on 2D gels, using IPG strips (pI 4–7). Protein spots were stained with silver stain and scanned using Densitometer GS-800 Mode Imager. Red circles in each gel indicate protein spots of MRSA isolates before and after treatment with 0.5 tigecycline that were separated on 2D gels. These were then calculated by using PDQuest analyses software.
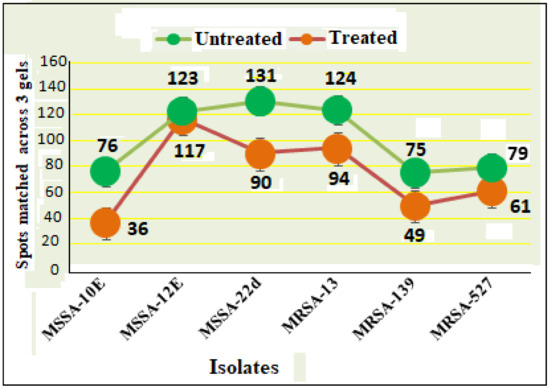
Figure 5.
Secreted protein profiles of six clinical isolates of S. aureus with and without 0.5 tigecycline treatment. Numerical values on the actual graph represent number of extracellular proteins (spots) among the six isolates before (green circle) and after treatment (pink circle) with 0.5 tigecycline. Bars indicate scans from three independent experiments; data was normalized using the regression model recommended by PDQuest software (BioRad).
Table 6.
Identification of highly significant down-regulated extracellular proteins in S. aureus clinical isolates MRSA (13), MRSA (527) and MRSA (139) after treatment with tigecycline by LC-MS.
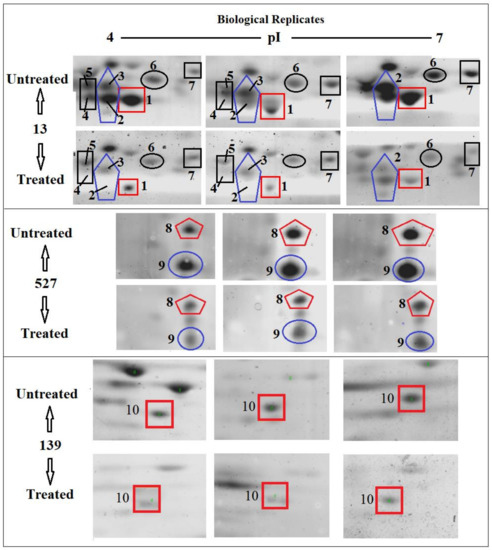
Figure 6.
Differences in the quantities of selected protein spots in S. aureus clinical isolate MRSA (13), MRSA (527) and MRSA (139) with and without tigecycline treatment. The tag number (1–10) indicates a spot that was down-expressed significantly after treatment with tigecycline. These spots were selected to identify the protein by LC-MS.
4. Discussion
Management of S. aureus infections has been hampered not only because of the increasing resistance to antibiotics but also because of the need to modulate bacterial virulence to reach clinical efficacy [24,25]. Virulence factors associated with bacterial attachment and biofilm development occur in the early exponential growth phases of infection and remain challenging to treat [26]. Prior work has evaluated virulence modification by sub-clindamycin, linezolid and beta-lactams but not for antibiotics within a similar class or with a similar mechanism of action [27]. Currently, some studies have shown that antivirulence therapy may be a potential treatment strategy in the post-antibiotic era [28]. Wang and colleagues also found that quercetin, a natural compound, can protect rats from catheter-related S. aureus infections by inhibiting coagulase activity [29]. In the present study, we report the modulatory effects of sub-inhibitory concentrations of daptomycin and tigecycline on S. aureus biofilm formation. These antibiotics were selected since they inhibit critical steps in the initial infection process, namely bacterial cell membrane adhesion and protein synthesis, which may be important considerations when selecting antimicrobial agents to combat staphylococcal infections. Initially, daptomycin and tigecycline were added to the exponential phase of bacterial growth, so that bacterial cells were active and were in the same physiological state. Growth curves were then established for each isolate used after the addition of sub-MIC levels of two antibiotics. Our results showed that daptomycin had a greater effect on MRSA isolates than tigecycline, with an opposite effect on MSSA isolates being observed. Despite this, both antibiotics did result in slower bacterial growth compared to untreated controls. These findings are similar to a previous study conducted by the same group, when using higher concentrations [13]. However, since we were targeting the start of bacterial adhesion, it is important to know whether there were any effects of daptomycin and tigecycline on adhesion factors and biofilm formation, especially since the clinical efficacy of antibiotics is not only estimated by their respective bactericidal or bacteriostatic activity, but also by their action on bacterial virulence factor release [30].
Results showed that exposure of S. aureus to sub-inhibitor concentrations of daptomycin significantly up-regulated the expression of the major biofilm-associated genes MSCRAMM, icaA, icaD, icaB, and icaC, in MRSA (13), MRSA (527) and MSSA (10E). In contrast, these genes were significantly decreased in MSSA (22d) and MRSA (139). However, most of the genes were not affected in MSSA (12E). Even with the use of the protein synthesis inhibitor, tigecycline, the effects on adhesion and biofilm genes were similarly modulated with an up-regulation of MSCRAMM, icaA, icaD, icaB, and icaC in most isolates. MSSA (10E) also showed that most genes were unaffected upon exposure to sub-inhibitor concentrations of tigecycline. This is a particularly important observation, since a positive gene response to these antibiotics, even at low concentrations, may imply a worse clinical outcome [31]. It is probable that daptomycin and tigecycline treatment generate signals in diverse physiological pathways, which are recognized by multiple signal sensors that in turn activate multiple response regulators including the genes measured in this study [32]. Alternatively, tigecycline and daptomycin may induce stress conditions that interact on regulatory genes, in particular genes involved in two-component regulatory systems (TCSs) such as the agr, saeRS, srrAB, arlSR and lytRS, or the recently identified SarA homologues (SarR, Rot, SarS, SarT, SarU) [33]. However, the conditions that activate TCSs are diverse and include exposure to antibiotics as well as other conditions inside the host and the resulting regulatory action often involves activation of antibiotic defenses and changes to cell physiology that in turn increases antibiotic resistance or induces cell surface modifications, and promotes biofilm formation [34]. It has also been suggested that tigecycline at sub-MIC binds to their known target sites on the ribosome, causing minor perturbations in ribosome function [27]. These effects may be responsible for a mechanism coupling transcription to translation, resulting in promoter-selective modulations of the former. The transmission of signals from ribosome to RNA polymerase due to sub-MIC of these antibiotics could also involve the release of small amounts of incomplete polypeptides, interference with ribosome assembly, induction of translation errors, or possibly interactions of small molecules with RNA [35]. Similarly, it was previously shown that sub-MIC of clindamycin stimulates synthesis of some MSCRAMM at transcription levels [36].
Due to the perplexing findings in mRNA levels observed, which may occur either by transcriptional modulation or by post transcriptional mechanisms involving mRNA turnover, an additional objective of this study was to determine whether secreted proteins expression levels correlated to mRNA expression. Using 2D SDS-PAGE, we were able to show that 608 secreted proteins were produced by the six different isolates before treatment with tigecycline in which 2DE images from the internal pooled standard were employed as a reference for comparative analyses using the PDQuest advanced Software. The number of secreted proteins (spots) were reduced to 447 after the treatment with tigecycline as shown in Figure 5. Moreover, intensity of identified spots were more than two-fold (p < 0.05) between treated and untreated isolates, and the rate of secreted protein production was found to decrease with tigecycline treated isolates compared to those that were untreated (Figure 6). This contrasts to findings made in another study that observed no effect on extracellular proteins in S. aureus strains when treated with tigecycline at sub-MIC levels [37]. One explanation for our findings is that incubation with sub-MICs of tigecycline may suppress signals in certain general metabolic pathways. One example is the two-component signaling pathway that contains a histidine kinase (HK), which responds to extracellular stimuli. Here, we show that S. aureus can be deprived of its complete sensorial two-component systems network and can still survive and replicate at low antibiotic concentrations [38]. In principle, protein synthesis inhibitors interact directly with the ribosome and stop peptide translation from mRNA [27]. Therefore, it is puzzling to have observed a decrease in exoprotein levels since the synthesis of negative regulators was inhibited. However, this may not have removed all suppressive effects and translation was affected as an indirect effect of antibiotic treatment. Another possibility is that the spot size of some proteins that are essential for bacteria to survive stressful conditions did not change or increase after tigecycline treatment [39].
In this experiment, some secreted proteins production was found to be highly reduced in terms of spot intensity after treatment with tigecycline (Figure 6). When some were identified by LC-MS, a number were found not to be typically exoproteins and more cytosolic in nature [40]. The presence of alkaline shock protein 23 ‘asp23′ in this study corroborates that of Goerke et al. [41] in which its activity would peak upon entry into the stationary growth phase when S. aureus are grown under stressful conditions. Work conducted previously has found higher asp23 expression in older biofilms [42] as well as the up-regulation of σB [41]. The alternative sigma factor, σB, and the accessory global regulator locus, agr, are two important virulence regulatory genes, which regulate the expression of several exo- and surface proteins in response to changing environmental conditions. Specifically, the effects seen with asp23 did indeed relate to altered sigB transcription, this commonality is no surprise, since exoprotein repression by σB is mediated through reduced agr activity, and the extracellular proteases are regulated in a similar, agr-dependent manner [43]. However, since the sensitivity of 2D SDS-PAGE does not yield an accurate quantification of weakly expressed proteins, the overall mean coefficient of variation was high among the six isolates before and after treatment with tigecycline. Furthermore, similarities in secreted proteins were also observed and found across the various isolates, since they shared the same position (location), and number or intensity of protein spots on the gel map as a result, variations in expression of these proteins may not have been identified [44]. Moreover, variations in the mRNA levels induced by sub-MICs of antibiotics do not always result in changes in exoprotein synthesis, which should be taken into account before further conclusions are drawn [45].
5. Conclusions
In conclusion, different responses in terms of both gene expression and protein secretion were found across all isolates in the present study, taking into account the up- and down-modulation of the expression of MSCRAMMs, icaA, icaD, icaB, and icaC genes, may be explained by the different transcription changes that occur in the presence of each antibiotic at low concentration. Despite this, tigecycline was shown in this study to be effective at dampening both the number and quantity of secreted proteins, even when a variety of the clonal types of S. aureus were used. Findings suggest that the ability of these antibiotics to efficiently treat clinical S. aureus infections may vary between strains. Further studies are needed to test if these antibiotics also act on the release of adhesion and biofilm genes in vivo, especially when present at suboptimal concentrations, and whether this action proves to be beneficial for patients with strain-specific S. aureus infections.
Supplementary Materials
The following are available online at https://www.mdpi.com/2079-6382/10/1/39/s1, Supplementary Section S1A: The specificity of each primer set for the amplification of adhesion and biofilm genes in this study, Supplementary Section S1B: Part of the raw cDNA sequence files of the targeted biofilm genes (icaA,D,B,C), adhesion genes (clfA, clfB, fnbA, fnbB, fib, ebps, eno, cna), and 16sRNA housekeeping region from MRSA-clone 527 sequenced directly from RT-PCR products, Supplementary Section S2A1: Relative Expression Ratio of 12 target genes in MSSA (10E), exposed to sub-MIC of daptomycin, Supplementary Section S2A2: Relative Expression Ratio of 12 target genes in MSSA (12E), exposed to sub-MIC of daptomycin, Supplementary Section S2A3; Relative Expression Ratio of 12 target genes in MSSA (22-d), exposed to sub-MIC of daptomycin, Supplementary Section S2A4: Relative Expression Ratio of 12 target genes in MRSA (139), exposed to sub-MIC of daptomycin, Supplementary Section S2A5: Relative Expression Ratio of 12 target genes in MRSA (13), exposed to sub-MIC of daptomycin, Supplementary Section S2A6: Relative Expression Ratio of 12 target genes in MRSA (527), exposed to sub-MIC of daptomycin, Supplementary Section S2B1: Relative Expression Ratio of 12 target genes in MSSA (10E), exposed to sub-MIC of tigecycline, Supplementary Section S2B2: Relative Expression Ratio of 12 target genes in MSSA (12E), exposed to sub-MIC of tigecycline, Supplementary Section S2B3: Relative Expression Ratio of 12 target genes in MSSA (22d), exposed to sub-MIC of tigecycline, Supplementary Section S2B4: Relative Expression Ratio of 12 target genes in MRSA (139), exposed to sub-MIC of tigecycline, Supplementary Section S2B5: Relative Expression Ratio of 12 target genes in MRSA (13), exposed to sub-MIC of tigecycline, Supplementary Section S2B6: Relative Expression Ratio of 12 target genes in MRSA (527), exposed to sub-MIC of tigecycline, Supplementary Section S3A: Comparing 2D gel protein patterns of MSSA clinical isolates with and without tigecycline treatment, Supplementary Section S3B: Comparing 2D gel protein patterns of MRSA clinical isolates with and without tigecycline treatment.
Author Contributions
S.S.A., R.A.H., Z.S., L.T.L.T. and S.A.A. designed the work and analyzed and interpreted data for the work. S.S.A., A.K., M.J.L.C., G.D. and B.J.M. drafted the work and revised it critically for important intellectual content. S.S.A. and A.K. provided approval for publication of the content, and agreed to be accountable for all aspects of the work in ensuring that questions related to the accuracy or integrity of any part of the work are appropriately investigated and resolved. All authors have read and agreed to the published version of the manuscript.
Funding
This work was supported by the Ministry of Science, Technology, and Innovation Malaysia (MOSTI, Putrajaya, Malaysia) Grant No. 5524112 to UPM.
Acknowledgments
We are indebted to the Department of Medical Microbiology, Faculty of Medicine and Health Sciences, Universiti Putra Malaysia for providing research facilities. A.K. is a Rothwell Family Fellow.
Conflicts of Interest
The authors declare that the research was conducted in the absence of any commercial or financial relationships that could be construed as a potential conflict of interest.
References
- Williams, R.J.; Henderson, B.; Sharp, L.J.; Nair, S.P. Identification of a Fibronectin-binding protein from Staphylococcus epidermidis. Infect Immun. 2002, 70, 6805–6810. [Google Scholar] [CrossRef]
- Cramton, S.E.; Gerke, C.; Schnell, N.F.; Nichols, W.W.; Götz, F. The intercellular adhesion (ica) locus is present in Staphylococcus aureus and is required for biofilm formation. Infect Immun. 1999, 67, 5427–5433. [Google Scholar] [CrossRef]
- Maree, C.L.; Robert, S.D.; Susan, B.V.; Kelli, M.; Loren, G.M. Community-associated methicillin-resistant Staphylococcus aureus isolates causing healthcare-associated infections. Emerg. Infect. Dis. 2007, 13, 236–242. [Google Scholar] [CrossRef]
- Kumaran, D.; Mariam, T.; Qi, L.Y.; Sandra, R.A.; Jean, S.D.; Alberto, C.; Hesham, A. Does treatment order matter? Investigating the ability of bacteriophage to augment antibiotic activity against staphylococcus aureus biofilms. Front. Microbiol. 2018, 9, 127. [Google Scholar] [CrossRef]
- Liu, L.; Shen, X.; Yu, J.; Cao, X.; Zhan, Q.; Guo, Y.; Yu, F. Subinhibitory Concentrations of Fusidic Acid May Reduce the Virulence of S. aureus by Down-Regulating sarA and saeRS to Reduce Biofilm Formation and α-Toxin Expression. Front. Microbiol. 2020, 11, 1–13. [Google Scholar] [CrossRef]
- Lehman, S.M.; Gillian, M.; Deborah, R.; Robert, A.C.; Frenk, S.; Steven, D.B.; Sandra, M. Design and Preclinical Development of a Phage Product for the Treatment of Antibiotic-Resistant Staphylococcus Aureus. Infect. Viruses 2019, 21, 11–88. [Google Scholar]
- Dieter, W.; Hayal, K.; Andrea, S.; Axel, D.; Konrad, B.; Gerd, D. Effects of Amoxicillin, Gentamicin, and Moxifloxacin on the Hemolytic Activity of Staphylococcus aureus In Vitro and In Vivo. Antimicrob. Agents Chemother. 2001, 45, 196–202. [Google Scholar]
- Bernardo, K.; Pakulat, N.; Fleer, S.; Schnaith, A.; Utermöhlen, O.; Krut, O.; Müller, S.; Krönke, M. Subinhibitory concentrations of linezolid reduce Staphylococcus aureus virulence factor expression. Antimicrob. Agents Chemother. 2004, 48, 546–555. [Google Scholar] [CrossRef]
- Gardete, S.; Wu, S.W.; Gill, S.; Tomasz, A. Role of VraSR in Antibiotic Resistance and Antibiotic-Induced Stress Response in Staphylococcus Aureus. Antimicrob. Agents Chemother. 2006, 50, 3424–3434. [Google Scholar] [CrossRef]
- Stevens, D.L.; Yongsheng, M.; Daniel, B.S.; Eric, M.; Randi, J.W.; Amy, E.B. Impact of antibiotics on expression of virulence- associated exotoxin genes in methicillinsensitive and methicillin-resistant Staphylococcus aureus. J. Infect Dis. 2007, 195, 202–211. [Google Scholar] [CrossRef]
- Aires, D.S.M.; Herminia, D.L. Bridges from hospitals to the laboratory: Genetic portraits of methicillin-resistant Staphylococcus aureus clones. Immunol. Med. Microbiol. 2004, 40, 101–111. [Google Scholar] [CrossRef]
- Majidpour, A.; Sara, F.; Mastaneh, A.; Mohammad, R.; Mina, B.; Marjan, H.; Leila, A.; Somayeh, S.M. Dose-Dependent Effects of Common Antibiotics Used to Treat Staphylococcus aureus on Biofilm Formation. Iran J. Pathol. 2017, 12, 362–370. [Google Scholar] [CrossRef]
- Atshan, S.S.; Mariana, N.S.; Leslie, T.T.; Zamberi, S.; Chong, P.P.; Arunkumar, K.; Jayakayatri, J.N.; Alreshidi, M.A.; Ehsanollah, G.R.; Salwa, A.A.; et al. Genotypically Different Clones of Staphylococcus aureus Are Diverse in the Antimicrobial Susceptibility Patterns and Biofilm Formations. BioMed Res. Int. 2013, 2013, 515712. [Google Scholar] [CrossRef]
- Sader, H.S.; Farrell, D.J.; Flamm, R.K.; Jones, R.N. Daptomycin activity tested against 164 457 bacterial isolates from hospitalised patients: Summary of 8 years of a worldwide surveillance Programme (2005–2012). Int. J. Antimicrob. Agents. 2014, 43, 465–469. [Google Scholar] [CrossRef]
- Pranav, H.N.; Vikram, K.Y.; Pathak, A.N. A Review on Daptomycin; the first US-FDA approved Lipopeptide antibiotics. J. Sci. Ind. Res. 2013, 25, 970–980. [Google Scholar]
- Shariati, A.; Masoud, D.; Zahra, C.; Alex, V.B.; Mehdi, M.; Seyed, S.K.; Davood, D. The global prevalence of Daptomycin, Tigecycline, Quinupristin/Dalfopristin, and Linezolid-resistant Staphylococcus aureus and coagulase–negative staphylococci strains: A systematic review and meta-analysis. Antimicrob. Resist. Infect. Control 2020, 9, 56. [Google Scholar] [CrossRef]
- Ghaznavi, R.E.; Nor, S.M.; Sekawi, Z.; Khoon, L.Y.; Aziz, M.N. Predominance and emergence of clones of hospital-acquired methicillin resistant Staphylococcus aureus in Malaysia. J. Clin. Microbiol. 2010, 48, 867–872. [Google Scholar] [CrossRef]
- Atshan, S.S.; Mariana, N.S.; Zamberi, S.; Leslie, T.T.L.; Rukman, A.H.; Arunkumar, K.; Alreshidi, M.A.; Ehsanollah, G.R.; Hamed, G.M.; Johnson, S.C.S.; et al. Prevalence of Adhesion and Regulation of Biofilm-Related Genes in Different Clones of Staphylococcus aureus. BioMed Res. Int. 2012, 2012, 976972. [Google Scholar]
- Atshan, S.S.; Mariana, N.S.; Leslie, T.T.L.; King, H.L.; Zamberi, S.; Chong, P.P.; Ehsanollah, G.R. Improved method for the isolation of RNA from bacteria refractory to disruption, including S. aureus producing biofilm. Gene 2012, 494, 219–224. [Google Scholar] [CrossRef]
- Clinical and Laboratory Standards Institute. Performance Standards for Antimicrobial Susceptibility Testing; Twenty-First Informational Supplement; Clinical and Laboratory Standards Institute: Wayne, PA, USA, 2011; Available online: https://vchmedical.ajums.ac.ir/_vchmedical/documents/CLSI%202011.pdf (accessed on 11 December 2020).
- Atshan, S.S.; Mariana, N.S.; Arunkumar, K.; Alex, V.B.; Leslie, T.T.L.; Zamberi, S.; Jayakayatri, J.N.; King, H.L.; Johnson, S.C.S.; Alreshidi, M.A.; et al. Quantitative PCR analysis of genes expressed during biofilm development of methicillin resistant Staphylococcus aureus. Infect. Genet. Evol. 2013, 18, 106–112. [Google Scholar] [CrossRef] [PubMed]
- Eleaume, H.; Jabbouri, D.S. Comparison of two standardisation methods in real-time quantitative RT-PCR to follow Staphylococcus aureus genes expression during in vitro growth. J. Med. Microbiol. 2004, 59, 363–370. [Google Scholar] [CrossRef] [PubMed]
- Matthew, H.; Chiew, D.; Pfaffl, M.W. New stand- alone software for gene expression analysis. Corbett Research: Sydney, Australia, 2006. Available online: http://rest.gene-quantification.info/ (accessed on 11 December 2020).
- Otto, M.P.; Emilie, M.; Cedric, B.; Segolene, L.; Michele, B.; Franc, V.; Jerome, E.; Gerard, L.; Oana, D. Effects of subinhibitory concentrations of antibiotics on virulence factor expression by community-acquired methicillin-resistant Staphylococcus aureus. J. Antimicrob. Chemother. 2013, 68, 1524–1532. [Google Scholar] [CrossRef] [PubMed]
- Gui, Z.; Wang, H.; Ding, T.; Zhu, W.; Zhuang, X.; Chu, W. Azithromycin reduces the production of hemolysin and biofilm formation in Staphylococcus aureus. Indian J. Microbiol. 2014, 54, 114–117. [Google Scholar] [CrossRef] [PubMed]
- Jo, A.; Ahn, J. Phenotypic and genotypic characterisation of multiple antibiotic-resistant Staphylococcus aureus exposed to subinhibitory levels of oxacillin and levofloxacin. BMC Microbiol. 2016, 16, 170. [Google Scholar] [CrossRef]
- Hodille, E.; Warren, R.; Binh, A.D.; Sylvain, G.; Gerard, L.; Oana, D. The Role of Antibiotics in Modulating Virulence in Staphylococcus aureus. Clin. Med. Res. 2017, 30, 16–20. [Google Scholar] [CrossRef]
- Teng, Z.; Dongxue, S.; Huanyu, L.; Ziying, S.; Yonghong, Z.; Wenhua, L.; Xuming, D.; Jianfeng, W. Lysionotin attenuates Staphylococcus aureus pathogenicity by inhibiting α-toxin expression. Appl. Microbiol. Biotechnol. 2017, 101, 6697–6703. [Google Scholar] [CrossRef]
- Wang, L.; Li, B.; Si, X.; Liu, X.; Deng, X.; Niu, X.; Jin, Y.; Wang, D.; Wang, J. Quercetin protects rats from catheter-related Staphylococcus aureus infections by inhibiting coagulase activity. J. Cell. Mol. Med. 2019, 23, 4808–4818. [Google Scholar] [CrossRef]
- Bhattacharya, G.; Dey, D.; Das, S.; Banerjee, A. Exposure to subinhibitory concentrations of gentamicin, ciprofloxacin and cefotaxime induces multidrug resistance and reactive oxygen species generation in methicillin sensitive Staphylococcus aureus. J. Med. Microbiol. 2017, 66, 762–769. [Google Scholar] [CrossRef]
- Abdulla, A.; Annemieke, D.; Nicole, G.M.; Hunfeld, H.E.; Soma, B.; Tim, M.J.; Ewoldt, A.E.; Muller, T.G.; Diederik, G.; Birgit, C.P.K. Failure of target attainment of beta-lactam antibiotics in critically ill patients and associated risk factors: A two-center prospective study. Crit. Care 2020, 24, 558. [Google Scholar] [CrossRef]
- Kuroda, M.H.; Kuroda, T.O.; Fumihiko, T.; Hirotada, M.; Keiichi, H. Two-component system VraSR positively modulates theregulation of cell-wall biosynthesis pathway in Staphylococcus Aureus. Mol. Microbiol. 2003, 49, 807–821. [Google Scholar] [CrossRef]
- Bronner, S.; Monteil, H.; Gilles, P. Regulation of virulence determinants in Staphylococcus aureus: Complexity and applications. FEMS Microbiol. 2004, 28, 183–200. [Google Scholar] [CrossRef] [PubMed]
- Aimee, R.P.T.; Philip, N.R. Roles of two-component regulatory systems in antibiotic resistance. Future Microbiol. 2019, 14, 6. [Google Scholar]
- Tsui, W.; Grace, Y.; Helena, H.W.; JoAnn, E.M.; Michael, G.S.; Julian, D. Dual Effects of MLS Antibiotics: Transcriptional Modulation and Interactions on the Ribosome. Chem. Biol. 2004, 11, 1307–1316. [Google Scholar] [CrossRef] [PubMed]
- Schilcher, K.; Federica, A.; Vanina, D.H.; Kati, S.; Barbara, H.; Annelies, S.Z. Modulation of Staphylococcus aureus Biofilm Matrix by Subinhibitory Concentrations of Clindamycin. Antimicrob. Agents Chemother. 2016, 60, 5957–5967. [Google Scholar] [CrossRef] [PubMed]
- Steven, J.P. Francis Tally and the Discovery and Development of Tigecycline: A Personal Reminiscence. Clin. Infect. Dis. 2010, 50, 24–25. [Google Scholar]
- Villanueva, M.; García, B.; Valle, J.; Rapún, B.; Igor, R.D.M.; Cristina, S.; Miguel, M.; José, R.P.; Alejandro, T.A.; Iñigo, L. Sensory deprivation in Staphylococcus aureus. Nat. Commun. 2018, 9, 523. [Google Scholar] [CrossRef]
- Deneve, C.; Claudine, D.; Marie, C.B.; Anne, C.; Claire, J. Antibiotics involved in Clostridium difficile associated disease increase colonization factor gene expression. J. Med. Microbiol. 2008, 57, 732–738. [Google Scholar] [CrossRef]
- Yang, Q.; Xuezhi, D.; Xuemei, L.; Shuang, L.; Yunjun, S.; Ziquan, Y. Differential proteomic profiling reveals regulatory proteins and novel links between primary metabolism and spinosad production in Saccharopolyspora spinosa. Microb. Cell Fact. 2014, 13, 27. [Google Scholar] [CrossRef]
- Goerke, C.; Fluckiger, U.; Steinhuber, A.; Bisanzio, V.; Ulrich, M.; Bischoff, M. Role of Staphylococcus aureus global regulators sae and sigma B in virulence gene expression during device-related infection. Infect. Immun. 2005, 73, 3415–3421. [Google Scholar] [CrossRef]
- Atshan, S.S.; Mariana, N.S.; Zamberi, S.; Leslie, T.T.L.; Fatemeh, B.; Yun, K.L.; Alreshidi, M.A.; Salwa, A.A.; Rukman, A.H. Comparative proteomic analysis of extracellular proteins expressed by various clone types of Staphylococcus aureus and during biofilm development growth. Front. Microbiol. 2015, 6, 524. [Google Scholar] [CrossRef]
- Shaw, L.N.; Joanne, A.; Jessica, E.; Davenport, M.C.; Brown, J.K.; Lithgow, K.S.; Howard, C.; James, T.; Jan, P.; Simon, J.F. Investigations into B-Modulated Regulatory Pathways Governing Extracellular Virulence Determinant Production in Staphylococcus aureus. J. Bacteriol. 2006, 188, 6070–6080. [Google Scholar] [CrossRef] [PubMed]
- Liu, X.; Hu, Y.; Pai, P.J.; Chen, D.; Lam, H. Label-free quantitative proteomics analysis of antibiotic response in Staphylococcus aureus to oxacillin. J. Proteome Res. 2014, 13, 1223–1233. [Google Scholar] [CrossRef] [PubMed]
- Awad, S.; Alharbi, A.E.; Alshami, I. Exposure of vancomycin-sensitive Staphylococcus aureus to subinhibitory levels of vancomycin leads to upregulated capsular gene expression. Br. J. Biomed. Sci. 2013, 70, 58–61. [Google Scholar] [CrossRef] [PubMed]
Publisher’s Note: MDPI stays neutral with regard to jurisdictional claims in published maps and institutional affiliations. |
© 2020 by the authors. Licensee MDPI, Basel, Switzerland. This article is an open access article distributed under the terms and conditions of the Creative Commons Attribution (CC BY) license (http://creativecommons.org/licenses/by/4.0/).