Biosensors to Monitor Water Quality Utilizing Insect Odorant-Binding Proteins as Detector Elements

Abstract
1. Introduction
2. Materials and Methods
2.1. Cloning AgamOBP1
2.2. Attenu Assay System
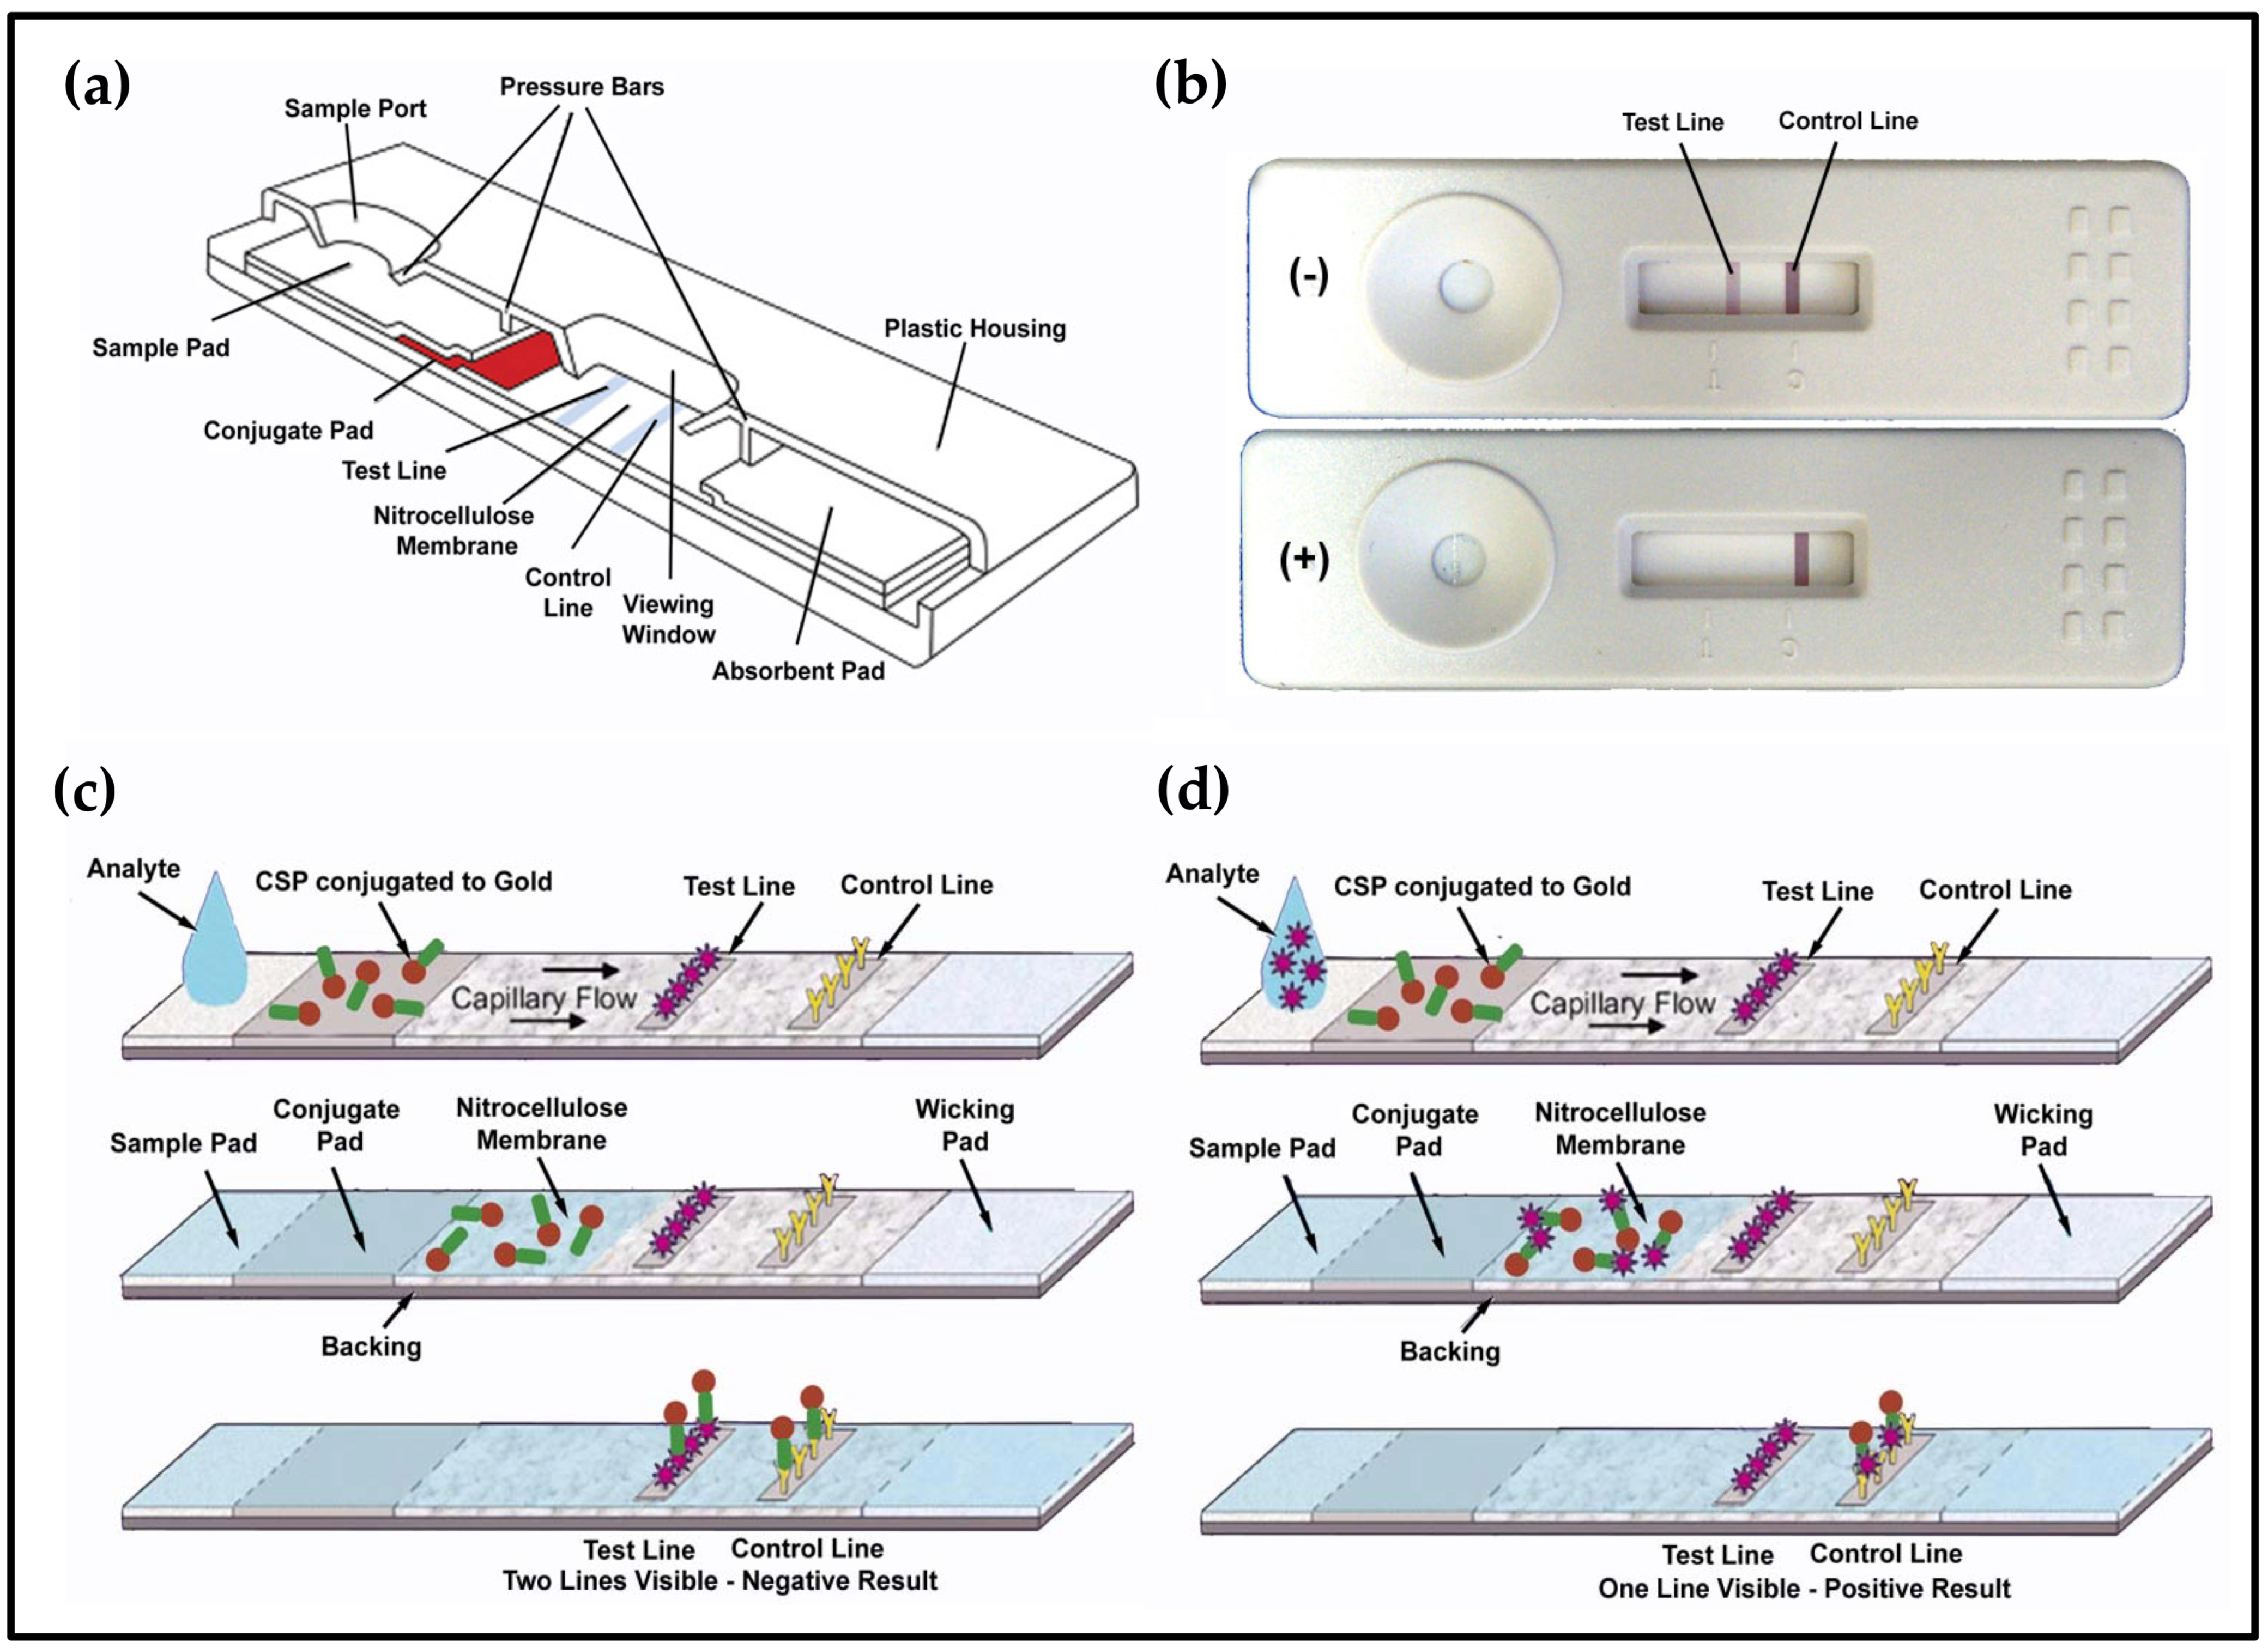
2.3. Lateral Flow Devices
3. Results
3.1. Fluorescence-Quenching Assay to Detect Coliform Bacteria and Fecal Contamination
3.2. Detecting E. coli Cells
3.3. Detecting Fecal Contamination
3.4. Low-Cost Portable Lateral Flow Device to Detect Fecal Contamination
4. Discussion
5. Patents
Author Contributions
Funding
Conflicts of Interest
Appendix A


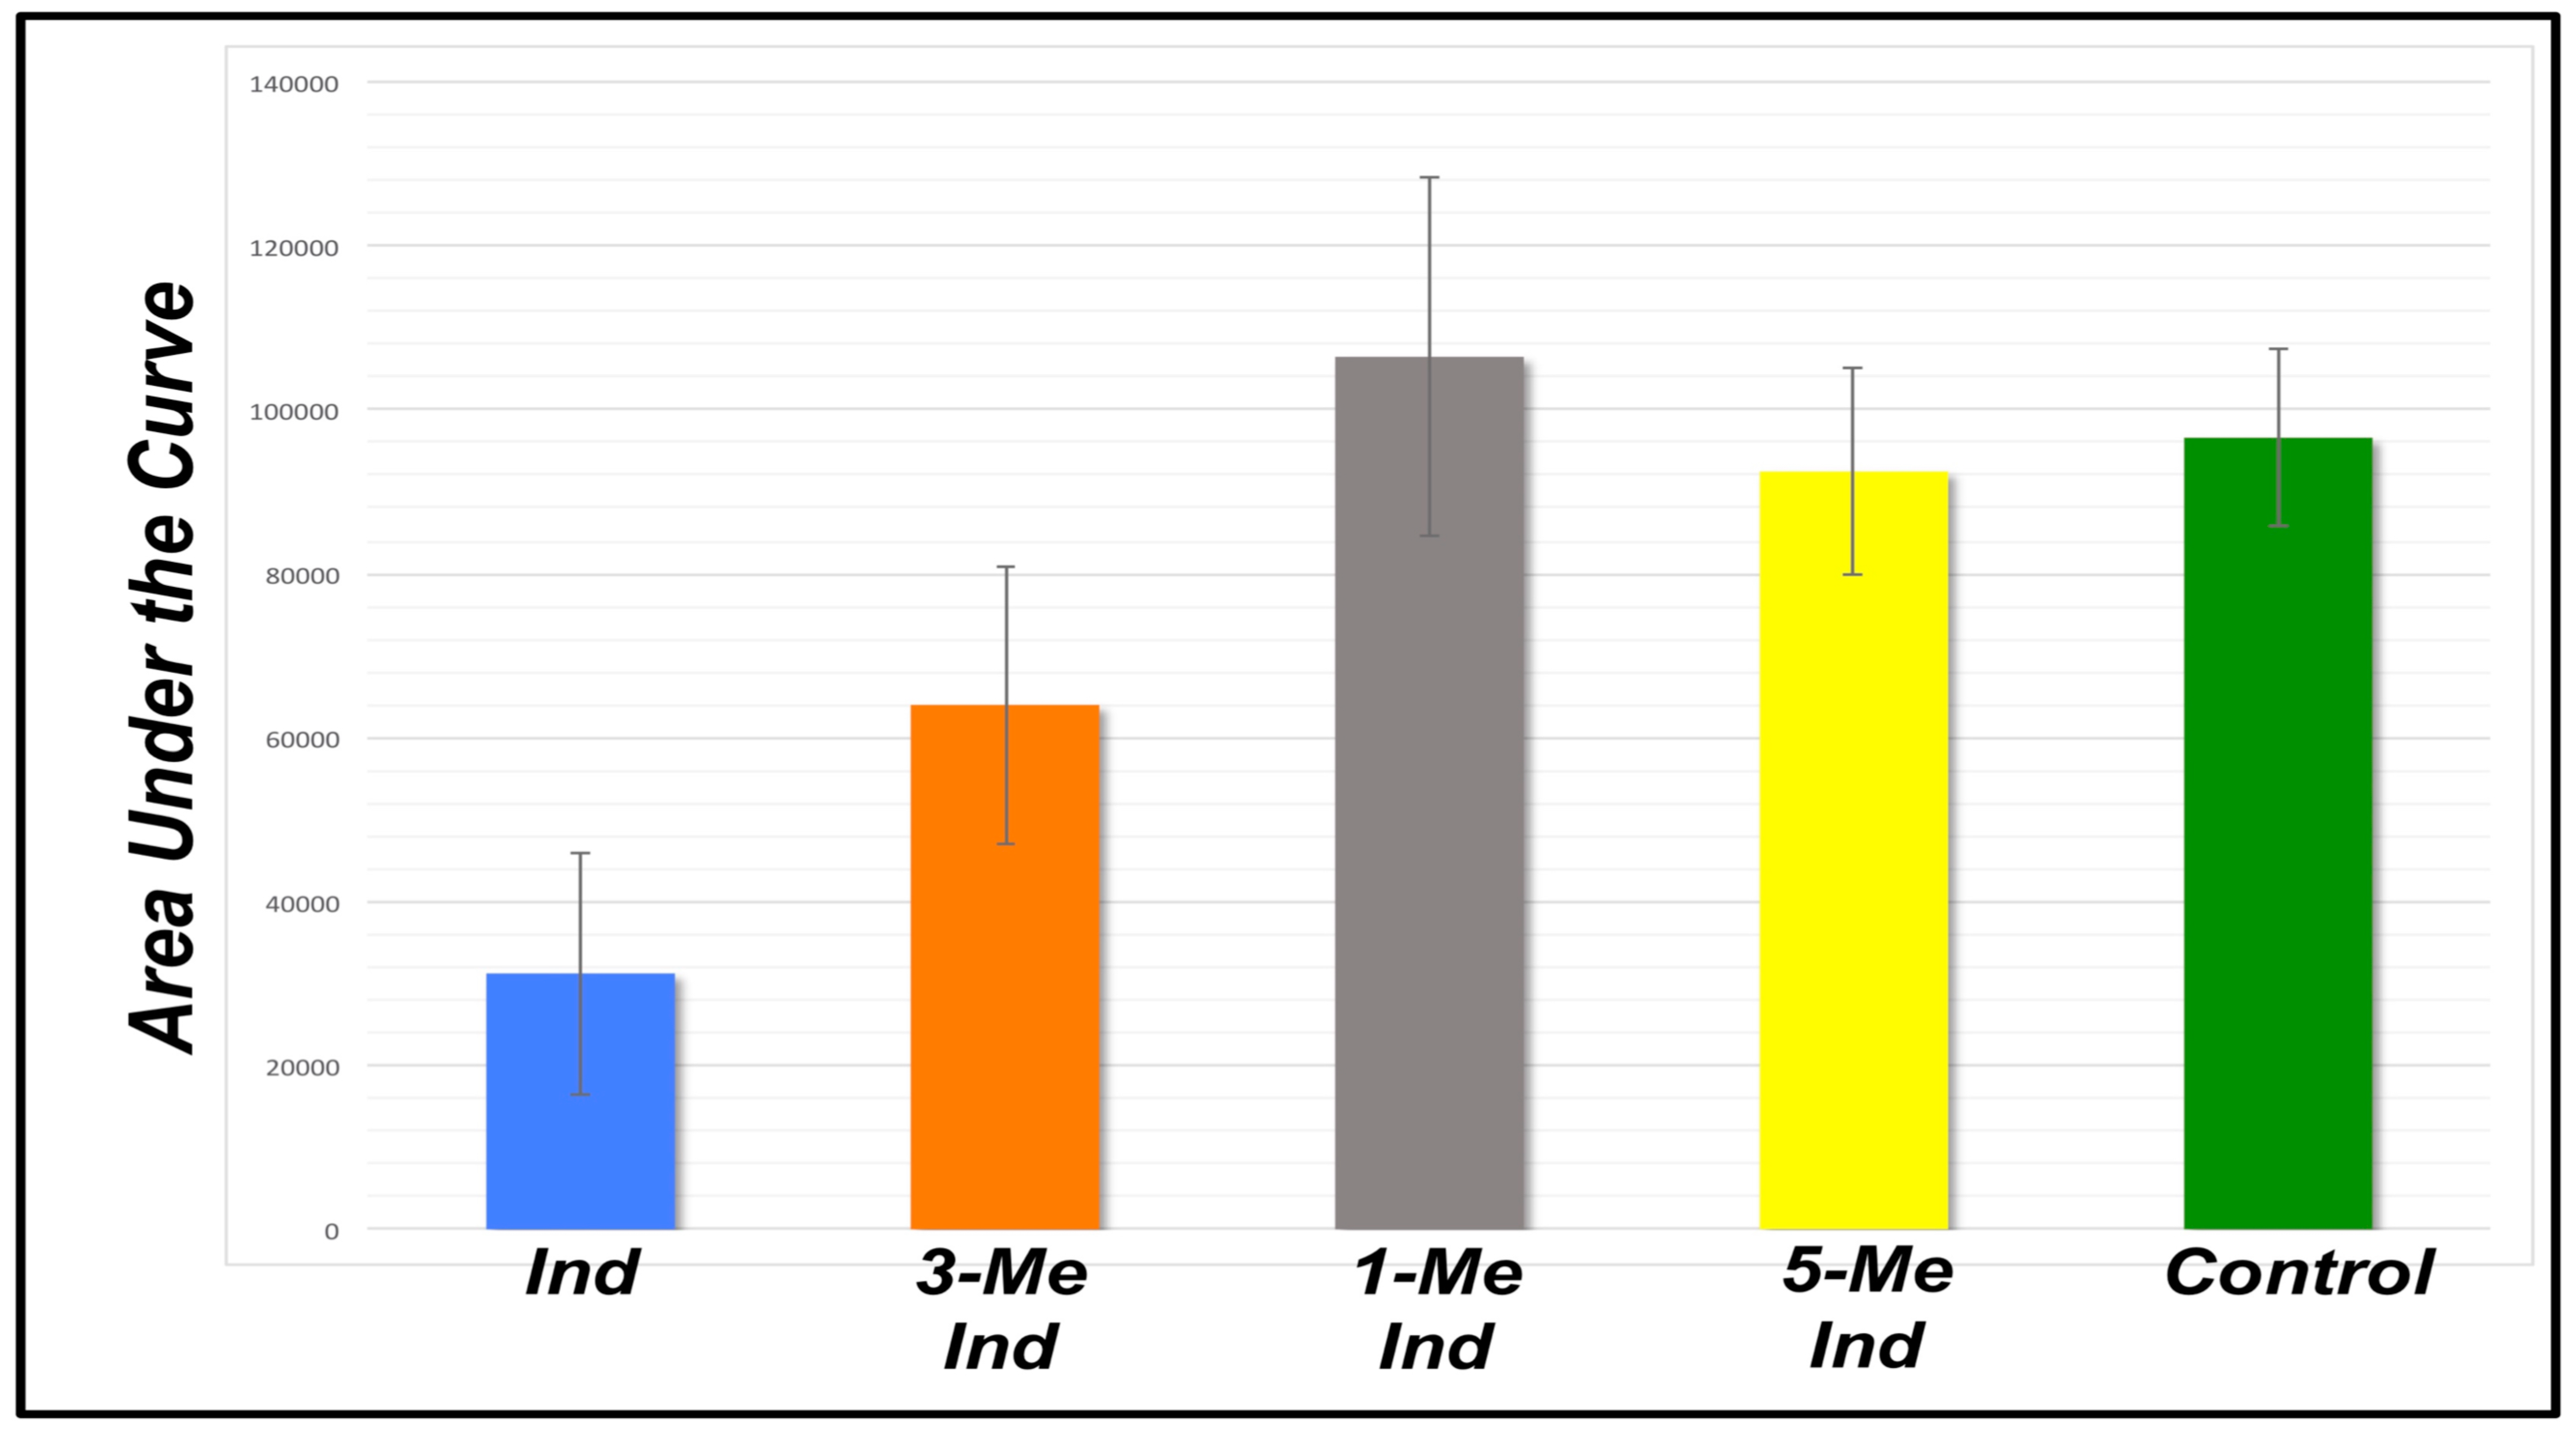
| Indole | 3-Methyl Indole | 1-Methyl Indole | 5-Methyl Indole | Buffer | |
|---|---|---|---|---|---|
| 15568 | 41586 | 125719 | 105668 | 106916 | |
| 33036 | 47193 | 126569 | 77743 | 85425 | |
| 10714 | 73470 | 99218 | 83534 | 97430 | |
| 41302 | 81037 | 67384 | 104760 | -- | |
| 39975 | 79938 | 111689 | 82392 | -- | |
| 46871 | 60676 | 108177 | 100800 | -- | |
| AVG | 31244 | 63983 | 106459 | 92483 | 96590 |
| STDEV | ±14779 | ±16911 | ±21840 | ±12593 | ±10770 |
| t-test | −9.89 | −4.31 | 1.01 | −0.73 | -- |

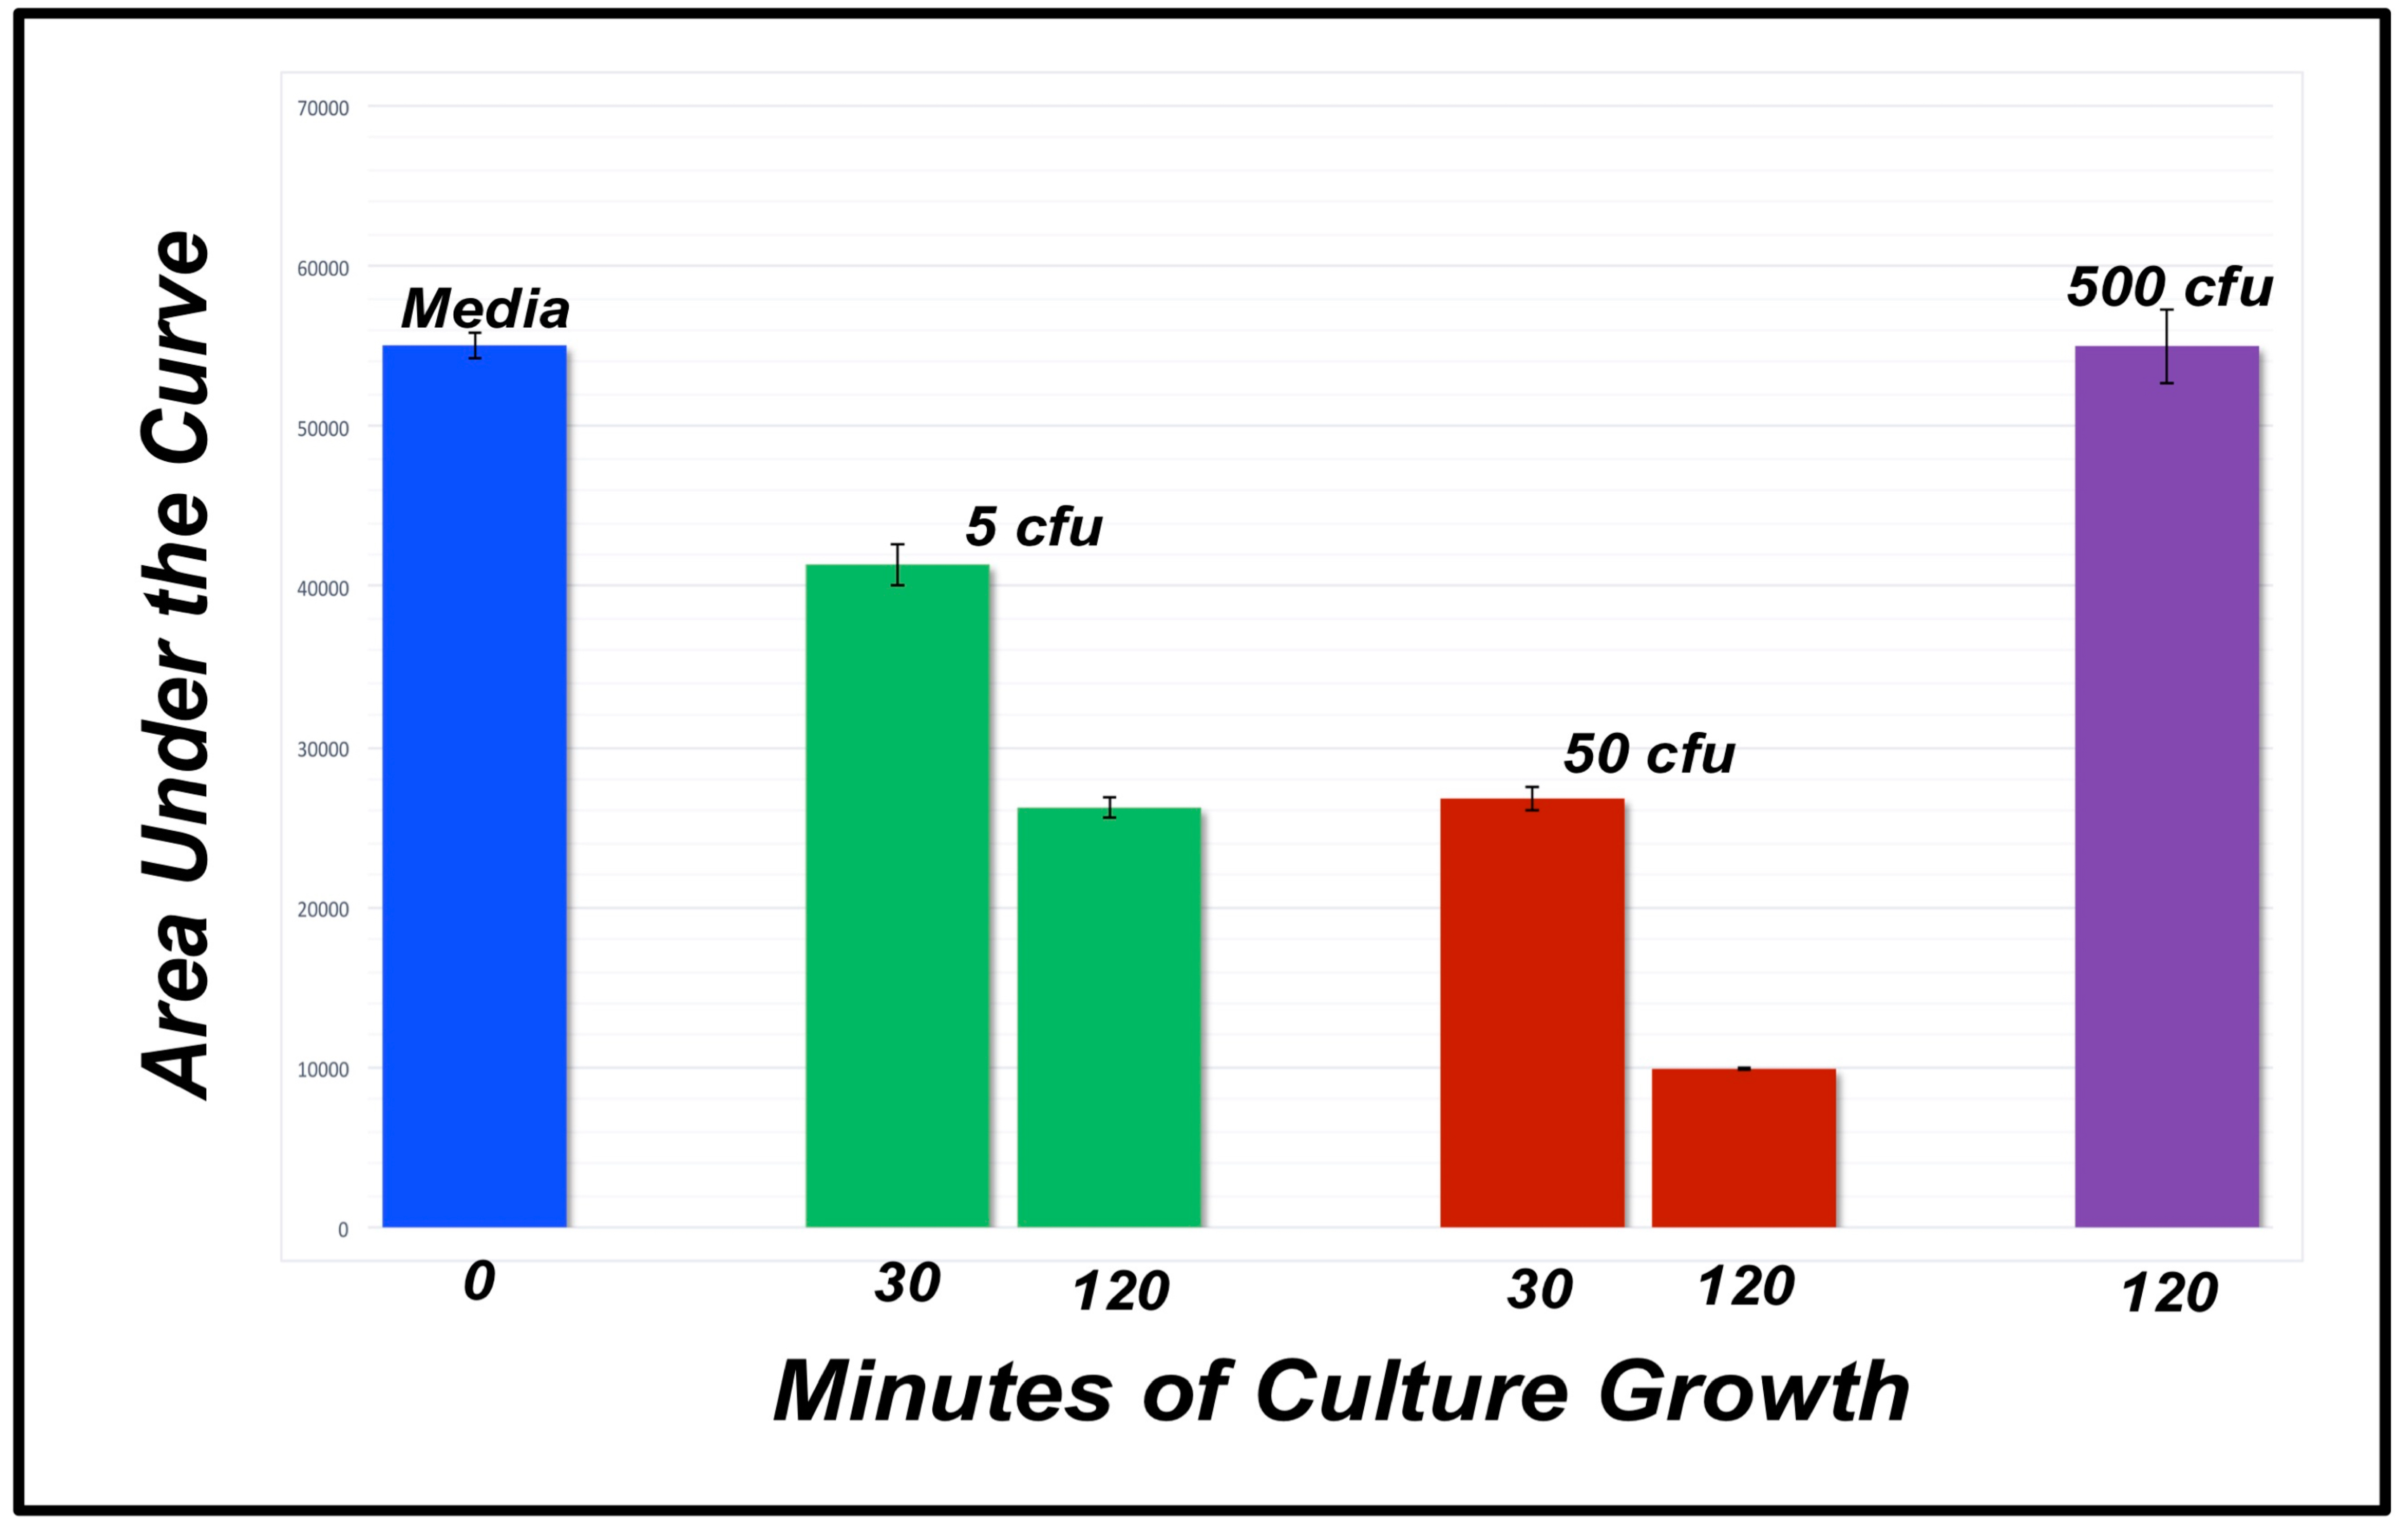
| Media | 5 cfu 30 mins | 5 cfu 60 mins | 50 cfu 30 mins | 50 cfu 60 mins | 500 cfu 120 mins | |
|---|---|---|---|---|---|---|
| 54011 | 43275 | 28041 | 25901 | 9962 | 55488 | |
| 58867 | 42728 | 26925 | 30529 | 9852 | 57053 | |
| 52270 | 38129 | 23716 | 22961 | 9907 | 52489 | |
| AVG | 55049 | 42044 | 26227 | 26463 | 9907 | 55010 |
| STDEV | ±3418 | ±1680 | ±2245 | ±3815 | ±1028 | ±2319 |
| t-test | -- | −8.38 | −22.23 | −12.98 | −76.01 | −0.03 |
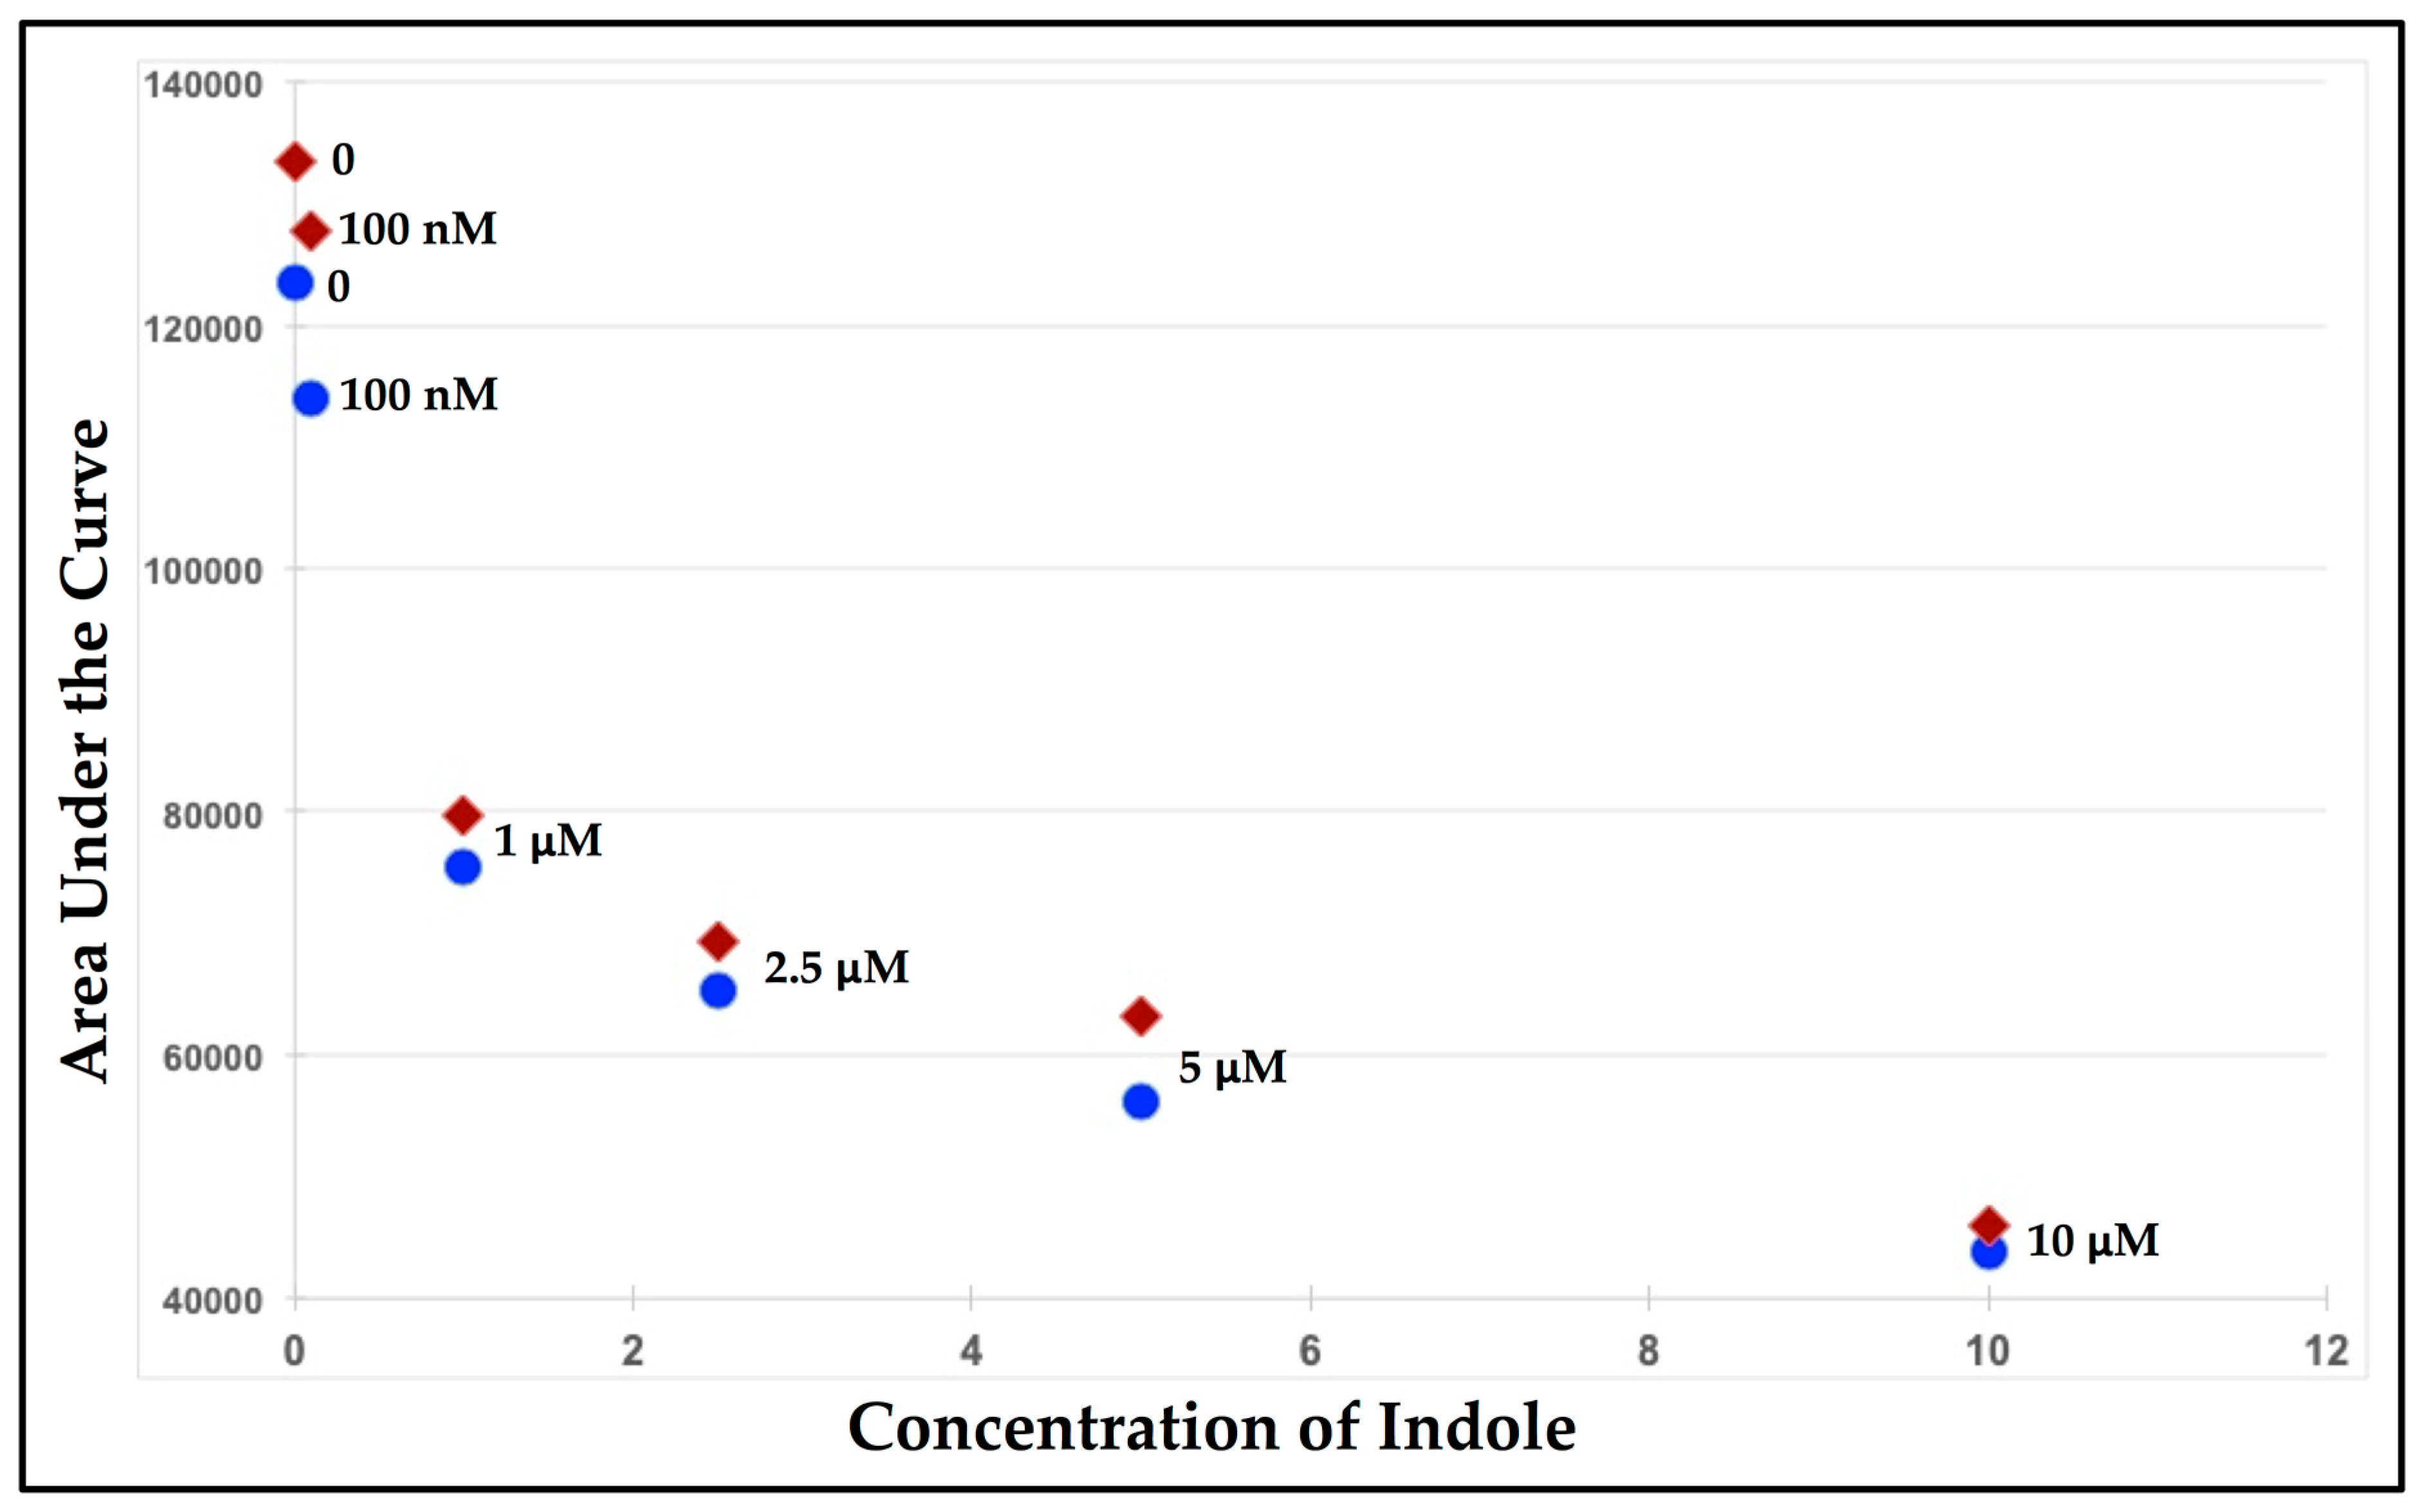
| Buffer | 10 ppb | 100 ppb | 1 ppm | 10 ppm | 100 ppm | |
|---|---|---|---|---|---|---|
| 53596 | 50925 | 48663 | 35905 | 27464 | 22986 | |
| 52349 | 48016 | 50002 | 30033 | 22567 | 23465 | |
| 48890 | 49705 | 46901 | 31285 | 20376 | 20567 | |
| AVG | 51611 | 49548 | 48522 | 32407 | 23469 | 22339 |
| STDEV | ±2438 | ±1460 | ±1555 | ±3092 | ±3629 | ±1553 |
| t-test | -- | −3.16 | −4.44 | −13.90 | −17.34 | −42.13 |
References
- Todar, K. Ken Todar’s Microbial World: E. coli Infections; Bacteriology at UW: Madison, WI, USA, 2005. [Google Scholar]
- Cakir, I.; Dogan, H.B.; Baspinar, E.; Keven, F.; Halkman, A.K. The need for confirmation in coliform and E. coli enumeration in foods. Turk. J. Vet. Anim. Sci. 2002, 26, 1049–1053. [Google Scholar]
- EPA. Guidelines for Establishing Test Procedures for the Analysis of Pollutants. In Analytical Methods for Biological Pollutants in Ambient Water; Final Rule; 40 CFR Part 136; United States Environmental Protection Agency: Washington, DC, USA, 2003; Volume 40, p. 13. [Google Scholar]
- CDC. Ongoing multistate outbreak of Escherichia coli serotype O157:H7 infections associated with consumption of fresh spinach—United States, September 2006. MMWR Morb. Mortal. Wkly. Rep. 2006, 55, 1045–1046. [Google Scholar]
- Charatan, F. FDA warns US consumers not to eat spinach after E coli outbreak. BMJ 2006, 333, 673. [Google Scholar] [CrossRef] [PubMed]
- CDC. Multistate Outbreak of E. coli O157:H7 Infections Linked to Romaine Lettuce. Available online: https://www.cdc.gov/ecoli/2018/o157h7-04-18/ (accessed on 4 July 2018).
- Justice, R.W.; Biessmann, H.; Walter, M.F.; Dimitratos, S.D.; Woods, D.F. Genomics spawns novel approaches to mosquito control. Bioessays 2003, 25, 1011–1020. [Google Scholar] [CrossRef]
- Justice, R.W.; Dimitratos, S.; Walter, M.F.; Woods, D.F.; Biessmann, H. Sexual dimorphic expression of putative antennal carrier protein genes in the malaria vector Anopheles gambiae. Insect Mol. Biol. 2003, 12, 581–594. [Google Scholar] [CrossRef]
- Field, L.M.; Pickett, J.A.; Wadhams, L.J. Molecular studies in insect olfaction. Insect Mol. Biol. 2000, 9, 545–551. [Google Scholar] [CrossRef] [PubMed]
- Krieger, J.; Breer, H. Olfactory reception in invertebrates. Science 1999, 286, 720–723. [Google Scholar] [CrossRef]
- Takken, W. The role of olfaction in host- seeking of mosquitoes: A review. Insect Sci. Appl. 1991, 12, 287–295. [Google Scholar]
- Briand, L.; Nespoulous, C.; Huet, J.C.; Takahashi, M.; Pernollet, J.C. Ligand binding and physico-chemical properties of ASP2, a recombinant odorant-binding protein from honeybee (Apis mellifera L.). Eur. J. Biochem. 2001, 268, 752–760. [Google Scholar] [CrossRef] [PubMed]
- Calvello, M.; Brandazza, A.; Navarrini, A.; Dani, F.R.; Turillazzi, S.; Felicioli, A.; Pelosi, P. Expression of odorant-binding proteins and chemosensory proteins in some Hymenoptera. Ins. Biochem. Mol. Biol. 2005, 35, 297–307. [Google Scholar] [CrossRef]
- Scaloni, A.; Monti, M.; Angeli, S.; Pelosi, P. Structural analysis and disulfide-bridge pairing of two odorant-binding proteins from Bombyx mori. Biochem. Biophys. Res. Commun. 1999, 266, 386–391. [Google Scholar] [CrossRef]
- Briand, L.; Nespoulous, C.; Huet, J.C.; Pernollet, J.C. Disulfide pairing and secondary structure of ASP1, an olfactory-binding protein from honeybee (Apis mellifera L.). J. Pept. Res. 2001, 58, 540–545. [Google Scholar] [CrossRef] [PubMed]
- Wogulis, M.; Morgan, T.; Ishida, Y.; Leal, W.S.; Wilson, D.K. The crystal structure of an odorant binding protein from Anopheles gambiae: Evidence for a common ligand release mechanism. Biochem. Biophys. Res. Commun. 2006, 339, 157–164. [Google Scholar] [CrossRef] [PubMed]
- Lagarde, A.; Spinelli, S.; Tegoni, M.; He, X.; Field, L.; Zhou, J.J.; Cambillau, C. The crystal structure of odorant binding protein 7 from Anopheles gambiae exhibits an outstanding adaptability of its binding site. J. Mol. Biol. 2011, 414, 401–412. [Google Scholar] [CrossRef] [PubMed]
- Rusconi, B.; Maranhao, A.C.; Fuhrer, J.P.; Krotee, P.; Choi, S.H.; Grun, F.; Thireou, T.; Dimitratos, S.D.; Woods, D.F.; Marinotti, O.; et al. Mapping the Anopheles gambiae Odorant Binding Protein 1 (AgamOBP1) using modeling techniques, site directed mutagenesis, circular dichroism and ligand binding assays. Biochim. Biophys. Acta 2012, 947–953. [Google Scholar] [CrossRef] [PubMed]
- Tsitsanou, K.E.; Thireou, T.; Drakou, C.E.; Koussis, K.; Keramioti, M.V.; Leonidas, D.D.; Eliopoulos, E.; Iatrou, K.; Zographos, S.E. Anopheles gambiae odorant binding protein crystal complex with the synthetic repellent DEET: Implications for structure-based design of novel mosquito repellents. Cell. Mol. Life Sci. 2012, 69, 283–297. [Google Scholar] [CrossRef]
- Spinelli, S.; Lagarde, A.; Iovinella, I.; Legrand, P.; Tegoni, M.; Pelosi, P.; Cambillau, C. Crystal structure of Apis mellifera OBP14, a C-minus odorant-binding protein, and its complexes with odorant molecules. Insect Biochem. Mol. Biol. 2012, 42, 41–50. [Google Scholar] [CrossRef] [PubMed]
- Pelosi, P.; Mastrogiacomo, R.; Iovinella, I.; Tuccori, E.; Persaud, K.C. Structure and biotechnological applications of odorant-binding proteins. Appl. Microbiol. Biotechnol. 2014, 98, 61–70. [Google Scholar] [CrossRef] [PubMed]
- Leal, W.S.; Nikonova, L.; Peng, G. Disulfide structure of the pheromone binding protein from the silkworm moth, Bombyx mori. FEBS Lett. 1999, 464, 85–90. [Google Scholar] [CrossRef]
- Ban, L.; Scaloni, A.; Brandazza, A.; Angeli, S.; Zhang, L.; Yan, Y.; Pelosi, P. Chemosensory proteins of Locusta migratoria. Insect Mol. Biol. 2003, 12, 125–134. [Google Scholar] [CrossRef] [PubMed]
- Ban, L.; Scaloni, A.; D’Ambrosio, C.; Zhang, L.; Yahn, Y.; Pelosi, P. Biochemical characterization and bacterial expression of an odorant-binding protein from Locusta migratoria. Cell. Mol. Life Sci. 2003, 60, 390–400. [Google Scholar] [CrossRef] [PubMed]
- Schwaighofer, A.; Kotlowski, C.; Araman, C.; Chu, N.; Mastrogiacomo, R.; Becker, C.; Pelosi, P.; Knoll, W.; Larisika, M.; Nowak, C. Honey bee odorant-binding protein 14: Effects on thermal stability upon odorant binding revealed by FT-IR spectroscopy and CD measurements. Eur. Biophys. J. 2014, 43, 105–112. [Google Scholar] [CrossRef] [PubMed]
- Calvello, M.; Guerra, N.; Brandazza, A.; D’Ambrosio, C.; Scaloni, A.; Dani, F.R.; Turillazzi, S.; Pelosi, P. Soluble proteins of chemical communication in the social wasp Polistes dominulus. Cell. Mol. Life Sci. 2003, 60, 1933–1943. [Google Scholar] [CrossRef] [PubMed]
- Bohbot, J.; Vogt, R.G. Antennal expressed genes of the yellow fever mosquito (Aedes aegypti L.); characterization of odorant-binding protein 10 and takeout. Insect Biochem. Mol. Biol. 2005, 35, 961–979. [Google Scholar] [CrossRef]
- Deng, Y.; Yan, H.; Gu, J.; Xu, J.; Wu, K.; Tu, Z.; James, A.A.; Chen, X. Molecular and functional characterization of odorant-binding protein genes in an invasive vector mosquito, Aedes albopictus. PLoS ONE 2013, 8, e68836. [Google Scholar] [CrossRef]
- Harada, E.; Nakagawa, J.; Asano, T.; Taoka, M.; Sorimachi, H.; Ito, Y.; Aigaki, T.; Matsuo, T. Functional Evolution of Duplicated Odorant-Binding Protein Genes, Obp57d and Obp57e, in Drosophila. PLoS ONE 2012, 7, e29710. [Google Scholar] [CrossRef]
- Matsuo, T.; Sugaya, S.; Yasukawa, J.; Aigaki, T.; Fuyama, Y. Odorant-binding proteins OBP57d and OBP57e affect taste perception and host-plant preference in Drosophila sechellia. PLoS Biol. 2007, 5, e118. [Google Scholar] [CrossRef]
- Patt, J.M.; Woods, D.; Dimitratos, S.; Meikle, W.G.; Stockton, D.; Lapointe, S.L.; Mafra-Neto, A. Novel synthetic ligands enhance the behavioral responses of Asian citrus psyllid to naturally occurring host-plant volatiles. In Pest Management with Natural Products; Beck, J., Coats, J., Duke, S.O., Koivunen, M., Eds.; ACS Books Symposium Series; American Chemical Society: Washington, DC, USA, 2013; Volume 1141, pp. 111–124. [Google Scholar]
- Swarup, S.; Williams, T.I.; Anholt, R.R. Functional dissection of Odorant binding protein genes in Drosophila melanogaster. Genes Brain Behav. 2011, 10, 648–657. [Google Scholar] [CrossRef] [PubMed]
- Vosshall, L.B.; Stensmyr, M.C. Wake up and smell the pheromones. Neuron 2005, 45, 179–181. [Google Scholar] [CrossRef]
- Biessmann, H.; Andronopoulou, E.; Biessmann, M.R.; Douris, V.; Dimitratos, S.D.; Eliopoulos, E.; Guerin, P.M.; Iatrou, K.; Justice, R.W.; Krober, T.; et al. The Anopheles gambiae odorant binding protein 1 (AgamOBP1) mediates indole recognition in the antennae of female mosquitoes. PLoS ONE 2010, 5, e9471. [Google Scholar] [CrossRef]
- Bohbot, J.; Sobrio, F.; Lucas, P.; Nagnan-Le Meillour, P. Functional characterization of a new class of odorant-binding proteins in the moth Mamestra brassicae. Biochem. Biophys. Res. Commun. 1998, 253, 489–494. [Google Scholar] [CrossRef] [PubMed]
- Danty, E.; Briand, L.; Michard-Vanhee, C.; Perez, V.; Arnold, G.; Gaudemer, O.; Huet, D.; Huet, J.C.; Ouali, C.; Masson, C.; et al. Cloning and expression of a queen pheromone-binding protein in the honeybee: An olfactory-specific, developmentally regulated protein. J. Neurosci. 1999, 19, 7468–7475. [Google Scholar] [CrossRef] [PubMed]
- Davrazou, F.; Dong, E.; Murphy, E.J.; Johnson, H.T.; Jones, D.N. New insights into the mechanism of odorant detection by the malaria—Transmitting mosquito anopheles gambiae. J. Biol. Chem. 2011. [Google Scholar] [CrossRef]
- Guo, H.; Huang, L.Q.; Pelosi, P.; Wang, C.Z. Three pheromone-binding proteins help segregation between two Helicoverpa species utilizing the same pheromone components. Insect Biochem. Mol. Biol. 2012, 42, 708–716. [Google Scholar] [CrossRef] [PubMed]
- He, X.; Tzotzos, G.; Woodcock, C.; Pickett, J.A.; Hooper, T.; Field, L.M.; Zhou, J.J. Binding of the general odorant binding protein of Bombyx mori BmorGOBP2 to the moth sex pheromone components. J. Chem. Ecol. 2010, 36, 1293–1305. [Google Scholar] [CrossRef]
- Hekmat-Scafe, D.S.; Dorit, R.L.; Carlson, J.R. Molecular evolution of odorant-binding protein genes OS-E and OS-F in Drosophila. Genetics 2000, 155, 117–127. [Google Scholar]
- Leal, W.S. Odorant reception in insects: Roles of receptors, binding proteins, and degrading enzymes. Annu. Rev. Entomol. 2013, 58, 373–391. [Google Scholar] [CrossRef]
- Liu, S.J.; Liu, N.Y.; He, P.; Li, Z.Q.; Dong, S.L.; Mu, L.F. Molecular characterization, expression patterns, and ligand-binding properties of two odorant-binding protein genes from Orthaga achatina (Butler) (Lepidoptera: Pyralidae). Arch. Insect Biochem. Physiol. 2012, 80, 123–139. [Google Scholar] [CrossRef]
- Matsuo, T. Rapid evolution of two odorant-binding protein genes, Obp57d and Obp57e, in the Drosophila melanogaster species group. Genetics 2008, 178, 1061–1072. [Google Scholar] [CrossRef]
- Murphy, E.J.; Booth, J.C.; Davrazou, F.; Port, A.M.; Jones, D.N. Interactions of Anopheles gambiae odorant binding proteins with a human-derived repellent: Implications for the mode of action of DEET. J. Biol. Chem. 2013, 288, 4475–4485. [Google Scholar] [CrossRef]
- Pelletier, J.; Guidolin, A.; Syed, Z.; Cornel, A.J.; Leal, W.S. Knockdown of a mosquito odorant-binding protein involved in the sensitive detection of oviposition attractants. J. Chem. Ecol. 2010, 36, 245–248. [Google Scholar] [CrossRef]
- Woods, D.F.; Dimitratos, S.D.; Justice, R.W. Methods to Utilize Invertebrate Chemosensory Proteins for Industrial and Commercial Uses. Patent No. EP 2087351, 12 August 2009. [Google Scholar]
- Woods, D.F.; Dimitratos, S.D.; Justice, R.W. Methods to Utilize Invertebrate Chemosensory Proteins for Industrial and Commercial Uses. Patent No. AU 2007345342, 14 May 2009. [Google Scholar]
- Reiner-Rozman, C.; Kotlowski, C.; Knoll, W. Electronic Biosensing with Functionalized rGO FETs. Biosensors 2016, 6, 17. [Google Scholar] [CrossRef] [PubMed]
- Kotlowski, C.; Larisika, M.; Guerin, P.M.; Kleber, C.; Kröber, T.; Mastrogiacomo, R.; Nowak, C.; Pelosi, P.; Schütz, S.; Schwaighofer, A.; et al. Fine discrimination of volatile compounds by graphene-immobilized odorant-binding proteins. Sens. Actuators B Chem. 2018, 256, 564–572. [Google Scholar] [CrossRef]
- Yi, X.; Zhang, Y.; Wang, P.; Qi, J.; Hu, M.; Zhong, G. Ligands binding and molecular simulation: The potential investigation of a biosensor based on an insect odorant binding protein. Int. J. Biol. Sci. 2015, 11, 75–87. [Google Scholar] [CrossRef]
- Larisika, M.; Kotlowski, C.; Steininger, C.; Mastrogiacomo, R.; Pelosi, P.; Schutz, S.; Peteu, S.F.; Kleber, C.; Reiner-Rozman, C.; Nowak, C.; et al. Electronic Olfactory Sensor Based on A. mellifera Odorant-Binding Protein 14 on a Reduced Graphene Oxide Field-Effect Transistor. Angew. Chem. Int. Ed. Engl. 2015, 54, 13245–13248. [Google Scholar] [CrossRef] [PubMed]
- Lu, Y.; Li, H.; Zhuang, S.; Zhang, D.; Zhang, Q.; Zhou, J.; Dong, S.; Liu, Q.; Wang, P. Olfactory biosensor using odorant-binding proteins from honeybee: Ligands of floral odors and pheromones detection by electrochemical impedance. Sens. Actuators B Chem. 2014, 193, 420–427. [Google Scholar] [CrossRef]
- Dung, T.T.; Oh, Y.; Choi, S.J.; Kim, I.D.; Oh, M.K.; Kim, M. Applications and Advances in Bioelectronic Noses for Odour Sensing. Sensors 2018, 18, 103. [Google Scholar] [CrossRef] [PubMed]
- Woods, D.F.; Dimitratos, S.D.; Justice, R.W. Methods to Utilize Invertebrate Chemosensory Proteins for Industrial and Commercial Uses. Patent NZ 576264, 31 March 2012. [Google Scholar]
- Woods, D.F.; Dimitratos, S.D.; Justice, R.W. Methods to Utilize Invertebrate Chemosensory Proteins for Industrial and Commercial Uses. Patent CA 2666662, 31 July 2008. [Google Scholar]
- O’Farrell, B. Diagnostic Consulting Netowrk: On the Market and Intellectual Property Landscape of Lateral Flow Devices; Konrad, K.D., Ed.; DCN: Carlsbad, CA, USA, 2010. [Google Scholar]
- Park, J.; Shin, J.H.; Park, J.K. Pressed Paper-Based Dipstick for Detection of Foodborne Pathogens with Multistep Reactions. Anal. Chem. 2016, 88, 3781–3788. [Google Scholar] [CrossRef]
- Shin, J.H.; Hong, J.; Go, H.; Park, J.; Kong, M.; Ryu, S.; Kim, K.P.; Roh, E.; Park, J.K. Multiplexed Detection of Foodborne Pathogens from Contaminated Lettuces Using a Handheld Multistep Lateral Flow Assay Device. J. Agric. Food Chem. 2018, 66, 290–297. [Google Scholar] [CrossRef]
- Lombard, G.L.; Dowell, V.R., Jr. Comparison of three reagents for detecting indole production by anaerobic bacteria in microtest systems. J. Clin. Microbiol. 1983, 18, 609–613. [Google Scholar]
- Biessmann, H.; Walter, M.F.; Dimitratos, S.; Woods, D. Isolation of cDNA clones encoding putative odourant binding proteins from the antennae of the malaria-transmitting mosquito, Anopheles gambiae. Insect Mol. Biol. 2002, 11, 123–132. [Google Scholar] [CrossRef]
- Dimitratos, S.; Justice, R.; Woods, D.F. Development of Novel Attractants for the Asian Citrus Psyllid, Diaphorina citri Kuwayama. Citrograph 2011, 2, 36–41. [Google Scholar]
- Mastrogiacomo, R.; Iovinella, I.; Napolitano, E. New fluorescent probes for ligand-binding assays of odorant-binding proteins. Biochem. Biophys. Res. Commun. 2014, 446, 137–142. [Google Scholar] [CrossRef] [PubMed]
- Rao, R.S.; Ablala, J.S.; Lane, S.L.; Matthews, D.L.; Fisher, A.M.; Lambert, J.L.; Coleman, M.A. Developing rapid, point-of-care, multiplex detection for use in lateral flow devices. Proc. SPIE 2005, 6007. [Google Scholar] [CrossRef]
- Liu, J.; Mazumdar, D.; Lu, Y. A Simple and Sensitive “Dipstick” Test in Serum Based on Lateral Flow Separation of Adaptamer-Linked Nanostructures. Angew. Chem. Int. Ed. Engl. 2006, 2006, 7955–7959. [Google Scholar] [CrossRef] [PubMed]
- Rosen, S. Lateral Flow Technology and the Future of Point of Care Diagnostics; Kalorama Information: Rockville, MD, USA, 2007. [Google Scholar]
- Dewey, F.M.; Steel, C.C.; Gurr, S.J. Lateral-flow devices to rapidly determine levels of stable Botrytis antigens in table and dessert wines. Am. J. Enol. Vitic. 2013, 64, 291–295. [Google Scholar] [CrossRef]
- Backman, A.C.; Anderson, P.; Bengtsson, M.; Lofqvist, J.; Unelius, C.R.; Witzgall, P. Antennal response of codling moth males, Cydia pomonella L. (Lepidoptera: Tortricidae), to the geometric isomers of codlemone and codlemone acetate. J. Comp. Physiol. A 2000, 186, 513–519. [Google Scholar] [CrossRef]
- Plettner, E.; Lazar, J.; Prestwich, E.G.; Prestwich, G.D. Discrimination of pheromone enantiomers by two pheromone binding proteins from the gypsy moth Lymantria dispar. Biochemistry 2000, 39, 8953–8962. [Google Scholar] [CrossRef]
- Wojtasek, H.; Hansson, B.S.; Leal, W.S. Attracted or repelled?—A matter of two neurons, one pheromone binding protein, and a chiral center. Biochem. Biophys. Res. Commun. 1998, 250, 217–222. [Google Scholar] [CrossRef] [PubMed]
- Ouellette, J. Electronic noses sniff out new markets. Ind. Phys. 1999, 5, 26–29. [Google Scholar]
- Canhoto, O.F.; Magan, N. Potential for detection of microorganisms and heavy metals in potable water using electronic nose technology. Biosens. Bioelectron. 2003, 18, 751–754. [Google Scholar] [CrossRef]
- Rains, G.C.; Utley, S.L.; Lewis, W.J. Behavioral monitoring of trained insects for chemical detection. Biotechnol. Prog. 2005, 10, 164–165. [Google Scholar] [CrossRef]
- Rodacy, P.J.; Bender, S.; Bromenshenk, J.; Henderson, C.; Bender, G. Deployment of honeybees to detect explosives and other agents of harm. Proc. SPIE 2002, 4743, 474–481. [Google Scholar]
- Di Natale, C.; Macagnano, A.; Martinelli, E.; Paolesse, R.; D’Arcangelo, G.; Roscioni, C.; Finazzi-Agro, A.; D’Amico, A. Lung cancer identification by the analysis of breath by means of an array of non-selective gas sensors. Biosens. Bioelectron. 2003, 18, 1209–1218. [Google Scholar] [CrossRef]
- Pavlou, A.K.; Turner, A.P. Sniffing out the truth: Clinical diagnosis using the electronic nose. Clin. Chem. Lab. Med. 2000, 38, 99–112. [Google Scholar] [CrossRef]
- Yu, F.; Persson, B.; Lofas, S.; Knoll, W. Surface plasmon fluorescence immunoassay of free prostate-specific antigen in human plasma at the femtomolar level. Anal. Chem. 2004, 76, 6765–6770. [Google Scholar] [CrossRef]
- Fradet, Y.; Saad, F.; Aprikian, A.; Dessureault, J.; Elhilali, M.; Trudel, C.; Masse, B.; Piche, L.; Chypre, C. uPM3, a new molecular urine test for the detection of prostate cancer. Urology 2004, 64, 311–315. [Google Scholar] [CrossRef] [PubMed]
- Saad, F. UPM3: Review of a new molecular diagnostic urine test for prostate cancer. Can. J. Urol. 2005, 12 (Suppl. 1), 40–43. [Google Scholar] [PubMed]
- Mutlu, N.; Turkeri, L.; Emerk, K. Analytical and clinical evaluation of a new urinary tumor marker: Bladder tumor fibronectin in diagnosis and follow-up of bladder cancer. Clin. Chem. Lab. Med. 2003, 41, 1069–1074. [Google Scholar] [CrossRef] [PubMed]
- Phillips, M.; Cataneo, R.N.; Condos, R.; Ring Erickson, G.A.; Greenberg, J.; La Bombardi, V. Volatile markers of pulmonary tuberculosis in the breath. Eur. Respir. J. 2004, 24, 467s. [Google Scholar]
- Phillips, M.; Cataneo, R.N.; Ditkoff, B.A.; Fisher, P.; Greenberg, J.; Gunawardena, R.; Kwon, C.S.; Rahbari-Oskoui, F.; Wong, C. Volatile markers of breast cancer in the breath. Breast J. 2003, 9, 184–191. [Google Scholar] [CrossRef]
- Phillips, M.; Gleeson, K.; Hughes, J.M.; Greenberg, J.; Cataneo, R.N.; Baker, L.; McVay, W.P. Volatile organic compounds in breath as markers of lung cancer: A cross-sectional study. Lancet 1999, 353, 1930–1933. [Google Scholar] [CrossRef]
- Phillips, M.; Cataneo, R.N.; Cummin, A.R.; Gagliardi, A.J.; Gleeson, K.; Greenberg, J.; Maxfield, R.A.; Rom, W.N. Detection of lung cancer with volatile markers in the breath. Chest 2003, 123, 2115–2123. [Google Scholar] [CrossRef]
- Pickel, D.; Manucy, G.P.; Walker, D.B.; Hall, S.B.; Walker, J.C. Evidence for canine olfactory detection of melanoma. Appl. Anim. Behav. Sci. 2004, 89, 107–116. [Google Scholar] [CrossRef]
- Dalton, P.; Gelperin, A.; Preti, G. Volatile metabolic monitoring of glycemic status in diabetes using electronic olfaction. Diabetes Technol. Ther. 2004, 6, 534–544. [Google Scholar] [CrossRef] [PubMed]
- Sieg, A.; Guy, R.H.; Delgado-Charro, M.B. Noninvasive and minimally invasive methods for transdermal glucose monitoring. Diabetes Technol. Ther. 2005, 7, 174–197. [Google Scholar] [CrossRef] [PubMed]
- Phillips, M.; Cataneo, R.N.; Cheema, T.; Greenberg, J. Increased breath biomarkers of oxidative stress in diabetes mellitus. Clin. Chim. Acta 2004, 344, 189–194. [Google Scholar] [CrossRef]
- Newman, J.D.; Turner, A.P. Home blood glucose biosensors: A commercial perspective. Biosens. Bioelectron. 2005, 20, 2435–2453. [Google Scholar] [CrossRef]
- Haasnoot, W.; Smits, N.G.; Kemmers-Voncken, A.E.; Bremer, M.G. Fast biosensor immunoassays for the detection of cows’ milk in the milk of ewes and goats. J. Dairy Res. 2004, 71, 322–329. [Google Scholar] [CrossRef] [PubMed]
- Vikholm-Lundin, I.; Albers, W.M. Site-directed immobilisation of antibody fragments for detection of C-reactive protein. Biosens. Bioelectron. 2006, 21, 1141–1148. [Google Scholar] [CrossRef]
- Verma, N.; Bhardwaj, A. Biosensor Technology for Pesticides—A Review. Appl. Biochem. Biotechnol. 2015, 175, 3093–3119. [Google Scholar] [CrossRef] [PubMed]


© 2019 by the authors. Licensee MDPI, Basel, Switzerland. This article is an open access article distributed under the terms and conditions of the Creative Commons Attribution (CC BY) license (http://creativecommons.org/licenses/by/4.0/).
Share and Cite
Dimitratos, S.D.; Hommel, A.S.; Konrad, K.D.; Simpson, L.M.; Wu-Woods, J.J.; Woods, D.F. Biosensors to Monitor Water Quality Utilizing Insect Odorant-Binding Proteins as Detector Elements. Biosensors 2019, 9, 62. https://doi.org/10.3390/bios9020062
Dimitratos SD, Hommel AS, Konrad KD, Simpson LM, Wu-Woods JJ, Woods DF. Biosensors to Monitor Water Quality Utilizing Insect Odorant-Binding Proteins as Detector Elements. Biosensors. 2019; 9(2):62. https://doi.org/10.3390/bios9020062
Chicago/Turabian StyleDimitratos, Spiros D., Allison S. Hommel, Kenneth D. Konrad, Lauren M. Simpson, Jessica J. Wu-Woods, and Daniel F. Woods. 2019. "Biosensors to Monitor Water Quality Utilizing Insect Odorant-Binding Proteins as Detector Elements" Biosensors 9, no. 2: 62. https://doi.org/10.3390/bios9020062
APA StyleDimitratos, S. D., Hommel, A. S., Konrad, K. D., Simpson, L. M., Wu-Woods, J. J., & Woods, D. F. (2019). Biosensors to Monitor Water Quality Utilizing Insect Odorant-Binding Proteins as Detector Elements. Biosensors, 9(2), 62. https://doi.org/10.3390/bios9020062