Article

Label-Free Refractive-Index-Based Detection of Breast, Leukemia, and Prostate Cancer Cells Using a Tetra-Core PCF SPR Biosensor


by
Amit Kumar Shakya
* and
Mantas Grigalavičius
Laser Research Center, Vilnius University, Saulėtekio al. 10, Vilnius, 10223 Vilniaus m. sav., Lithuania
*
Author to whom correspondence should be addressed.
Biosensors 2026, 16(9), 463; https://doi.org/10.3390/bios16090463
Submission received: 28 July 2026 / Revised: 14 August 2026 / Accepted: 17 August 2026 / Published: 25 August 2026

Abstract

In this research, a high-performance plasmonic refractive index ( R I ) biosensor based on an external metal deposition ( E M D ) technique and photonic crystal fiber ( P C F ) platform for potential cancer detection is presented, investigated, and linked with real-time cancer cells. Variations in the R I of biological fluids are closely associated with pathological conditions, including cancer, due to changes in cellular composition and biomolecular concentration. The proposed tetra-core P C F S P R biosensor operates within the biologically relevant R I range of 1.33 1.37 , enabling the detection of subtle R I variations corresponding to various cancerous cells. The sensing mechanism of the proposed sensor is based on surface plasmon resonance ( S P R ) and analyzed using coupled mode light theory for both x - and y - polarized modes. Key sensing performance parameters, including confinement loss ( C L ), wavelength sensitivity ( W S ), amplitude sensitivity ( A S ), sensor resolution ( S R ), and figure of merit ( F O M ) are systematically evaluated. The biosensor reports a W S of 9769 and 9069   n m / R I U for x - p o l . and y - p o l . , respectively, A S of 623.182 and 645.087   R I U 1 for x - p o l . and y - p o l . respectively, S R in the order of 10 5   R I U , coefficient of determination ( R 2 ) of 0.97 and 0.96 , and F O M of 60.17 and 53.01   R I U 1 for x - p o l . and y - p o l . , respectively. Thus, the proposed P C F S P R biosensor exhibits a dynamic range of 0.04   R I U . The sensing results demonstrate high sensitivity and strong resonance characteristics, indicating the capability of the proposed biosensor for label-free and non-invasive detection of cancer-associated R I changes in biological fluids. Thus, the presented biosensor offers a promising approach for the highly sensitive label-free detection of early-stage cancer cells by photonics sensing application.

1. Introduction

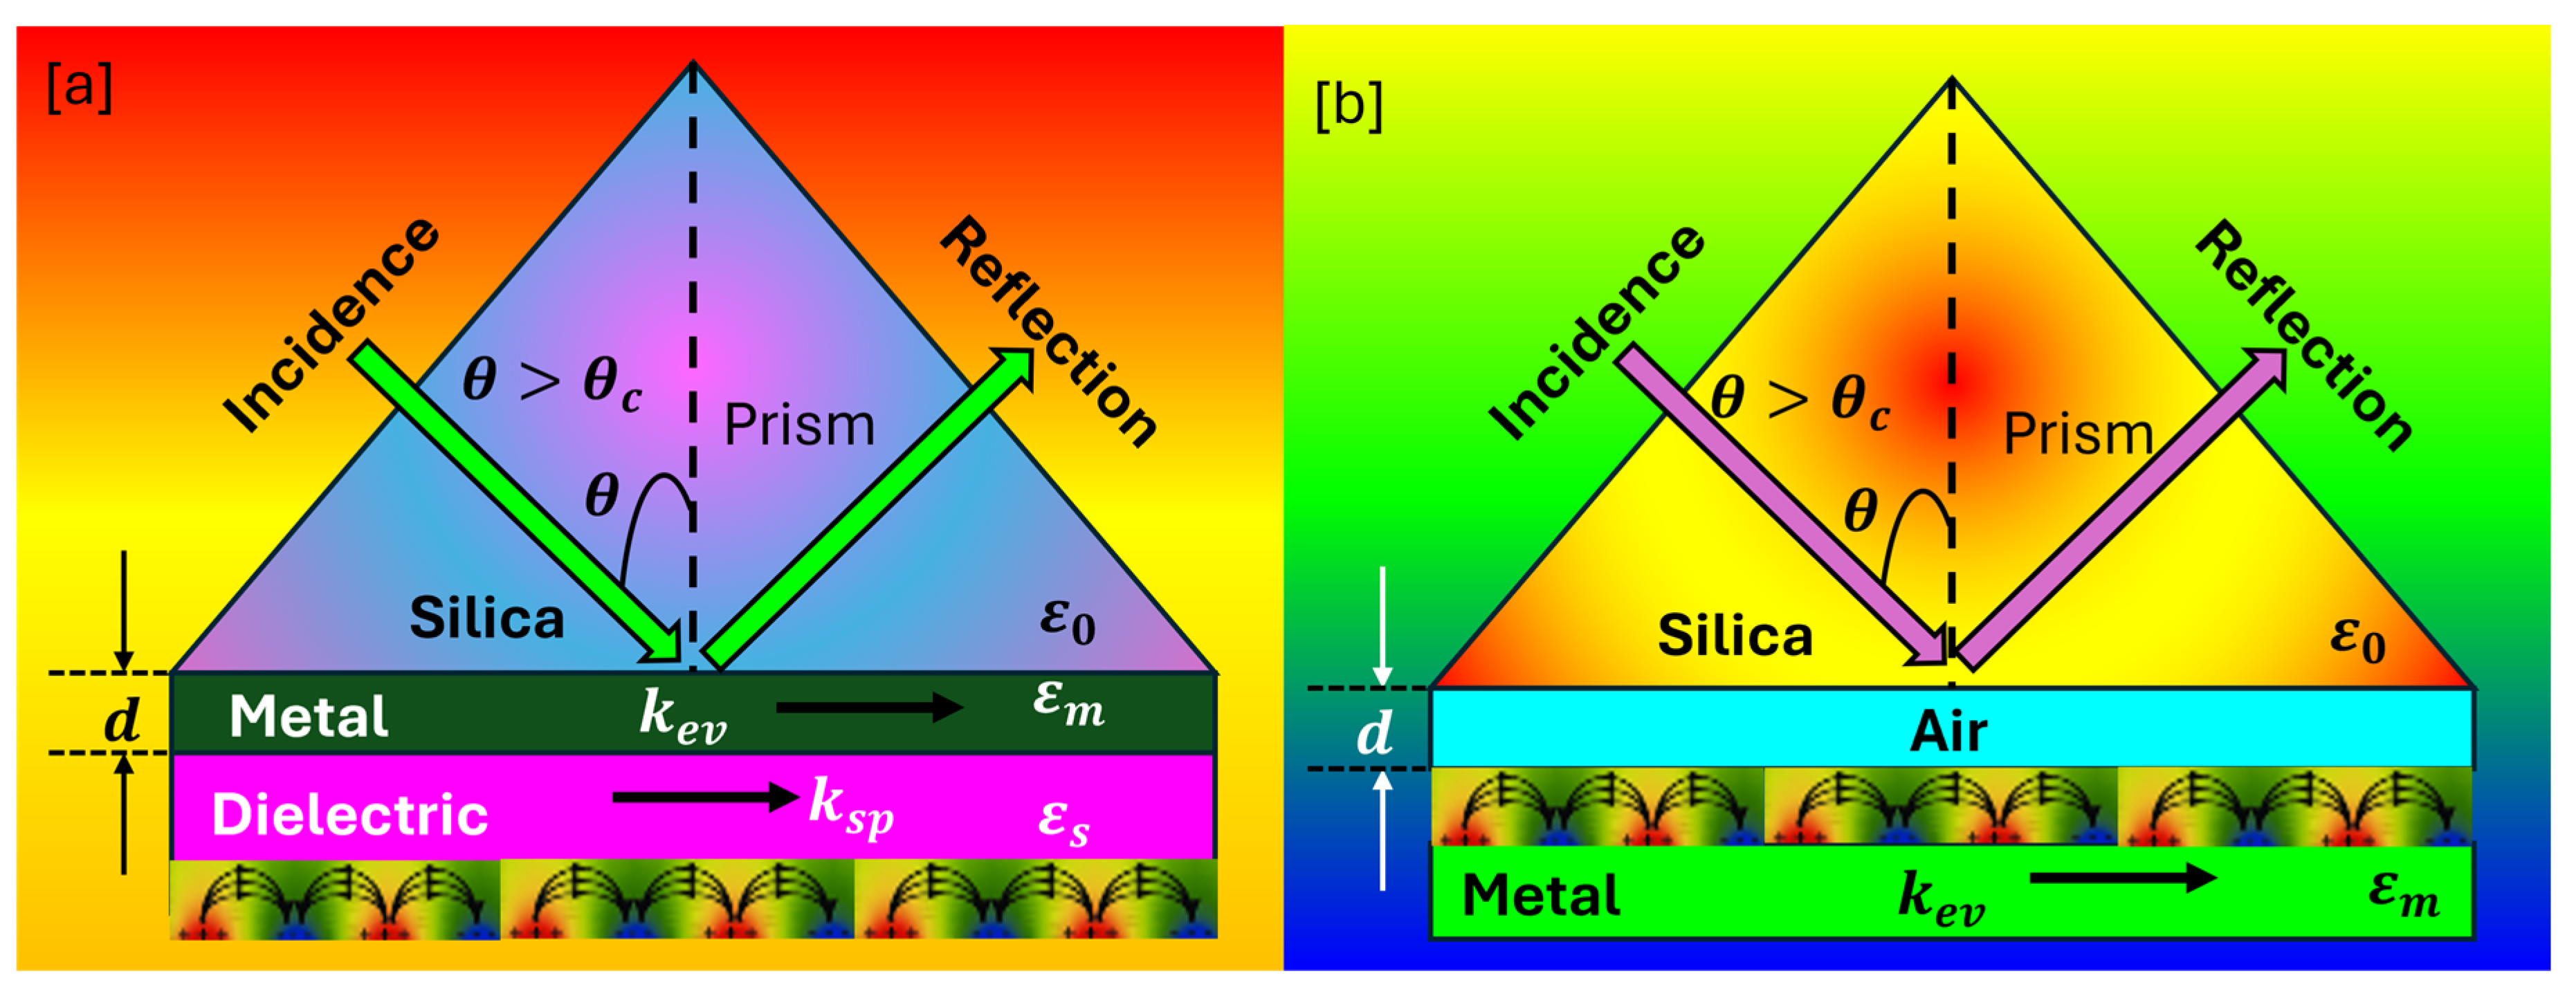
Photonic crystal fiber ( P C F ) -based surface plasmon resonance ( S P R ) biosensors working on the refractive index ( R I ) variations are extremely sensitive miniature optical devices used to detect variations in analyte by analyzing a red shift and blue shift within the sensor operational wavelength [1]. These sensors are used nowadays in several applications related to biomedical, chemical, biochemical, environmental monitoring, food quality inspection, etc. [2]. These miniature devices are fabricated on the P C F platform due to its unique property to control the light propagation within the fiber body. In addition, P C F has the flexibility to alter geometrical design to achieve highly sensitive parameters. P C F has several advantages like dispersion properties, nonlinearity, controllable birefringence, mode behavior, geometrical design variation, etc. Initially, a Kretschmann configuration was the earliest and most widely used approach for implementing S P R sensors. In this process, a thin metallic layer, typically of gold ( A u ), or silver ( A g ), is directly coated onto the base of a high- R I prism, allowing incident light to interact through the prism and with the metal–dielectric interface [3,4]. At a specific angle of incidence, known as the resonance angle, the momentum of the incident photons matches that of surface plasmons, resulting in the excitation of the collective electron oscillations at the metal surface, resulting in a sharp dip in the reflected light intensity. This dip is extremely sensitive to changes in the R I of the medium, making it useful for sensing applications [5]. However, despite its effectiveness, the Kretschmann setup suffers from several practical limitations. The requirement for a prism-based optical setup makes the system bulky and less portable, while precisely controlling the incident angle and mechanical components such as rotation stages, alignment mounts, etc. [6]. Additionally, careful alignment of the other optical elements, such as the light source and detector, is essential for accurate measurements. These factors increase system complexity, cost, and sensitivity to external disturbances, thereby limiting their suitability for compact, field-deployable, or real-time sensing applications compared to modern fiber-based S P R sensors. Similarly, A u nano cone enables S P R ; metal–insulator–metal ( M I M ) waveguide coupled with A g cylinder and square cavity can also be used in S P R sensing applications [7,8]. Figure 1a,b represents the schematic of the Kretschmann and Otto configurations, respectively, that were used initially for the S P R -based sensing applications [9].
Fiber-based S P R sensors began to be developed due to advantages like small size, small sample volume, remote sensing ability, etc. The working of the P C F S P R sensor follows the coupling of surface plasmon polariton ( S P P ) and leaky core mode at a particular wavelength ( λ ) known as the resonance wavelength ( R W ). At this wavelength, the real and imaginary parts of the effective mode index become identical [10]. The R W is different for distinct analytes and varies based on the change in R I of the analyte. Another important aspect of the P C F S P R sensor is the plasmonic material. There are different types of plasmonic materials used in these sensors to date. These materials can be generally distinguished into two categories: conventional materials and emerging materials. Conventional materials include A g , titanium dioxide ( T i O 2 ), copper ( C u ), A u , aluminum ( A l ), graphene, etc. [11,12]. These materials have been used in S P R sensors since the introduction of the S P R theory. Emerging materials include magnesium fluoride ( M g F 2 ) [13], transparent conducting oxides ( T C O s ) [14], transition metal dichalcogenides ( T M D s ) [15], black phosphorus [16], metal carbides [17], nitrides [18], and MXenes [19], etc. Every material possesses some merits as well as shortcomings, like A u is widely recognized as a stable and efficient plasmonic material that assists in the generation of the S P R and is chemically inert too, but at the same time it gets oxidized quickly. Thus, it is suggested by experts to use a dual coat of A u and T i O 2 for enhanced durability. This combination allows sensors to operate effectively for a longer duration of time.
P C F S P R sensors can be fabricated using different design techniques, which include internal metal deposition ( I M D ), external metal deposition ( E M D ), D - shaped P C F , etc. [20,21]. In addition, several biomedical applications for which P C F S P R sensors can be used are cancer detection [22], glucose monitoring [23], blood component analysis [24], heavy metal analysis [25], COVID virus identification [26], pregnancy detection [27], etc. Thus, in this investigation, a model of a E M D -based P C F S P R sensor having a coating of A u and T i O 2 is presented, which is specifically designed to investigate the R I ranging from 1.33   t o   1.37   R I U representing cancerous cellular environments [28,29]. Typically, normal cells exhibit R I values in the range of 1.33 1.34 , while cancerous cells demonstrate higher R I approximately 1.35 1.37 , and beyond due to increased intracellular protein content, altered morphology, and enhanced biochemical activity. Consequently, monitoring R I variations within this range enables the detection of cancer-associated changes in biological samples. Several other methods like surface-enhanced Raman scattering ( S E R S ) [30], actuation of micro/nanorobots [31], can also play a significant role in cancer detection.

2. Geometrical Description of the Sensor Model

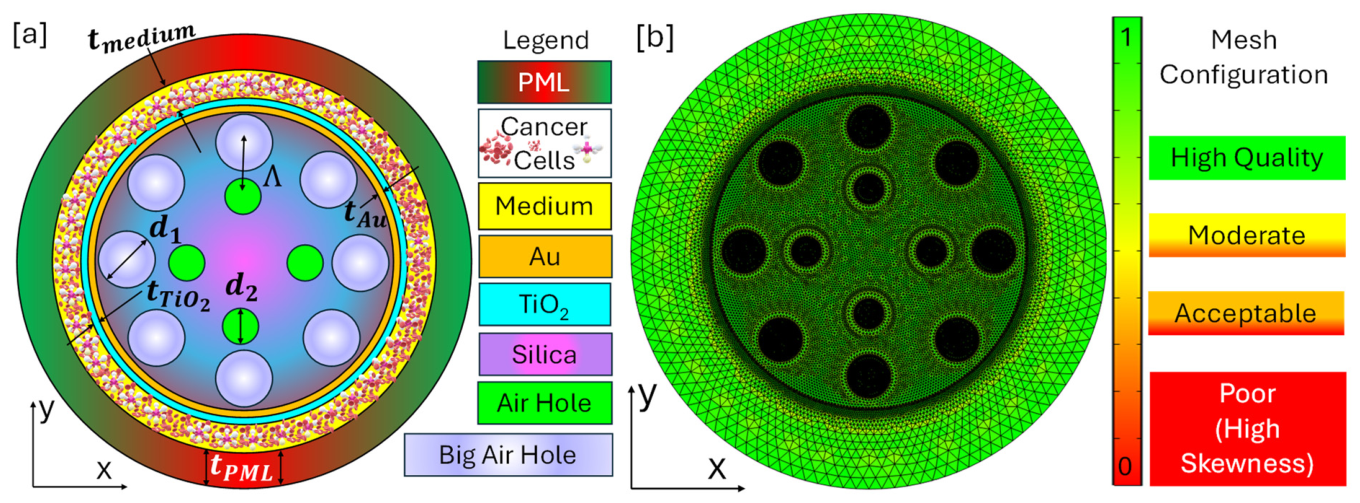
A E M D -based two-dimensional ( 2 D ) model of the P C F S P R sensor is presented in this section and the R I range of 1.33 1.37   R I U is investigated. The representative R I values of 1.33 , 1.34 ,   1.35 ,   1.36 , and 1.37 are used to model water, normal urine, breast cancer-related blood plasma, leukemia-related white blood cells ( W B C s ), and prostate cancer-related to urine extracellular vesicles, respectively [21,22,23]. Furthermore, a step size of 0.01 is used to design the sensor model. The geometry of the P C F S P R sensor consists of two dimensions of air holes arranged in a manner that a tetra core is generated within the P C F . The dimensions of the air holes are d 1 = 1.50   μ m and d 2 = 1.20   μ m , respectively. The pitch (Λ) is represented by 2.25   μ m . Coating of plasmonic materials A u and T i O 2 are applied to the sensor surface using the chemical vapor deposition ( C V D ) technique. The thickness of the A u and T i O 2 layer is optimized through a parametric investigation by varying its thickness as 40   n m , 45   n m , and 50   n m for A u and 80   n m , 85   n m and 90   n m for T i O 2 , respectively. The resulting resonance characteristics, confinement loss ( C L ), wavelength sensitivity ( W S ), and amplitude sensitivity ( A S ) are analyzed for each case, and it was observed that 45   n m   A u and 85   n m   T i O 2 layers provided the most favorable sensing performance. Therefore, the optimized thickness of plasmonic material selected in the sensor model for A u and T i O 2 are 45   n m and 85   n m , respectively. An analyte sensing layer is used to flow various cancerous cells having a thickness of 2.25   μ m ; finally, a perfectly matched layer ( P M L ) of thickness 2.50   μ m is installed over the sensing layer to keep the reflections within the sensor body.
All numerical analyses of the sensor are performed using COMSOL Multiphysics 6.2 based on the finite element method ( F E M ). A 2 D electromagnetic wave frequency domain ( e w f d ) solver, wave optics module is used to investigate the modal characteristics of the proposed P C F S P R sensor.
Background material used in the sensor model is fused silica ( S i O 2 ) those R I is expressed by the “Sellmeier equation” represented by Equation (1) [32].
n λ = 1 + a 1 λ 2 λ 2 b 1 + a 2 λ 2 λ 2 b 2 + a 3 λ 2 λ 2 b 3
where a 1 , a 2 , a 3 , b 1 , b 2 , and b 3 are known as Sellmeier coefficients, but their values differ for different materials since we are using fused S i O 2 as the background material, then the expression of the Sellmeier equation is expressed by Equation (2) [33].
n S i O 2 λ = 1 + 0.696166300 λ 2 λ 2 4.67914826 + 0.407942600 λ 2 λ 2 1.35120631 × 10 2 + 0.897479400 λ 2 λ 2 97.9340025
The R I of A u is expressed by the “Drude Lorentz model,” which is represented by Equation (3) [34,35].
ϵ ω = ϵ ω D 2 ω ω + j γ D ε Ω L 2 ω 2 Ω L 2 + j Γ L ω
where ϵ is defined as frequency permittivity and is equal to 5.9673; optical angular frequency is expressed by ω , ω D is the plasma frequency, and the expression ω D / 2 π = 2113.6   T H z , damping frequency is expressed via γ D and expression γ D / 2 π = 15.92   T H z . The term ε is called the weighing factor and is equal to 1.09 . The strength of the oscillator is denoted by Ω D / 2 π and is equal to 650.07   T H z , finally the spectral width of the Lorentz oscillator is expressed by Γ L / 2 π = 104.86   T H z [33,36].
In the proposed sensor, an additional layer of T i O 2 is used as an adhesive layer to anchor the plasmonic metal onto the fiber surface. T i O 2 layer enhances the interaction between the fundamental guided mode and the surface plasmon modes. Additionally, the T i O 2 coating enables the tuning of the S P R sensor’s operational wavelength toward the near-infrared region [37]. In comparison to the visible spectrum, the evanescent field in the near-infrared region exhibits greater penetration depth, thereby significantly improving the sensitivity of the S P R sensor [33,38].
The R I of T i O 2 is expressed by Equation (4) [38]. Further details about the terminology can be obtained from [38].
n T i O 2 2 = 5.913 + 0.2441 λ 2 0.0803
Figure 2a represents the structural layout of the sensor model with classification of the various domains, air hole geometries, plasmonic material thickness, sensing channel (medium), and P M L boundary.
A domain-specific non-uniform free triangular mesh is employed to accurately resolve the optical field distribution in different regions of the sensor model. For the fused silica, a custom mesh is adopted with a maximum element size of 0.1   μ m , a maximum growth rate of 1.0 , a curvature factor of 0.2 , and a narrow region resolution of 1.0 . The air-hole regions are discretized using a finer custom mesh with a maximum element size of 0.025   μ m , a minimum element size of 3.05   ×   10 6   μ m , a maximum growth rate of 1.0 , a curvature factor of 0.1 , and a narrow region resolution of 0.1 . The A u plasmonic layer is meshed using a predefined finer mesh configuration having a maximum element size of 0.564   μ m , a minimum element size of 0.00191   μ m , a maximum growth rate of 1.25 , a curvature factor of 0.25 , and a narrow region resolution of 1.0 . Similarly, the T i O 2 adhesion layer and analyte region are discretized using predefined extra-fine mesh settings with a maximum element size of 0.305   μ m , minimum element size of 0.00114   μ m , maximum growth rate of 1.2 , a curvature factor of 0.25 , and a narrow region resolution of 1.0 . The P M L surrounding the sensing region is meshed using a custom mesh with a maximum element size of 0.5   μ m , minimum element size of 5.05   ×   10 5   μ m , maximum element growth rate of 1.5 , curvature factor of 0.4 , and narrow region resolution of 5.0 . A free triangular mesh is used throughout the computational domain, while a 2.50   μ m thick-   P M L is employed to absorb outgoing electromagnetic waves and eliminate boundary reflections. The adopted mesh strategy ensured accurate evaluation of R W shifts and C L , particularly at the metal–dielectric interface where surface plasmon excitation occurs. Finally, scattering boundary conditions ( S B C ) are applied at the outer boundary of the P M L region. Figure 2b represents the mesh growth rate of the proposed sensor model. A mesh growth rate in the range of 1.3 1.4 is typically employed to ensure a smooth transition between various kinds of mesh elements. This enables the accurate resolution of strong field gradients near the metal–dielectric interface while maintaining computational efficiency.
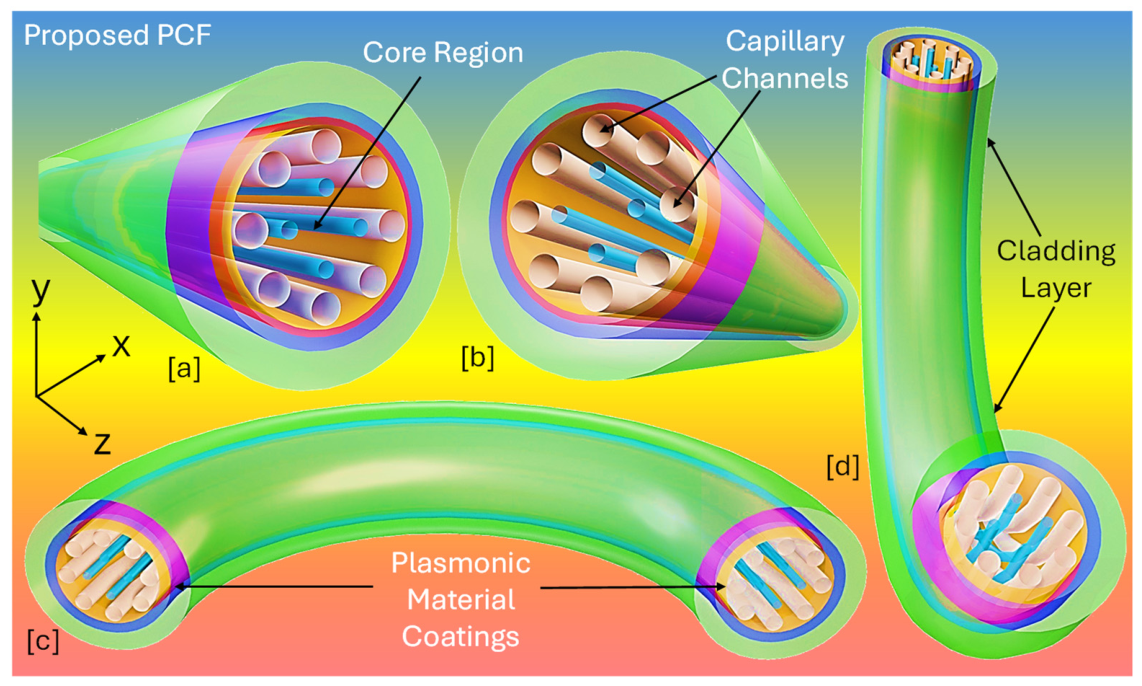
The three-dimensional ( 3 D ) layout of the proposed sensor features a complex, multi-layered P C F structure specifically engineered for high sensitivity S P R applications as presented in Figure 3. The 3 D prototype consists of a specialized internal geometry having a central core surrounded by a symmetrical arrangement of air holes and capillaries. The arrangement of plasmonic material layers within the cladding is responsible for exciting the S P P at the metal–dielectric interface. The structure is created to maintain the functional integrity of the sensor under various physical states, including the following:
  • Unbent Configuration: Figure 3a,b show the proposed multicore P C F geometry from cross-sectional and perspective views, highlighting the arrangement of air holes, capillary channels, and plasmonic sensing regions.
  • Three-Dimensional Visualization: Figure 3c,d present additional 3 D views of the proposed structure from different orientations for improved visualization of the plasmonic coating, cladding layer, and internal architecture.
These versatile features of the P C F suggest it as a robust platform for detecting cancerous fluid, where the interaction between the guided light and the plasmonic material is finely tuned by the fiber’s geometrical parameters and its physical orientation.
Regarding fabrication feasibility, the proposed P C F S P R sensor can be realized using stack-and-draw or extrusion techniques commonly used for P C F fabrication. The selective deposition of T i O 2 and A u thin films can be made through methods such as atomic layer deposition ( A L D ) [39], C V D [40], sputtering [41], or electron-beam evaporation [42]. The realization of the proposed sensor may present several practical challenges, such as maintaining the dimensional accuracy of the proposed tetra-core geometry during the fiber drawing process, achieving uniform and controllable T i O 2 / A u bilayer thickness, ensuring strong adhesion between adjacent material layers, and selectively coating only the designated sensing region while avoiding undesired material deposition on neighboring surfaces. In addition, slight deviations in the structural parameters introduced during fabrication can influence the phase-matching condition and resonance characteristics. Recent developments in microstructured fiber fabrication, precision-controlled thin-film deposition, and post-processing techniques have significantly improved the manufacturability of several complex P C F -based plasmonic sensor structures. Therefore, the practical realization and experimental development of the proposed biosensor is considered feasible and constitutes an important part of future work.

3. Biological Relevance of Selected Refractive Index Values for Cancer Biosensing

The R I of a biological sample is closely associated with its biochemical composition, cellular concentration, and molecular content. Variations in R I can arise due to changes in proteins, cells, extracellular vesicles, metabolites, and other biomolecular constituents present in the sample. Therefore, R I is considered a useful biophysical parameter for the optical characterization of biological fluids and disease-related biomarkers. In this study, the selected R I values ranging from 1.33 to 1.37 are chosen based on the literature-reported data and their biological relevance to represent physiological and pathological conditions. In particular, the R I values of 1.35 , 1.36 , and 1.37 are associated with blood plasma, W B C -rich samples, and extracellular-vesicle-rich urine samples, respectively, which have been extensively investigated in cancer biomarker studies related to breast, leukemia, and prostate cancers [43,44]. Table 1 summarizes the literature-reported R I values, representative biological samples, and their diagnostic significance in cancer biosensing applications.
The R I value of 1.35 is biologically relevant for breast cancer as it falls within the typical R I range reported for blood plasma. The optical properties of blood plasma are largely governed by the concentration of proteins, lipids, metabolites, and other dissolved biomolecules. In cancer patients, alterations in plasma composition can be caused by circulating tumor-derived molecules, proteins, and extracellular vesicles that may lead to measurable changes in the R I . Consequently, plasma R I has been investigated as a potential biophysical indicator in breast, lung, colorectal, and other cancer-related biomarker studies [43,44].
A R I of approximately 1.36 is commonly associated with samples having a relatively high cellular content, particularly for W B C -rich suspensions. The increase in cellular concentration elevates the overall optical density of the sample, resulting in a higher R I compared with normal plasma. Such R I values are frequently used in hematological investigations where the concentration, morphology, and physiological state of immune cells significantly influence the optical properties of the sample. In clinical settings, elevated cellular content and corresponding R I changes have been linked to leukemia-related abnormalities and immune-cell-associated disorders. Therefore, R I values around 1.36 are particularly relevant for leukemia diagnostics and studies involving abnormal proliferation or activation of W B C [43,44].
A R I value of approximately 1.37 is commonly associated with E V - or exosome-rich biological samples, including certain urinary specimens. Extracellular vesicles are nanoscale membrane-bound particles released by cells and contain proteins, lipids, nucleic acids, and other biomolecular cargos that reflect the physiological state of their parent cells. An increased concentration of E V s and exosomes raises the optical density of the biological fluid, resulting in a measurable increase in R I . In recent years, urinary E V s and exosomes have gained considerable attention as promising non-invasive biomarkers for cancer diagnosis and monitoring, particularly in prostate, bladder, and kidney cancers. Therefore, the R I range around 1.37 is of significant clinical interest for E V -based liquid biopsy applications [43,44].
However, since R I variations are not uniquely disease-specific, practical clinical applications may benefit from combining R I measurements with complementary molecular biomarkers and advanced data-analysis approaches to improve diagnostic specificity and reliability. Table 2 presents a detailed overview of the various cancer types, associated body fluid samples, and relevant biomarkers causing them.

4. Optical Mode Profiles of the Proposed Biosensor

The R I range of 1.33 1.37   R I U is investigated in this study for analyzing cancer cells, for potential biomedical sensing applications. An R I value of 1.33 represents water, which serves as a baseline reference [57]. The R I value of 1.34 represents normal human urine. However, any deviations from this level may indicate pathological conditions such as chronic kidney disease or urinary tract infection [58,59]. An R I of approximately 1.35 is associated with blood plasma, where variations may arise due to metabolic and physiological changes, including diabetes mellitus, increased protein concentration, or dehydration [60]. The R I value of 1.36 correspond to W B C , and any changes in this range can be linked to immune-related conditions such as leukemia, systemic infections like Sepsis, or inflammatory responses [61]. A higher R I value of 1.37 , particularly in urine containing extracellular vesicles, reflects elevated biomolecular content and may be associated with serious conditions including prostate cancer, renal disorders, and certain neurodegenerative diseases [62].
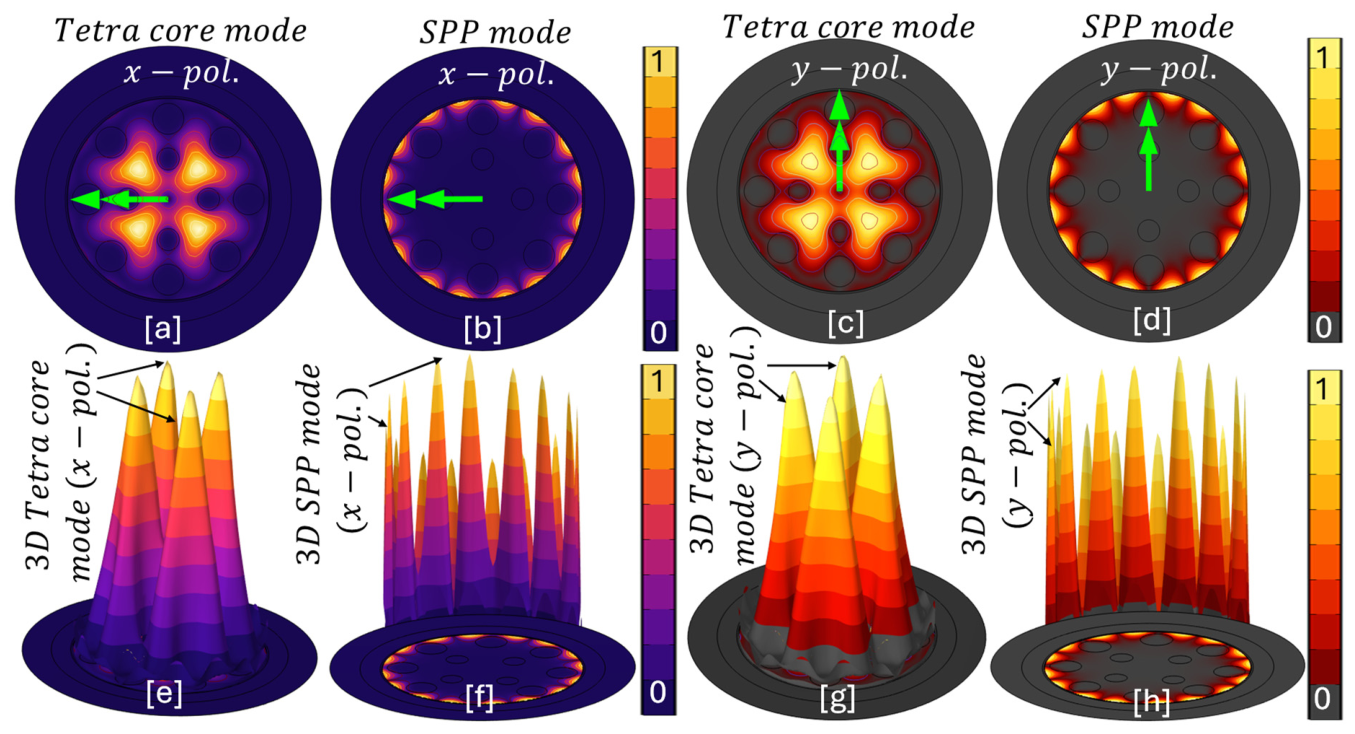
In this investigation, we have performed dual-mode analysis of the sensor model, which includes both x - p o l . (x-polarization) and y - p o l . (y-polarization) with the objective of obtaining maximum information from the sensor. The 2 D and 3 D core mode and S P P mode profiles of the sensor concerning x - p o l . and y - p o l . are presented in Figure 4.
Figure 4a,b represent the 2 D   x - p o l . Tetra-core mode profile and x - p o l .   S P P mode profile, Figure 4c,d represent the 2 D   y - p o l . Tetra-core mode profile and y - p o l .   S P P mode profile, Figure 4e,f represents the 3 D tetra-core mode profile and 3 D   S P P mode profile for x - p o l . Finally, Figure 4g,h represent the 3 D tetra-core mode profile and 3 D   S P P mode profile for y - p o l . These mode profiles are extracted from the proposed sensor corresponding to R I   1.33 . Similarly, mode profiles for other R I values can also be extracted.
When we compare the tetra-core configuration with the single-core [63] and dual-core [64] configuration, the tetra-core fiber [65] offers significantly enhanced sensing performance; this is due to the increased modal interactions and multiple coupling pathways. The presence of four closely spaced cores enables strong supermode formation and efficient coupling between guided modes and the plasmonic interface, which results in higher sensitivity and multiple resonance peaks. Additionally, the tetra-core designs provide greater flexibility in tuning the structural parameters, which allows optimization of birefringence and sensing characteristics. But at the same time, besides these advantages, there are also some challenges, like increased structural complexity, complex fabrication, and regular monitoring.

5. Experimental Characterization of Breast Cancer (T-47D), Leukemia (MM6), and Prostate Cancer (DU145) Cell Lines for RI-Based Biosensor

To demonstrate the biological relevance of the presented P C F S P R biosensor for cancer detection. Distinct cancer cells are cultured under standard cell culture conditions, specifically in a cell-culture flask containing a nutrient-rich growth medium. The cultured cells are analyzed using an optical microscope connected to a computer for microscopic image acquisition and visualization [66]. The microscope is focused on different regions of the culture surface, and representative microscopic images are obtained. The acquired images showed active proliferation of T - 47 D for breast cancer [67], monomac 6 ( M M 6 ) for leukemia [68] and D U 145 for prostate cancer cells [69] within the culture medium. The experimental demonstration workflow of the proposed cancer biomarkers is illustrated in Figure 5.
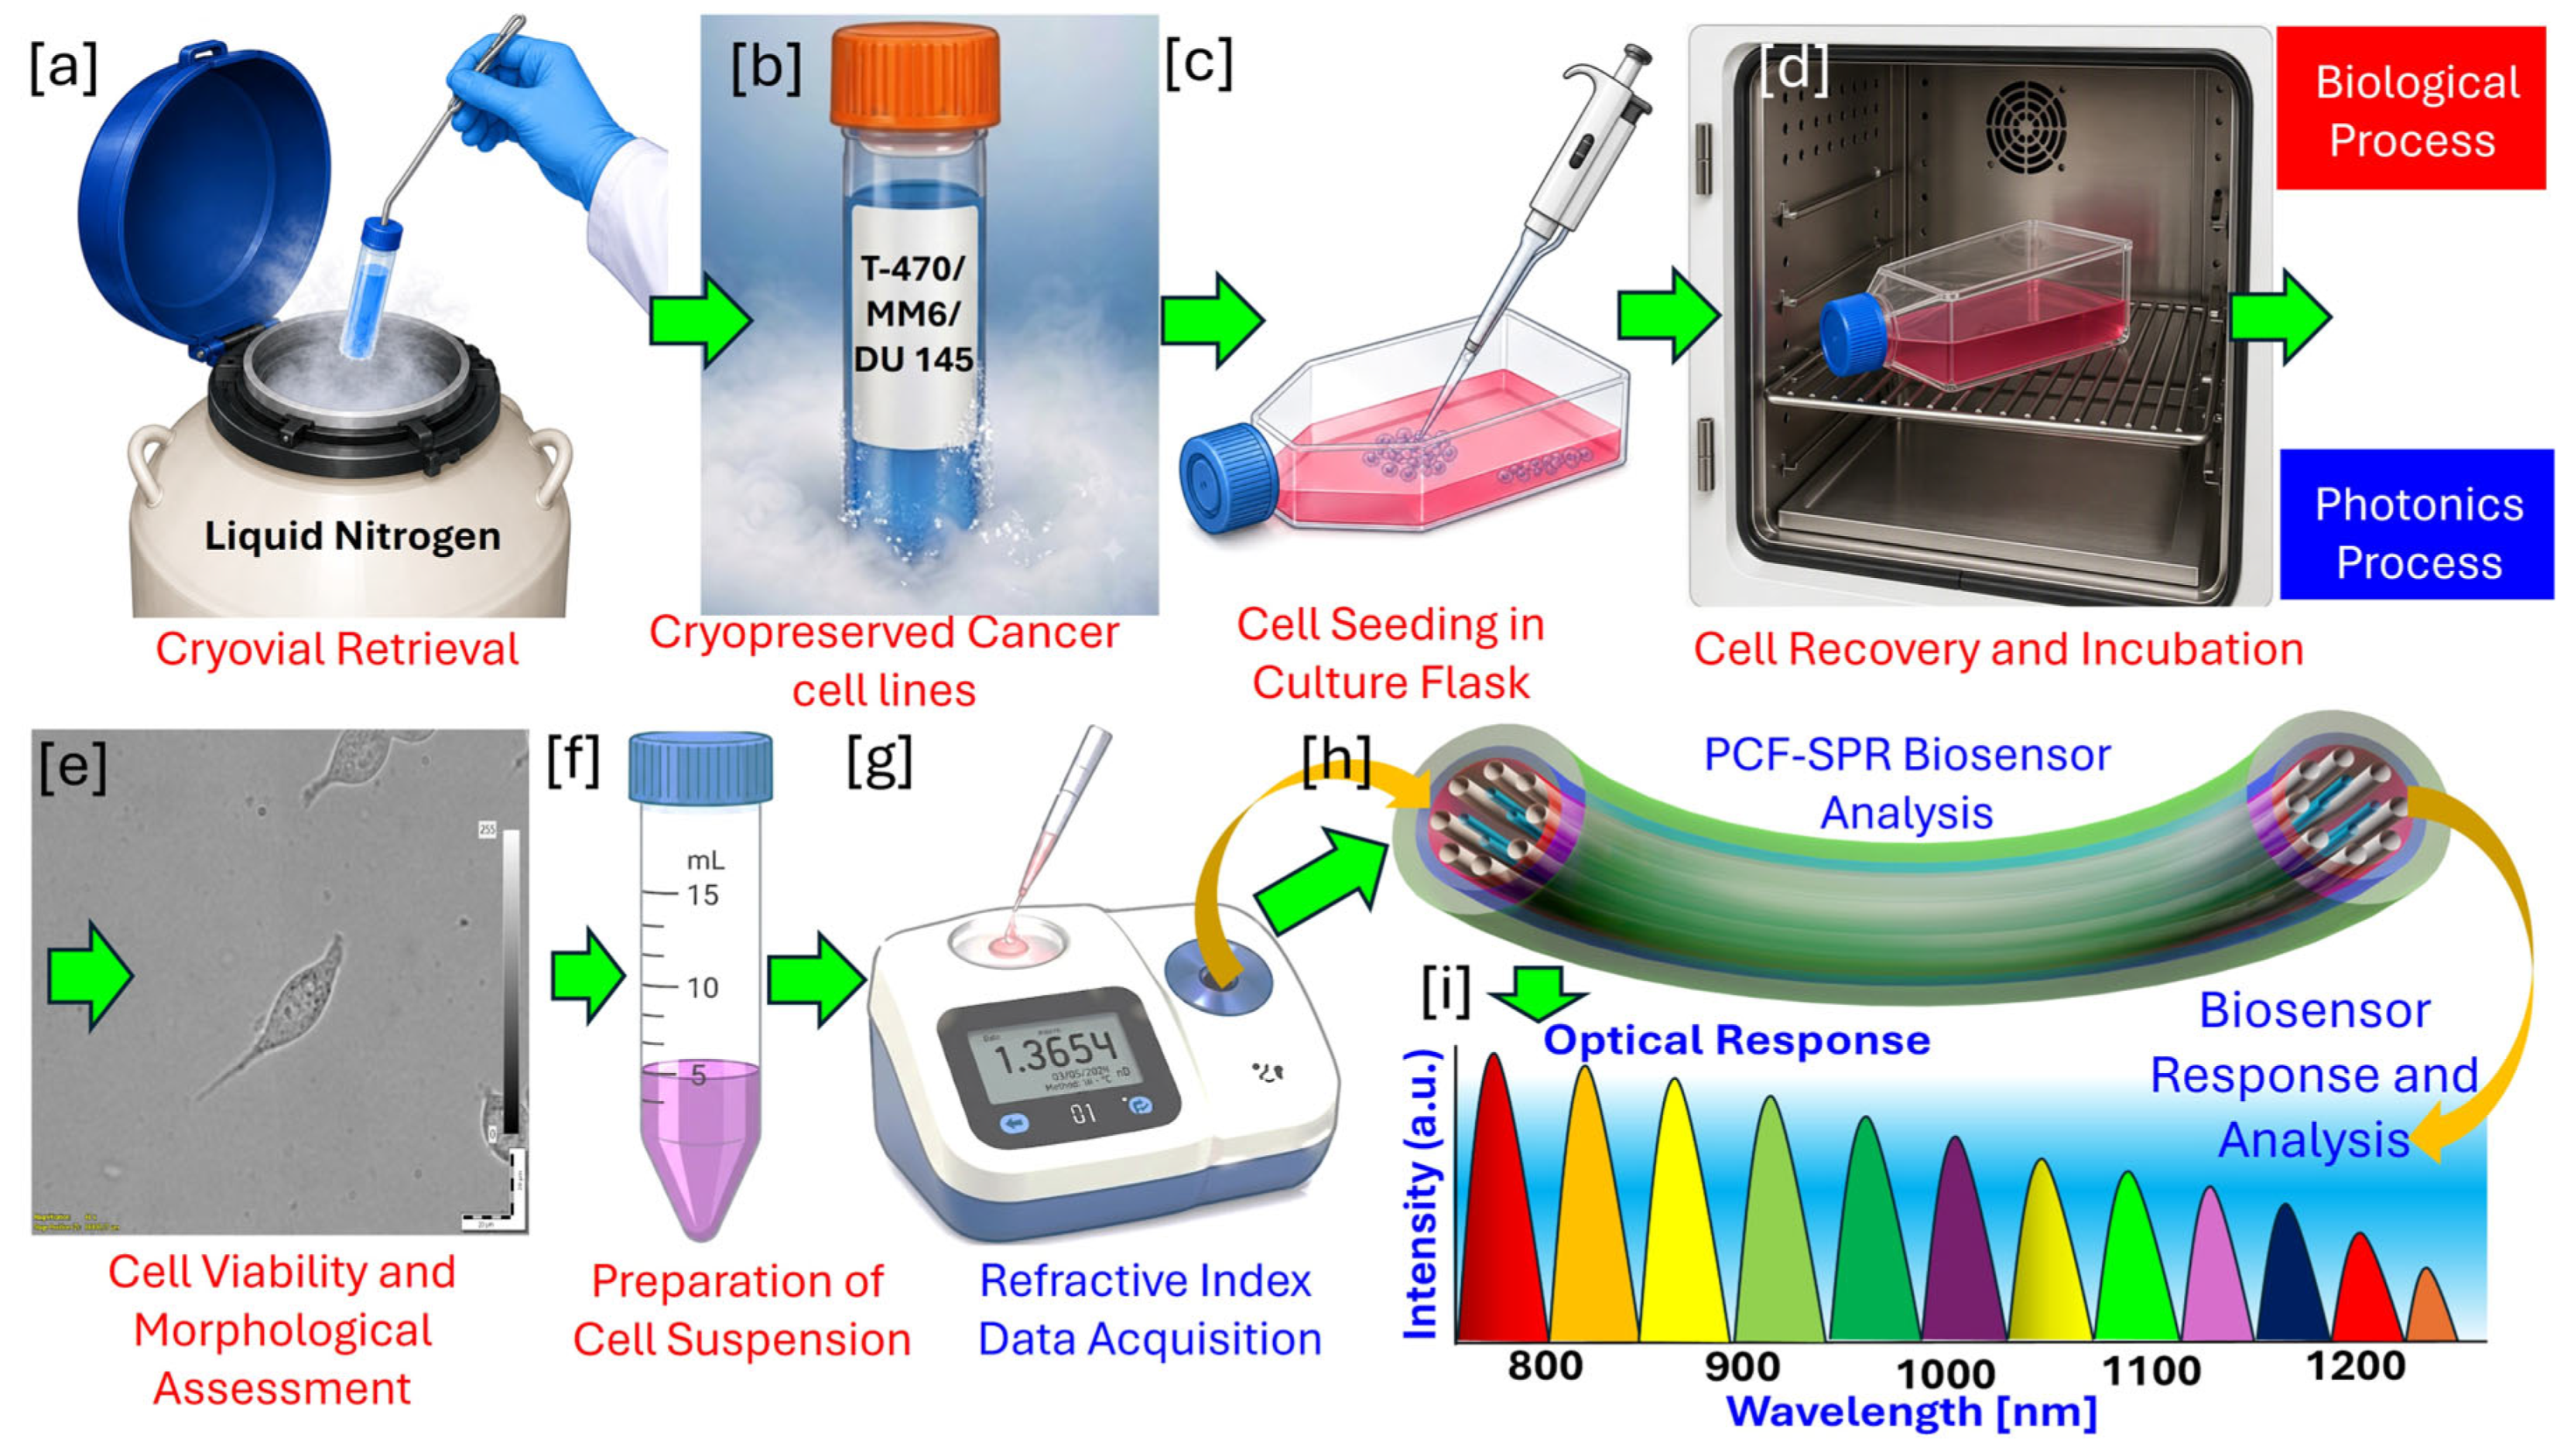
Initially, cryopreserved T - 47 D , M M 6 , and D U 145 cell lines are retrieved from liquid nitrogen as presented in Figure 5a,b. Then, the cells are transferred into the appropriate pre-warmed supplemented culture medium for cell seeding, as presented in Figure 5c. The cells are then incubated under standard cell culture conditions to facilitate cellular recovery and proliferation, as presented in Figure 5d. Following the incubation, cell viability and morphology are evaluated using microscopic examination to ensure the suitability of the recovered cells for further analysis, as represented in Figure 5e. Following cell viability and morphological assessment, the samples were prepared for R I data acquisition, as illustrated in Figure 5f. Although the R I of cancer cell suspensions can be measured using a digital refractometer, the R I values used in this study are adopted from reported literature data and illustrated in Figure 5g [55,57]. The obtained cell line is then subsequently employed as input parameters for the proposed biosensor as presented in Figure 5h. Finally, the biosensor response for different cancer cell lines is analyzed through R W shifts in the optical transmission spectra as presented in Figure 5i. This will enable the differentiation of breast, leukemia, and prostate cancer cell samples based on their distinct R I characteristics.
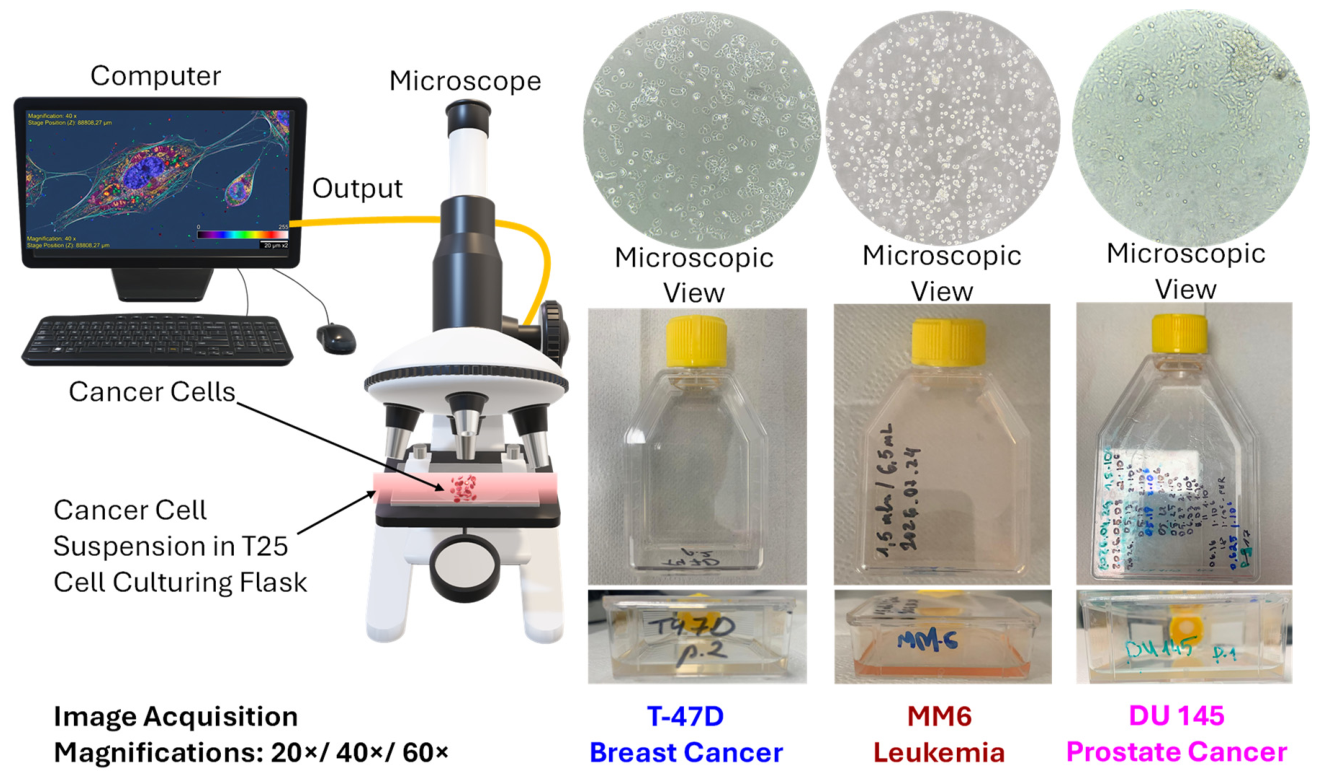
Figure 6 illustrates the experimental workflow used for cancer cell observation and characterization. Cancer cells suspended in culture medium are introduced into an optical fluidic chamber mounted on a microscope stage. The microscopic images are captured and transferred to a computer for visualization and morphological assessment of the cells. Three representative cancer cell lines, T - 47 D , M M 6 and D U 145 , are analyzed. Corresponding microscopic views of the cultured cells are shown along with their R I values of 1.35 ,   1.36 , and 1.37 , respectively [70].
T - 47 D is a widely utilized human breast cancer cell line derived from an invasive ductal carcinoma and is characterized by the expression of estrogen and progesterone receptors, making it a representative model of the luminal-type hormone responsible for breast cancer. These cell lines are extensively employed in studies investigating breast cancer biology, hormone signaling pathways, anticancer drug screening, endocrine resistance, and therapeutic response mechanisms. Morphologically, T - 47 D cells exhibit an epithelial-like phenotype, typically appearing as rounded to polygonal adherent cells that grow in compact clusters due to pronounced cell–cell adhesion.
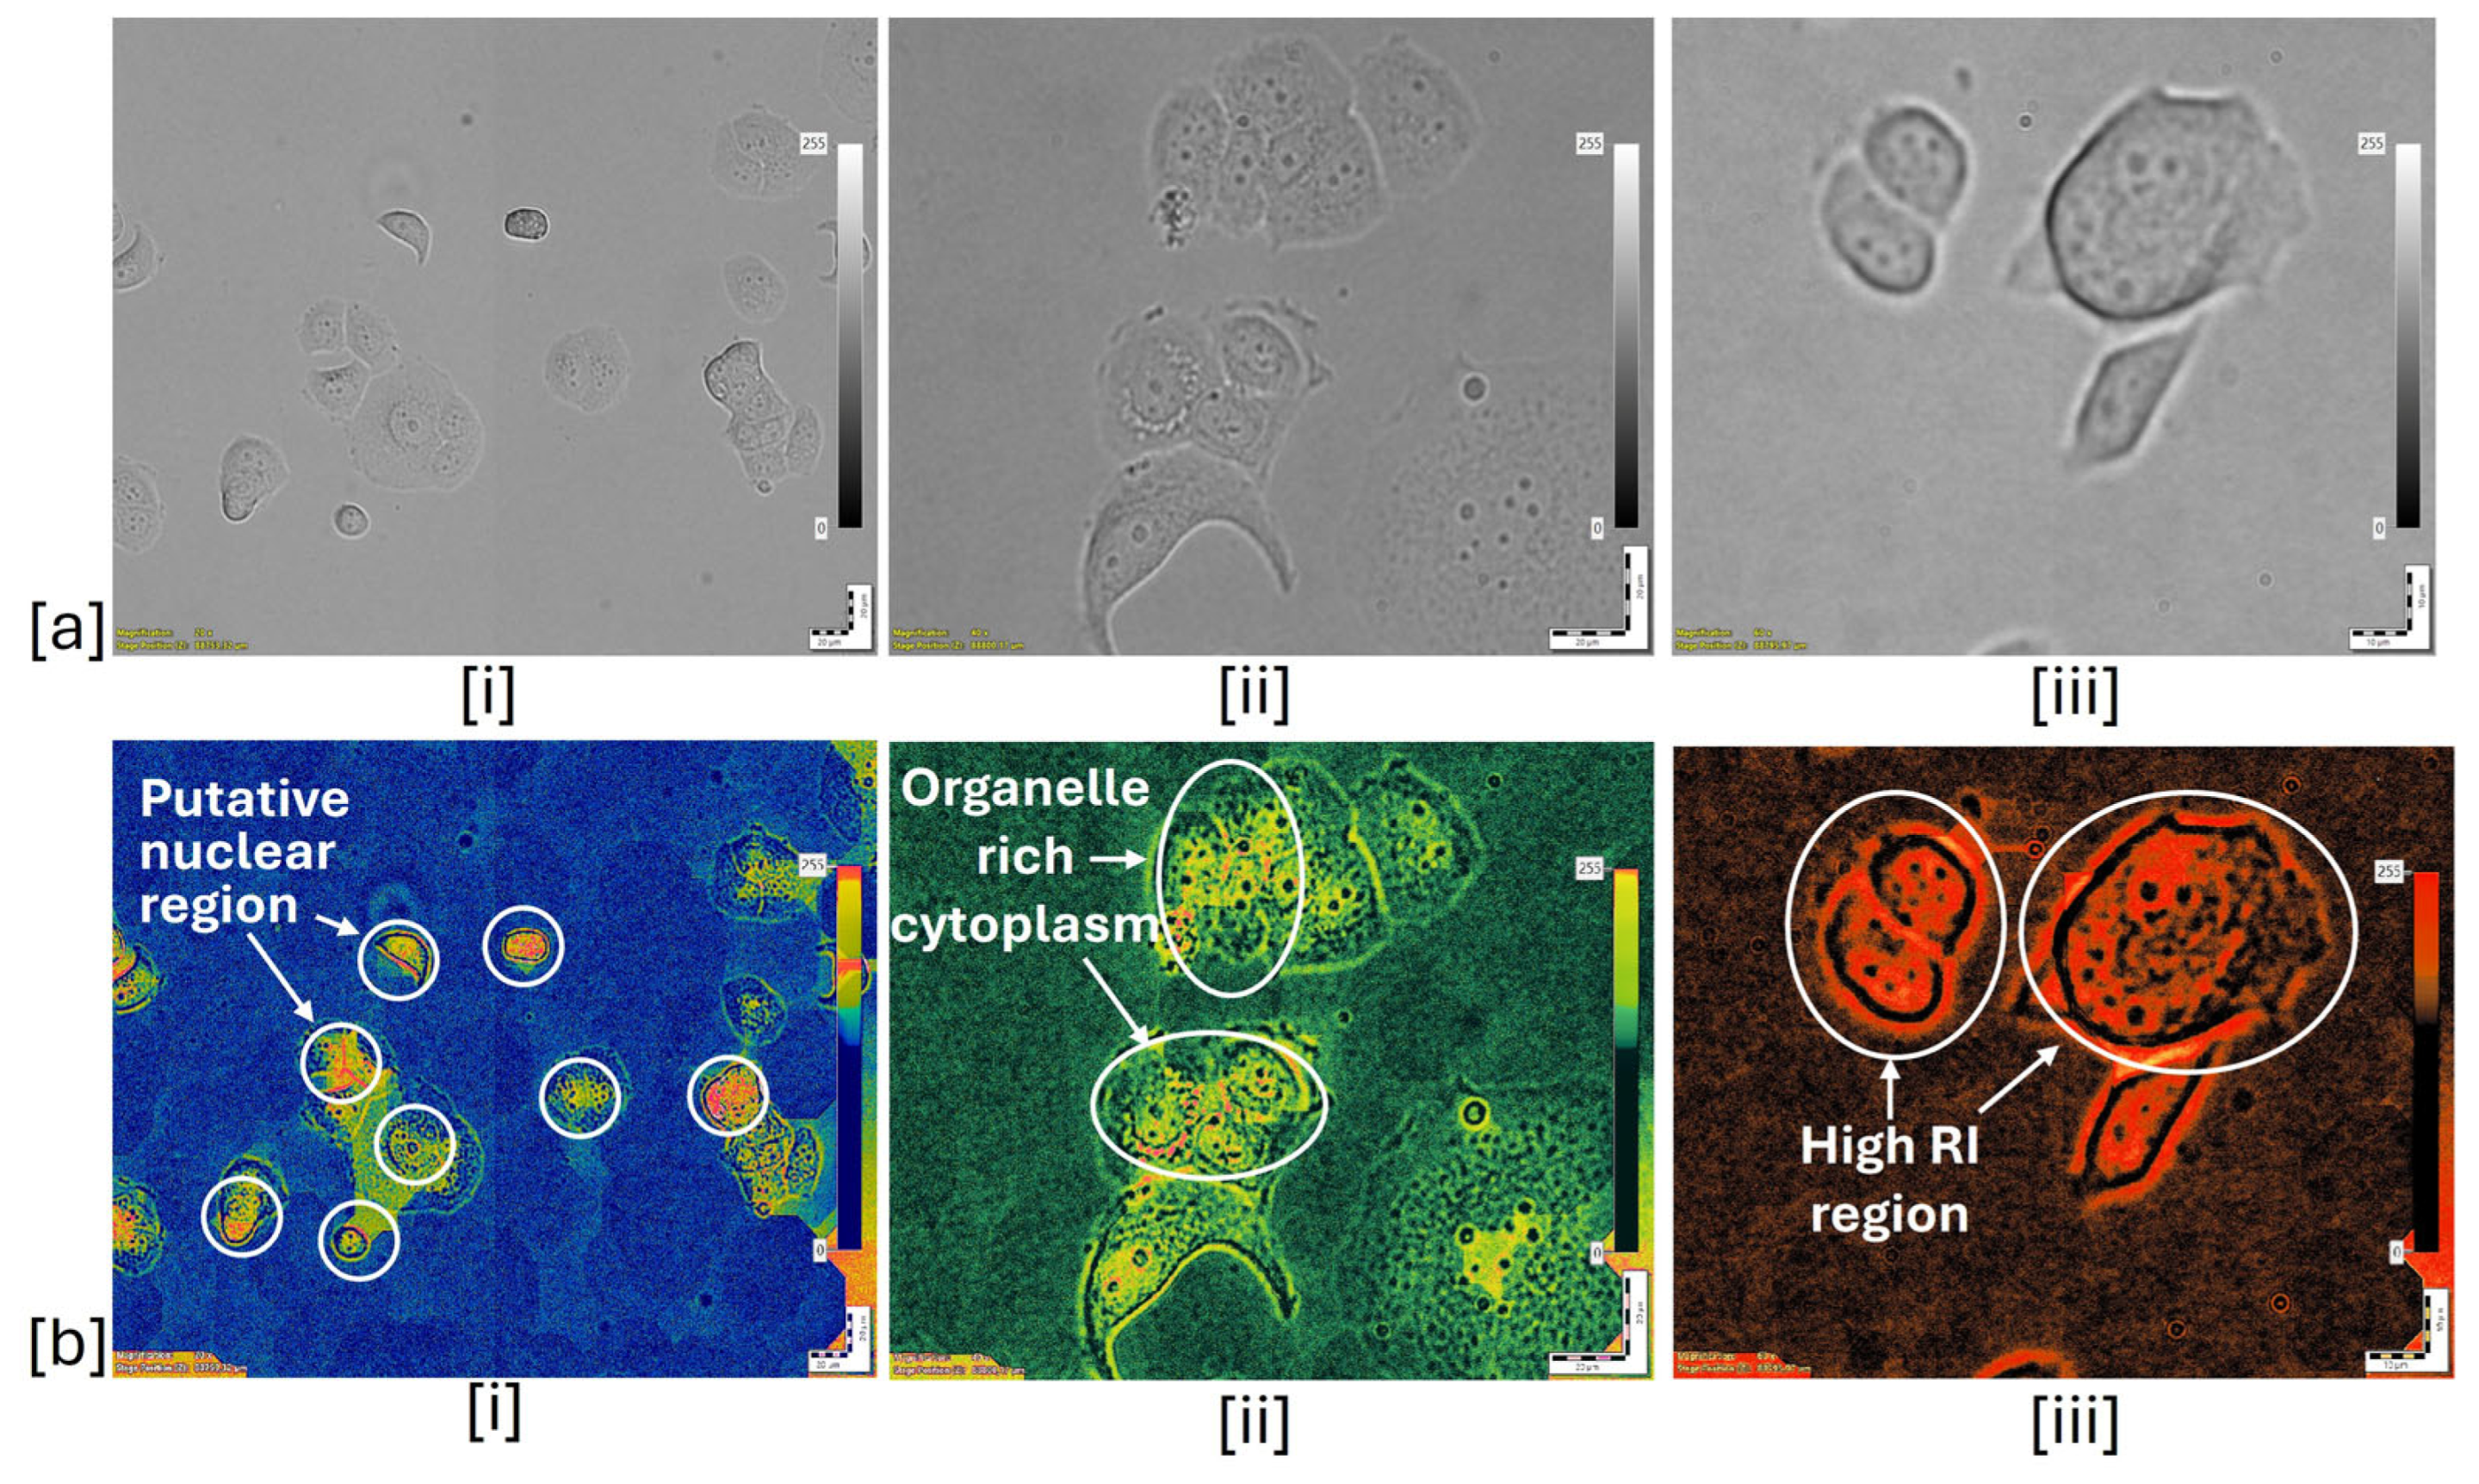
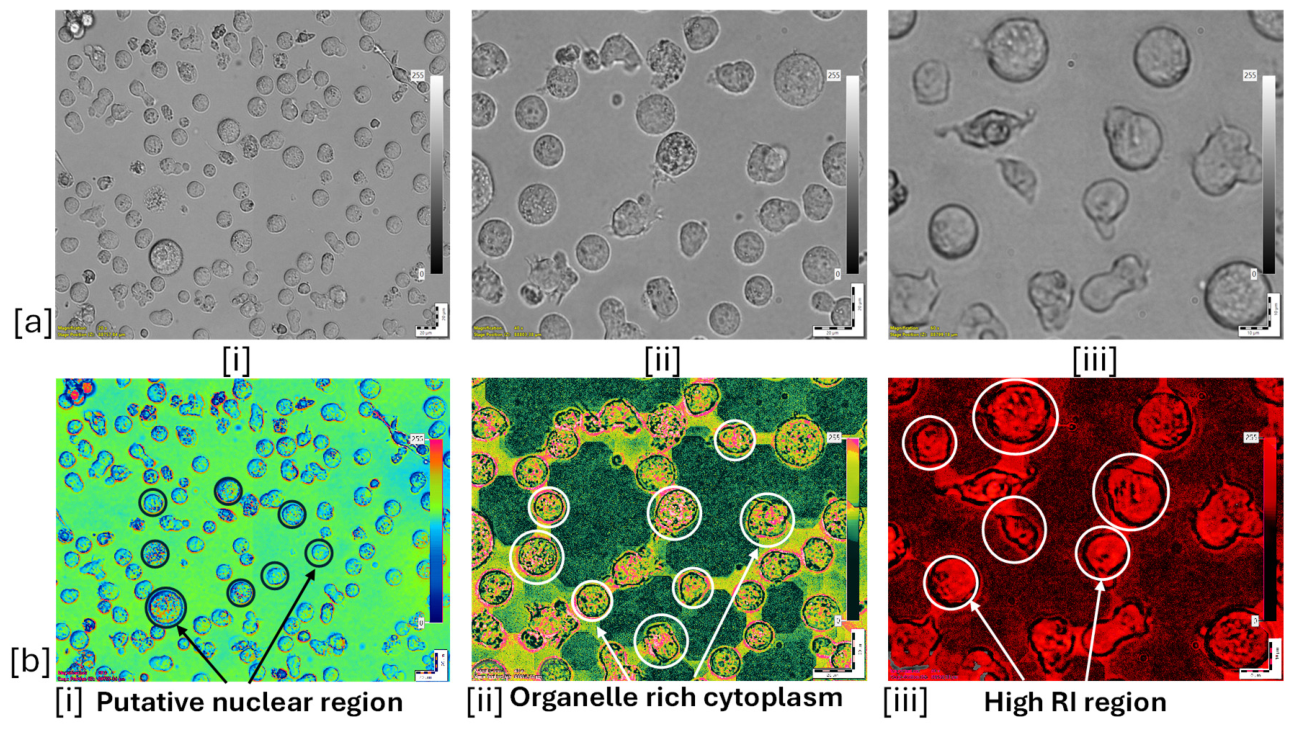
The grayscale microscopic images presented in Figure 7a(i–iii) represent the characteristic morphology of T - 47 D cells at different magnifications ( 20 × , 40 × , and 60 × ). These images reveal the overall cellular distribution, colony organization, and individual cell morphology, while higher magnification images represent improved visualization of cell boundaries, cellular contours, and intracellular texture. The observed clustering behavior and cohesive growth pattern are consistent with the epithelial origin of the T - 47 D cell line. MATLAB R2022b-based color enhancement is performed through intensity-based contrast enhancement and pseudocolor mapping to improve the visual discrimination of the cellular structures, as represented by Figure 7b(i–iii). The enhanced visualizations facilitate clear identification of the cell boundaries, morphological heterogeneity, and the spatial distribution without affecting the underlying biological features. This enhancement is particularly useful for qualitative assessment, image segmentation, and feature extraction, as it highlights subtle variations in pixel intensity caused by cellular morphology and structural organization. Overall, these images present the typical epithelial morphology, clustered growth behavior, and high R I region of 1.35 that is associated with T - 47 D breast cancer cells [70]. The R I value of 1.35 , reported in the literature for breast cancer, is used as an input parameter in the proposed P C F S P R biosensor.
M M 6 leukemia cells are used to continuously proliferate in suspension culture and are characterized by their predominantly spherical morphology and relatively uniform cellular distribution pattern. The grayscale microscopic images of the M M 6 leukemia cell line are acquired at 20 × , 40 × , and 60 × magnifications and are presented in Figure 8a(i–iii) in original form. Figure 8b(i–iii) presents MATLAB-based pseudocolor enhancement for improved visualization. At lower magnification ( 20 × ), the overall population density and distribution of the suspension cells can be readily observed, whereas at the higher magnifications of 40 × and 60 × , enhanced visualization of individual cellular morphology, cell boundaries, and intracellular features is expressed. The images reveal characteristic round leukemia cells with noticeable intracellular heterogeneity and variable optical contrast. The pseudocolor-enhanced images highlight the putative nuclear regions, organelle-rich cytoplasmic compartments, and localized high- R I domains that indicate the spatial variations in intracellular biomolecular concentration and mass density. The observed morphology of the images confirms successful cell recovery, viability, and maintenance under the standard culture conditions. Following morphological characterization, the M M 6 leukemia cells are selected for biosensor demonstration studies. The R I value of 1.36 , reported in the literature for blood cancer associated with leukemia, is subsequently used as an input parameter in the proposed P C F S P R biosensor model [70].
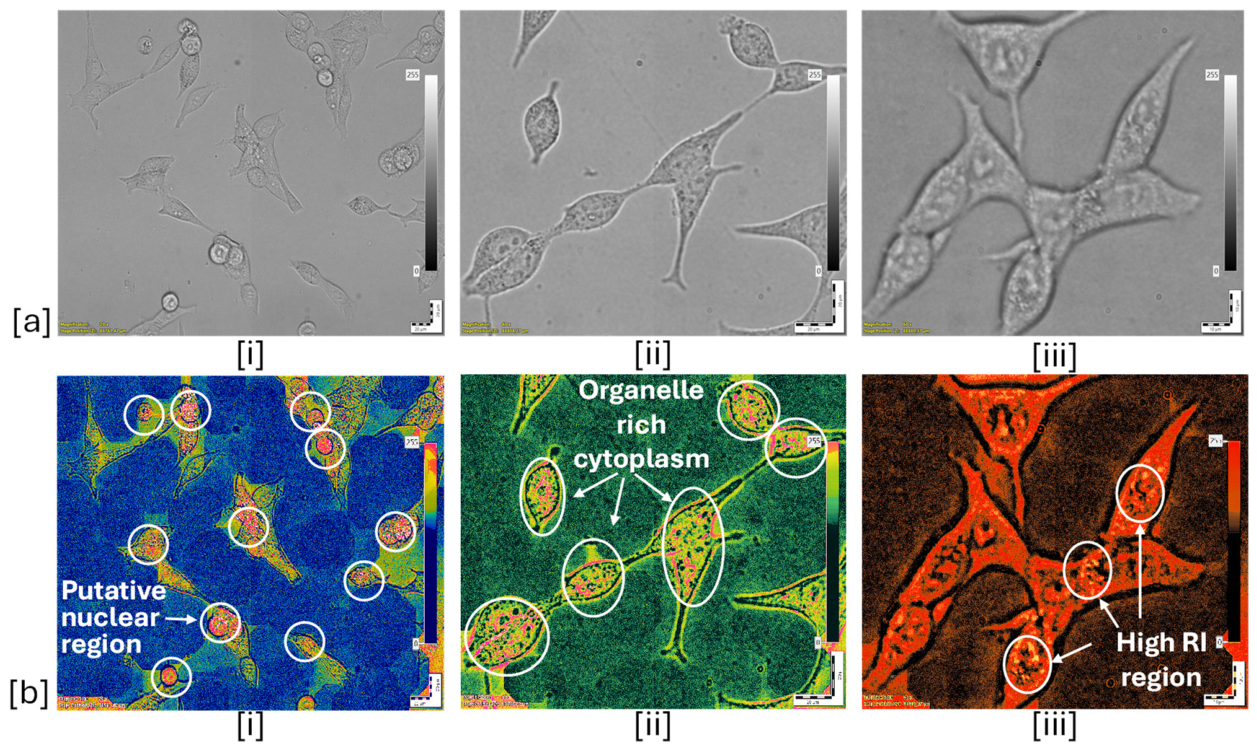
Prostate cancer cells continuously release extracellular vesicles ( E V s ), exosomes, proteins, nucleic acids, and metabolic products into the surrounding medium. These secreted biomolecules can alter the effective R I of the biological environment of the cell. The grayscale microscopic images of the D U 145 prostate cancer cell line are obtained at 20 × , 40 × , and 60 × magnifications and are presented in Figure 9a(i–iii). Figure 9b(i–iii) represents the pseudocolor-based images for better visualization. These cells exhibit a characteristic adherent morphology with distinct cellular boundaries and elongated spindle-like structures. At lower magnification ( 20 × ), the overall cellular distribution and population density of the cells can be observed, while higher magnifications of 40 × and 60 × provide enhanced visualization of the individual cell morphology, cellular contours, and intracellular features. The observed morphological characteristics confirm the successful cell recovery, viability, and growth under the standard culture conditions. Following morphological assessment D U 145 prostate cancer cells are selected for biosensor demonstration. The R I of 1.37 , reported in the literature for prostate cancer, is used as an input parameter in the proposed P C F S P R biosensor [70].

6. Performance Analysis of the Proposed Sensor at the Optimum Plasmonic Thickness

The sensing ability of a P C F S P R sensor for distinguishing various analytes, chemicals, biochemicals, body fluid samples, and cancer cells is determined using several performance parameters. One among the key parameters is C L , which is generally expressed in d B / c m . C L represents the amount of optical power that is lost from the guided mode due to coupling with surface plasmons at the metal–dielectric interface. A higher C L at the resonance condition indicates stronger interaction between the evanescent field and the investigated analyte, which generally improves sensing performance. It is expressed by Equation (5) [71].
C L   ( α ) = 8.686 × k o × i m a g n e f f × 10 4   [ d B / c m ]  
w h e r e   k o is the wave number and is equivalent to 2 π / λ , i m a g n e f f is the imaginary part of the effective R I .
Another important parameter is W S , which is measured in n m / R I U , this parameter defines how much the R W shifts in response to a unit change in R I of the surrounding medium. A larger wavelength shift for a small R I variation indicates higher sensitivity of the sensor. It is evaluated using a wavelength interrogation technique and is expressed by Equation (6) [72].
WS = λ p e a k   λ n a [ nm / RI ]
where λ p e a k represents the change in the R W of the two consecutive analytes and λ n a represents the change R I values of two successive analytes.
A S of the sensor model describes the variation in the transmitted or loss spectrum intensity with respect to changes in R I at a fixed wavelength, and it is useful for intensity-based sensing approaches. It is expressed by Equation (7) [73].
AS = ( 1   α λ ,   n a ) × ( α ( λ ,   n a )   n a )   [ RIU 1 ]
where α λ ,   n a represents the C L of the fundamental mode and α ( λ ,   n a ) represents the change developed in the C L of two successive analytes.
Sensor resolution ( S R ) is measured in R I U and represents the smallest detectable change in R I that the sensor can measure. A lower value of S R indicates a more precise and efficient sensing system. It can be expressed by Equation (8) [74].
SR = n a × ( λ min / λ p e a k ) [ RIU ]
where λ   m i n is the minimum spectral resolution, and usually its value is considered as 0.1   n m . The minimum detectable shift of 0.1   n m is assumed according to the spectral resolution of most of the commercially available optical spectrum analyzer ( O S A ). λ p e a k represents the change in the R W of two consecutive analytes and n a represents the change in the R I of the analytes.
Later, the relationship between R I and R W is established through a calibration or fitting curve; the resulting calibration equation can then be used to estimate unknown R I values from measured R W shifts.
Figure of merit ( F O M ) is an important performance parameter that calculates overall sensing capability by considering both W S and resonance line width. It is expressed by Equation (9) [75].
F O M = W S / F W H M [ R I U 1 ]
where W S represents the wavelength sensitivity ( n m / R I U ) and F W H M denotes the full width at half maximum ( n m ) of the resonance loss spectrum.
Together, these parameters collectively determine the overall performance and reliability of a P C F S P R sensor for practical sensing applications.

Sensor Simulation Results at the Optimum Thickness of Plasmonic Material

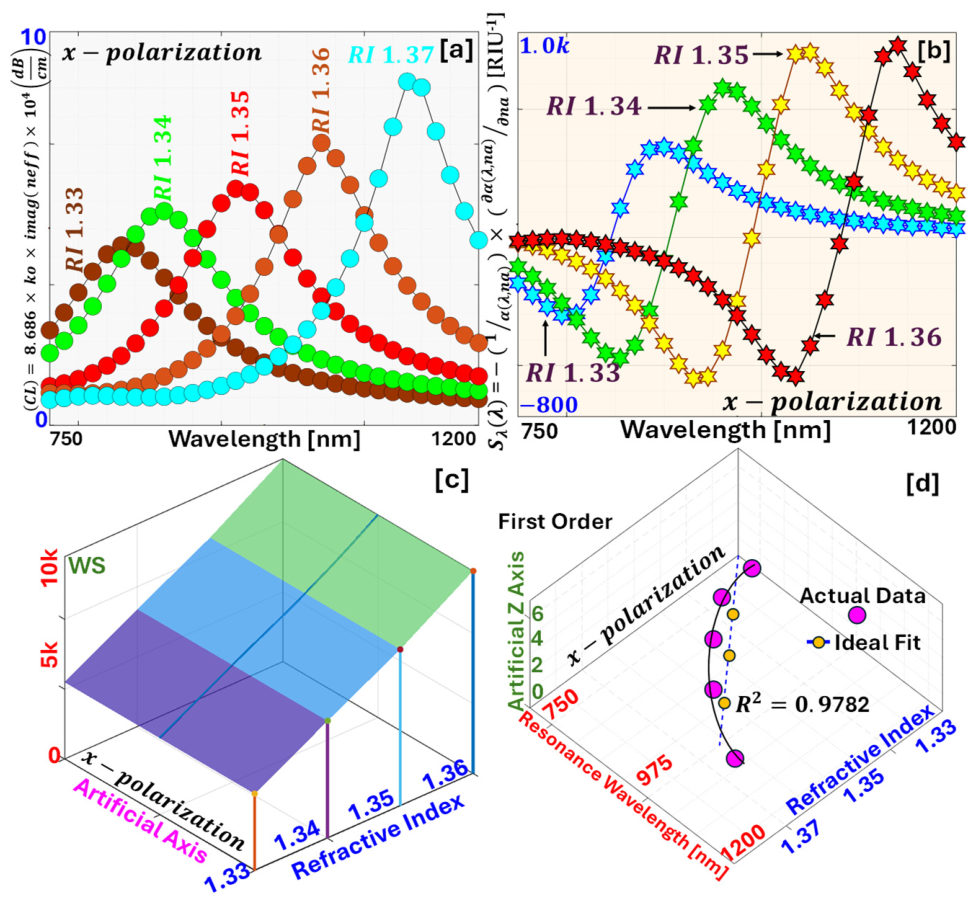
In this section, we have investigated the sensor sensing behavior at the optimum thickness of plasmonic materials, i.e., 45   n m   A u   and 85   n m   T i O 2 for both x - p o l . and y - p o l . , respectively. The numerical investigations are carried out in the wavelength range of 750–1200 nm with a wavelength increment of 15 nm. The simulation results corresponding to x - p o l . of the sensor model are presented in Figure 10.
Figure 10a represent C L of 4.1053 ,   4.5303 , 5.4944 ,   7.1458 and 9.2657   d B / c m for R I   1.33   (water), 1.34 (urine sample-normal), 1.35 ( T - 47 D breast cancer), 1.36 ( M M 6 -leukemia) and 1.37 ( D U 145 prostate cancer) respectively corresponding to x - p o l . at R W of 834.06 ,   870.09 ,   950.48 ,   1035.15 , and 1132.84   n m respectively. Figure 10b represents A S of 303.834 ,   471.384 ,   550.377 and 623.182   R I U 1 for water, urine sample, T - 47 D breast cancer and M M 6 leukemia, respectively, corresponding to x - p o l . The W S of 3603 ,   8039 ,   8467 and 9769   n m / R I U is obtained for water, urine sample, T - 47   D breast cancer, and M M 6 leukemia, respectively, corresponding to x - p o l . as represented in Figure 10c. Figure 10d represents the first-order linear relationship between the R W and R I . The linear relationship is expressed by Equation (10).
f x = p 1 x + p 2
where p 1 = 7626 , and p 2 = 9331 . The goodness of fit is expressed by parameters like sum of squared error ( S S E ) = 1295 , root mean square error ( R M S E ) = 20.78 , adjusted R 2 = 0.971 , and the coefficient of determination R 2 = 0.9782 , representing good fitting between the sensor parameters corresponding to x - p o l . The minimum detectable shift of 0.1   n m is assumed according to the spectral resolution of most of the commercially available O S A while calculating S R for the proposed sensor. The S R of 2.7755 × 10 5 , 1.12439 × 10 5 , 1.1811 × 10 5 , and 1.0236 × 10 5   R I U is obtained for water, urine sample, T - 47 D breast cancer and M M 6 leukemia, respectively, for x - p o l . Finally, the F W H M of 166.04 , 187.62 , 183.79 , and 162.34   n m is obtained, resulting in F O M of 21.69 , 42.84 , 46.06 , and 60.17   R I U 1 for water, urine sample, T - 47 D breast cancer, and M M 6 leukemia, respectively, corresponding to x - p o l .
Table 3 summarizes the calculated sensing parameters of the proposed biosensor for x - p o l . conditions.
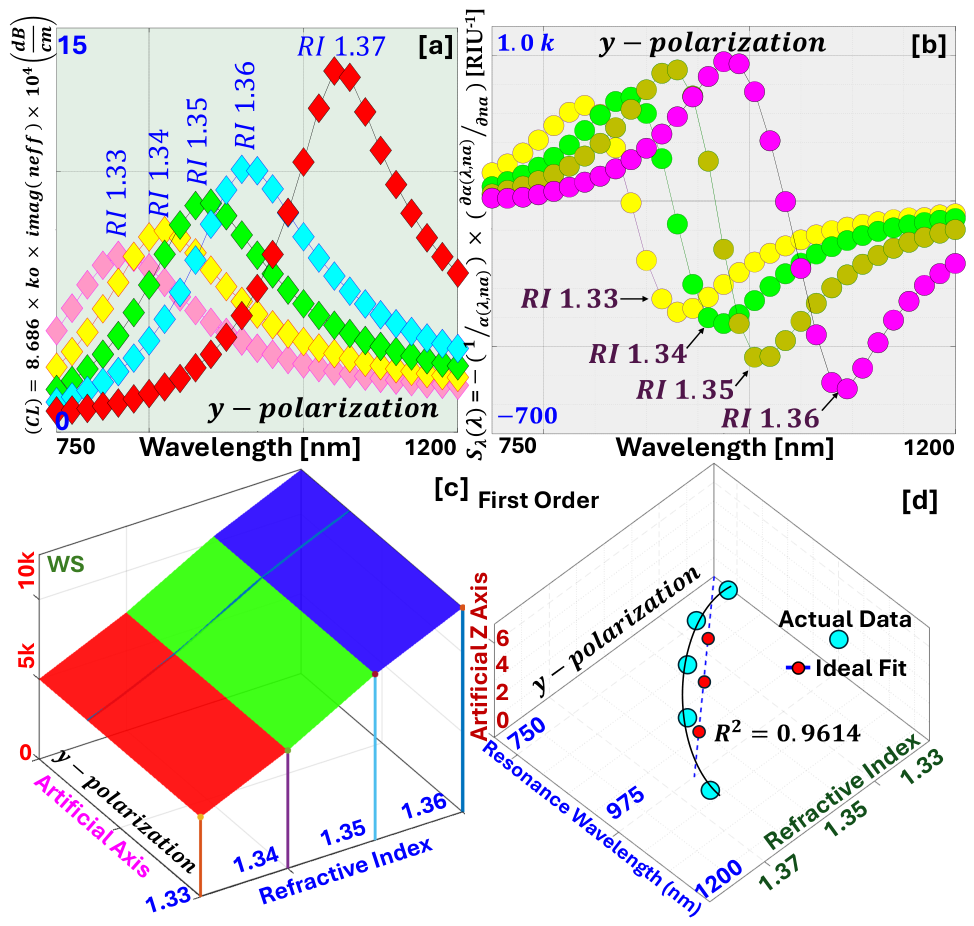
Similarly, Figure 11a represents the C L of 8.2412 , 9.0605 , 9.9879 , 11.213 and 14.5579   d B / c m for water, urine sample-normal, T - 47 D breast cancer, M M 6 - leukemia and D U - 145 prostate cancer, respectively, corresponding to y - p o l . at R W of 870 ,   914.43 , 952.75 , 989.77 , and 1080.46   n m , respectively. Figure 11b represents A S of 381.737 ,   421.089 ,   534.213 , and 645.087   R I U 1 for water, urine sample-normal, T - 47 D breast cancer, and M M 6 - leukemia, respectively, corresponding to y - p o l .  Figure 11c represents the W S of 4443 , 3832 ,   3702 , and 9069   n m / R I U for water, urine sample-normal,   T - 47 D breast cancer, and M M 6 - leukemia, respectively, corresponding to y - p o l .  Figure 11d represents the first-order linear relationship between the R W and R I . The linear relationship is expressed by Equation (10).
Where p 1 = 4963 and p 2 = 5738 . The goodness of fit can be expressed by parameters like S S E = 987.7 , R M S E = 18.14 , adjusted R 2 = 0.9486 and R 2   =   0.9614 showcasing good fitting between the sensor parameters corresponding to y - p o l . The S R of 2.2507 × 10 5 , 2.6096 × 10 5 , 2.7012 × 10 5 and 1.1027 × 10 5 is obtained for the water, urine sample, T 47 - breast cancer, and M M 6 - leukemia for y - p o l . respectively. Finally, the F W H M of 189.31 , 183.43 , 179.0 and 171.08   n m is obtained resulting F O M of 23.41 , 20.89 , 20.68 and 53.01   R I U 1 for water, urine sample, T - 47 D breast cancer and M M 6 leukemia, respectively, corresponding to y - p o l .
Table 4 summarizes the calculated sensing parameters of the proposed biosensor for y - p o l . conditions.
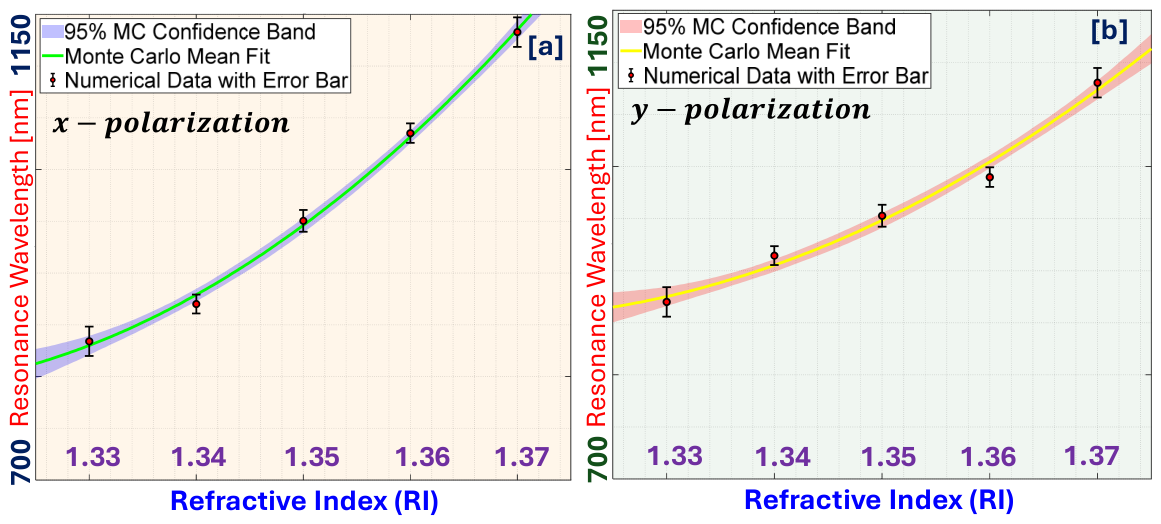
To further evaluate the reliability of the R W R I relationship, a Monte Carlo-based uncertainty analysis comprising 2000 realizations is performed for both polarization modes. The resulting 95 % confidence bands and error bars are presented in Figure 12a,b corresponding to x - p o l . and y - p o l . , respectively. The relatively narrow confidence intervals indicate good robustness of the fitted calibration models and support the reliability of the extracted sensitivity values.

7. Effect of Increased Material Thickness on Sensor Performance

7.1. Evaluation of Sensing Performance at Increased Thickness of Plasmonic Material

This section showcases the result of the sensing performance of the proposed sensor when the thickness of the plasmonic materials is increased beyond the optimum thickness. The thickness of the plasmonic materials is increased by 5   n m , due to which the new thickness of A u and T i O 2 is increased to become 50   n m and 90   n m respectively.
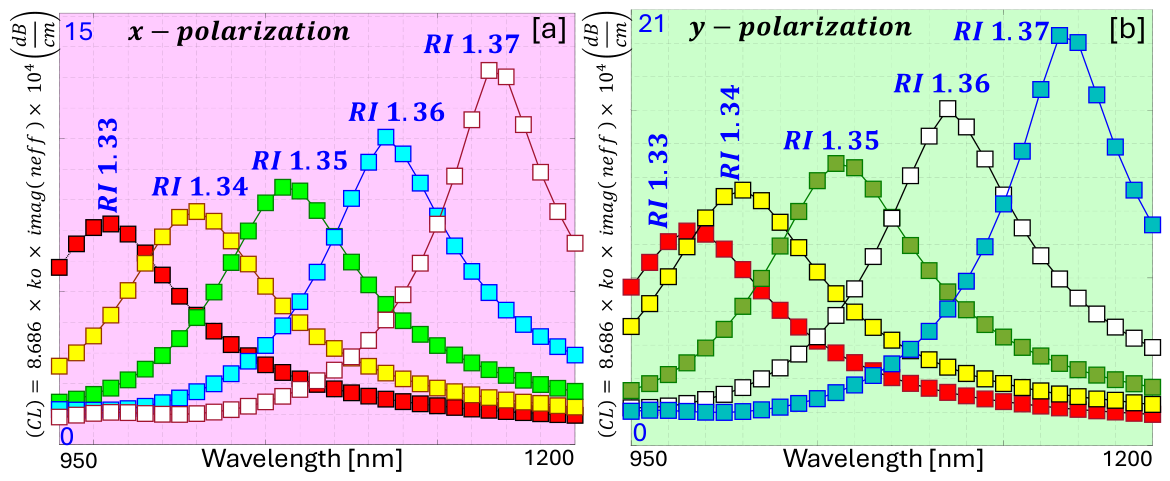
Figure 13a represents the C L of 7.6326 , 8.5637 ,   9.6891 ,   11.1321 , and 12.92   d B / c m for water, urine sample-normal, T - 47 D breast cancer, M M 6 - leukemia and D U 145 prostate cancer, respectively, corresponding to x - p o l . Similarly, Figure 13b represents the C L of 12.3262 ,   13.8061 , 15.6219 , 17.9055 , and 20.8131   d B / c m for water, urine sample-normal, T - 47 D breast cancer, M M 6 - leukemia and D U 145 prostate cancer, respectively, corresponding to y - p o l .
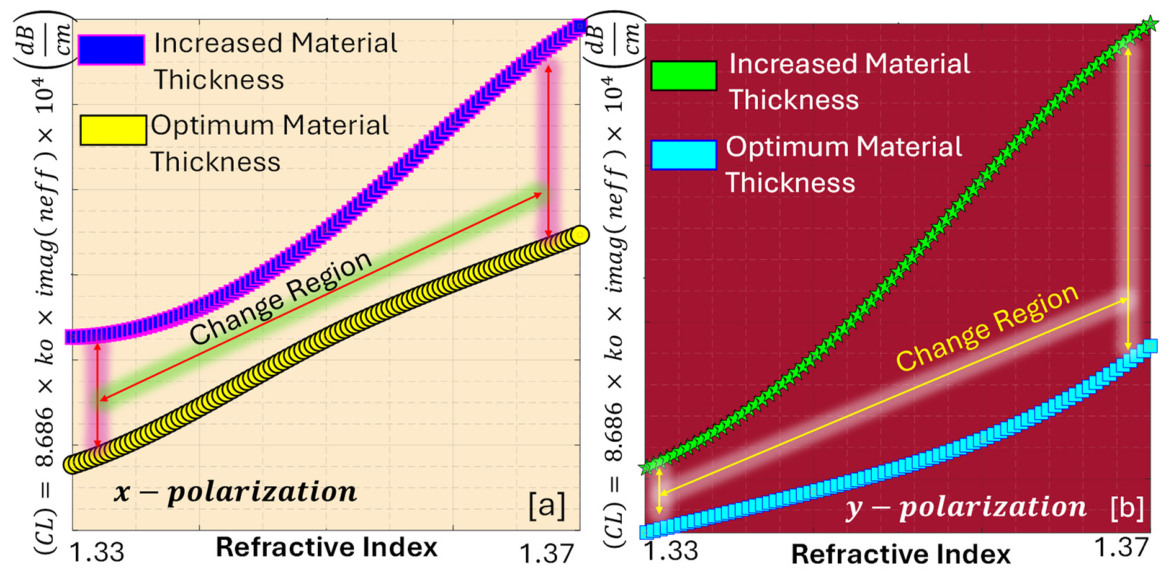
Figure 14a,b represents the behavior of the C L at the optimized thickness and at the improved thickness of plasmonic materials for x - p o l . and y - p o l . , respectively. Here, it can be observed clearly that when the thickness of plasmonic materials is increased beyond the optimum thickness, an increase in the C L for the sensor model is observed for x - p o l . and y - p o l .   , respectively.
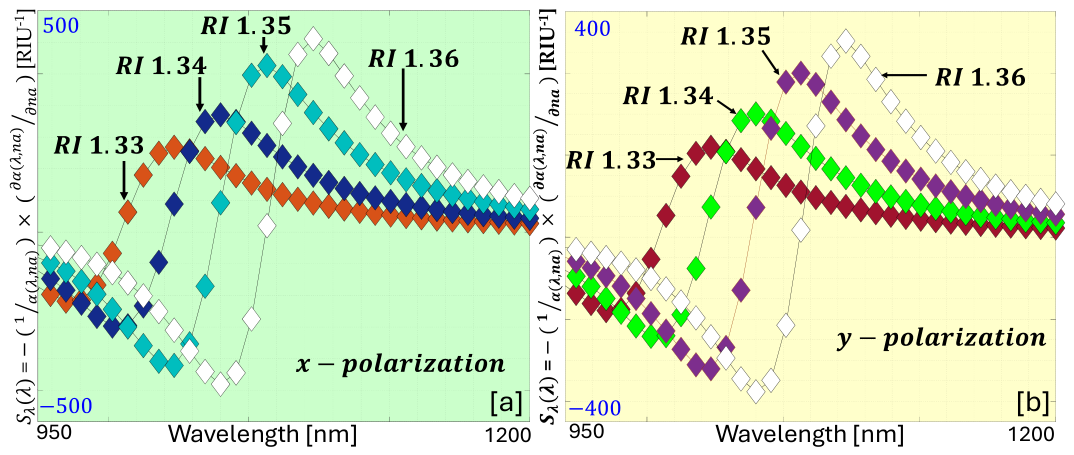
Figure 15 represents the A S corresponding to increased thickness of plasmonic materials for x - p o l . and y - p o l . respectively. Figure 15a represent A S of 225.031 ,   300.143 ,   421.624 , and 480.913   R I U   1 for water, urine sample-normal, T - 47 D breast cancer, and M M 6 - leukemia, respectively, corresponding to x - p o l .  Figure 15b represents A S of 283.283 , 320.169 ,   341.06 , and 376.898   R I U 1 for water, urine sample-normal, T - 47 D breast cancer, and M M 6 - leukemia, respectively, corresponding to y - p o l .
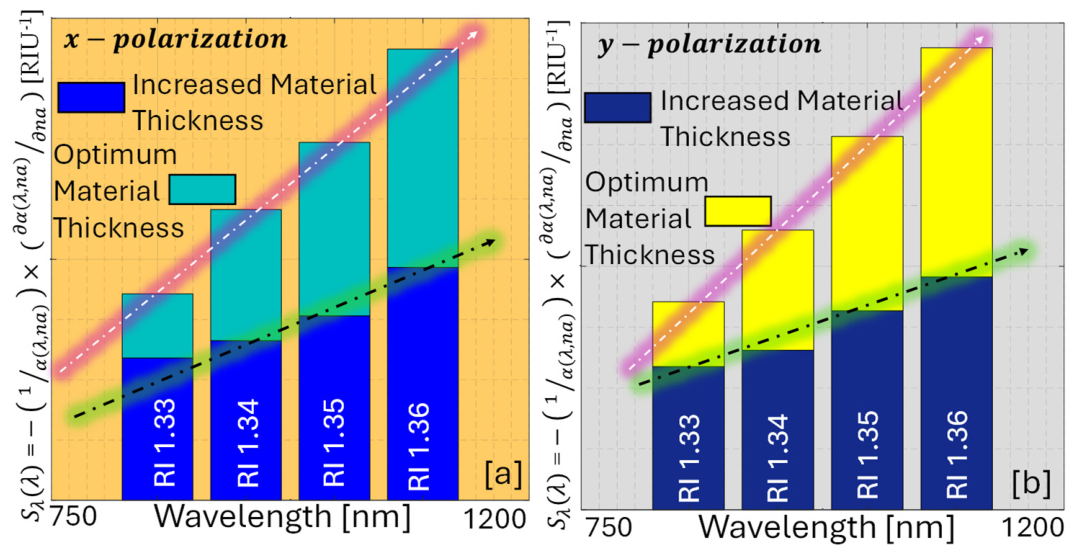
Figure 16a,b represents the behavior of the A S at optimized thickness and at improved thickness of plasmonic materials for x - p o l . and y - p o l . respectively. Here, it can be observed clearly that when the thickness of plasmonic materials is increased beyond optimum thickness, a decrease in the A S for the sensor model is observed.
Thus, it can be observed that when the thickness of the plasmonic material exceeds its optimum value, the penetration of the evanescent field into the plasmonic layer is reduced. Due to this, the coupling and phase matching between the core-guided mode and the S P P mode gets weakened. Consequently, the C L characteristics deteriorate, leading to a reduction in W S and A S of the proposed sensor and other sensing parameters.

7.2. Fabrication Tolerance Assessment of the Proposed Sensor

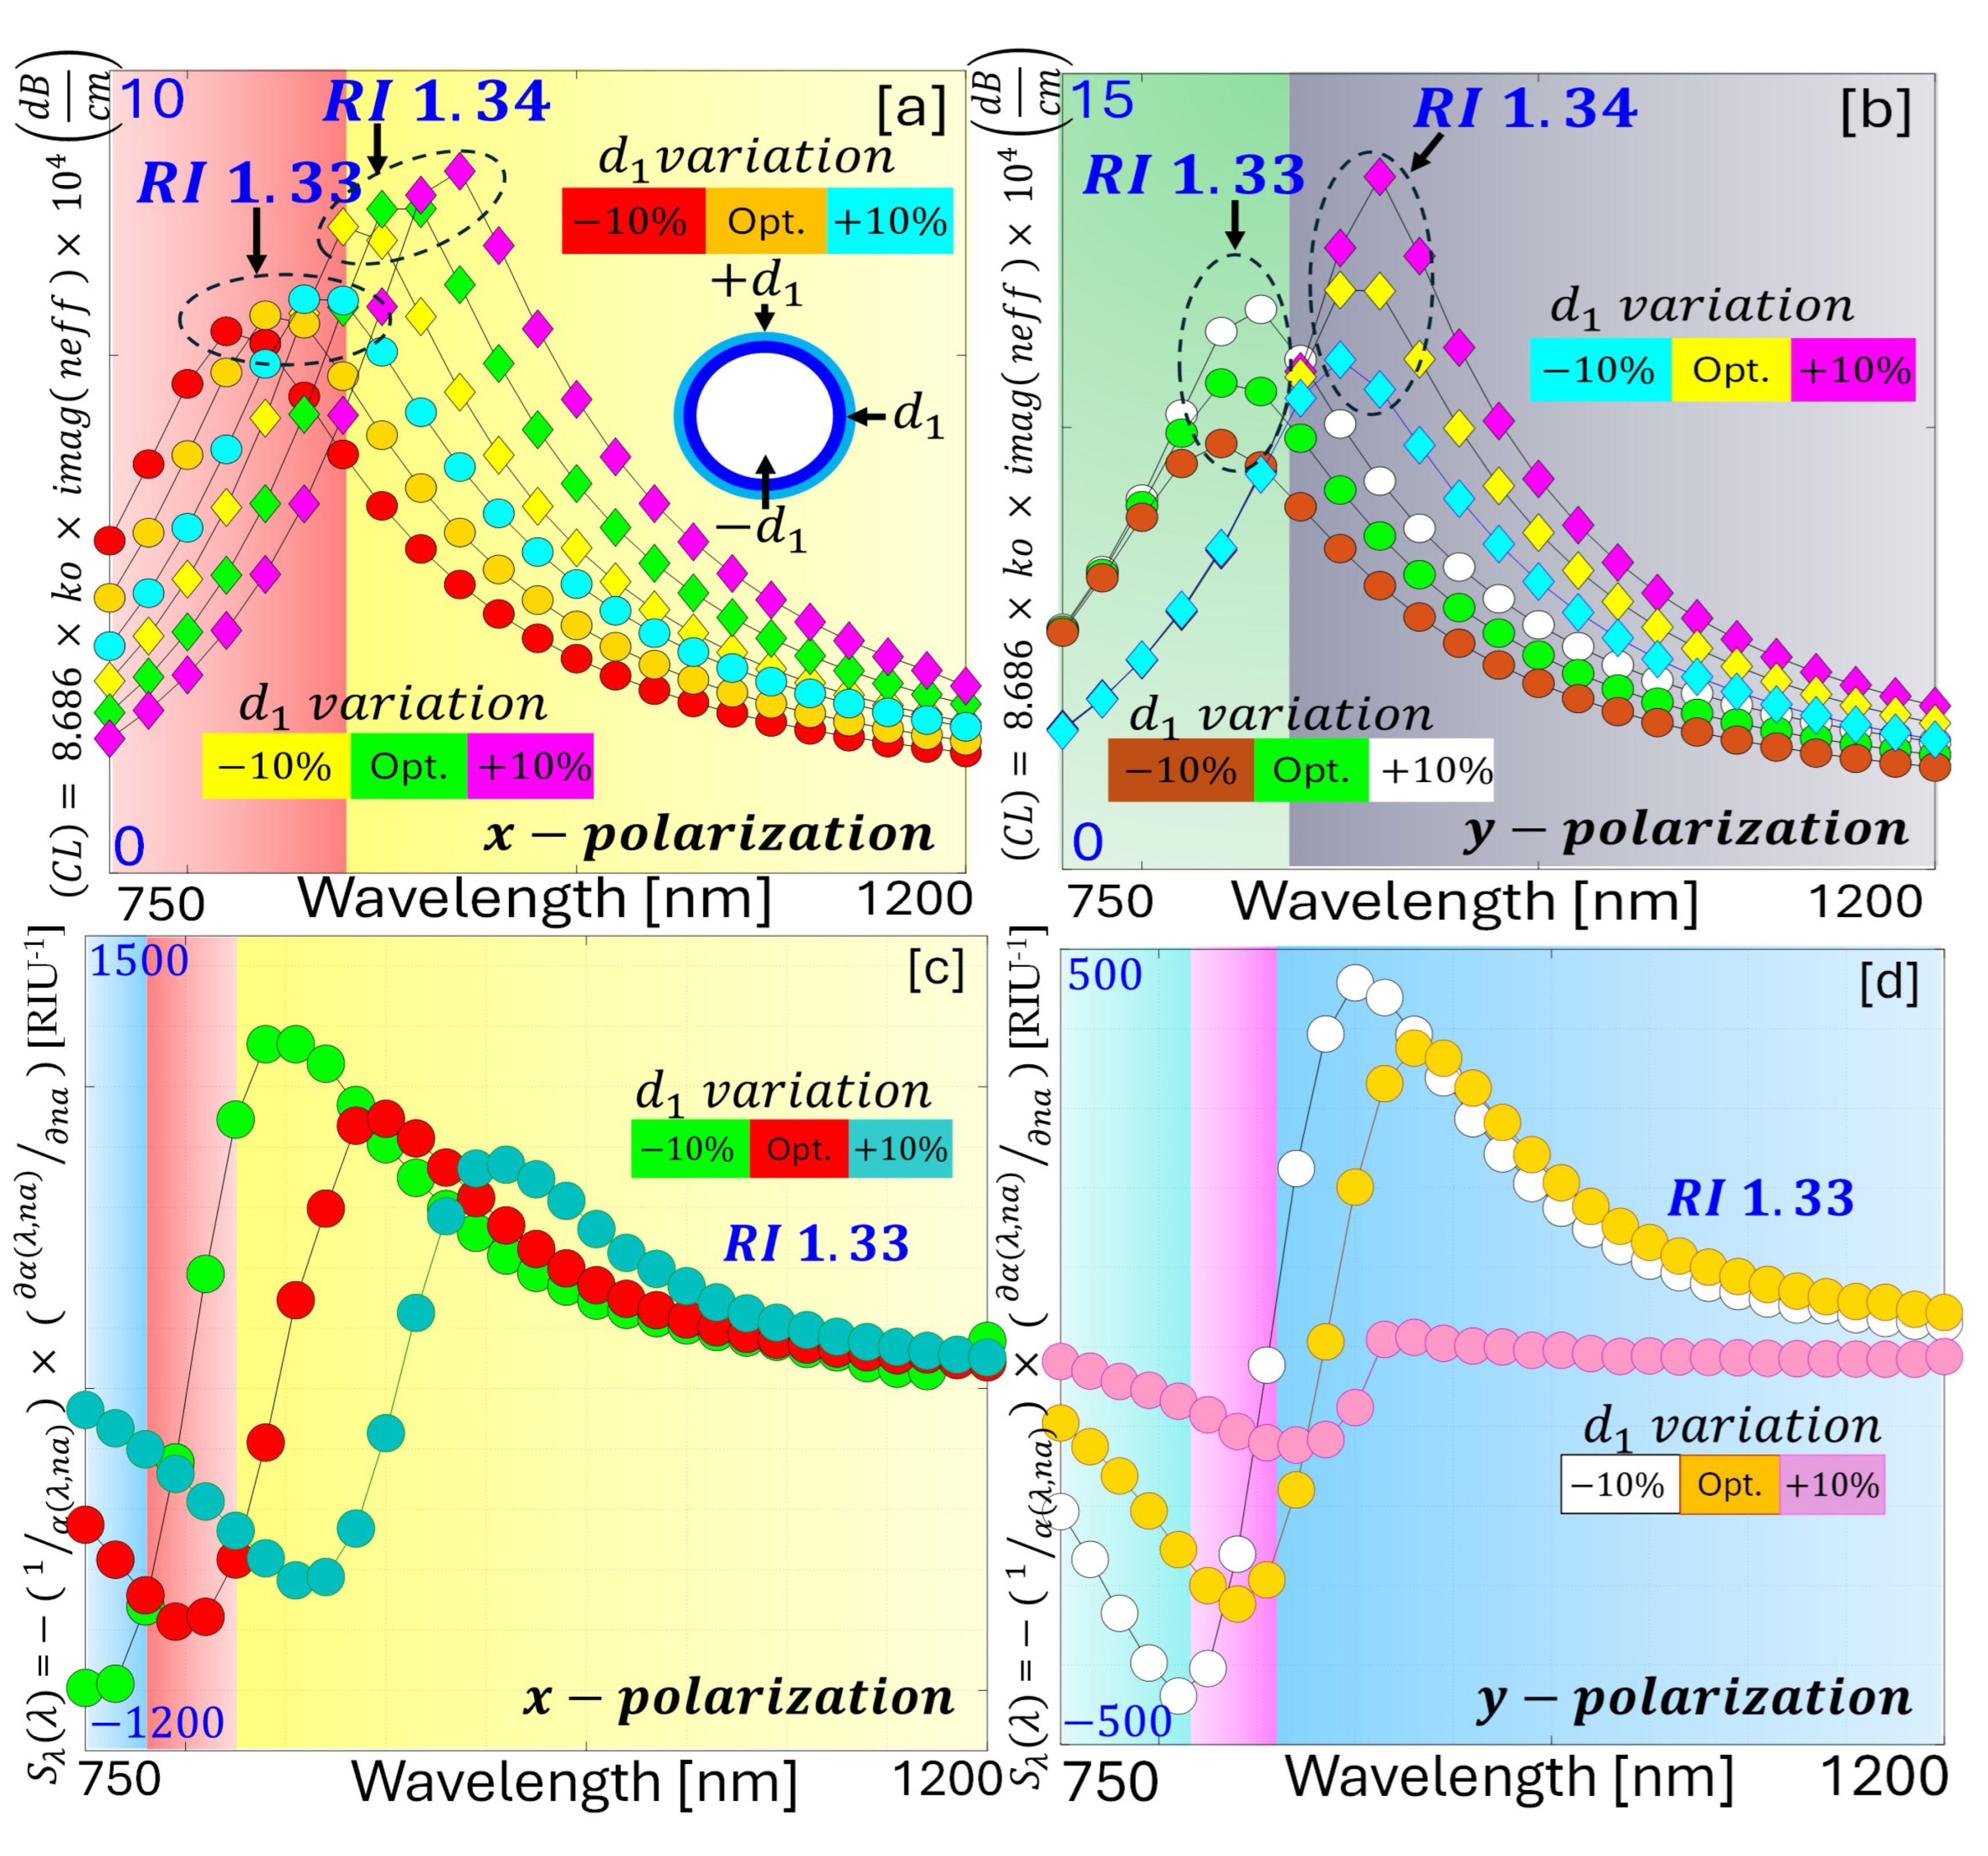
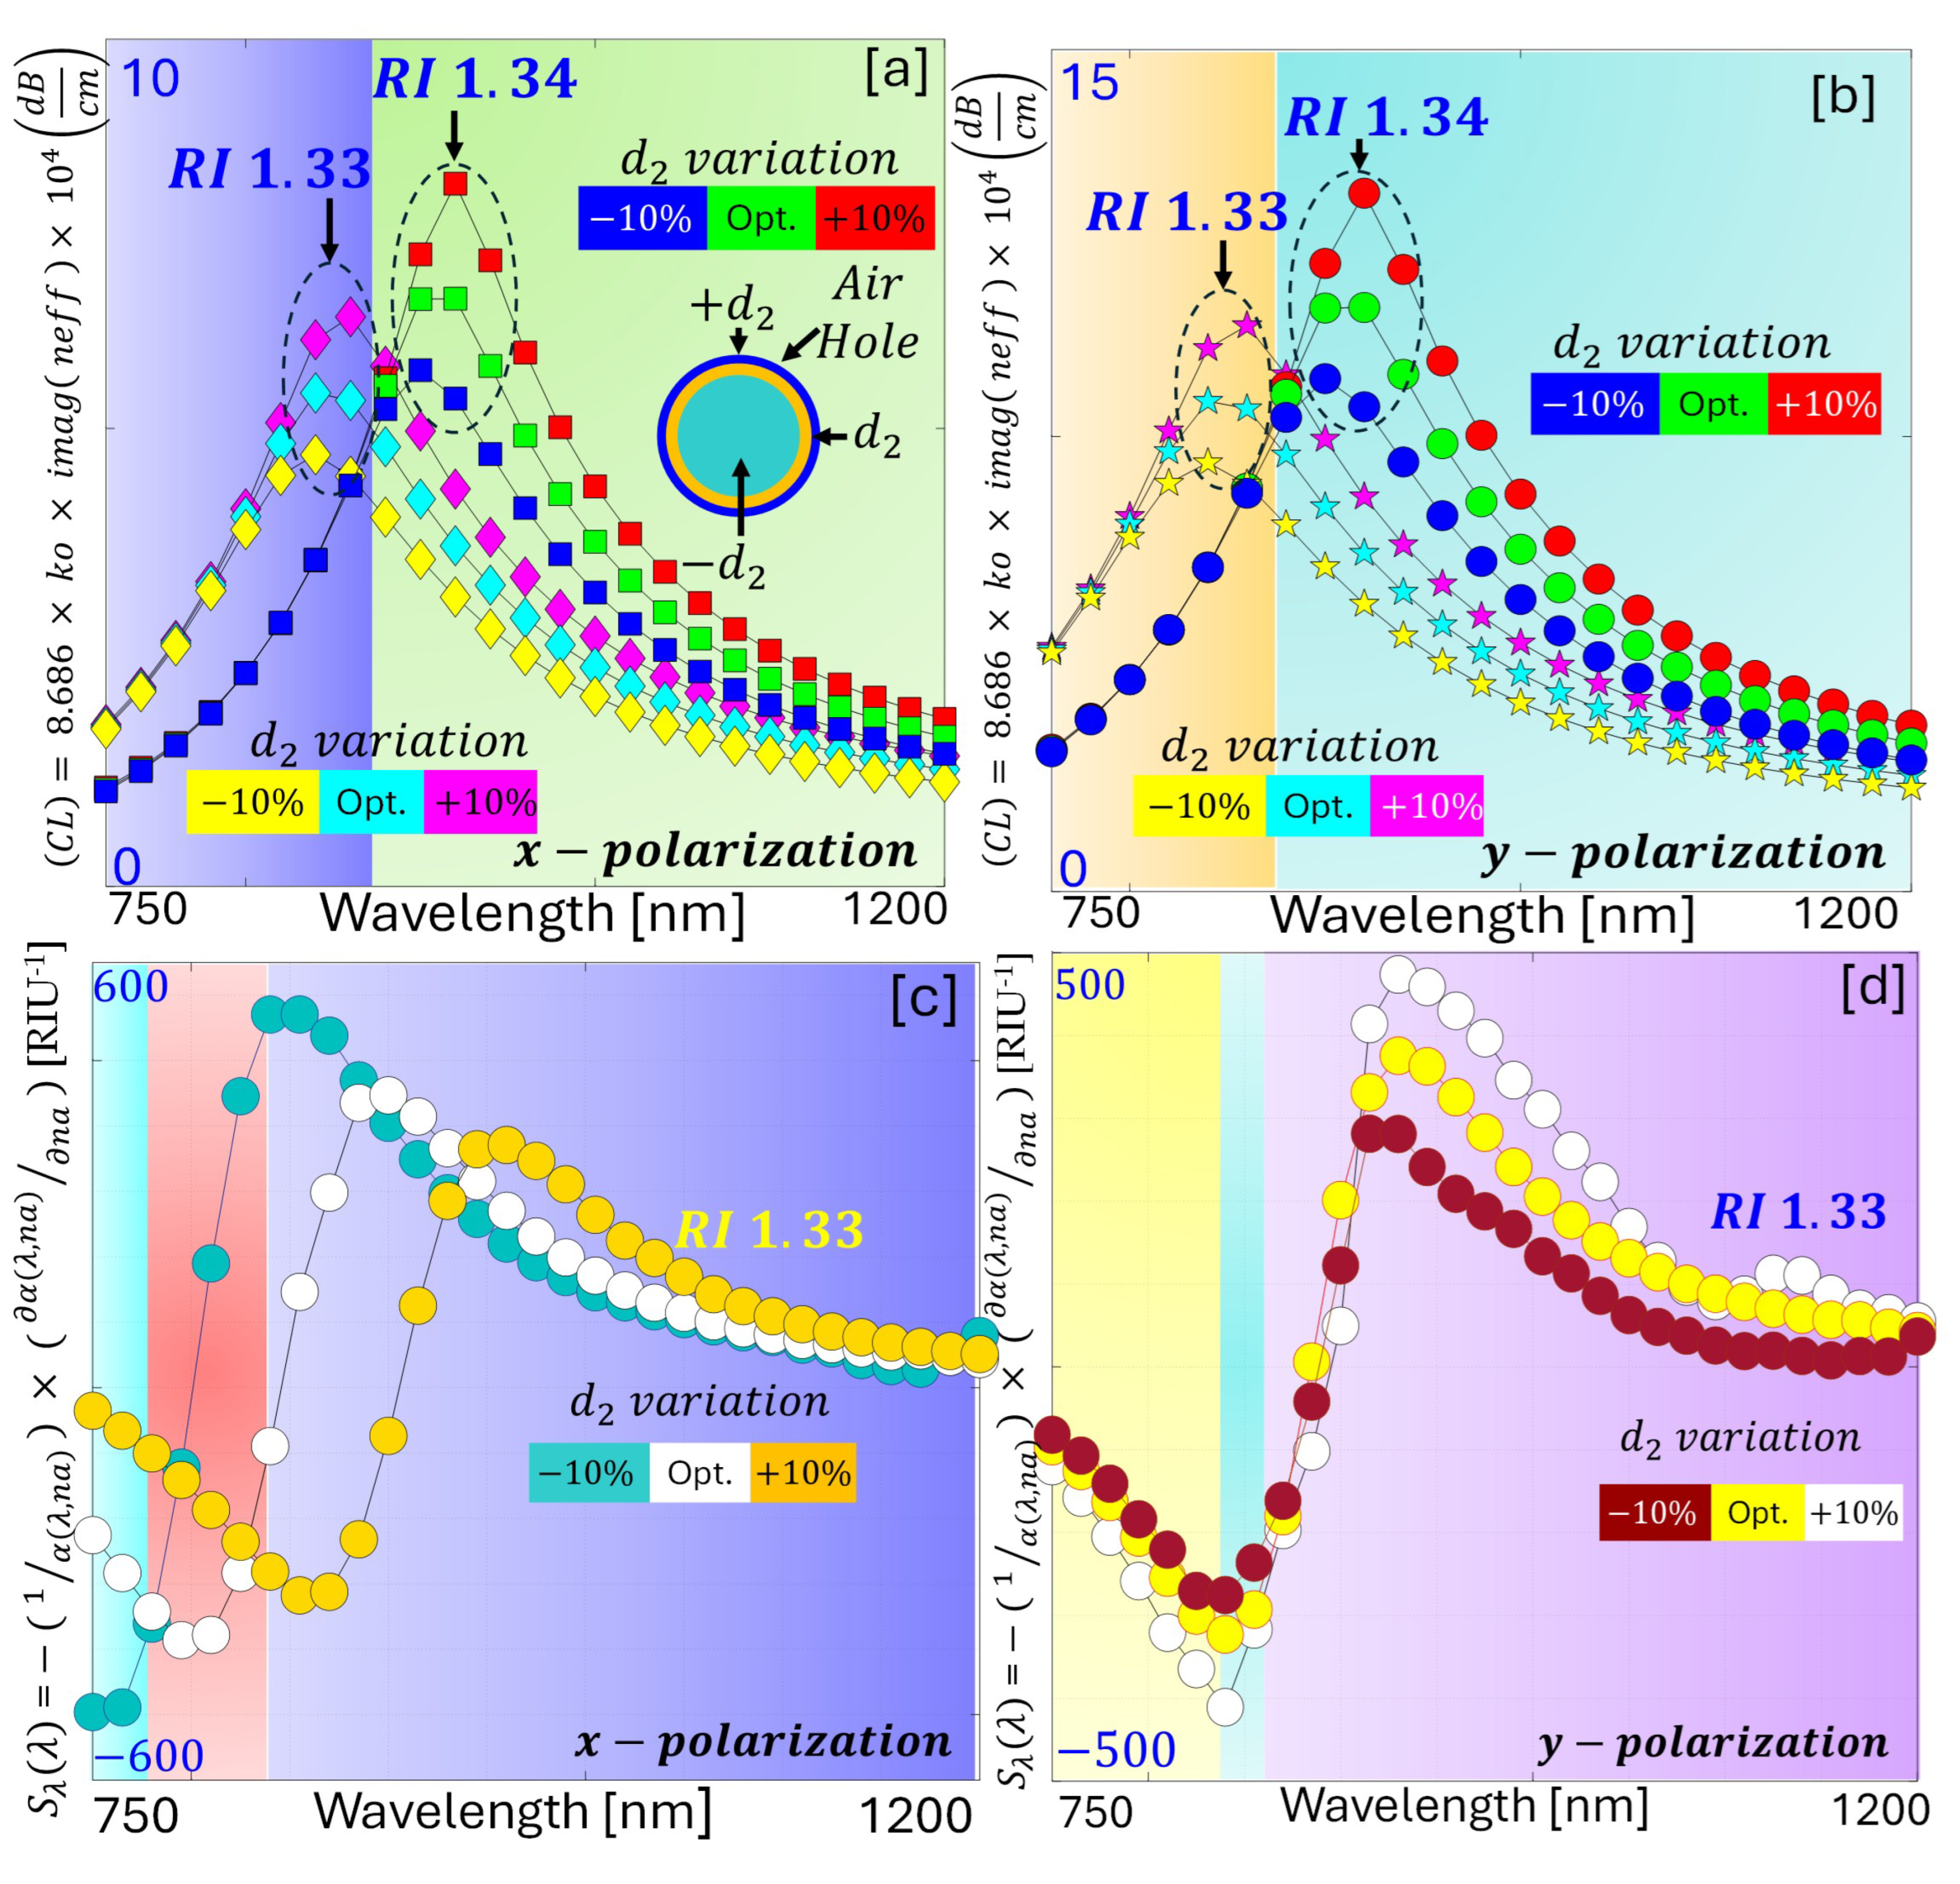
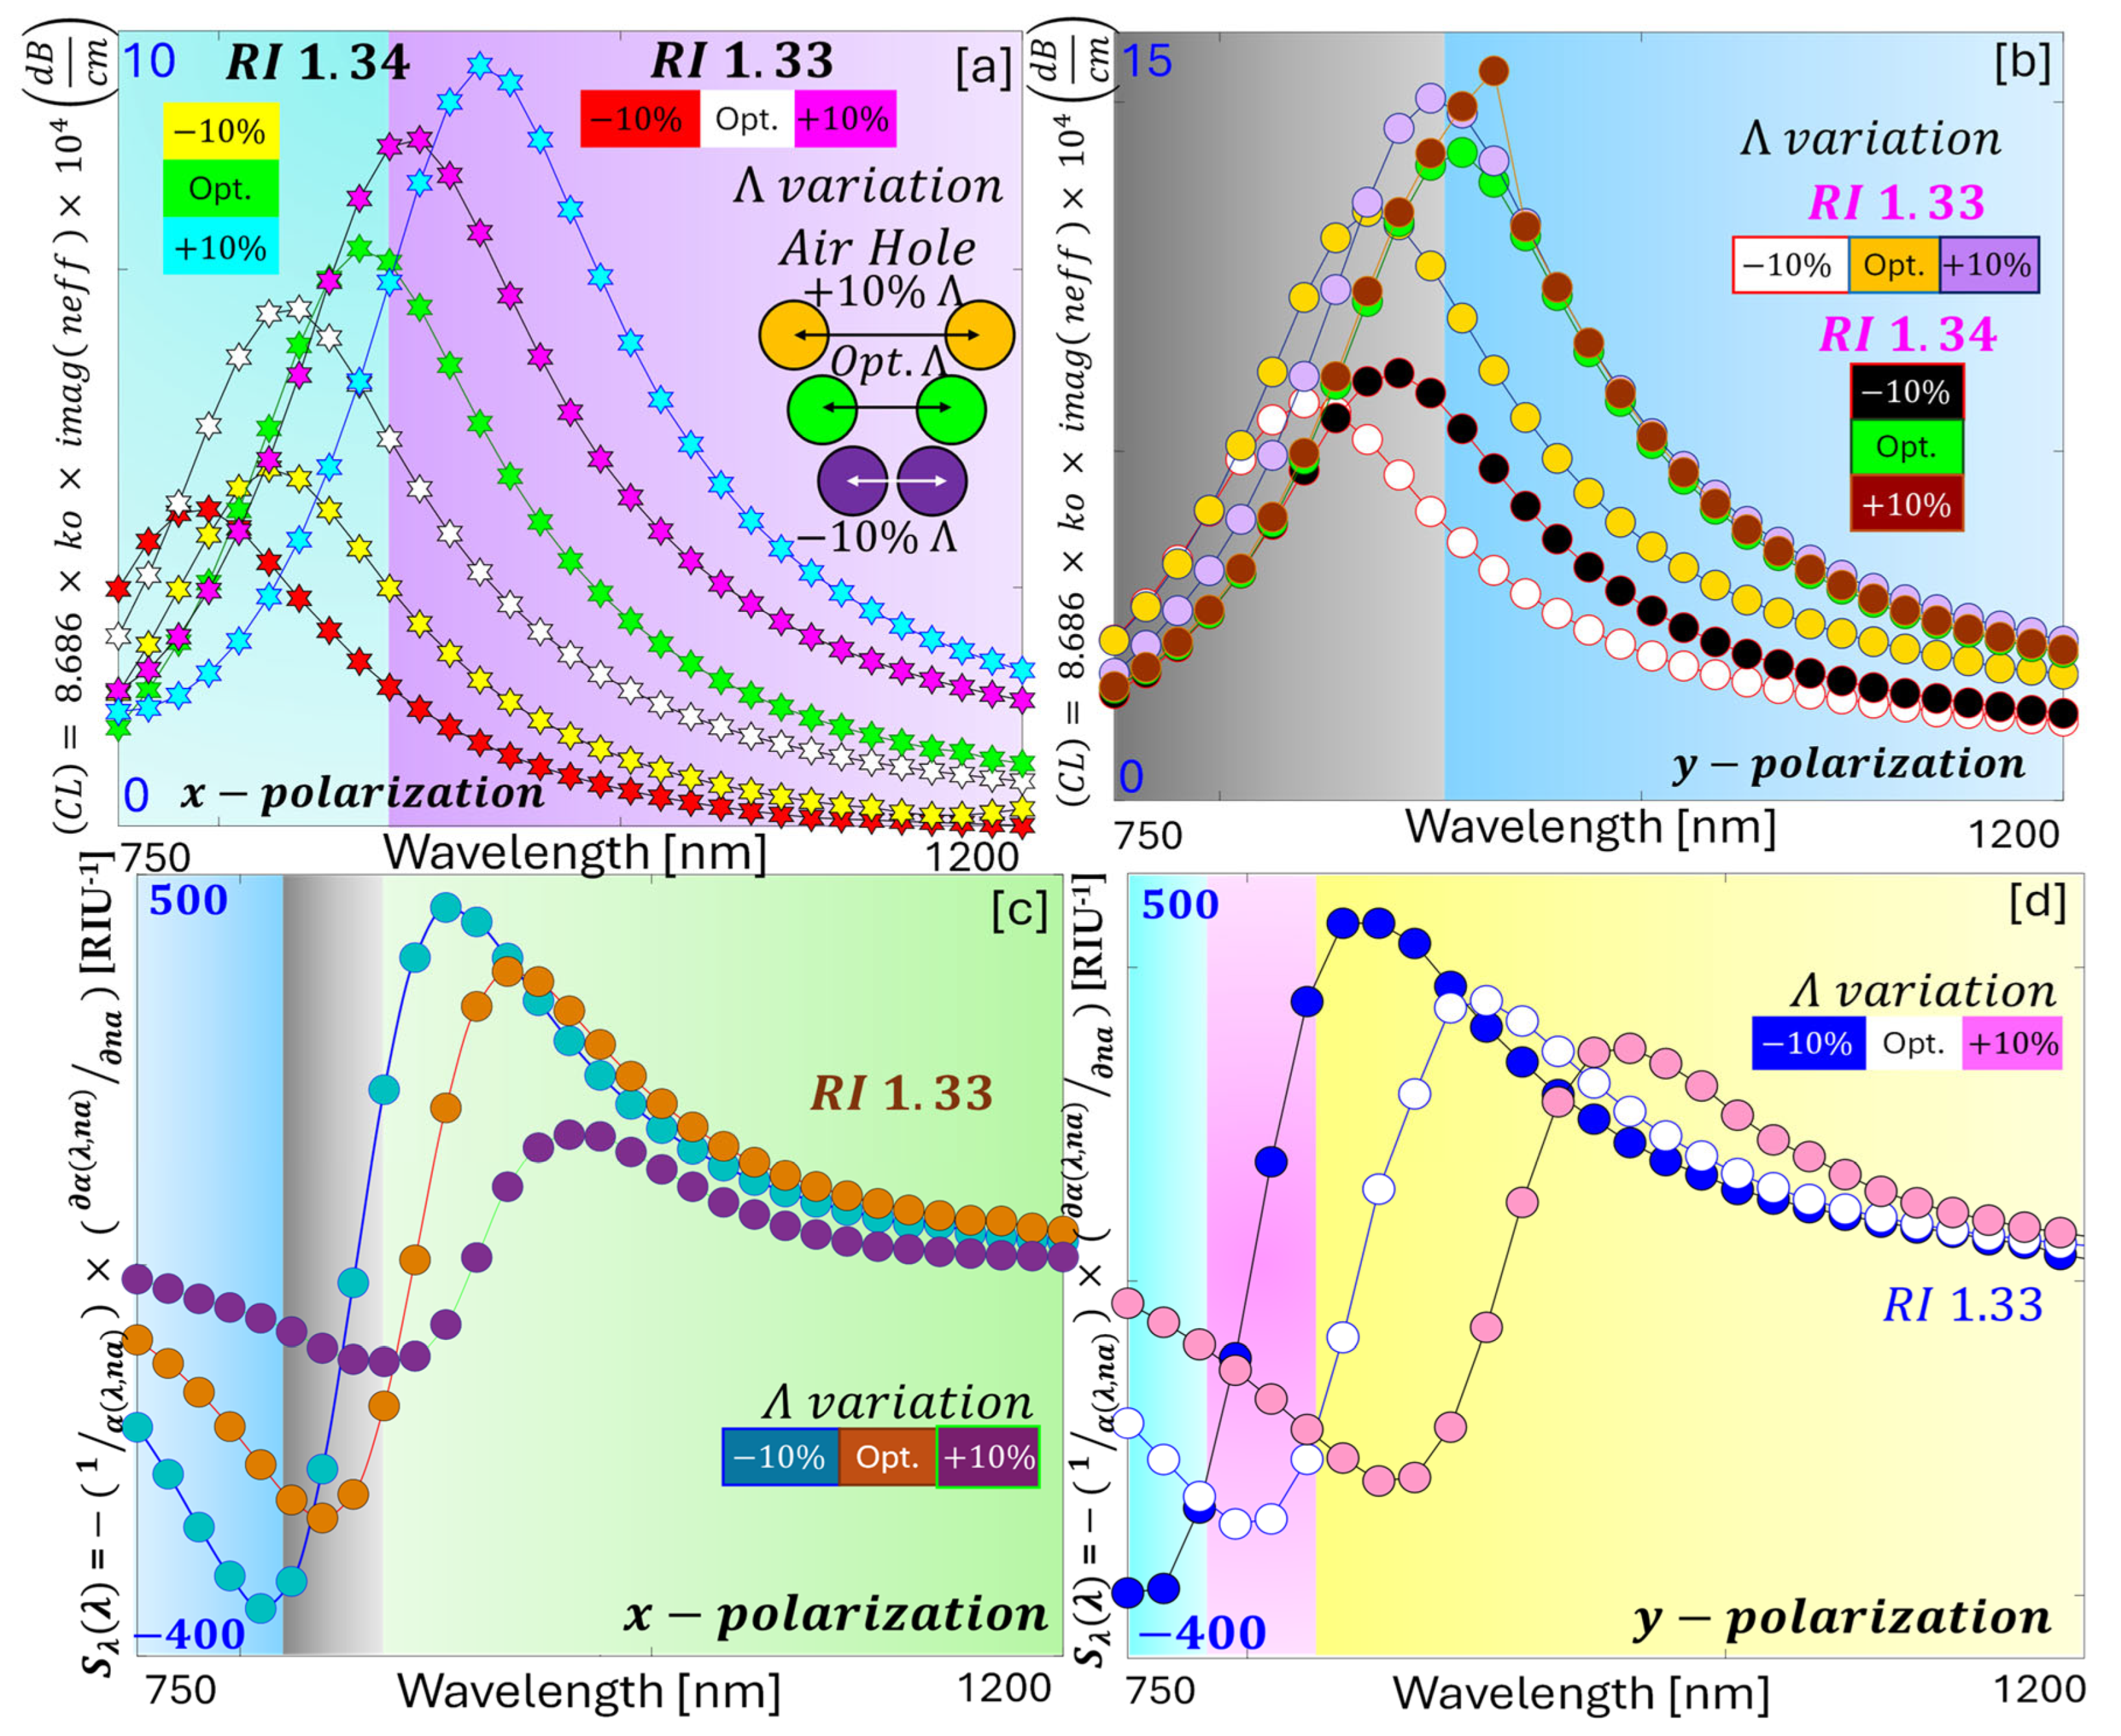
This section of the article presents results of the fabrication tolerance assessment ( F T A ) for the proposed sensor. F T A is an essential aspect in assessing the practical feasibility of any sensor model. In the early stages of P C F S P R sensor development, a fabrication tolerance of ± 1 % was also considered acceptable due to limited resources and fabrication challenges. However, with recent advancements in micro- and nano-fabrication technologies, researchers have successfully achieved tolerance levels as high as ± 10 % without significantly compromising sensor performance. For the F T A analysis, the key geometrical parameters such as air hole diameter and Λ are systematically varied within a tolerance range of approximately ± 1 % to ± 10 % . This variation helps to evaluate the robustness of the sensor against fabrication imperfections and ensures reliable real-world implementation. Thus, in this section of the article, results of variations in C L and A S by varying the geometrical dimension of the air holes and Λ are presented. The proposed sensor consists of two dimensions of air holes, d 1 and d 2 . Now, the dimensions of both the air holes are varied by ± 10 % , and changes in the sensor sensing parameters like C L and A S are analyzed.
Firstly, the dimensions of the air holes d 1 are varied by ± 10 %   then the new dimensions become 1.65   µ m and 1.35   µ m , respectively. So, for the x - p o l . , an increase in C L of 0.0523   d B / c m and a decrease in C L of 0.3389   d B / c m is observed corresponding to R I   1.33 , against optimum C L of 4.1053   d B / c m . Similarly, for the R I   1.34   an increase in C L of 0.6313   d B / c m and a decrease in C L of 0.1763   d B / c m is observed, against optimum C L of 4.5303   d B / c m respectively. This change in C L is represented by Figure 17a. Now, corresponding to y - p o l . for the R I   1.33 an increase in C L of 0.0131   d B / c m and a decrease in C L of 0.5599   d B / c m is observed, against optimum C L of 8.2413   d B / c m . Similarly, for the R I   1.34 , an increase in C L of 0.0378   d B / c m and a decrease in C L of 0.3048   d B / c m is observed, against optimum C L of 9.0605   d B / c m . This change in C L is represented by Figure 17b. Figure 17c presents the behavior of A S of the proposed sensor by varying the dimension of the air holes; here it can be observed that A S has decline by 29.194   R I U 1 and increased by 185.029   R I U 1 by changing the air hole dimension by 10 %   d 1 and + 10 %   d 1 respectively, corresponding to x - p o l . for R I   1.33 . Finally, in Figure 17d, it can be observed that A S has decline by 265.311   R I U 1 and increased by 57.255   R I U 1 , respectively, by changing the air hole dimension by 10 %   d 1 and + 10 %   d 1 respectively, corresponding to y - p o l . for R I   1.33 .
Secondly, the dimension of air holes d 2 is varied by ± 10 % and then the new dimensions become 1.32   µ m and 1.08   µ m respectively. So, for the R I   1.33 , an increase in C L of 0.421   d B / c m and a decrease in C L of 0.4119   d B / c m is observed corresponding to x - p o l . against optimum C L of 4.1053   d B / c m . Similarly, for the R I   1.34 , an increase in C L of 0.4624   d B / c m and a decrease in C L of 0.541   d B / c m is observed, against optimum C L of 4.5303   d B / c m corresponding to x - p o l . respectively. This change in C L is represented by Figure 18a. Now, corresponding to y - p o l . for the R I   1.33 an increase in C L of 0 . 8184   d B / c m and a decrease in C L of 0.8248   d B / c m is observed, against optimum C L of 8.2413   d B / c m . Similarly, for the R I   1.34 , an increase in C L of 0.9048   d B / c m and a decrease in C L of 0.911   d B / c m is observed, against optimum C L of 9.0605   d B / c m . This change in C L is represented by Figure 18b. Figure 18c presents the behavior of the A S of the proposed sensor by varying the dimensions of the air holes; here it can be observed that A S has decline by 13.812   R I U 1 and increased by 185.029   R I U 1 by changing the air hole dimension by 10 %   d 2 and + 10 %   d 2 respectively, corresponding to x - p o l . for R I   1.33 . Finally, in Figure 18d, it can be observed that A S has decline by 106.376   R I U 1 and increased by 29.028   R I U 1 , respectively, by changing the air hole dimension by 10 %   d 2 and + 10 %   d 2 , respectively, corresponding to y - p o l . for R I   1.33 .
Finally, the Λ is varied by ± 10 % , then the new dimensions of Λ becomes 2.475   µ m and 2.025   µ m for + 10 %   Λ and 10 %   Λ , respectively.
So, for x - p o l . , an increase in C L of 1.7118   d B / c m and decrease in C L of 0.6133   d B / c m is observed for + 10 %   Λ and 10 %   Λ corresponding to R I   1.33 , against optimum C L of 4.1053   d B / c m . Similarly, for the R I   1.34 , an increase in C L of 1.7803   d B / c m and decrease in C L of 0.7538   d B / c m is observed, for + 10 %   Λ and 10 %   Λ corresponding to optimum C L of 4.5303 d B / c m , respectively. This change in C L is represented by Figure 19a.
Considering y - p o l . for the R I   1.33 an increase in C L of 1.8139   d B / c m and a decrease in C L of 2.5470   d B / c m is observed for + 10 %   Λ and 10 %   Λ corresponding to optimum C L of 8.2413   d B / c m . Similarly, for the R I   1.34 an increase in C L of 1.3858   d B / c m and a decrease in C L of 2.9415   d B / c m is observed for + 10 %   Λ and 10 %   Λ corresponding to optimum C L of 9.0605   d B / c m . This change in C L is represented by Figure 19b.
Figure 19c presents the behavior of the A S of the proposed sensor by varying the dimension of Λ , by ± 10 % here it can be observed that A S has decline by 180.473   R I U 1 and increased by 135.151   R I U 1 by changing Λ dimension by 10 %   Λ and + 10 %   Λ respectively, corresponding to x - p o l . for R I   1.33 .
Finally, Figure 19d presents the behaviour of the A S of the proposed sensor by varying the dimension of Λ here it can be observed that A S decline by 64.091   R I U 1 and increased by 107.126   R I U 1 respectively by changing the Λ by 10 %   Λ and + 10 %   Λ , corresponding to y - p o l . for R I   1.33 .
Thus, it can be observed that even for a small change in the geometrical parameters, the sensing parameters show minor to major changes. The present F T A analysis focuses on the key geometrical parameters that are expected to exert the strongest influence on plasmonic coupling and sensing performance. A more comprehensive tolerance study can be performed involving additional parameters such as variation in T i O 2 thickness, and analyte-channel dimensions may be considered in future work. Other sensing parameters that can be used in evaluating the overall sensing performance and sensitivity of the proposed sensor model include the effective sensor length and birefringence behavior, which basically influence the polarization-dependent responses and enhance the detection accuracy. Therefore, the proposed sensor demonstrates strong resilience to structural variations while maintaining high sensitivity to R I changes in the cancerous cell samples. This indicates that the proposed biosensor, when fabricated, carries significant potential to be used for practical biomedical applications, particularly in early-stage cancer detection and diagnostic sensing systems. Finally, Table 5 presents a comparison of the sensing parameters of the proposed sensor with previously reported cancer biosensors of recent times.
There are some important considerations to be noted while performing S P R sensing via the proposed P C F . The detection capability of the proposed biosensor is primarily governed by its calculated S R and wavelength resolution of the O S A , rather than the R I interval selected for the simulations. In this study, an R I step of 0.01   R I U was chosen to evaluate the sensing performance over the R I range relevant to the investigated cancer cell samples. Future studies can consider smaller R I increments to provide a more detailed analysis of the sensor response for cancer detection applications. A second important consideration is that, like most R I -based biosensors, the proposed sensor may also be affected by non-specific adsorption and biofouling when operating in complex biological environments. Thus, in real-time sensing applications, these effects can be minimized through appropriate surface functionalization, anti-fouling coatings, selective biorecognition layers, and through sample pretreatment procedures. Future experimental studies should therefore focus on integrating these strategies to improve the selectivity and reliability of the proposed biosensor. Finally, it is important to note that R I alone may not always serve as a disease-specific biomarker, as similar R I variations can arise from different physiological or pathological conditions. Therefore, in practical clinical applications, the sensing response of the proposed biosensor may be complemented with orthogonal biomarkers, such as specific proteins, nucleic acids, circulating tumor markers, or cellular characteristics, to improve diagnostic specificity. In addition, emerging machine-learning and artificial-intelligence-based classification approaches can integrate multiple sensing features, including R W , C L , A S , and W S , to enhance disease discrimination and support more reliable clinical decision-making. The incorporation of such strategies represents a promising direction for future translational and experimental studies.

8. Conclusions

This study presents a dual-polarized tetra-core P C F S P R sensor designed for analyzing water, urine sample-normal, T - 47   D breast cancer, M M 6 - leukemia and D U 145 prostate cancer based on their R I variations. The proposed sensor can effectively detect the variations in the cancer cells by achieving high sensitivity and performance across different sensing parameters. The sensor model has obtained a lowest C L varying up to 4.1053   d B / c m for x - p o l . , and 8.2412   d B / c m for y - p o l . , respectively. A high W S of 9769 and 9069   n m / R I U is obtained for x - p o l . and y - p o l . respectively. An A S of 623.182 and 645.087   R I U 1 is obtained for x - p o l . and y - p o l . , respectively. S R in the order of 10   5 is also obtained for both polarization modes and linear fitting; between the R W and R I has obtained R 2 of 0.97 and 0.96 r x - p o l . and y - p o l . , respectively and finally, F O M of 60.17 and 53.01   R I U 1 is obtained for x - p o l . and y - p o l . respectively. Thus, the proposed P C F S P R biosensor exhibits a dynamic range of 0.04   R I U . Beside real-time analysis of the cancer cells is performed based on the R I values for which the proposed sensor is designed. Thus, it can be observed that the proposed sensor, with its tetra-core structure, dual-polarization capability, and wide-ranging sensing parameters, presents a good approach for analyzing cancer cells based on R I values for healthcare monitoring.

Author Contributions

A.K.S.: conceptualization; data curation; formal analysis; investigation; methodology; experiment; resources; validation; visualization; writing—original draft; and writing—review and editing. M.G.: experiment; review and supervision. All authors have read and agreed to the published version of the manuscript.

Funding

This research was funded by the European Union under the Marie Sklodowska-Curie Postdoctoral Fellowship Grant Agreement No. 101211155. Views and opinions expressed are, however, those of the author(s) only and do not necessarily reflect those of the European Union or the European Research Executive Agency (REA). Neither the European Union nor the granting authority can be held responsible for them.

Institutional Review Board Statement

Not applicable.

Informed Consent Statement

Not applicable.

Data Availability Statement

The raw data supporting the conclusions of this article will be made available by the authors on request.

Acknowledgments

M.G. acknowledges support from the Universities’Excellence Initiative” program by the Ministry of Education, Science and Sports of the Republic of Lithuania under the agreement with the Research Council of Lithuania (project No. S-A-UEI-23-6). A.K.S. sincerely acknowledges the Laser Research Center, Vilnius University, for providing the facilities, infrastructure, and institutional support that enabled the successful completion of this work.

Conflicts of Interest

The authors declare no conflicts of interest.

References

  1. Sardar, R.; Faisal, M. Dual-Core Dual-Polished PCF-SPR Sensor for Cancer Cell Detection. IEEE Sens. J. 2024, 24, 9843–9854. [Google Scholar] [CrossRef] [Scilit]
  2. Pravesh, R.; Kumar, D.; Chaudhary, V.S.; Mishra, G.P.; Kumari, S.; Kumar, S. Synergistic Integration of SPR With Photonic Crystal Fibers for Emerging Biosensing Strategies and Real-World Applications. IEEE Sens. Rev. 2025, 2, 339–348. [Google Scholar] [CrossRef] [Scilit]
  3. Sohrabi, F.; Hamidi, S.M. Neuroplasmonics: From Kretschmann configuration to plasmonic crystals. Eur. Phys. J. Plus 2016, 131, 221. [Google Scholar] [CrossRef] [Scilit]
  4. Watanabe, T.; Okamoto, T.; Yamaguchi, K.; Haraguchi, M. Determining the Optical Geometry of a Gold Semi-Shell under the Kretschmann Configuration. Photonics 2023, 10, 1228. [Google Scholar] [CrossRef] [Scilit]
  5. Seena, R.; Paul, S.; Sudheer, V.R. Kretschmann Configuration Based SPR Biosensor For Cancer Detection. Sens. Imaging 2025, 26, 123. [Google Scholar] [CrossRef] [Scilit]
  6. Barchiesi, D.; Grosges, T.; Colas, F.; de la Chapelle, M.L. Combined SPR and SERS: Otto and Kretschmann configurations. J. Opt. 2015, 17, 114009. [Google Scholar] [CrossRef] [Scilit]
  7. Wang, X.; Wu, X.; Chen, Y.; Yang, H.; Qi, Y.; Zheng, X. High-sensitivity plasmonic sensing by a prism-coupled structure of gold nano-cone array and silver film. Phys. B Condens. Matter 2026, 732, 418522. [Google Scholar] [CrossRef] [Scilit]
  8. Gao, J.; Wang, X.; Chen, Y.; Zhao, D.; Qi, Y.; Yang, H. Triple Fano resonances induced by a square-elliptical cavity coupled with an MIM waveguide for high-sensitivity gas refractive index sensing. J. Opt. Soc. Am. B 2025, 42, 742–748. [Google Scholar] [CrossRef] [Scilit]
  9. Ramola, A.; Shakya, A.K.; Bergman, A. Comprehensive Analysis of Advancement in Optical Biosensing Techniques for Early Detection of Cancerous Cells. Biosensors 2025, 15, 292. [Google Scholar] [CrossRef] [Scilit] [PubMed]
  10. Singh, S.; Chaudhary, B.; Upadhyay, A.; Sharma, D.; Ayyanar, N.; Taya, S.A. A review on various sensing prospects of SPR based photonic crystal fibers. Photonics Nanostructures-Fundam. Appl. 2023, 54, 101119. [Google Scholar] [CrossRef] [Scilit]
  11. Fuad, M.H.; Nayan, M.F.; Mahmud, R.R. Advances in Surface Plasmon Resonance-Based PCF and MIM Sensors. Plasmonics 2025, 20, 7995–8026. [Google Scholar] [CrossRef] [Scilit]
  12. Erdogan, İ.; Dogan, Y.; Altuntepe, A. Diamond-like carbon on gold and titanium dioxide grating-enhanced D-shaped PCF SPR refractive index sensor. Opt. Commun. 2025, 588, 131980. [Google Scholar] [CrossRef] [Scilit]
  13. Abbaszadeh, A.; Rash-Ahmadi, S. A surface plasmon resonance sensor based on photonic crystal fiber composed of magnesium fluoride and graphene layers to detect aqueous solutions. Opt. Quantum Electron. 2024, 56, 915. [Google Scholar] [CrossRef] [Scilit]
  14. Jaffray, W.; Saha, S.; Shalaev, V.M.; Boltasseva, A.; Ferrera, M. Transparent conducting oxides: From all-dielectric plasmonics to a new paradigm in integrated photonics. Adv. Opt. Photon. 2022, 14, 148–208. [Google Scholar] [CrossRef] [Scilit]
  15. Praveena, S.; Senthilnathan, K. Performance Enhancement of Gold Coated D-shaped PCF Sensor Using Monolayer MoS2. Plasmonics 2025, 20, 1003–1014. [Google Scholar] [CrossRef] [Scilit]
  16. Gupta, P.; Khamaru, A.; Kumar, A. Black Phosphorus-Based SPR Photonic Crystal Fiber Biosensor for Urinary Tract Infection Detection. Plasmonics 2025, 20, 8677–8688. [Google Scholar] [CrossRef] [Scilit]
  17. Hou, D.; Jing, X.; Yin, Z.; Song, M.; Hu, G. Dual-parameter Ag/SiC PCF-SPR sensor for RI and temperature in NIR. Phys. Scr. 2026, 101, 075503. [Google Scholar] [CrossRef] [Scilit]
  18. Esfahani Monfared, Y. Refractive Index Sensor Based on Surface Plasmon Resonance Excitation in a D-Shaped Photonic Crystal Fiber Coated by Titanium Nitride. Plasmonics 2020, 15, 535–542. [Google Scholar] [CrossRef] [Scilit]
  19. Ramola, A.; Shakya, A.K.; Kumar, V.; Bergman, A. Recent Advances in Photonic Crystal Fiber-Based SPR Biosensors: Design Strategies, Plasmonic Materials, and Applications. Micromachines 2025, 16, 747. [Google Scholar] [CrossRef] [Scilit] [PubMed]
  20. Kumar Shakya, A.; Singh, S. Design of novel Penta core PCF SPR RI sensor based on fusion of IMD and EMD techniques for analysis of water and transformer oil. Measurement 2022, 188, 110513. [Google Scholar] [CrossRef] [Scilit]
  21. Ramola, A.; Shakya, A.K.; Bergman, A. Finite Element Method-Based Modeling of a Novel Square Photonic Crystal Fiber Surface Plasmon Resonance Sensor with a Au–TiO2 Interface and the Relevance of Artificial Intelligence Techniques in Sensor Optimization. Photonics 2025, 12, 565. [Google Scholar] [CrossRef] [Scilit]
  22. Wang, X.; Zhang, A.; Pan, H.; You, Q.; Zhu, Y.; Ji, L.; Gao, X.; Zhao, X.; Tang, Y. Highly Sensitive Early Cancer Cell Detection Biosensor Based on Au-TiO2 Coated Dual Groove PCF-SPR. Plasmonics 2025, 20, 11429–11443. [Google Scholar] [CrossRef] [Scilit]
  23. Ramola, A.; Marwaha, A.; Singh, S. Design of a Triple-Layered Plasmonic Biosensor for Glucose Monitoring from Urine Sample for DIABETES Prevention. MAPAN 2023, 38, 511–525. [Google Scholar] [CrossRef] [Scilit]
  24. Haque, E.; Noman, A.A.; Islam, S.M.R.; Islam, M.R.; Wang, R.; Wang, D.; Ahmed, F. Numerical investigation of PCF-based biosensor for pathologies detection in blood. Sens. Bio-Sens. Res. 2026, 52, 100961. [Google Scholar] [CrossRef] [Scilit]
  25. Daher, M.G.; Almawgani, A.H.M.; Adam, Y.S.; Hasanein, M.M.M.A.; Gumaih, H.S.; Singh, S.; Kumar, R. Highly Efficient Sensor for the Accurate Determining of Harmful Heavy Metal Ion Concentrations in Water. Plasmonics 2025, 20, 9005–9016. [Google Scholar] [CrossRef] [Scilit]
  26. Islam, A.; Haider, F.; Aoni, R.A.; Ahmed, R. Plasmonic photonic biosensor: In situ detection and quantification of SARS-CoV-2 particles. Opt. Express 2022, 30, 40277–40291. [Google Scholar] [CrossRef] [Scilit] [PubMed]
  27. Ramola, A.; Marwaha, A.; Singh, S. Pregnancy Detection Through Modelling of Dual-Polarized Plasmonic PREGBIOSENSOR by Urine Samples Analysis. Plasmonics 2024, 19, 33–49. [Google Scholar] [CrossRef] [Scilit]
  28. Kumar Shakya, A.; Ramola, A.; Balal, N.; Bergman, A. Evolution of Photonic Crystal Fiber-Based Smart Sensors With Emphasis on Biomedical Applications: A Review. IEEE Sens. J. 2026, 26, 5288–5301. [Google Scholar] [CrossRef] [Scilit]
  29. Ramola, A.; Shakya, A.K.; Vidyarthi, A.; Singh, S.; Talker, E.; Bergman, A. Next-generation photonic-crystal-fiber-based plasmonic sensor for heavy metal detection via spectroscopy and refractive index integration. In 29th International Conference on Optical Fiber Sensors; SPIE: Bellingham, WA, USA, 2025; p. 1489. [Google Scholar]
  30. Gil, B.; Keshavarz, M.; Wales, D.; Darzi, A.; Yeatman, E. Orthogonal Surface-Enhanced Raman Scattering/Field-Effect Transistor Detection of Breast and Colorectal Cancer-Derived Exosomes using Graphene as a Tag-Free Diagnostic Template. Adv. NanoBiomed Res. 2023, 3, 2300055. [Google Scholar] [CrossRef] [Scilit]
  31. Elnaggar, A.; Kang, S.; Tian, M.; Han, B.; Keshavarz, M. State of the Art in Actuation of Micro/Nanorobots for Biomedical Applications. Small Sci. 2024, 4, 2300211. [Google Scholar] [CrossRef] [Scilit] [PubMed]
  32. Das, A.; Huraiya, M.A.; Raj, R.V.; Tabata, H.; Ramaraj, S.G. Ultra-sensitive refractive index detection with gold-coated PCF-based SPR sensor. Talanta Open 2024, 10, 100384. [Google Scholar] [CrossRef] [Scilit]
  33. Ding, X.; Lin, Q.; Wang, M.; Liu, S.; Zhang, W.; Chen, N.; Wang, Y. Design and Simulation of High-Performance D-Type Dual-Mode PCF-SPR Refractive Index Sensor Coated with Au-TiO2 Layer. Sensors 2024, 24, 6118. [Google Scholar] [CrossRef] [Scilit] [PubMed]
  34. Das, A.; Huraiya, M.A.; Rahman, I.; Chakrabarti, K.; Tabata, H.; Ramaraj, S.G.; Eid, M.M.A.; Zaki Rashed, A.N.; Razzak, S.M.A. Advanced low loss PCF-based SPR sensor for enhanced sensor length configurations flexibility with exceptional superior sensing performance capability. Appl. Phys. A 2025, 131, 472. [Google Scholar] [CrossRef] [Scilit]
  35. Shakya, A.K.; Singh, S. Design of dual polarized tetra core PCF based plasmonic RI sensor for visible-IR spectrum. Opt. Commun. 2021, 478, 126372. [Google Scholar] [CrossRef] [Scilit]
  36. Hasan, S.; Kalam, A.E.; Faisal, M. PCF Based Four-Channel SPR Biosensor With Wide Sensing Range. IEEE Trans. NanoBioscience 2024, 23, 233–241. [Google Scholar] [CrossRef] [Scilit] [PubMed]
  37. Jain, S.; Paliwal, A.; Gupta, V.; Tomar, M. Refractive index tuning of SiO2 for Long Range Surface Plasmon Resonance based biosensor. Biosens. Bioelectron. 2020, 168, 112508. [Google Scholar] [CrossRef] [Scilit] [PubMed]
  38. Ramola, A.; Marwaha, A.; Singh, S. Design and investigation of a dedicated PCF SPR biosensor for CANCER exposure employing external sensing. Appl. Phys. A 2021, 127, 643. [Google Scholar] [CrossRef] [Scilit]
  39. Johnson, R.W.; Hultqvist, A.; Bent, S.F. A brief review of atomic layer deposition: From fundamentals to applications. Mater. Today 2014, 17, 236–246. [Google Scholar] [CrossRef] [Scilit]
  40. Snyders, R.; Hegemann, D.; Thiry, D.; Zabeida, O.; Klemberg-Sapieha, J.; Martinu, L. Foundations of plasma enhanced chemical vapor deposition of functional coatings. Plasma Sources Sci. Technol. 2023, 32, 074001. [Google Scholar] [CrossRef] [Scilit]
  41. Garg, R.; Gonuguntla, S.; Sk, S.; Iqbal, M.S.; Dada, A.O.; Pal, U.; Ahmadipour, M. Sputtering thin films: Materials, applications, challenges and future directions. Adv. Colloid Interface Sci. 2024, 330, 103203. [Google Scholar] [CrossRef] [Scilit] [PubMed]
  42. Zhang, X.; Li, Y.; Luo, X.; Ding, Y. Enhancing antibacterial property of porous titanium surfaces with silver nanoparticles coatings via electron-beam evaporation. J. Mater. Sci. Mater. Med. 2022, 33, 57. [Google Scholar] [CrossRef] [Scilit] [PubMed]
  43. Zhu, S.; Xie, Z.; Chen, Y.; Liu, S.; Kwan, Y.-W.; Zeng, S.; Yuan, W.; Ho, H.-P. Real-Time Detection of Circulating Tumor Cells in Bloodstream Using Plasmonic Fiber Sensors. Biosensors 2022, 12, 968. [Google Scholar] [CrossRef] [Scilit] [PubMed]
  44. Ramola, A.; Singh, S.; Marwaha, A. Modelling and parameter quantification of plasmonic sensor based on external sensing for analysis of body liquids. Biosens. Bioelectron. X 2023, 14, 100358. [Google Scholar] [CrossRef] [Scilit]
  45. Liu, J.; Zhijin, Z.; Zhang, W.; Niraj, M.; Yang, F.; Changcheng, G.; Shen, L.; Xu, T.; Liu, S.; Junfeng, Z.; et al. Urinary exosomes: Potential diagnostic markers and application in bladder cancer. Heliyon 2024, 10, e32621. [Google Scholar] [CrossRef] [Scilit] [PubMed]
  46. Tomiyama, E.; Fujita, K.; Matsuzaki, K.; Narumi, R.; Yamamoto, A.; Uemura, T.; Yamamichi, G.; Koh, Y.; Matsushita, M.; Hayashi, Y.; et al. EphA2 on urinary extracellular vesicles as a novel biomarker for bladder cancer diagnosis and its effect on the invasiveness of bladder cancer. Br. J. Cancer 2022, 127, 1312–1323. [Google Scholar] [CrossRef] [Scilit] [PubMed]
  47. Ramirez-Garrastacho, M.; Bajo-Santos, C.; Line, A.; Martens-Uzunova, E.S.; de la Fuente, J.M.; Moros, M.; Soekmadji, C.; Tasken, K.A.; Llorente, A. Extracellular vesicles as a source of prostate cancer biomarkers in liquid biopsies: A decade of research. Br. J. Cancer 2022, 126, 331–350. [Google Scholar] [CrossRef] [Scilit] [PubMed]
  48. López Mujica, M.E.J.; Ferapontova, E.E. Electrochemical Biosensors for Cancer Diagnosis and Prognosis Using Protein Biomarkers: Current Trends, Advances, and Clinical Translation Potential. Sensors 2026, 26, 1139. [Google Scholar] [CrossRef] [Scilit] [PubMed]
  49. Kawaguchi, S.; Ajiri, T.; Mitsuya, R.; Tsuchiya, R.; Kunitake, K.; Tanaka, Y.; Yokoyama, T.; Sato, K.; Sato, Y.; Zhu, Z.; et al. Glomerular routing of tumor-derived extracellular vesicles substantiates urinary biopsy. Sci. Adv. 2026, 12, eaeb0555. [Google Scholar] [CrossRef] [Scilit] [PubMed]
  50. Shen, J.; Wang, X.; Li, F.; Zhu, J.; Gao, Y.; Chen, K.; Huang, Y.; Zhang, L.; Luo, Y.; Jiang, B.; et al. Volume-oriented meta-plasmonic sensing of serum extracellular vesicles for rapid kidney cancer diagnosis and monitoring. Sens. Actuators B Chem. 2026, 446, 138756. [Google Scholar] [CrossRef] [Scilit]
  51. Alvarez, F.A.; Kaddour, H.; Lyu, Y.; Preece, C.; Cohen, J.; Baer, L.; Stopeck, A.T.; Thompson, P.; Okeoma, C.M. Blood plasma derived extracellular vesicles (BEVs): Particle purification liquid chromatography (PPLC) and proteomic analysis reveals BEVs as a potential minimally invasive tool for predicting response to breast cancer treatment. Breast Cancer Res. Treat. 2022, 196, 423–437. [Google Scholar] [CrossRef] [Scilit] [PubMed]
  52. Jin, Y.; Du, N.; Huang, Y.; Shen, W.; Tan, Y.; Chen, Y.Z.; Dou, W.-T.; He, X.-P.; Yang, Z.; Xu, N.; et al. Fluorescence Analysis of Circulating Exosomes for Breast Cancer Diagnosis Using a Sensor Array and Deep Learning. ACS Sens. 2022, 7, 1524–1532. [Google Scholar] [CrossRef] [Scilit] [PubMed]
  53. Rizwan, M.N.; Ma, Y.; Nenkov, M.; Jin, L.; Schröder, D.C.; Westermann, M.; Gaßler, N.; Chen, Y. Tumor-derived exosomes: Key players in non-small cell lung cancer metastasis and their implication for targeted therapy. Mol. Carcinog. 2022, 61, 269–280. [Google Scholar] [CrossRef] [Scilit] [PubMed]
  54. He, Y.; Zeng, X.; Xiong, Y.; Shen, C.; Huang, K.; Chen, P. Portable Aptasensor Based on Parallel Rolling Circle Amplification for Tumor-Derived Exosomes Liquid Biopsy. Adv. Sci. 2024, 11, 2403371. [Google Scholar] [CrossRef] [Scilit] [PubMed]
  55. Brocco, D.; Simeone, P.; Buca, D.; Marino, P.D.; De Tursi, M.; Grassadonia, A.; De Lellis, L.; Martino, M.T.; Veschi, S.; Iezzi, M.; et al. Blood Circulating CD133+ Extracellular Vesicles Predict Clinical Outcomes in Patients with Metastatic Colorectal Cancer. Cancers 2022, 14, 1357. [Google Scholar] [CrossRef] [Scilit] [PubMed]
  56. Shi, X.; Zhao, X.; Xue, J.; Jia, E. Extracellular vesicle biomarkers in circulation for colorectal cancer detection: A systematic review and meta-analysis. BMC Cancer 2024, 24, 623. [Google Scholar] [CrossRef] [Scilit] [PubMed]
  57. Deepti, M.R.; Mollah, A. PCF-based multi-analyte refractive index sensor for pathogen detection in water. J. Comput. Electron. 2024, 24, 28. [Google Scholar] [CrossRef] [Scilit]
  58. Mitu, S.A.; Ahmed, K.; Zahrani, F.A.A.; Grover, A.; Mani Rajan, M.S.; Moni, M.A. Development and analysis of surface plasmon resonance based refractive index sensor for pregnancy testing. Opt. Lasers Eng. 2021, 140, 106551. [Google Scholar] [CrossRef] [Scilit]
  59. Divya, J.; Selvendran, S.; Itapu, S.; Borra, V. A Novel Dual-Channel SPR-Based PCF Biosensor for Simultaneous Tuberculosis and Urinary Tract Infection Diagnosis Toward SDG3. IEEE Access 2024, 12, 85484–85498. [Google Scholar] [CrossRef] [Scilit]
  60. Vaijayanthimala, J.; Kumar, A. Enhanced Sensing of Diseased Blood Samples through One-Dimensional MgO-SiO2 Photonic Crystal Sensor. J. Electrochem. Soc. 2024, 171, 107505. [Google Scholar] [CrossRef] [Scilit]
  61. Sani, M.H.; Khosroabadi, S. A Novel Design and Analysis of High-Sensitivity Biosensor Based on Nano-Cavity for Detection of Blood Component, Diabetes, Cancer and Glucose Concentration. IEEE Sens. J. 2020, 20, 7161–7168. [Google Scholar] [CrossRef] [Scilit]
  62. Sanattalab, E.; Kanarya, D.; Ebrahimi, A.; Didarian, R.; Doğan Güzel, F.; Yıldırım Tirgil, N. Cutting-Edge Applications of Titanium Dioxide in Biosensors. Electroanalysis 2025, 37, e70049. [Google Scholar] [CrossRef] [Scilit]
  63. Trisha, I.J.; Patwary, A.K.; Sayem, M.A.; Rahman, A.; Hossain, M.R.; Mollah, M.A. Numerical analysis of a single channel exposed core elliptical shaped PCF based highly sensitive SPR sensor for wide RI sensing. Opt. Express 2024, 32, 25472–25487. [Google Scholar] [CrossRef] [Scilit] [PubMed]
  64. Majeed, M.F.; Ahmad, A.K. Design and analysis of a dual-core PCF biosensor based on SPR for cancerous cells detection. Opt. Quantum Electron. 2024, 56, 1030. [Google Scholar] [CrossRef] [Scilit]
  65. Ahmed, K.; Haque, J.; Jabin, A.; Paul, B.K.; Amiri, I.S.; Yupapin, P. Tetra-core surface plasmon resonance based biosensor for alcohol sensing. Phys. B Condens. Matter 2019, 570, 48–52. [Google Scholar] [CrossRef] [Scilit]
  66. Vande Voorde, J.; Ackermann, T.; Pfetzer, N.; Sumpton, D.; Mackay, G.; Kalna, G.; Nixon, C.; Blyth, K.; Gottlieb, E.; Tardito, S. Improving the metabolic fidelity of cancer models with a physiological cell culture medium. Sci. Adv. 2019, 5, eaau7314. [Google Scholar] [CrossRef] [Scilit] [PubMed]
  67. Tan, H.K.; Muhammad, T.S.T.; Tan, M.L. 14-Deoxy-11,12-didehydroandrographolide induces DDIT3-dependent endoplasmic reticulum stress-mediated autophagy in T-47D breast carcinoma cells. Toxicol. Appl. Pharmacol. 2016, 300, 55–69. [Google Scholar] [CrossRef] [Scilit] [PubMed]
  68. Ziegler-Heitbroc, H.W.L.; Thiel, E.; Futterer, A.; Herzog, V.; Wirtz, A.; Riethmüller, G. Establishment of a human cell line (mono mac 6) with characteristics of mature monocytes. Int. J. Cancer 1988, 41, 456–461. [Google Scholar] [CrossRef] [Scilit] [PubMed]
  69. Xu, Y.; Zhu, J.; Lei, Z.; Wan, L.; Zhu, X.; Ye, F.; Tong, Y. Anti-proliferative effects of paeonol on human prostate cancer cell lines DU145 and PC-3. J. Physiol. Biochem. 2017, 73, 157–165. [Google Scholar] [CrossRef] [Scilit] [PubMed]
  70. van der Pol, E.; Coumans, F.A.W.; Sturk, A.; Nieuwland, R.; van Leeuwen, T.G. Refractive index determination of nanoparticles in suspension using nanoparticle tracking analysis. Nano Lett. 2014, 14, 6195–6201. [Google Scholar] [CrossRef] [Scilit] [PubMed]
  71. Ramola, A.; Shakya, A.K.; Droby, A.; Bergman, A. Numerical Study of a Novel Kagome-Inspired Photonic Crystal Fiber-Based Surface Plasmon Resonance Biosensor for Detection of Blood Components and Analytical Targets. Biosensors 2025, 15, 539. [Google Scholar] [CrossRef] [Scilit] [PubMed]
  72. Islam, N.; Arif, F.H.; Abu Yousuf, M.; Asaduzzaman, S. Highly sensitive open channel based PCF-SPR sensor for analyte refractive index sensing. Results Phys. 2023, 46, 106266. [Google Scholar] [CrossRef] [Scilit]
  73. Li, W.; Chen, Y.; Xu, J.; Jiang, M.; Zou, H. A D-Shaped SPR-Based PCF Sensor with an Extremely High-Amplitude Sensitivity for Measuring the Refractive Index. Micromachines 2023, 14, 1295. [Google Scholar] [CrossRef] [Scilit] [PubMed]
  74. Islam, M.R.; Jamil, A.; Zaman, S.-U.; Ahsan, S.A.H.; Pulak, M.K.; Mehjabin, F.; Khan, M.M.I.; Chowdhury, J.A.; Islam, M. Design and analysis of birefringent SPR based PCF biosensor with ultra-high sensitivity and low loss. Optik 2020, 221, 165311. [Google Scholar] [CrossRef] [Scilit]
  75. Mahmud, R.R.; Anzum, M.S.; Hassan, A.A.; Rafsan, A.A.; Salimullah, S.M.; Nayan, M.F. Dual-side polished SPR-PCF ultra-wide refractive index sensor with high amplitude sensitivity. J. Opt. 2025, 27, 025101. [Google Scholar] [CrossRef] [Scilit]
  76. Khemiri, R.; Kaziz, S. Novel Optimization Approach and AI Performance Prediction of a Highly Sensitive V-Shaped PCF-SPR Sensor for Cancer Cell Detection. Sens. Imaging 2025, 26, 76. [Google Scholar] [CrossRef] [Scilit]
  77. Akter, S.; Abdullah, H. Design and Investigation of High-Sensitivity PCF SPR Biosensor for Various Cancer Cells Detection Using a Gold-Coated Circular-Shaped Structure. Plasmonics 2025, 20, 5303–5313. [Google Scholar] [CrossRef] [Scilit]
  78. B, N.; Dagar, H.; Krishnan, P. High-Performance Dual-Core Bilateral Surface Optimized PCF SPR Biosensor for Early Detection of Six Distinct Cancer Cells. Plasmonics 2025, 20, 4799–4809. [Google Scholar] [CrossRef] [Scilit]
  79. Ibrahimi, K.M.; Kumar, R.; Pakhira, W. C-grooved dual-core PCF SPR biosensor with graphene/au coating for enhanced early cancer cell detection. Appl. Phys. A 2024, 130, 439. [Google Scholar] [CrossRef] [Scilit]
  80. Kaziz, S.; Echouchene, F.; Gazzah, M.H. Optimizing PCF-SPR sensor design through Taguchi approach, machine learning, and genetic algorithms. Sci. Rep. 2024, 14, 7837. [Google Scholar] [CrossRef] [Scilit] [PubMed]
  81. Ibrahimi, K.M.; Kumar, R.; Pakhira, W. A graphene/Au/TiO2 coated dual-core PCF SPR biosensor with improved design and performance for early cancer cell detection of with high sensitivity. Optik 2023, 288, 171186. [Google Scholar] [CrossRef] [Scilit]
  82. Zhang, S.; Wang, Y. A PCF-SPR sensor for dual-polarization and wide refractive index detection range. Opt. Commun. 2024, 569, 130810. [Google Scholar] [CrossRef] [Scilit]
Figure 1. SPR-based configuration. (a) Kretschmann configuration; (b) Otto configuration.
Biosensors 16 00463 g001
Figure 2. (a) Structural layout of the proposed sensor configuration; (b) mesh configuration of the proposed sensor showing adaptive triangular elements and high mesh quality.
Biosensors 16 00463 g002
Figure 3. A 3D schematic of the proposed multicore PCF. (a) Cross-sectional view showing the arrangement of embedded channels and capillaries; (b) perspective view of the internal architecture; (c,d) 3D views of the proposed PCF from different orientations for enhanced visualization of the plasmonic sensing region and cladding configuration.
Biosensors 16 00463 g003
Figure 4. Two-dimensional and 3D mode profiles for the proposed sensor for RI 1.33; 2D mode profiles for x-pol: (a) Tetra-core mode; (b) SPP mode; y-pol. mode profile; (c) tetra-core mode; (d) SPP mode. Three-dimensional mode profiles for x-pol: (e) tetra-core model; (f) SPP mode, y-pol. mode profile; (g) tetra-core mode; (h) SPP mode.
Biosensors 16 00463 g004
Figure 5. Experimental workflow demonstration using T-47D, MM6, and DU145 cancer cell lines for the proposed PCF–SPR biosensor. (a) Retrieval of cryopreserved cell vials from liquid nitrogen storage; (b) cryopreserved cancer cell lines used in this study; (c) seeding of cells into culture flasks containing appropriate culture medium; (d) cell recovery and incubation; (e) cell viability and morphological assessment; (f) preparation of cell suspension; (g) schematic representation of RI determination for cancer cell samples based on literature-reported values; (h) PCF–SPR biosensor analysis; (i) biosensor response and analysis based on resonance wavelength shifts.
Biosensors 16 00463 g005
Figure 6. Experimental workflow for cancer cell observation and characterization. T-47D breast cancer, MM6 leukemia, and DU145 prostate cancer cells are cultured and imaged using a computer-assisted optical microscopy system at different magnifications for morphological assessment. Representative microscopic images and culture samples are shown together with the corresponding literature-reported RI values used as input parameters for the proposed biosensor.
Biosensors 16 00463 g006
Figure 7. T-47D breast cancer cell (RI = 1.35). (a) Grayscale microscopy images (i) 20×, (ii) 40×, and (iii) 60×. (b) MATLAB-based enhanced color visualizations captured at magnifications of (i) 20× (putative nuclear region), (ii) 40× (organelle-rich cytoplasm), and (iii) 60× (high-RI region).
Biosensors 16 00463 g007
Figure 8. MM6 leukemia cells (RI = 1.36). (a) Grayscale microscopic images acquired at (i) 20×, (ii) 40×, and (iii) 60×. (b) Corresponding pseudocolor-enhanced representations highlighting the intracellular RI heterogeneity, including (i) putative nuclear regions, (ii) organelle-rich cytoplasmic compartments, and (iii) high-RI regions. The images reveal the characteristic spherical morphology of MM6 suspension cells and provide qualitative support for RI-based cancer cell characterization.
Biosensors 16 00463 g008
Figure 9. DU-145 prostate cancer cell (RI 1.37). (a) Grayscale microscopic images acquired at magnifications of (i) 20×, (ii) 40×, and (iii) 60×, illustrating the morphology and distribution of DU-145 cells. (b) Corresponding pseudocolor-enhanced representations of (i) 20×, (ii) 40×, and (iii) 60× images are generated to improve visualization of cellular morphology, boundaries, and intracellular features. The images reveal the characteristic adherent morphology of DU-145 cells and provide qualitative morphological support for the RI-based cancer sensing approach.
Biosensors 16 00463 g009
Figure 10. Sensing behavior of the sensor model for x-pol. (a) CL; (b) AS; (c) WS; (d) relationship between R W and R I .
Biosensors 16 00463 g010
Figure 11. Sensing behavior of the sensor model for y-pol. (a) CL; (b) AS; (c) WS; (d) relationship between R W and R I corresponding to y-pol.
Biosensors 16 00463 g011
Figure 12. Monte Carlo error-bar and confidence-band analysis of the RW versus analyte RI relationship for (a) x-polarization and (b) y-polarization. The mean fitted curve, 95% confidence band, and uncertainty error bars obtained from 2000 realizations are presented to assess the robustness of the extracted sensitivity.
Biosensors 16 00463 g012
Figure 13. CL of the sensor model with increased thickness of plasmonic materials: (a) x-pol and (b) y-pol.
Biosensors 16 00463 g013
Figure 14. Comparison of CL for the sensor model with optimum and increased thickness of plasmonic materials: (a) x-pol and (b) y-pol.
Biosensors 16 00463 g014
Figure 15. AS of the sensor model with increased thickness of plasmonic materials: (a) x-pol and (b) y-pol.
Biosensors 16 00463 g015
Figure 16. Comparison of the AS of the sensor model with optimum and increased thickness of plasmonic materials: (a) x-pol and (b) y-pol.
Biosensors 16 00463 g016
Figure 17. FTA analysis by varying air hole diameter (d1) by ±10%. (a) CL variation for x-pol. (b) CL variation for y-pol. (c) AS variation for x-pol. (d) AS variation for y-pol.
Biosensors 16 00463 g017
Figure 18. FTA analysis by varying air hole diameter (d2) by ±10%. (a) CL variation for x-pol. (b) CL variation for y-pol. (c) AS for x-pol. (d) AS for y-pol.
Biosensors 16 00463 g018
Figure 19. FTA analysis by varying Λ by ±10%. (a) CL variation for x-pol. (b) CL variation for y-pol. (c) AS for x-pol. (d) AS for y-pol.
Biosensors 16 00463 g019
Table 1. Literature-reported RI values, representative biological samples, and their diagnostic relevance in cancer biosensing.
RISampleBiological SignificanceDiagnostic RelevanceRef.
1.33WaterCalibration and baseline mediumSensor baseline/reference[43,44]
1.34Normal UrineHealthy physiological conditionHealthy control sample[43,44]
1.35Blood PlasmaNormal plasma protein concentrationPlasma-based cancer biomarker studies (Breast, lung, colorectal)[43,44]
1.36WBC rich sampleElevated cellular concentrationLeukemia and immune cell-related diagnostics[43,44]
1.37EV/Exosome
rich urine
Elevated extracellular
vesicle concentration
Urinary EV-based cancer diagnostics (Prostate, bladder, kidney)[43,44]
Table 2. Relationship between cancer types and related biomarkers.
Cancer TypeBody Fluid SampleRelated BiomarkerRef.
Bladder cancerUrineUrinary EVs, exosomes[45,46]
Prostate cancerUrine, plasmaPSA-associated EVs[47,48]
Kidney cancerUrineTumor-derived vesicles[49,50]
Breast cancerBlood plasmaCirculating exosomes[51,52]
Lung cancerBlood plasmaTumor-derived exosomes[53,54]
Colorectal cancerBlood plasmaExtracellular vesicles[55,56]
Table 3. Summary of the sensing parameters for x-polarization.
RI∆ RIRW (nm)Peak CL (dB/cm)WS (nm/RIU)AS (RIU−1)SR (RIU)FWHM (nm)FOM (RIU−1)
1.330.01834.064.10533603303.8342.7755 × 10−5166.0421.69
1.340.01870.094.53038039471.3841.12439 × 10−5187.6242.84
1.350.01950.485.49448467550.3771.1811 × 10−5183.7946.06
1.360.011035.157.14589796623.1821.0236 × 10−5162.3460.17
1.370.011132.849.2657NANANANANA
Table 4. Summary of the sensing parameters for y-polarization.
RI∆ RIRW (nm)Peak CL (dB/cm)WS (nm/RIU)AS (RIU−1)SR (RIU)FWHM (nm)FOM (RIU−1)
1.330.01870.08.24124443381.7372.2507 × 10−5189.3123.41
1.340.01914.439.06053832421.0892.6096 × 10−5183.4320.89
1.350.01952.759.98793702534.2132.7012 × 10−5179.020.68
1.360.01989.7711.2139069645.0871.1027 × 10−5171.0853.01
1.370.011080.4614.5579NANANANANA
Table 5. Sensing parameters comparison of the proposed sensor with previously reported sensors.
RefShapeRIPol.WS (nm/RIU)AS (RIU−1)SR (RIU)FOM
(RIU−1)
DRR2/
Order
Biological Analysis
[76]Grooved1.36–1.399x-pol.2142.86632.5010−526.780.0390.904/
I order
NO
[77]EMD1.38–1.401x-pol.13,257.20------36.520.021---NO
[78]EMD1.36–1.401x-pol.
y-pol.
5714.28899.24810−5---0.041---NO
[79]Grooved1.368–1.40y-pol.2142.861058.0394.6 × 10−5---0.032---NO
[80]D shape1.34y-pol.10,000235,882------------NO
[81]EMD1.368–1.40y-pol.5714.29599.534.0 × 10−5---0.032---NO
[82]Grooved1.37–1.41x-pol.
y-pol.
7800
11,700
---
---
---
---
---0.040---
---
NO
ProposedEMD1.33–1.37x-pol.
y-pol.
9769
9069
623.182
645.087
1.02 × 10⁻⁵
1.10 × 10⁻⁵
60.17
53.01
0.0400.97/I order
0.96/I order
Yes
Disclaimer/Publisher’s Note: The statements, opinions and data contained in all publications are solely those of the individual author(s) and contributor(s) and not of MDPI and/or the editor(s). MDPI and/or the editor(s) disclaim responsibility for any injury to people or property resulting from any ideas, methods, instructions or products referred to in the content.