This section evaluates the proposed TAPGFusion framework from multiple perspectives. First, the datasets, implementation details, and evaluation metrics are introduced. The proposed method is then compared with representative state-of-the-art approaches on the CT–MRI, PET–MRI, and SPECT–MRI fusion tasks. Statistical significance and ablation analyses are further conducted to assess the reliability of the improvements and the contributions of the individual modules. Finally, noise, modality degradation, and intermediate-feature visualization experiments are presented to evaluate the robustness and feature representation capability of the proposed method.
4.1. Datasets
To evaluate the performance of the proposed TAPGFusion method, we used the publicly available Harvard Medical Image Database for three representative multimodal medical image fusion tasks: CT–MRI, PET–MRI, and SPECT–MRI. Following the dataset selection and partitioning protocol adopted in [
36], we selected 184 registered CT–MRI image pairs, 269 registered PET–MRI image pairs, and 357 registered SPECT–MRI image pairs. For each modality combination, 24 image pairs were randomly selected as an independent test set, while the remaining image pairs were used for model training. Consequently, the training sets consisted of 160 CT–MRI pairs, 245 PET–MRI pairs, and 333 SPECT–MRI pairs, respectively.
All source images had a spatial resolution of pixels and were directly used as the network inputs without cropping or resizing. Before being fed into the network, the pixel intensities of each source image were normalized to the range of . The same preprocessing procedure was consistently applied to the training and test sets.
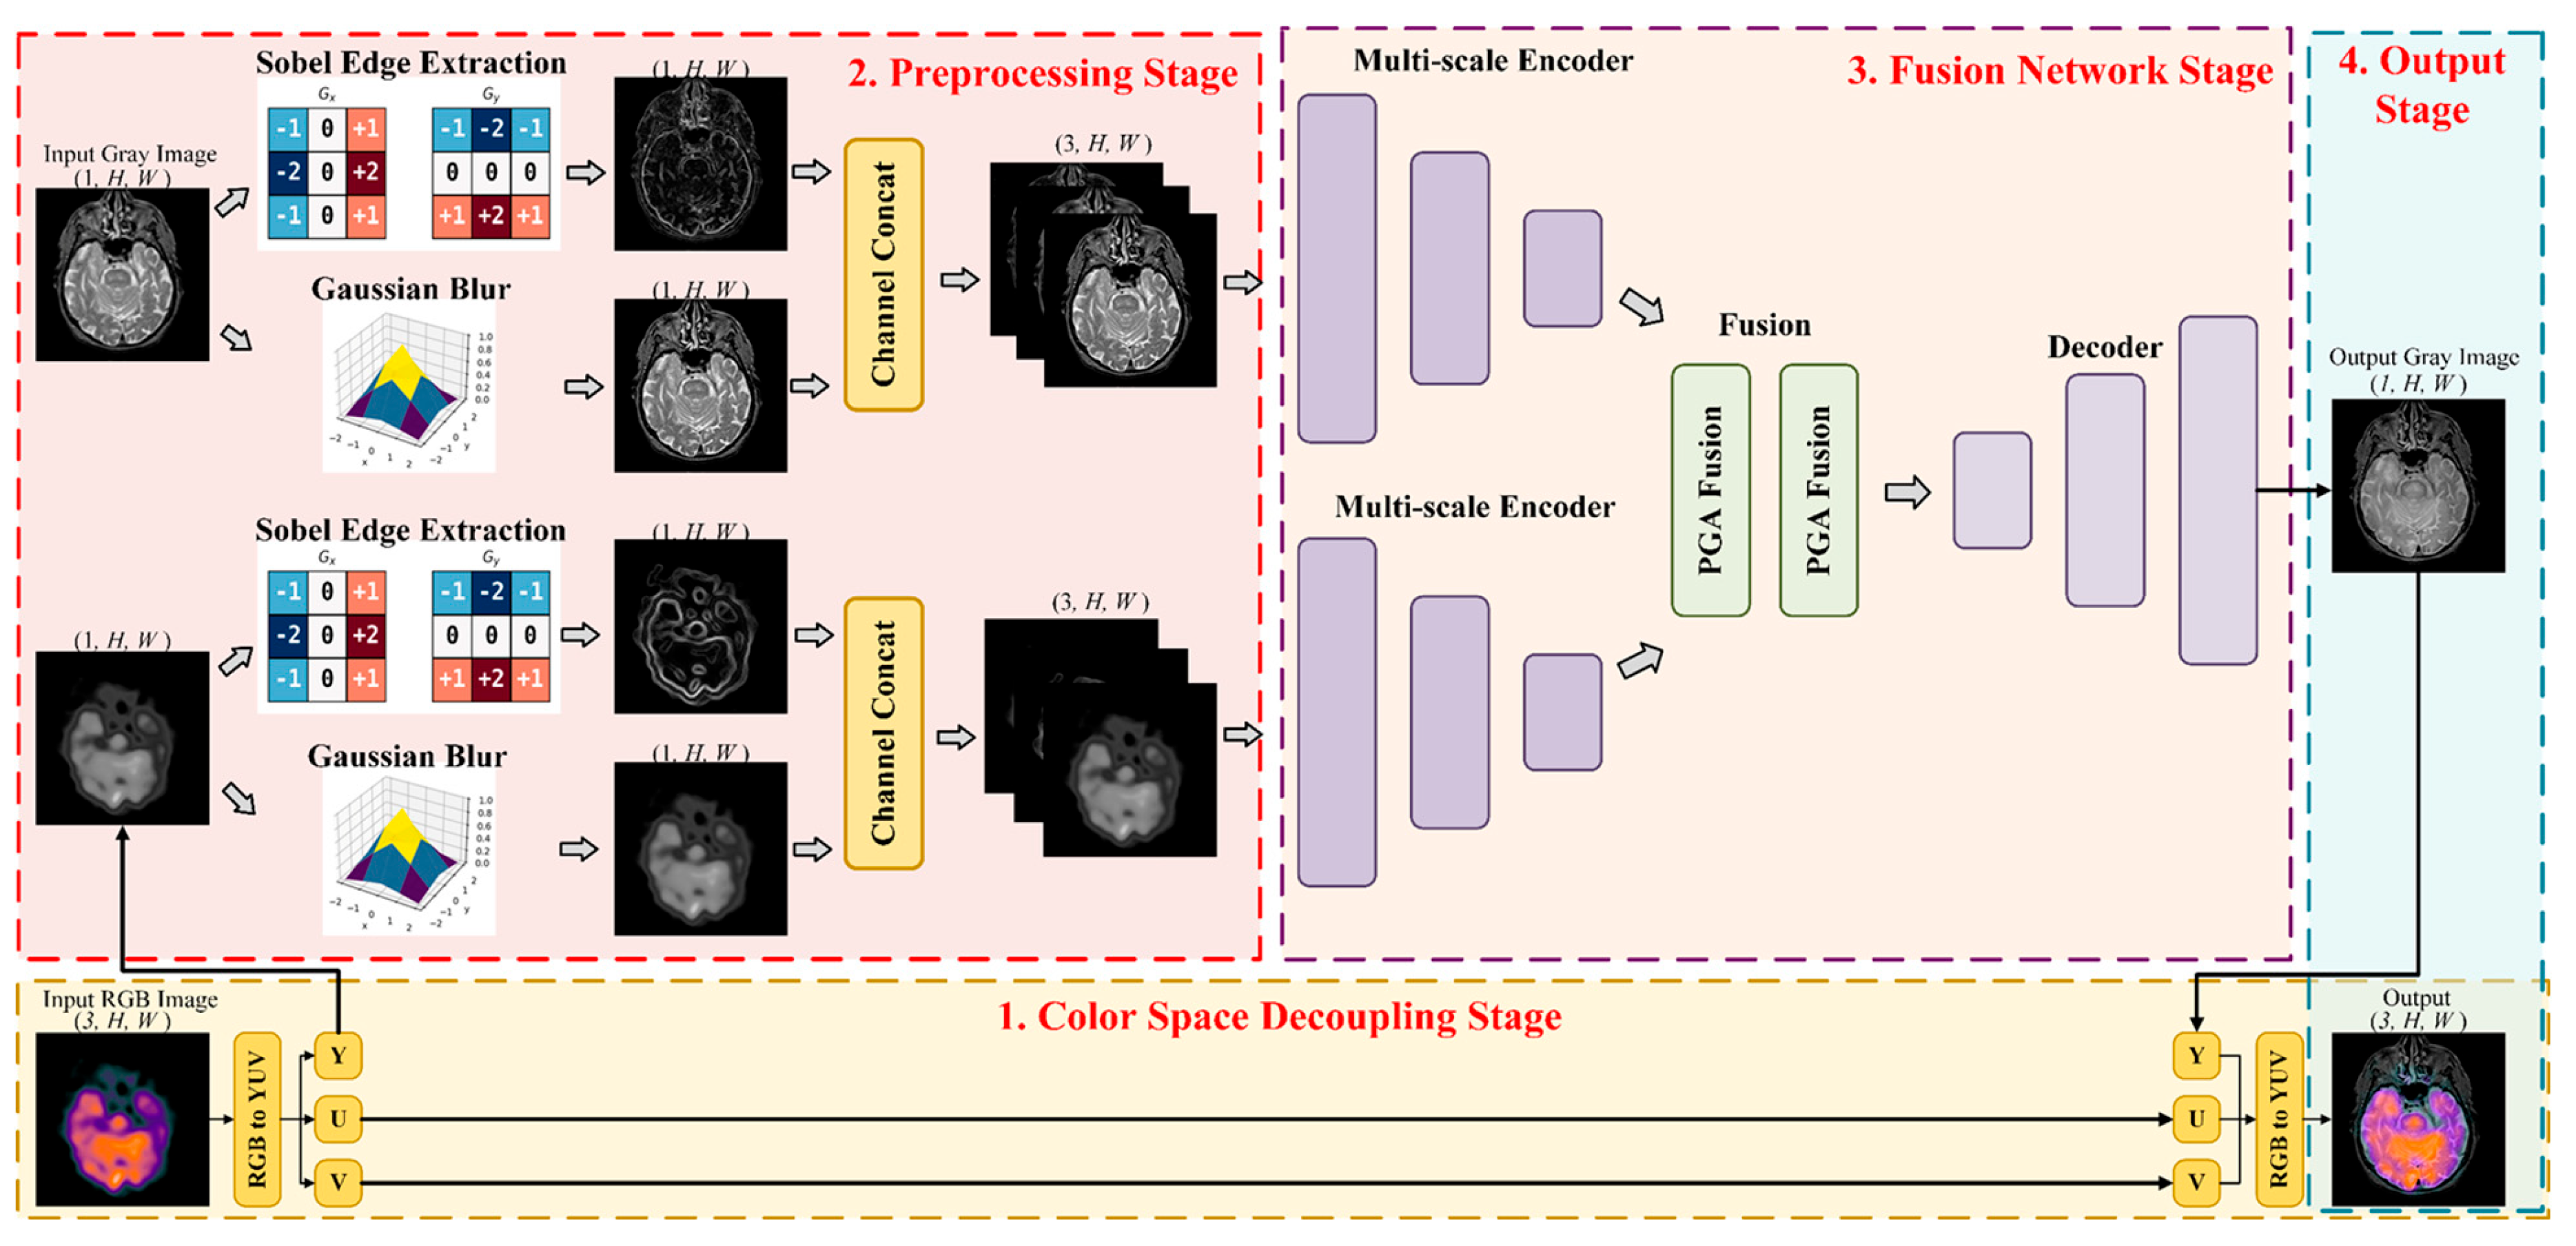
All images had a spatial resolution of 256 × 256 pixels. CT and MRI images were single-channel grayscale images, whereas PET and SPECT images were color images. For the PET–MRI and SPECT–MRI fusion tasks, the functional images were converted into the YCbCr color space. The Y channel, which contains the primary luminance and structural information, was used as the input to the fusion network together with the corresponding MRI image. After fusion, the resulting Y channel was recombined with the original Cb and Cr channels to reconstruct the final color fused image.
The dataset partitioning was performed at the level of registered image pairs before model training, and the same partition was used throughout all experiments. No image pair was included in both the training and test sets, thereby preventing direct overlap between the two subsets. The test sets were kept separate from the training process and were used only for the final quantitative and qualitative evaluation.
4.2. Implementation Details
All experiments in this study were implemented using the PyTorch 2.1.2 framework and executed on an NVIDIA (Santa Clara, CA, USA) GeForce RTX 4090 (24 GB) GPU. Tailored preprocessing strategies were devised to accommodate the distinct imaging characteristics and data profiles of different medical modalities. For the CT-MRI fusion task, since both CT and MRI source images are grayscale, they were directly fed into the model without any color space conversion. Conversely, for the PET-MRI and SPECT-MRI fusion tasks, where PET and SPECT are RGB images, we adopted the color space conversion strategy proposed in [
37], uniformly mapping the SPECT/PET images into the YUV color space. Following conversion, only the Y channel—which encapsulates the core structural and luminance features of the image—was extracted as the training input for the fusion model. The Cb and Cr channels, which carry chrominance information but lack practical medical diagnostic value, were strictly aligned spatially with the corresponding Y channel, temporarily stored, and excluded from the model training process. Once the cross-modal fusion computations between the PET-Y/SPECT-Y channels and the MRI images were completed to generate the fused Y channel, the previously stored original Cb and Cr channels from the PET/SPECT images were recombined with the fused Y channel. An inverse YUV-to-RGB transformation was then applied to reconstruct and output the final PET-MRI and SPECT-MRI fused images, seamlessly integrating the fused structural information with the original color representation. This strategy successfully decouples structural and color information, maintaining the visual interpretability of the fused images while ensuring the efficacy of cross-modal fusion feature learning.
Training Strategy: All models were trained using the AdamW optimizer with a learning rate set to 1 × 10⁻³. The training process spanned 100 epochs with a batch size of 4.
Loss Function: We adopted the loss function formulated in [
36], which comprises three components: content loss, gradient loss, and structural similarity loss. Integrating these three distinct losses circumvents the limitations inherent to utilizing a singular loss function.
- •
Content Loss constrains the pixel-intensity consistency between the fused image and the source images, guaranteeing the retention of foundational grayscale and luminance information from each modality.
- •
Gradient Loss focuses on high-frequency details such as image edges and textures; by constraining gradient information, it ensures the fused image possesses clear structures and sharp edges, preventing detail blurring.
- •
Structural Similarity Loss evaluates image similarity across three dimensions—luminance, contrast, and structural information—ensuring the fused result remains consistent with the source images in terms of overall anatomical structure and visual perception.
To balance the three optimization objectives, the weights of the content loss, gradient loss, and structural similarity loss were set to 0.5, 0.5, and 1.0, respectively. The larger weight assigned to the structural similarity loss emphasizes the preservation of anatomical structures, while the content and gradient losses jointly constrain intensity information and fine details. These weights were kept fixed across all datasets and experiments.
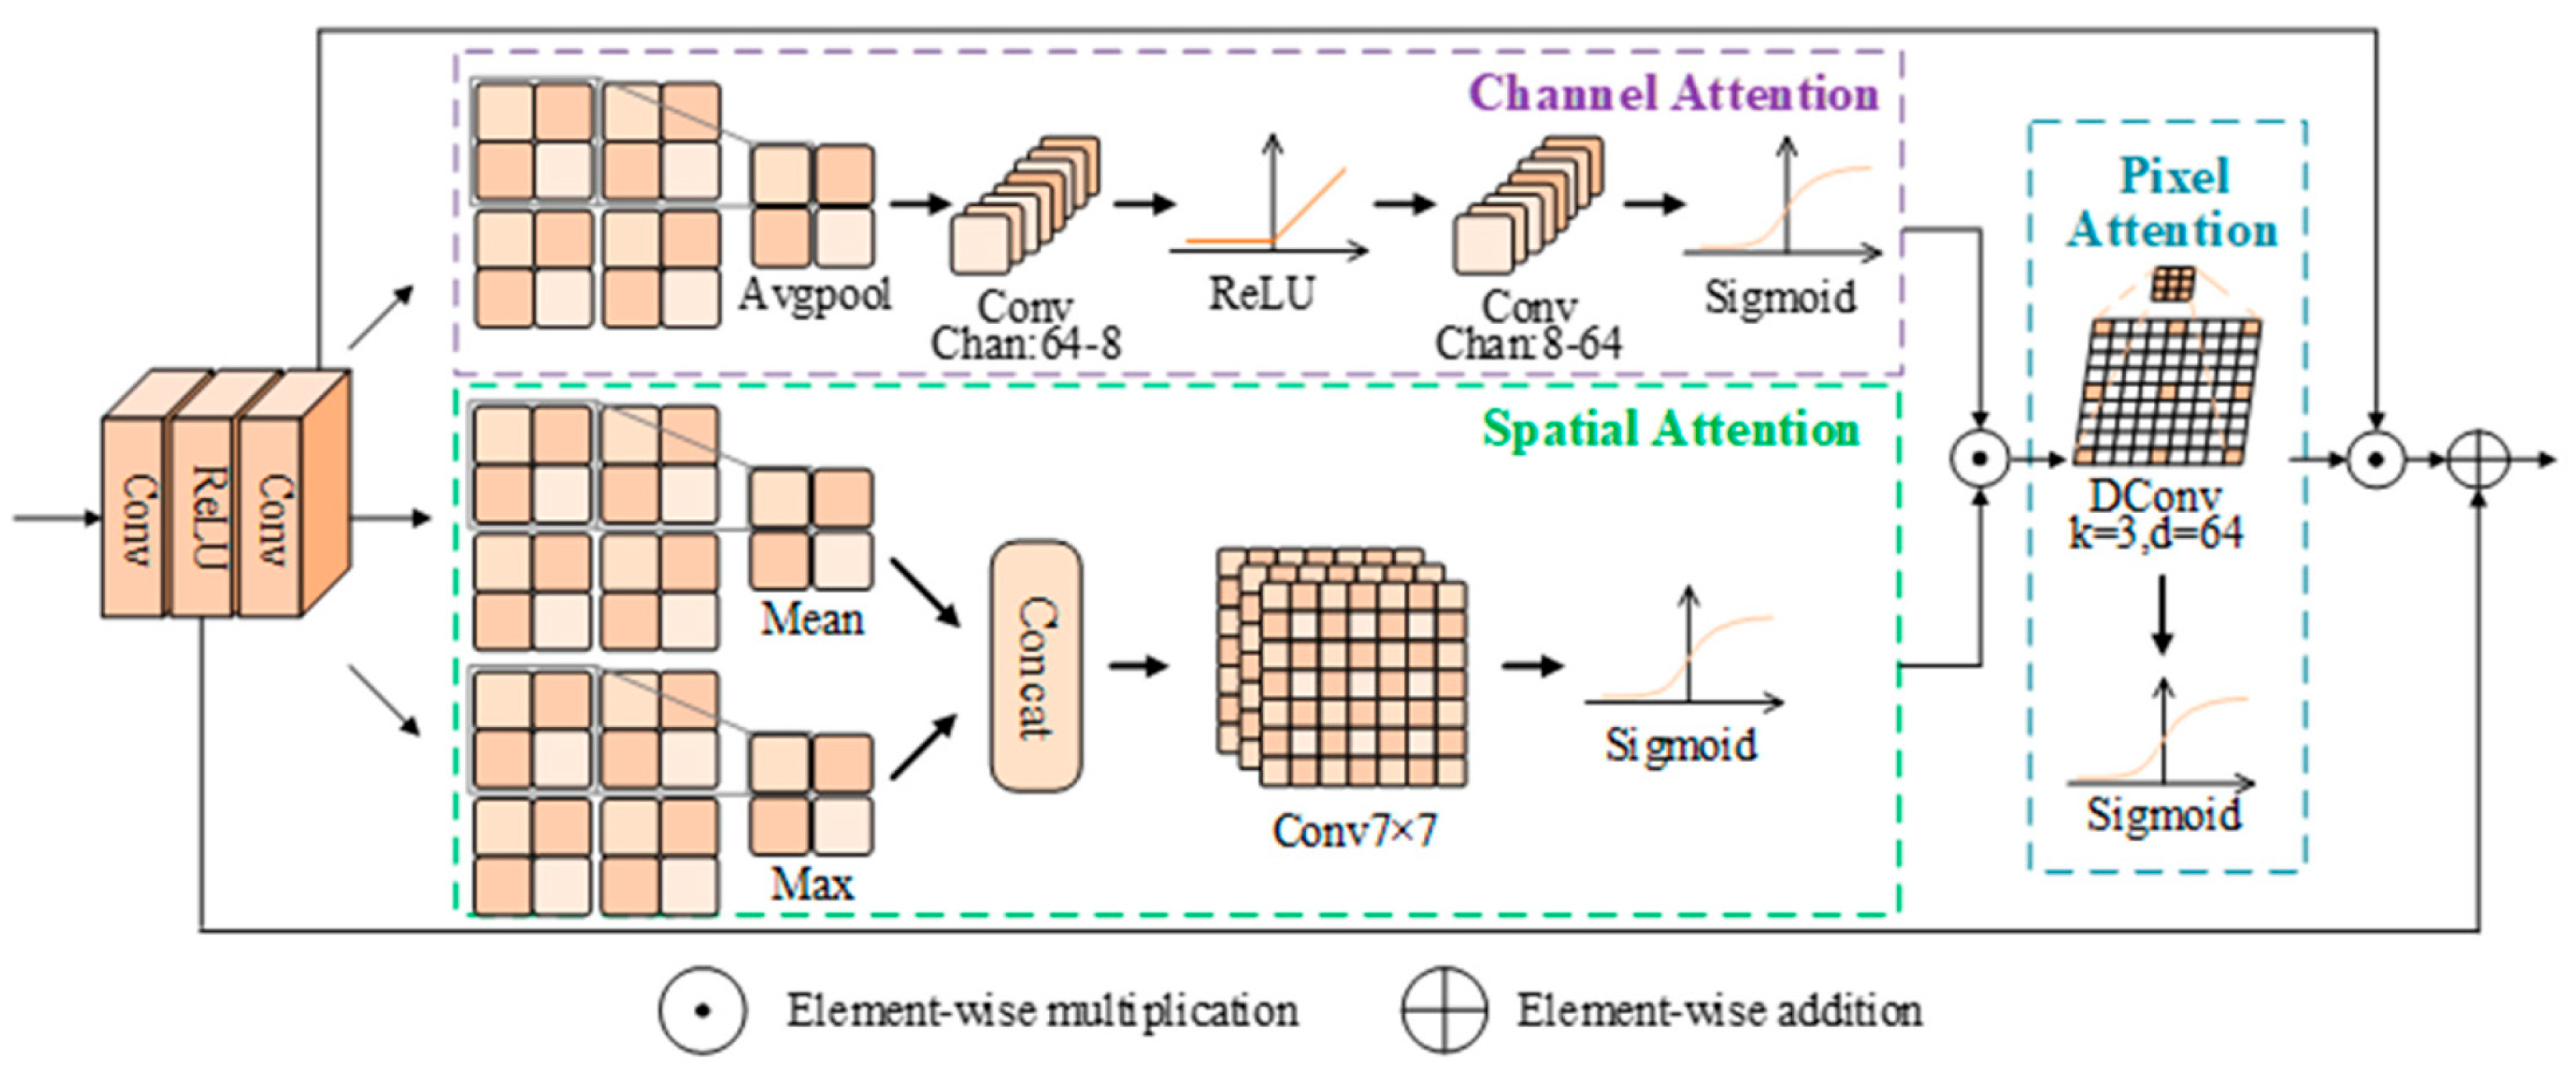
Computational Cost: We further evaluated the computational complexity of TAPGFusion using one multimodal image pair with a batch size of 1. The complete model contains approximately 1.59 million trainable parameters and requires 14.44 GFLOPs for a single forward pass. The multi-scale encoding stage constitutes the main computational component, accounting for approximately 0.84 million parameters and 8.76 GFLOPs because of its parallel convolutional branches. The DEA Blocks require approximately 0.28 million parameters and 2.38 GFLOPs, whereas the lightweight PGA Block introduces only approximately 0.05 million parameters and 0.34 GFLOPs. The decoder accounts for approximately 0.42 million parameters and 2.86 GFLOPs. Overall, the DEA and PGA Blocks introduce only moderate additional computation, indicating that the improved fusion performance is mainly attributable to the proposed feature-enhancement and adaptive-fusion mechanisms rather than a substantial increase in model size.
4.4. Comparison with State-of-the-Art Methods
To benchmark the proposed TAPGFusion framework, we selected six current main stream state-of-the-art fusion methods for comparison: CDDFuse [
38], FATFusion [
39], GeSeNet [
25], PMGI [
40], SwinFuse [
41], U2Fusion [
42] and IFCNN [
34].
4.4.1. CT-MRI Dataset
The quantitative evaluation results on the CT–MRI dataset are presented in
Table 1. The proposed method achieves the best performance in four key metrics, including CC, MSE, PSNR, and SSIM, demonstrating a favorable balance between structural preservation and reconstruction fidelity. Specifically, TAPGFusion obtains the highest CC of 0.8333, exceeding the second-best SwinFuse result of 0.8313. This improvement indicates that the fused images generated by our method maintain stronger overall correlation and content consistency with the source modalities.
TAPGFusion also achieves the lowest MSE of 0.0265 and the highest PSNR of 63.9868. Compared with the second-best PMGI results of 0.0267 in MSE and 63.9416 in PSNR, these values indicate that the proposed method introduces less reconstruction distortion while preserving source-image information more accurately. In addition, our method obtains the highest SSIM of 0.7884, slightly exceeding U2Fusion at 0.7877 and clearly outperforming the remaining comparison methods. The leading SSIM result further demonstrates the ability of TAPGFusion to preserve structural relationships, tissue boundaries, and local contrast during the fusion process.
Although FATFusion achieves the highest EN of 5.9146, PMGI obtains the highest MI of 2.7338, and U2Fusion achieves the highest FMI of 0.6599, these individual advantages are not consistently maintained across the other evaluation metrics. In contrast, TAPGFusion achieves the best results in all four reconstruction- and structure-related metrics while maintaining competitive information-preservation performance. This result suggests that the proposed method does not simply maximize image entropy or feature information independently. Instead, it seeks a more balanced integration of complementary CT and MRI information while controlling structural distortion.
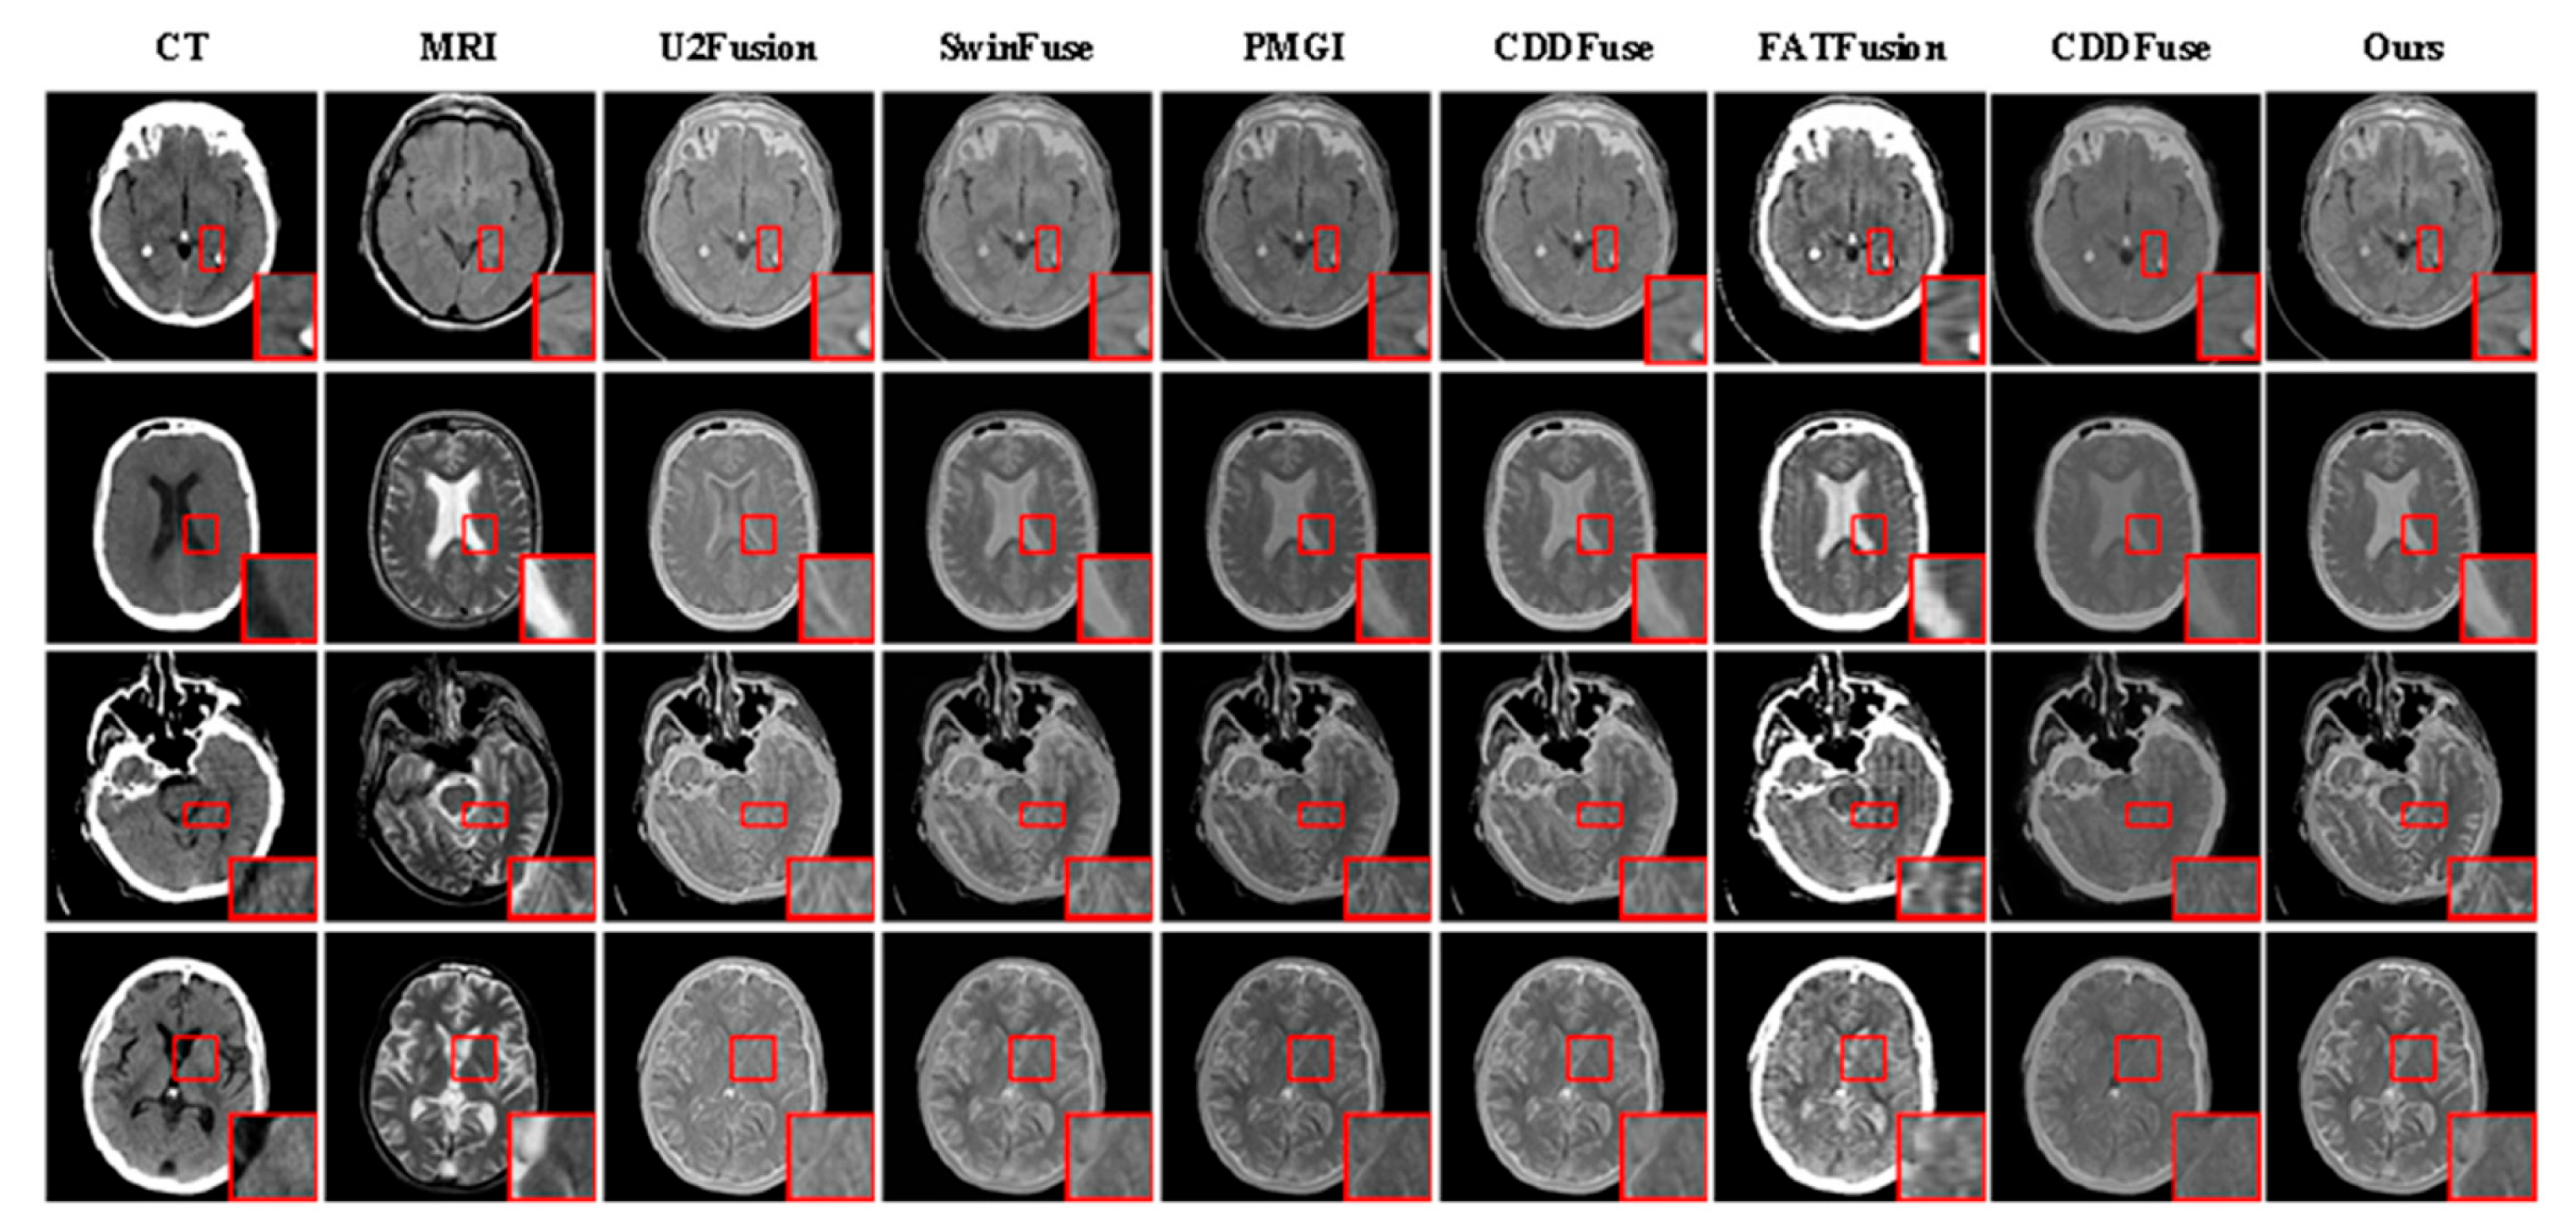
The visual comparisons in
Figure 5 further support the quantitative findings. The fused images generated by our method preserve both the high-contrast skeletal structures of CT and the soft-tissue details of MRI. In comparison, U2Fusion and SwinFuse exhibit localized blurring or insufficient contrast in some regions, whereas CDDFuse and FATFusion show varying degrees of over-enhancement or luminance imbalance. The proposed method provides clearer structural boundaries, more natural intensity transitions, and fewer visible artifacts. These observations are consistent with its leading CC, MSE, PSNR, and SSIM results and demonstrate its effectiveness in balancing structural detail preservation and multimodal information integration.
4.4.2. PET-MRI Dataset
The quantitative assessment results on the PET–MRI dataset are presented in
Table 2. TAPGFusion achieves the best performance in six of the seven evaluation metrics, including CC, EN, MI, MSE, PSNR, and SSIM. This consistent performance demonstrates the effectiveness of the proposed method in preserving anatomical structures, retaining complementary functional information, and reducing fusion distortion.
Specifically, the CC of TAPGFusion reaches 0.8691, exceeding the second-best GeSeNet result of 0.8679. The highest CC indicates stronger overall consistency between the fused image and the PET and MRI source images. The proposed method also achieves the highest EN of 5.1583, compared with the second-best value of 5.1181 obtained by GeSeNet. This result suggests that TAPGFusion retains a relatively rich amount of information in the fused output without relying on excessive contrast enhancement.
In terms of complementary information preservation, TAPGFusion achieves the highest MI of 3.4233, surpassing the second-best SwinFuse result of 3.3808. This improvement indicates that the fused images contain more shared information from the anatomical and functional modalities. Moreover, TAPGFusion obtains the lowest MSE of 0.0280 and the highest PSNR of 63.7154, compared with the corresponding second-best GeSeNet results of 0.0281 and 63.7028. These results demonstrate that the proposed method reduces reconstruction errors while maintaining high signal fidelity.
TAPGFusion also achieves the highest SSIM of 0.7886, outperforming the second-best FATFusion result of 0.7817. The improvement in SSIM confirms that the proposed method effectively preserves the anatomical structures and local spatial relationships provided by MRI. Although PMGI achieves the highest FMI of 0.6442, its performance in the remaining metrics is substantially lower, particularly in CC, EN, MSE, PSNR, and SSIM. Therefore, the FMI result should be interpreted together with the other metrics. Overall, TAPGFusion provides a more balanced fusion result by jointly preserving MRI structural information and PET metabolic information.
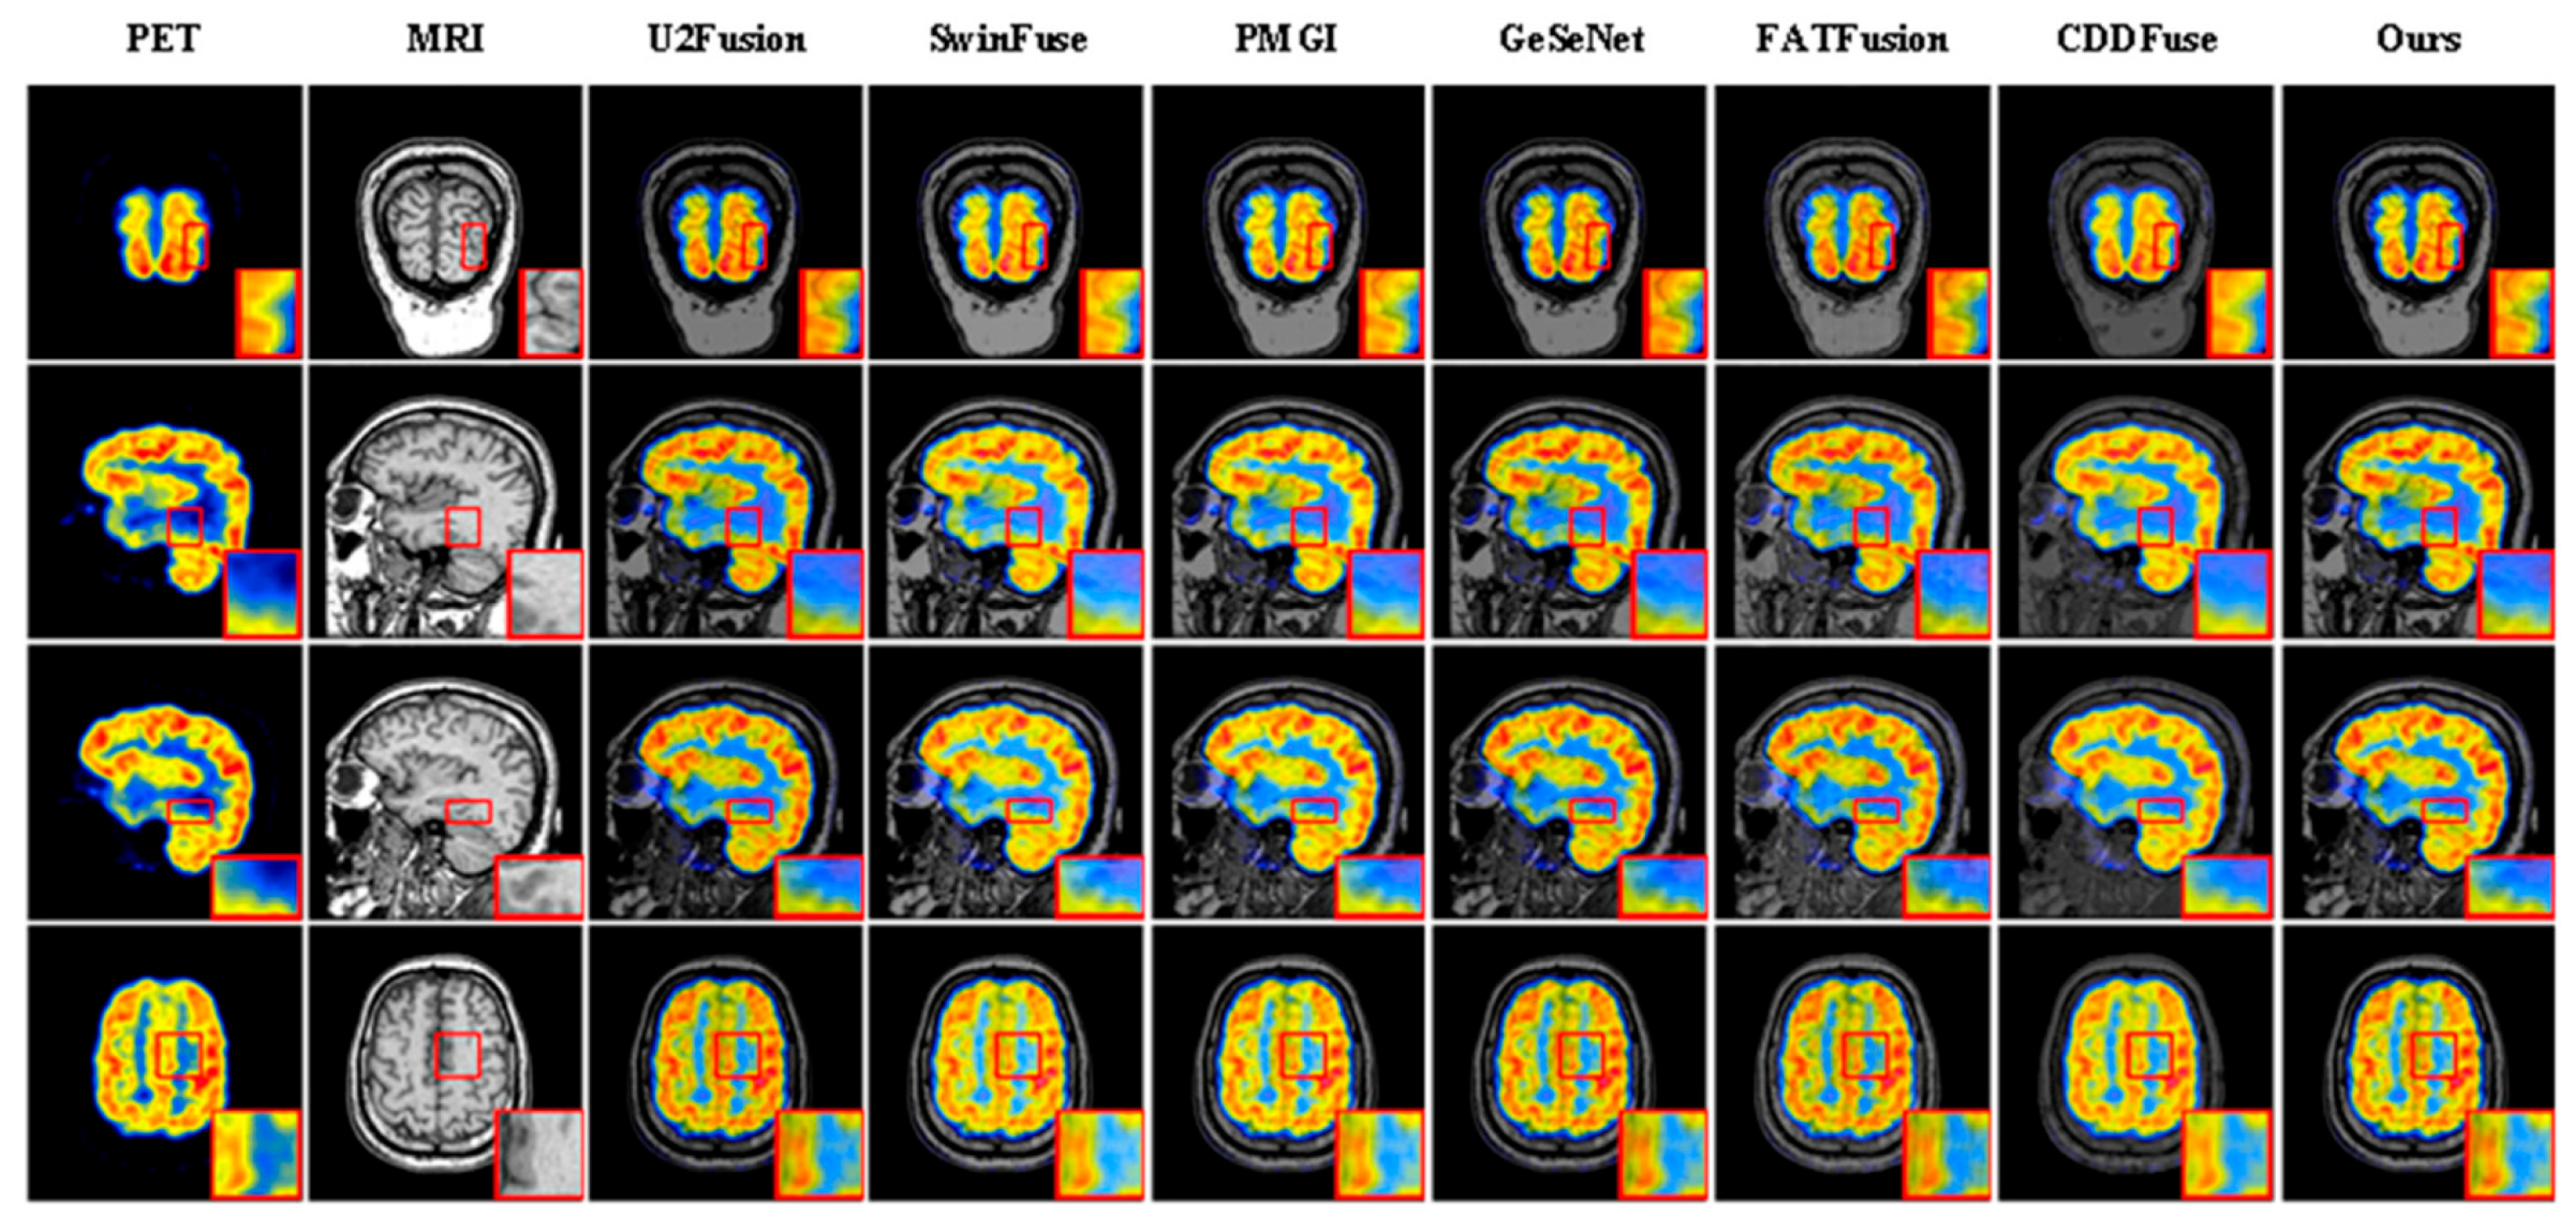
The visual comparisons in
Figure 6 further support these quantitative findings. Our method preserves the metabolic information from PET while presenting the anatomical structures from MRI more clearly. The fused images exhibit sharper tissue boundaries, more natural color transitions, and fewer visible artifacts. In contrast, some comparison methods, such as CDDFuse and PMGI, show varying degrees of detail loss, structural blurring, or luminance distortion. The agreement between the quantitative and qualitative results confirms the overall effectiveness of TAPGFusion for PET–MRI image fusion.
4.4.3. SPECT-MRI Dataset
On the SPECT-MRI dataset, the quantitative results in
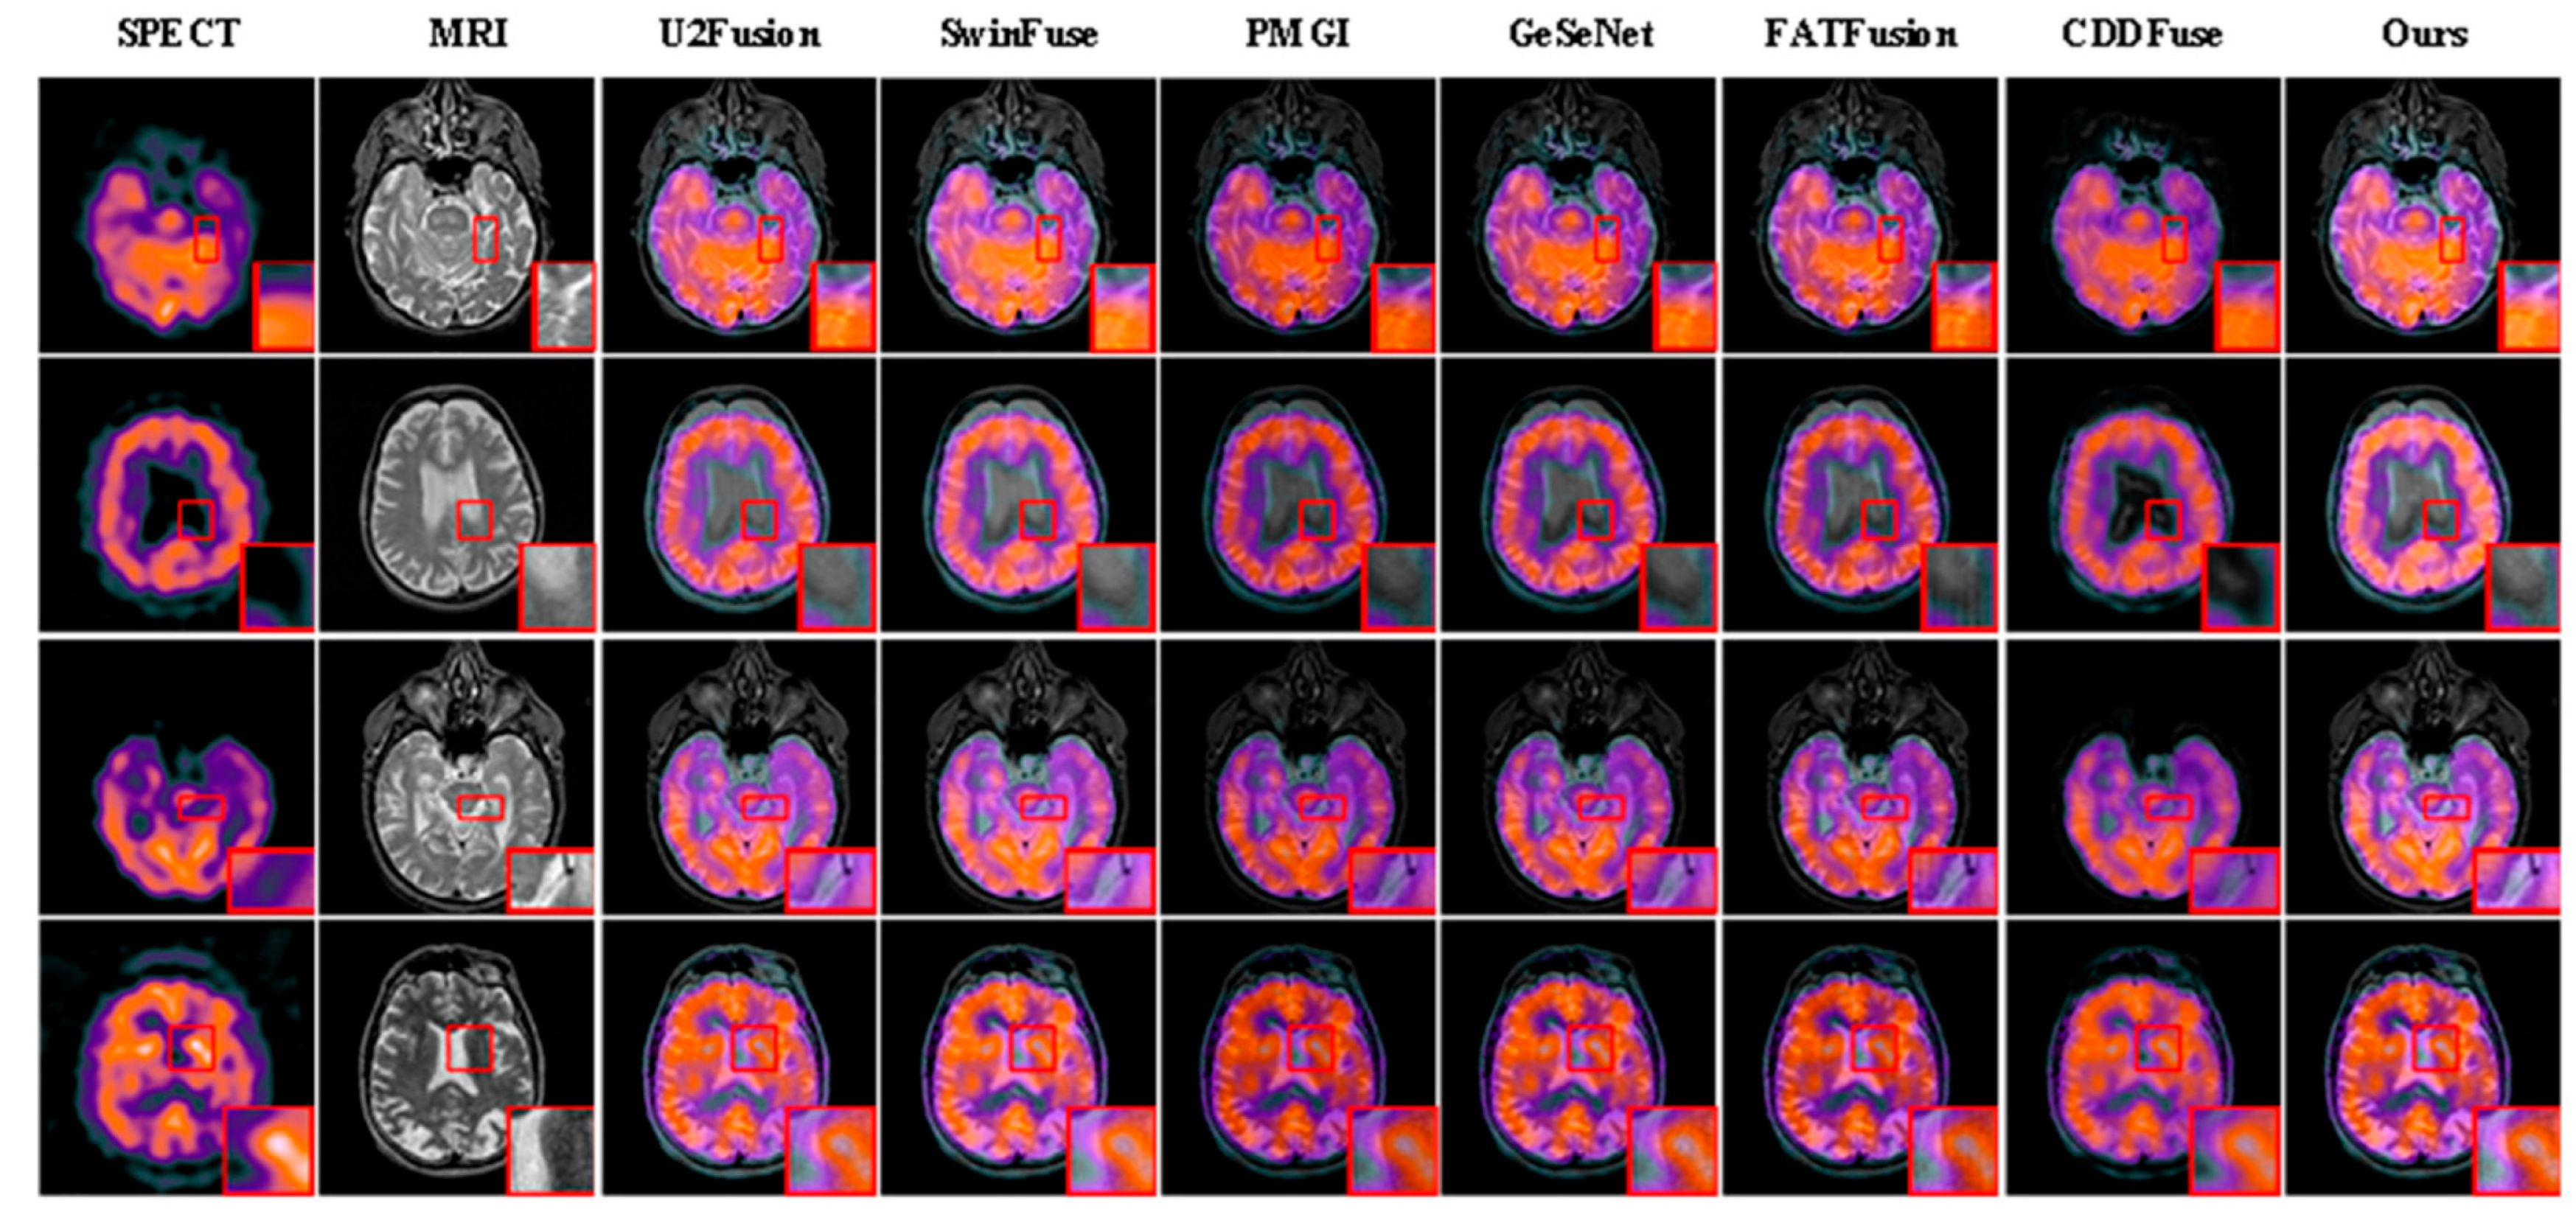
Table 3 strongly corroborate the efficacy of our three core innovations. First, the superior performance in CC (0.9073), MI (2.8128), and SSIM (0.8692) validates the
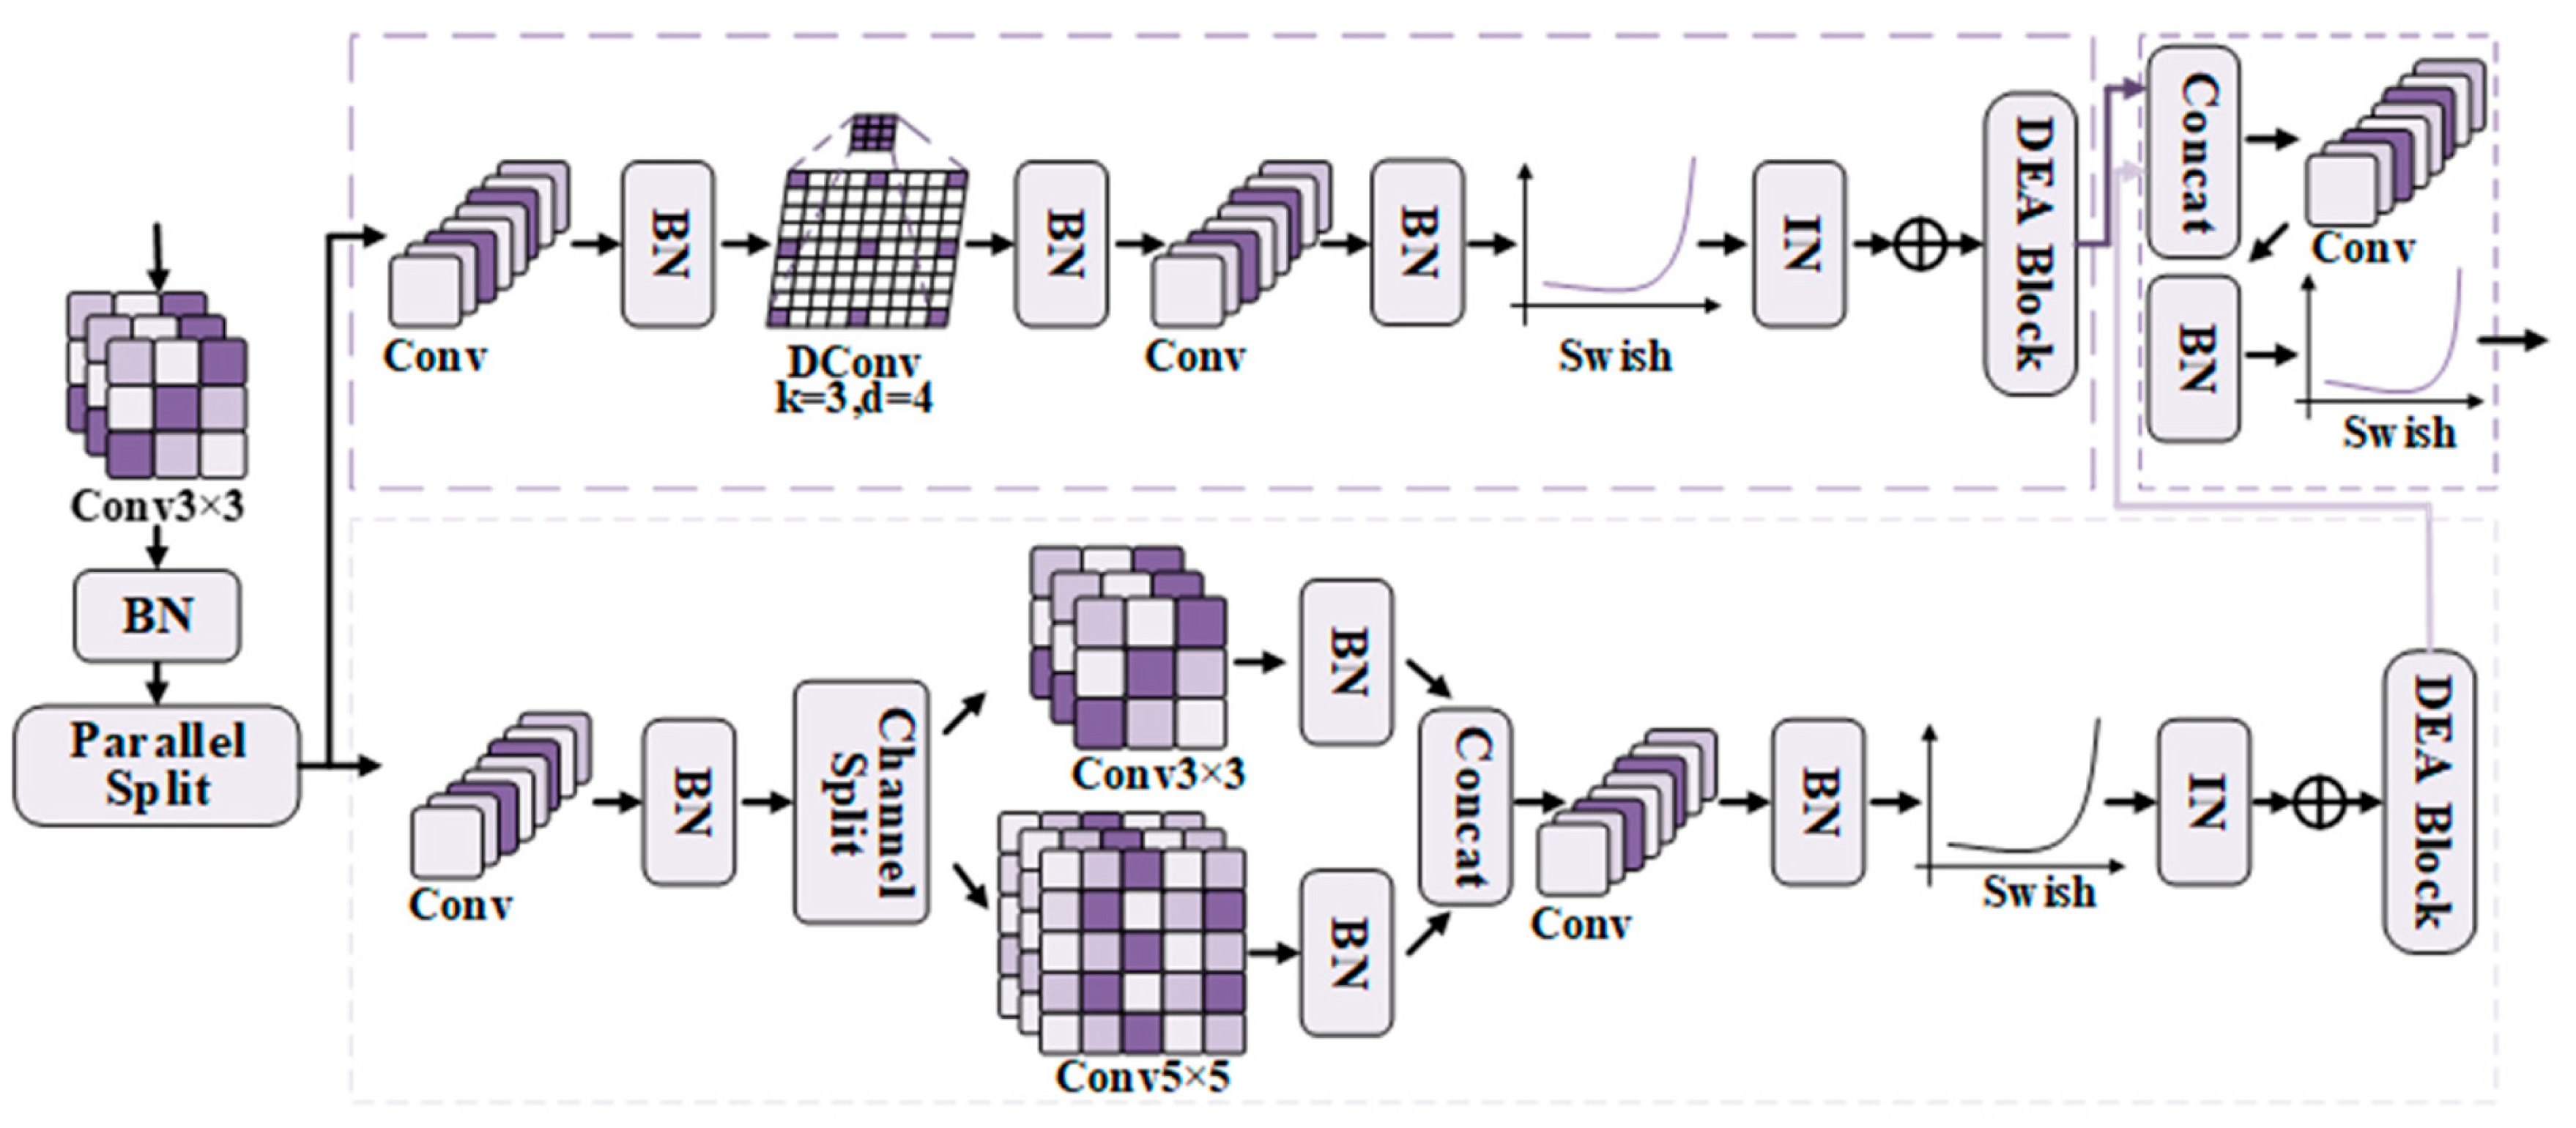
Multi-Scale Encoder: by parallelizing dilated convolutions (global context) with multi-kernel branches (local details), the module ensures comprehensive feature extraction that preserves both macro-anatomical consistency and fine-grained structural correlation across modalities. Second, the highest EN (4.2259)—reflecting maximal information density and high-frequency detail retention—directly evidences the contribution of the
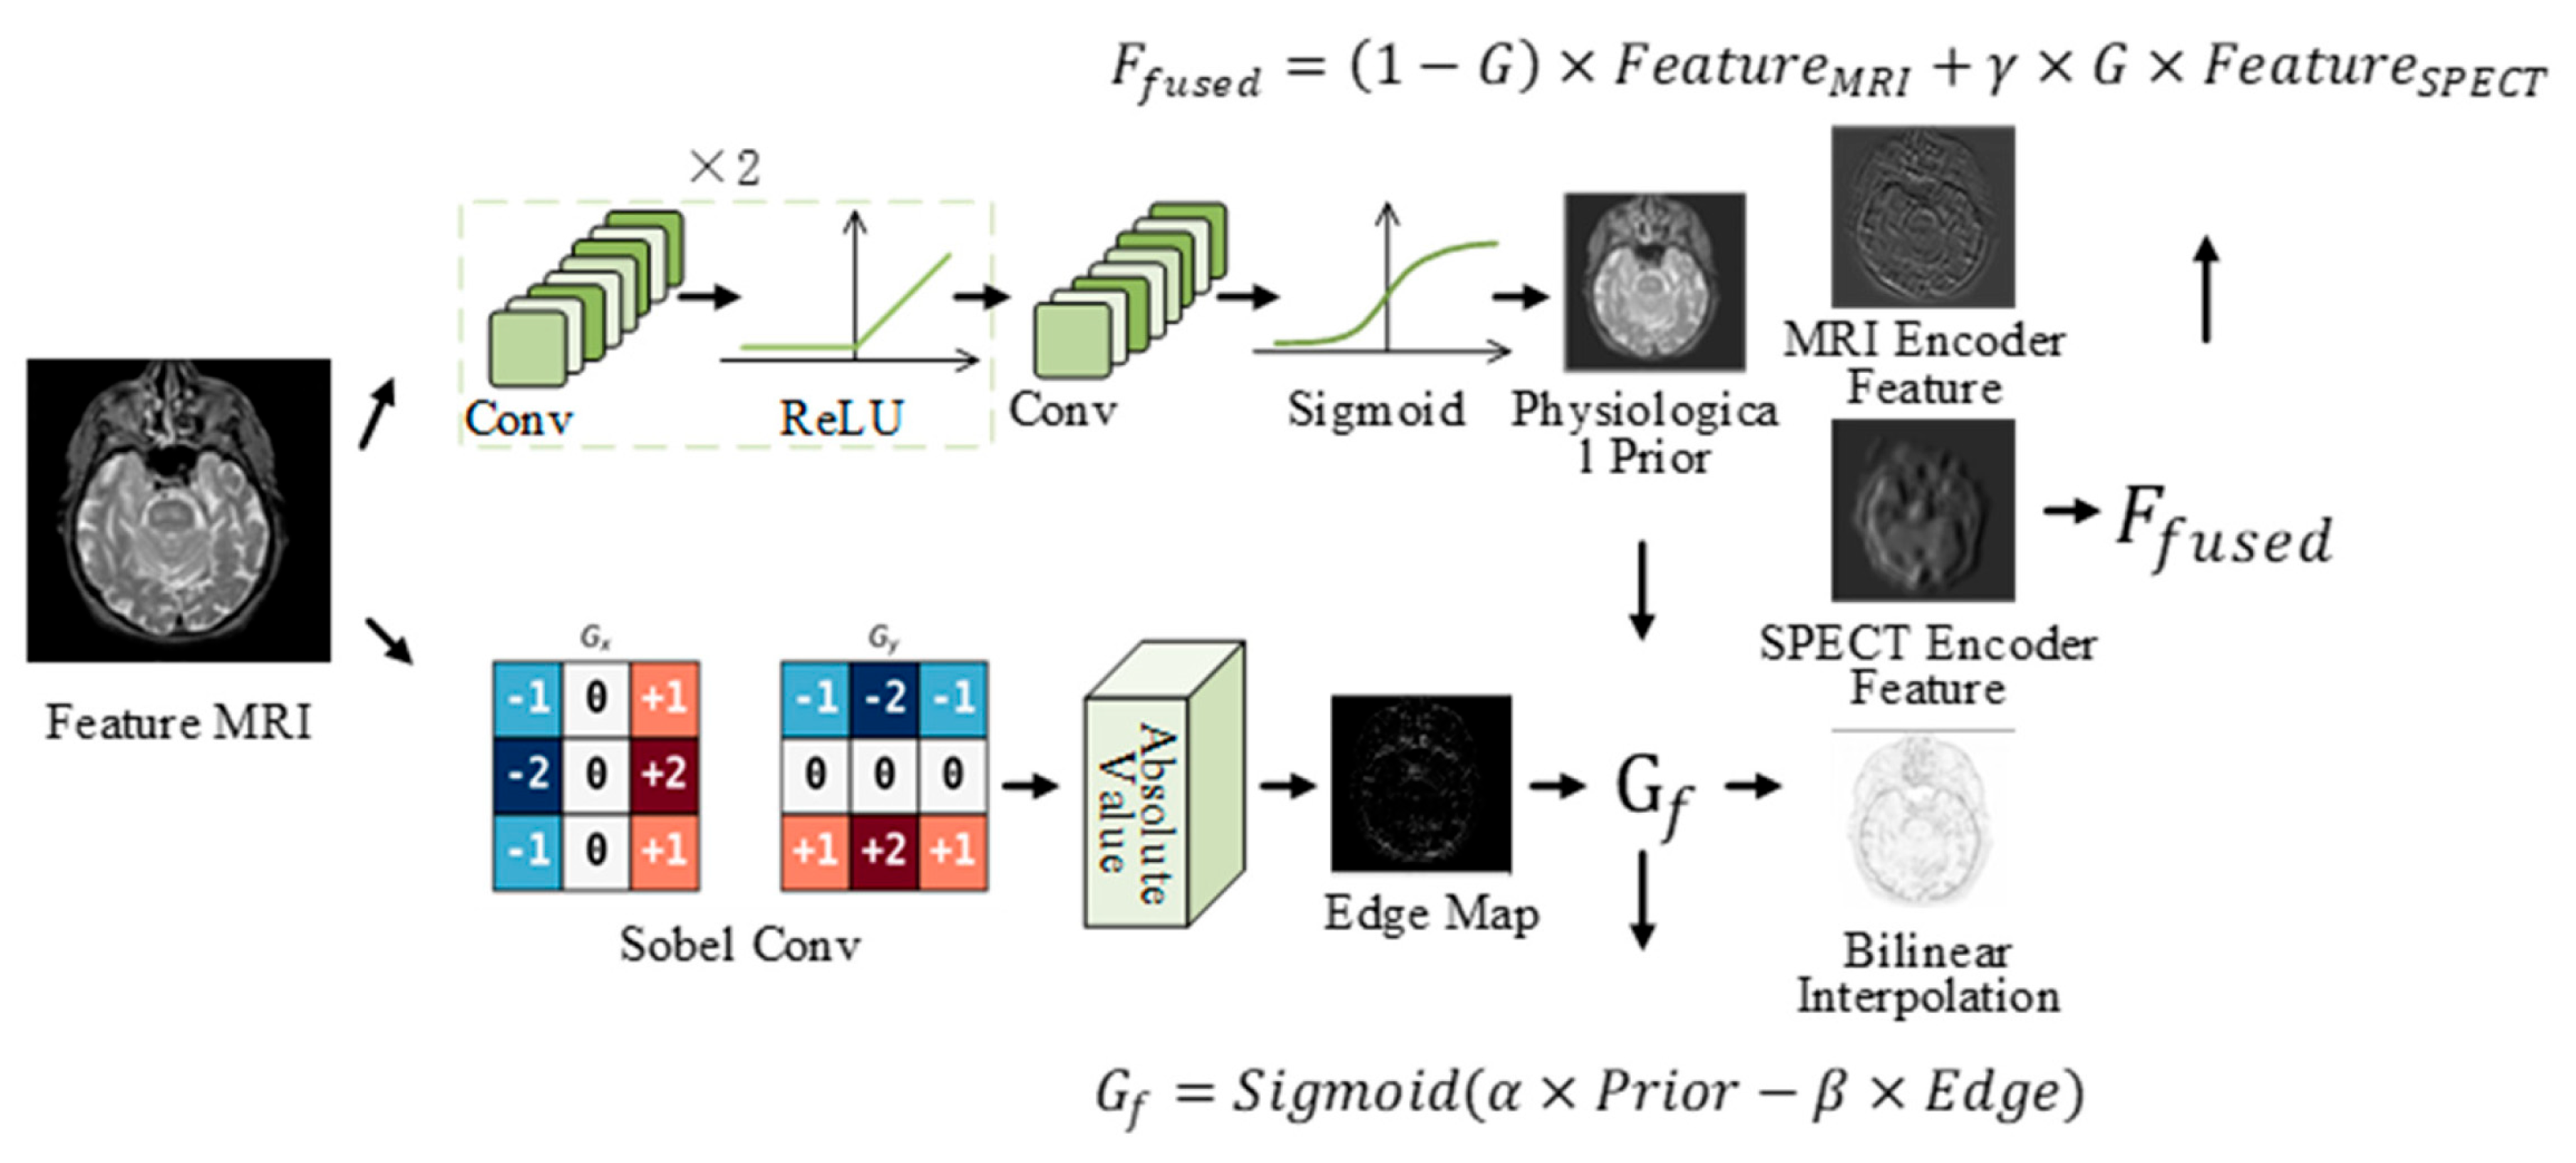
Detail-Enhanced Attention (DEA) Block: its tripartite channel-spatial-pixel attention mechanism adaptively amplifies diagnostically critical features (e.g., lesion boundaries, metabolic edges) while suppressing modality-specific noise, thereby enriching texture fidelity without over-smoothing. The joint improvements in structural metrics, such as SSIM and PSNR, and information-based metrics, such as MI and EN, demonstrate the effectiveness of the PGA Block. The block dynamically adjusts the fusion weights using MRI-conditioned prior information and edge constraints. It preserves anatomical structures in regions with strong edge responses while emphasizing functional information in metabolically active regions. The slight trade-offs in FMI and MSE indicate that the method does not optimize every metric independently. Instead, it aims to achieve a balanced preservation of structural and functional information. This interpretation is also supported by the visual results, which show natural color transitions, clear edges, and accurate spatial correspondence between anatomical and functional features. Collectively, these quantitative–qualitative alignments substantiate that TAPGFusion’s architecture—multi-scale extraction, triple-attention enhancement, and prior-guided adaptive fusion—synergistically resolves the core challenge of simultaneous anatomical integrity and functional validity in multimodal medical image fusion. As shown in
Figure 7.
Figure 7.
Qualitative comparison between the proposed method and six competing approaches on the SPECT-MRI dataset. Each row represents a different sample, and each column represents a different method. The red box indicates local zoomed-in details.
Figure 7.
Qualitative comparison between the proposed method and six competing approaches on the SPECT-MRI dataset. Each row represents a different sample, and each column represents a different method. The red box indicates local zoomed-in details.
4.4.4. Statistical Significance Analysis
To further evaluate the reliability of the performance improvements, paired-sample t-tests were conducted between the proposed TAPGFusion method and each comparison method based on the per-image metric values obtained from the same test image pairs. The significance level was set to .
On the CT–MRI dataset, statistically significant differences were observed in CC, MSE, PSNR, and SSIM. On the PET–MRI dataset, the differences in MI, MSE, PSNR, and SSIM were statistically significant. On the SPECT–MRI dataset, statistically significant differences were obtained in CC, EN, MI, MSE, PSNR, and SSIM. In all these comparisons, the corresponding -values were lower than 0.05.
These results demonstrate that the performance improvements achieved by TAPGFusion on the key evaluation metrics are statistically reliable rather than being caused by random variations among the test samples. Moreover, the significant differences in both reconstruction-related metrics, including MSE, PSNR, and SSIM, and information-preservation metrics, including CC, MI, and EN, further confirm the consistent ability of the proposed method to preserve anatomical structures and complementary functional information.
4.5. Ablation Study
To clarify the experimental workflow, all ablation configurations were predefined before training and evaluated as independent controlled experiments. They were not obtained through sequential backtracking or by progressively modifying a previously trained model according to the observed results. For each configuration, the network was independently initialized and trained using the same dataset partition, preprocessing procedure, optimizer, learning rate, batch size, number of epochs, and loss settings. Only the module or component under investigation was changed, while all other experimental conditions remained fixed.
The ablation analysis was conducted at two levels. First, module-level experiments were performed on the CT–MRI, PET–MRI, and SPECT–MRI datasets to evaluate the contributions of the Multi-Scale Encoder, DEA Block, and PGA Block. Second, component-level experiments were conducted on the PET–MRI dataset to examine the channel, spatial, and pixel attention branches within the DEA Block, as well as the MRI-conditioned prior, edge guidance, and adaptive gating mechanism within the PGA Block. Each trained variant was evaluated on the same independent test set, and the average CC, EN, FMI, MI, MSE, PSNR, and SSIM values were calculated for comparison.
The expanded ablation study in
Table 4,
Table 5 and
Table 6 includes the baseline network and all possible combinations of the Multi-Scale Encoder, DEA Block, and PGA Block. The single-module configurations provide a direct assessment of the independent contribution of each component, whereas the two-module and full configurations reveal their interactions.
Compared with the baseline network, introducing each module individually improves several evaluation metrics, although the magnitude of improvement varies across modalities. The Multi-Scale Encoder generally improves multi-scale feature representation and structural correlation. The DEA Block enhances feature selection and local detail representation, while the PGA Block improves the adaptive balance between anatomical and functional information.
The results also indicate that the effects of the three modules are not simply additive. Certain partial combinations achieve better values for individual metrics but may reduce performance on other criteria. In contrast, the complete TAPGFusion model achieves the best or near-best results across the majority of metrics on all three datasets, demonstrating more balanced fusion performance.
Specifically, on the CT–MRI dataset, the complete model achieves the highest CC, EN, MI, and SSIM and the lowest MSE. On the PET–MRI dataset, it obtains the highest CC, FMI, MI, and SSIM while maintaining competitive reconstruction performance. On the SPECT–MRI dataset, it achieves the highest CC, EN, FMI, MI, PSNR, and SSIM. These results confirm both the independent effectiveness and complementary interaction of the three proposed modules.
4.5.1. Component-Wise Ablation of the DEA Block
To further investigate the contribution of the internal components of the DEA Block, we conducted component-wise ablation experiments on the PET–MRI dataset. The PET–MRI task was selected because it simultaneously involves high-resolution anatomical information from MRI and functional metabolic information from PET, providing a representative setting for evaluating the attention mechanisms.
We separately removed the channel, spatial, and pixel attention branches while retaining the remaining network structure. When an attention branch was removed, its corresponding attention mask was replaced with an identity mask, while the residual convolutional path remained unchanged. All variants were trained using the same dataset partition, optimization settings, loss functions, and training epochs.
As shown in
Table 7, the complete DEA Block achieves the best overall performance, demonstrating the complementary contributions of channel, spatial, and pixel attention. Removing spatial attention causes the largest reduction in SSIM, indicating that spatial attention is important for locating and preserving salient anatomical structures. Removing channel attention results in an evident decrease in MI and CC, suggesting that channel-wise recalibration facilitates the selection of complementary modality features. Although removing pixel attention causes a relatively smaller degradation, all metrics still decline consistently, confirming its contribution to fine-grained edge and texture enhancement.
4.5.2. Component-Wise Ablation of the PGA Block
We further evaluated the individual contributions of the learned MRI-conditioned prior, MRI-derived edge information, and adaptive gating mechanism within the PGA Block. Five configurations were compared: fixed average fusion, edge guidance only, learned prior only, combined prior and edge guidance with fixed coefficients, and the complete adaptive PGA Block.
As reported in
Table 8, fixed average fusion produces the lowest overall performance, indicating that static equal weighting cannot adequately accommodate spatial variations in multimodal information. The edge-guided variant achieves relatively better structural metrics, particularly SSIM and PSNR, confirming the role of edge information in preserving anatomical boundaries. In comparison, the learned-prior-only variant achieves higher MI and EN, suggesting that the learned spatial weighting map facilitates the preservation of complementary functional information.
Combining the learned prior with edge guidance improves all evaluated metrics, demonstrating that the two components provide complementary information. The complete PGA Block with learnable gating parameters achieves the best overall performance, further confirming that adaptive weighting is important for balancing anatomical structure preservation and functional information retention.
4.6. Noise Experiment
Noise Settings: To ensure the reproducibility of the robustness evaluation, all source images were first normalized to the range of . In both noise experiments, noise was added only to the luminance channel of the PET images, while the corresponding MRI images remained noise-free. This setting was adopted to evaluate whether the fusion methods could suppress interference in the functional modality while preserving the reliable anatomical information provided by MRI. The original chrominance channels of the PET images were retained without modification.
For the Gaussian-noise experiment, additive Gaussian noise with a mean of 0 and a standard deviation of 0.05 was used, corresponding to a variance of 0.0025. For the Poisson-noise experiment, the noise intensity was controlled using a peak value of 30. After noise addition, all pixel intensities were clipped to the valid range of .
Gaussian and Poisson noise were evaluated separately and were not applied simultaneously. For each test image pair and each noise type, five independent random noise realizations were generated. All comparison methods were evaluated using the same noisy inputs, and the quantitative results reported in
Table 9 and
Table 10 were averaged over all test image pairs and the five random noise realizations.
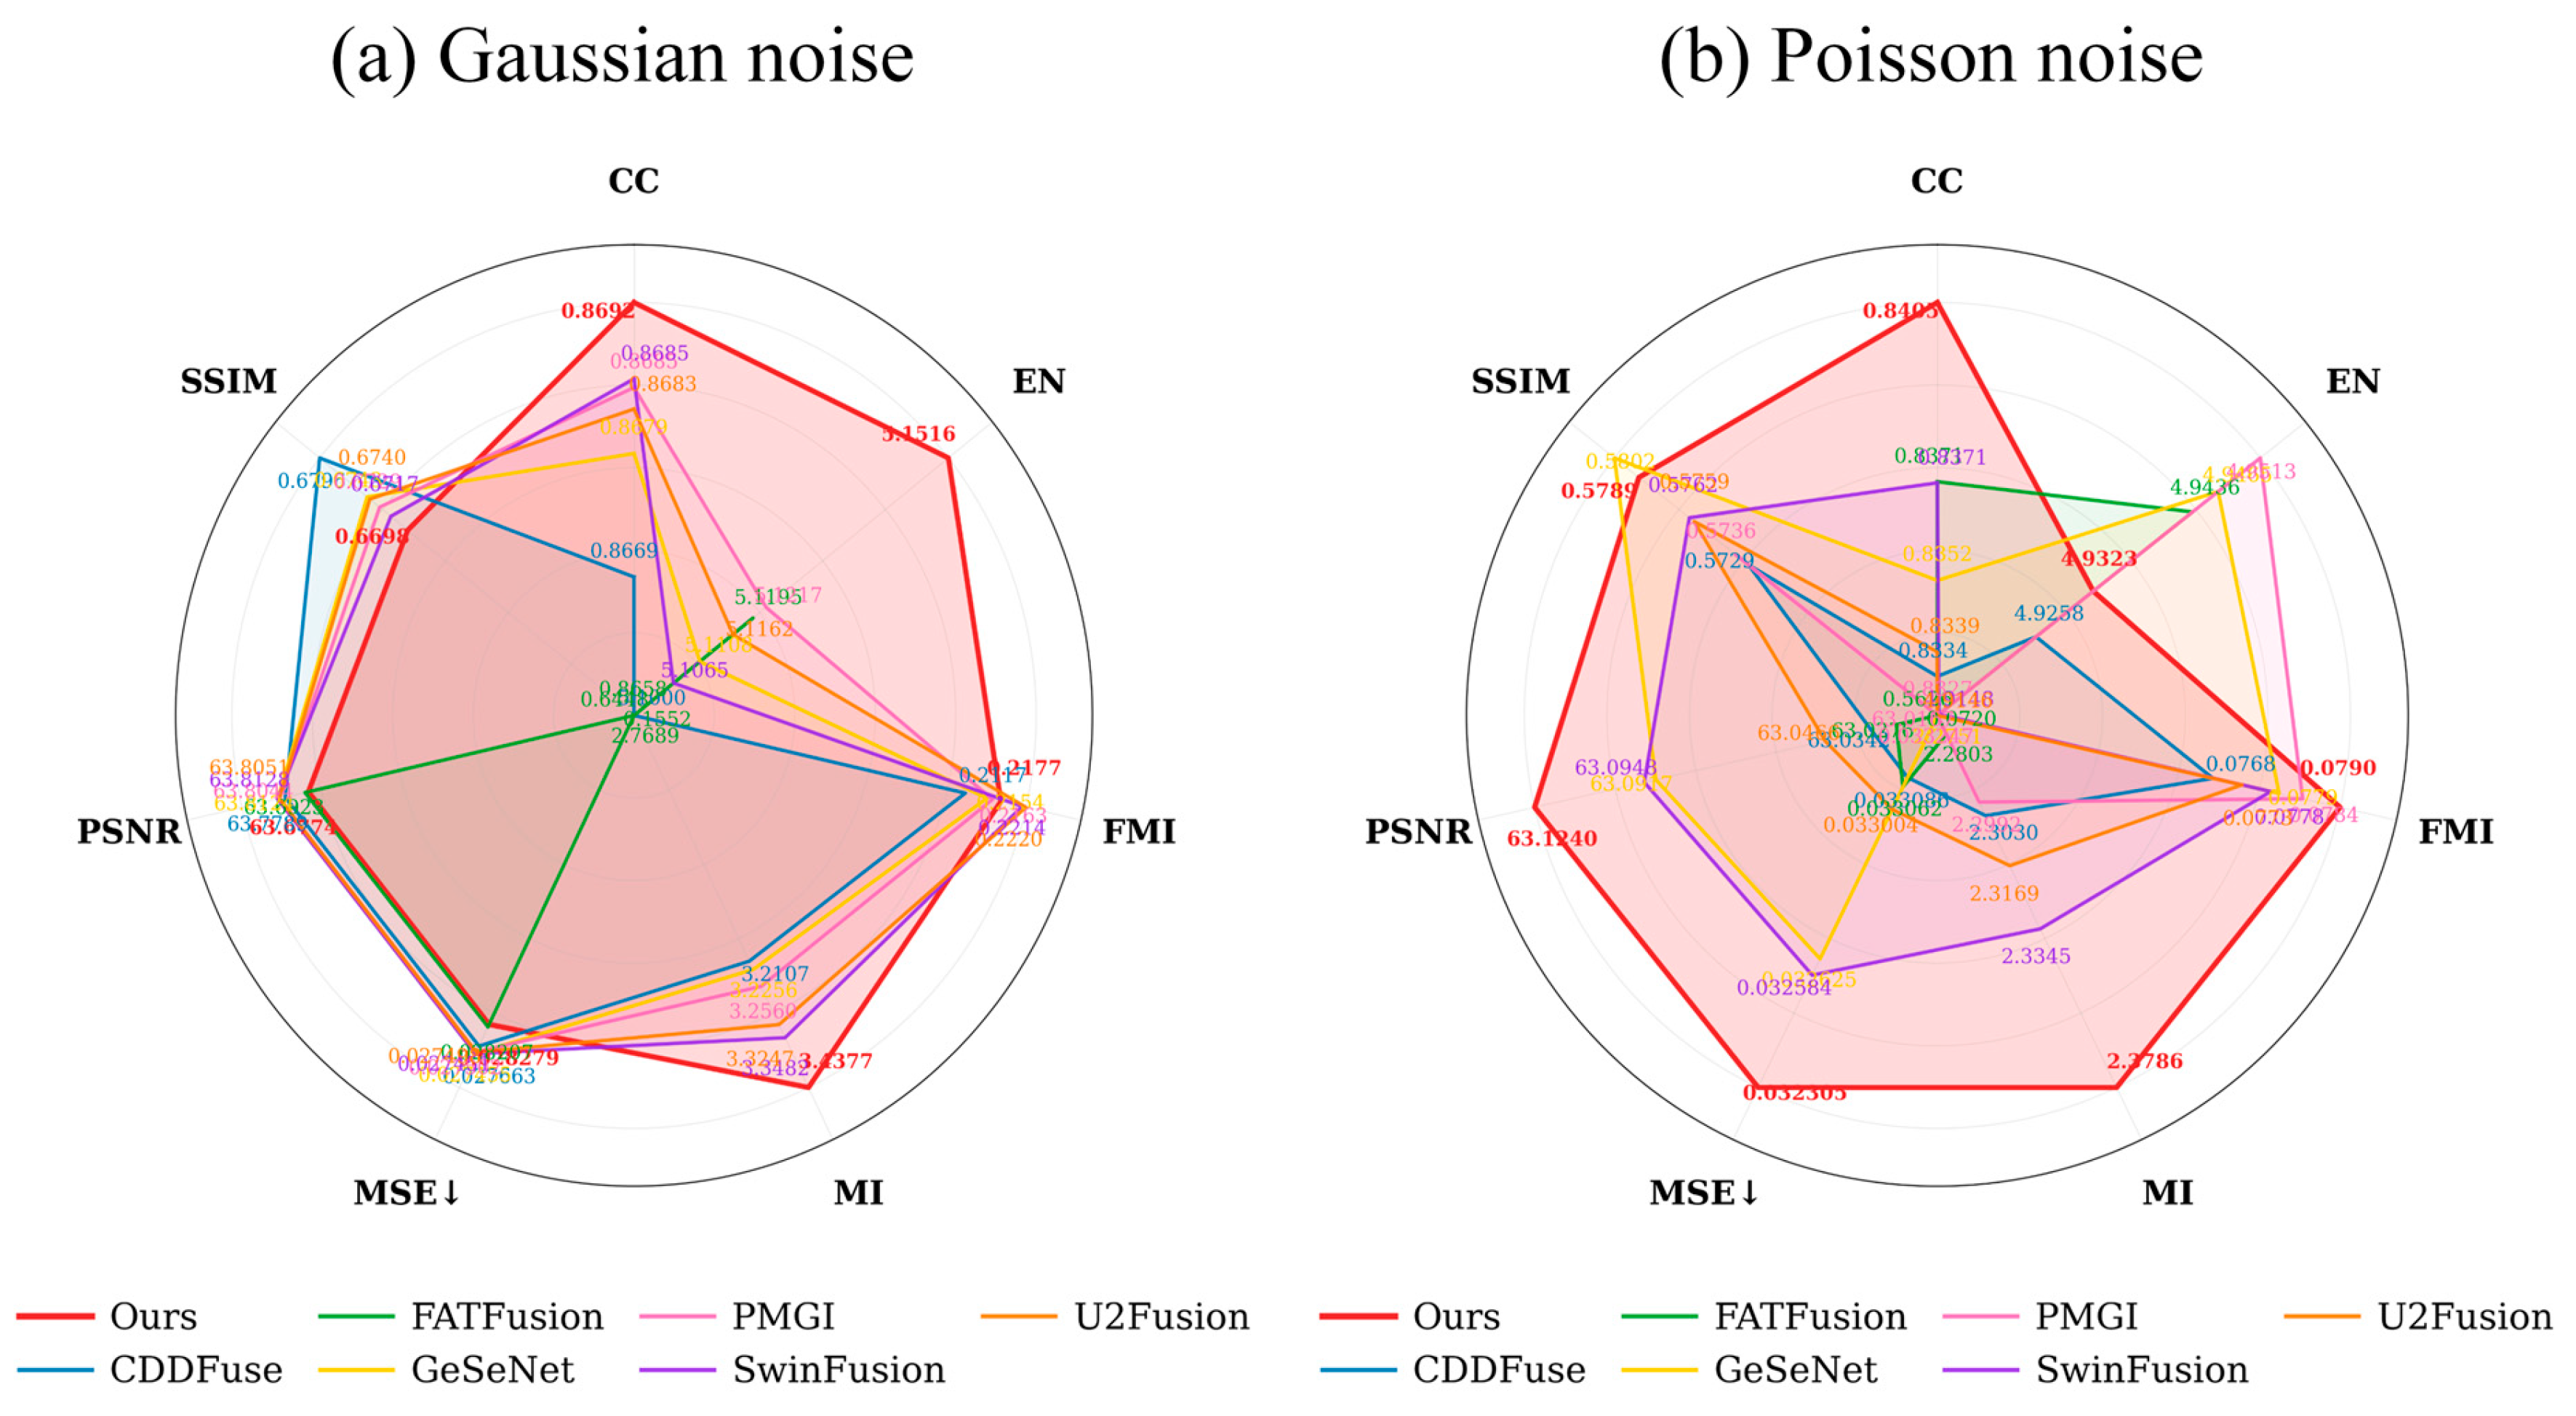
Experimental results on the MRI-PET dataset under noisy conditions (
Figure 8,
Table 9 and
Table 10) demonstrate that the proposed method exhibits robust resilience against interference. Quantitative metrics show that our method outperforms baseline algorithms across the majority of key evaluation criteria. Under Gaussian noise, our method achieves top-tier performance in MI (3.4377) and FMI (0.2177). The Multi-Scale Encoder extracts features through parallel branches with different receptive fields. This improves the model’s ability to preserve complementary multimodal information under noisy conditions. The low MSE of 0.0275 also indicates effective suppression of fusion errors. This benefit is supported by the DEA Block, whose channel, spatial, and pixel attention mechanisms reduce high-frequency noise while preserving fine textures. Under Poisson noise scenarios, the model maintains a high information entropy EN (4.9249) while realizing a significant improvement in CC (0.8339). This outstanding performance profoundly validates the efficacy of the PGA Block, which employs anatomical structure priors to constrain the injection of functional information, adaptively filtering random noise impulses. Consequently, it not only preserves rich image information but also markedly enhances the structural consistency and correlation of the fusion results.
4.7. Modality Degradation Experiment
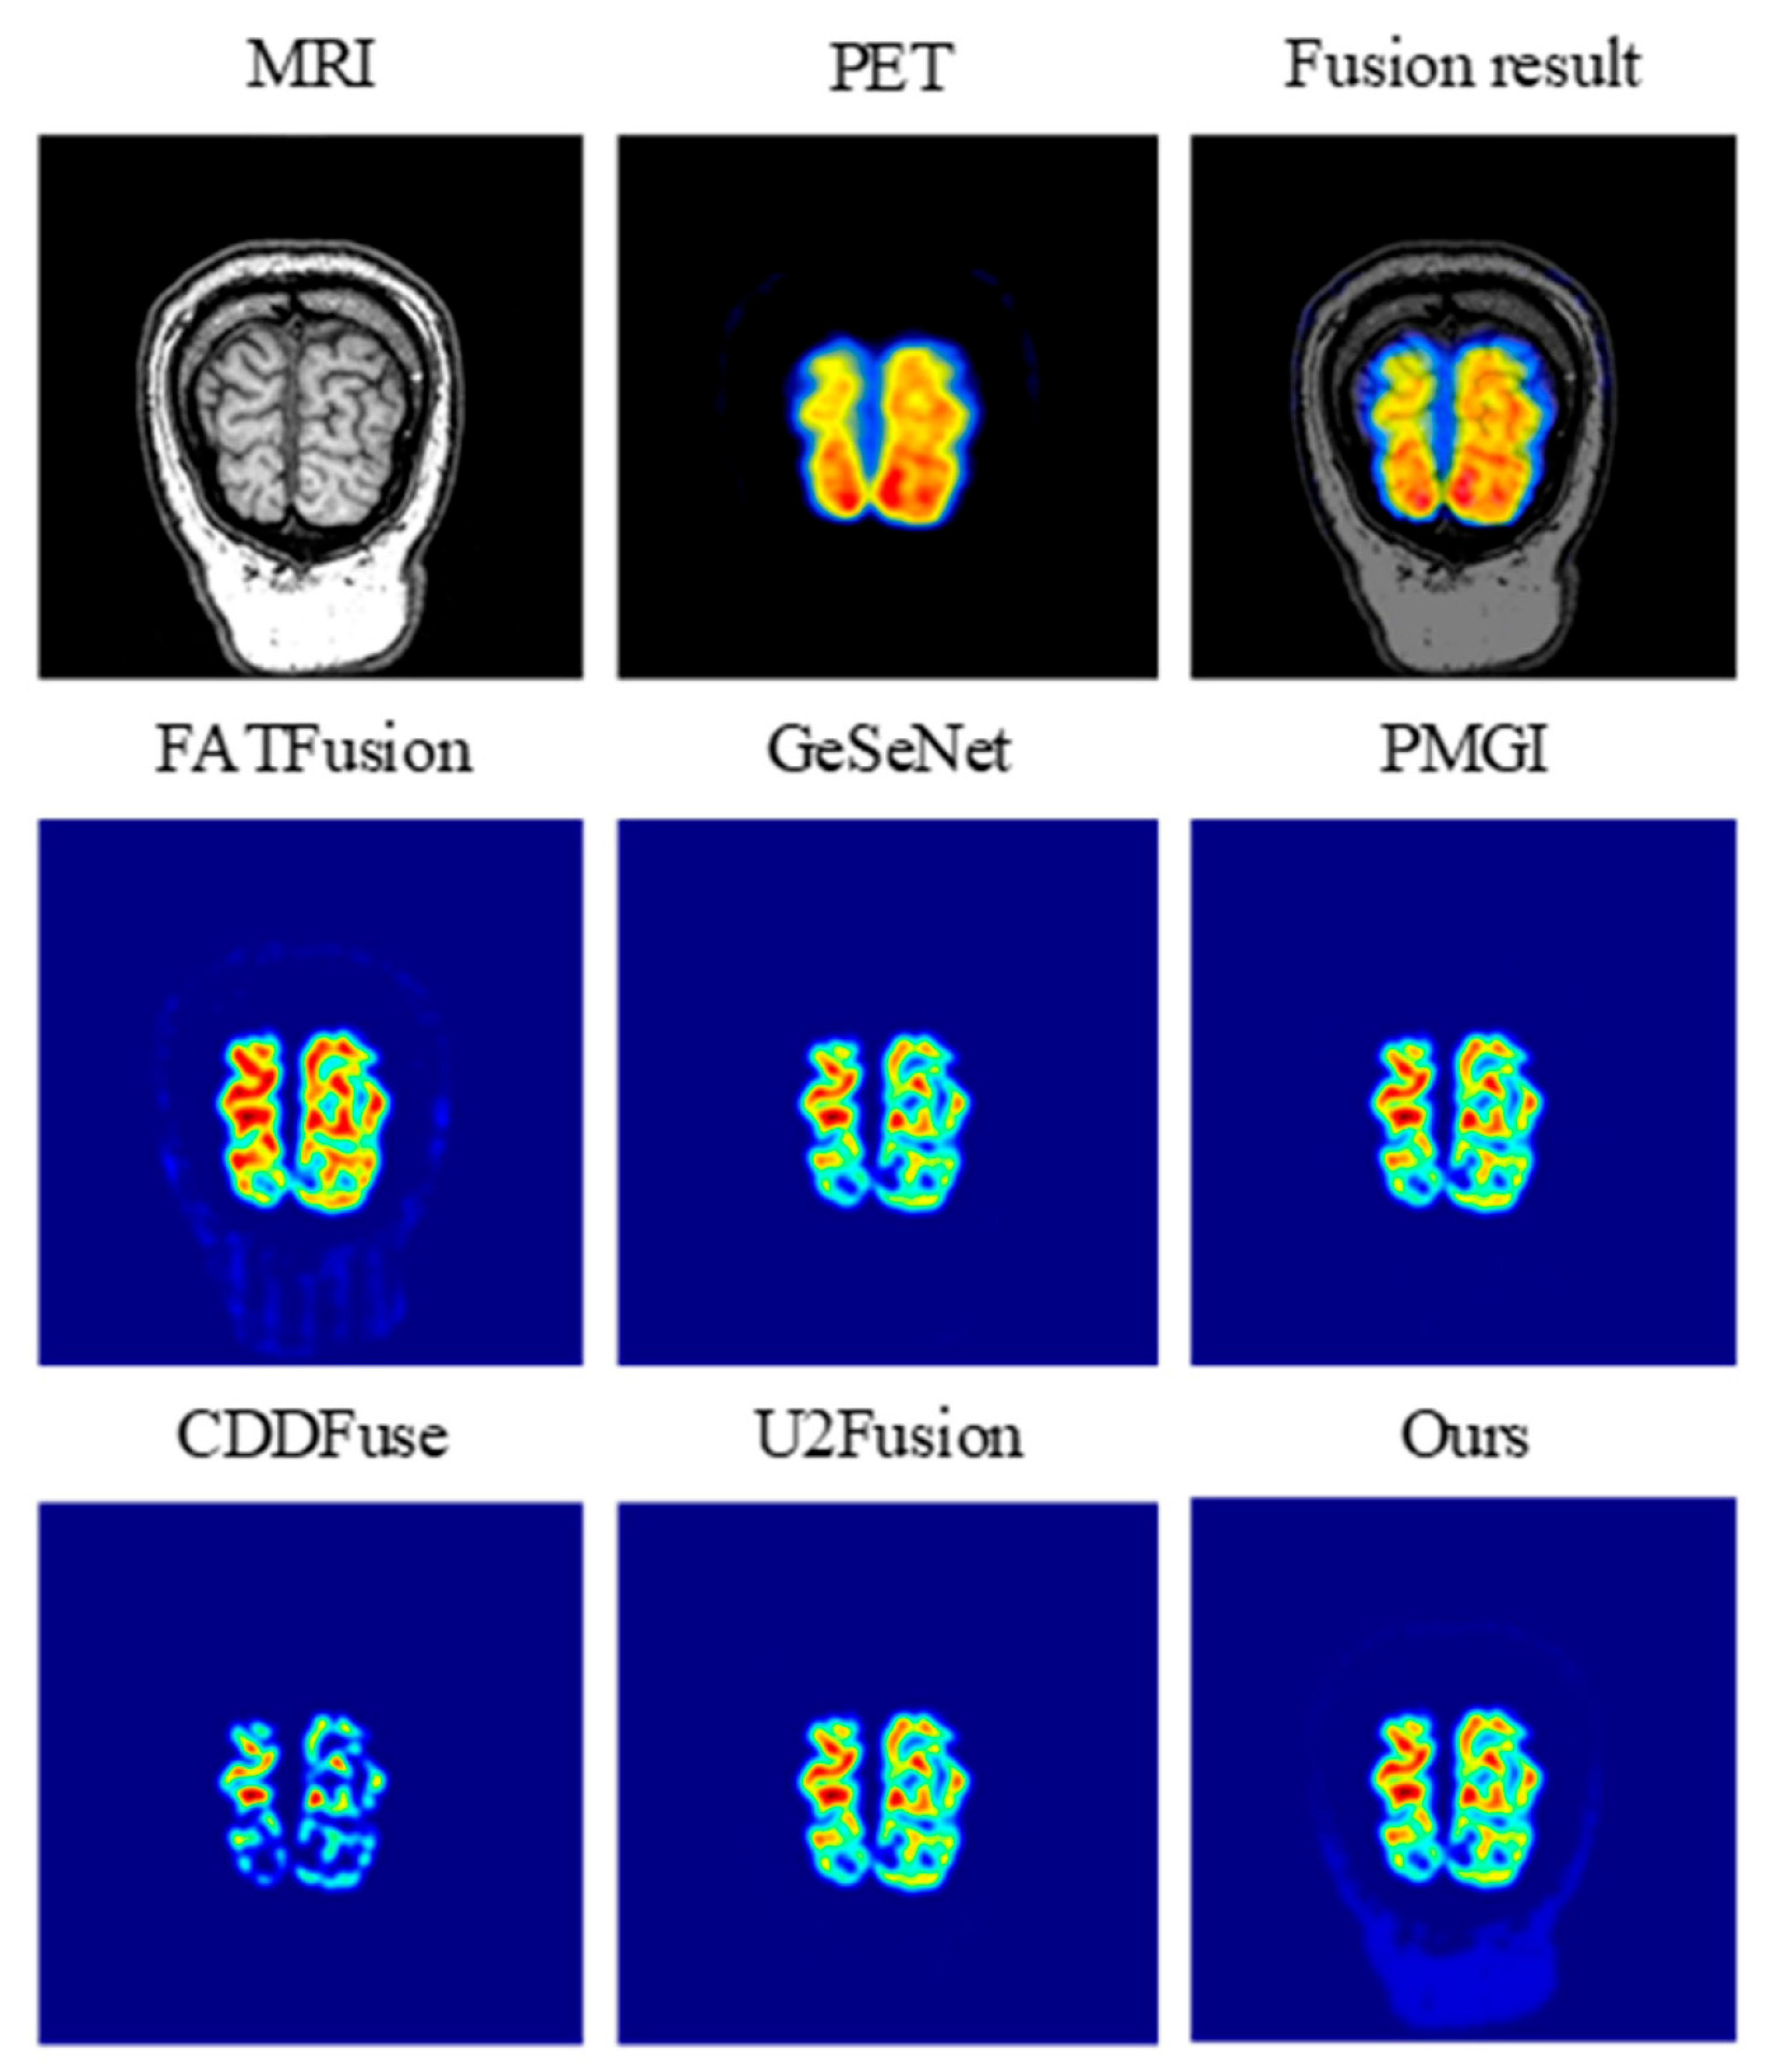
In scenarios of PET and MRI degradation, our method maintained significant advantages by adaptively adjusting fusion weights to suppress blocky artifacts and structural blurring. Visual analysis confirmed that TAPGFusion synergistically presents anatomical and functional information, delivering distinctly defined boundaries devoid of artifacts.
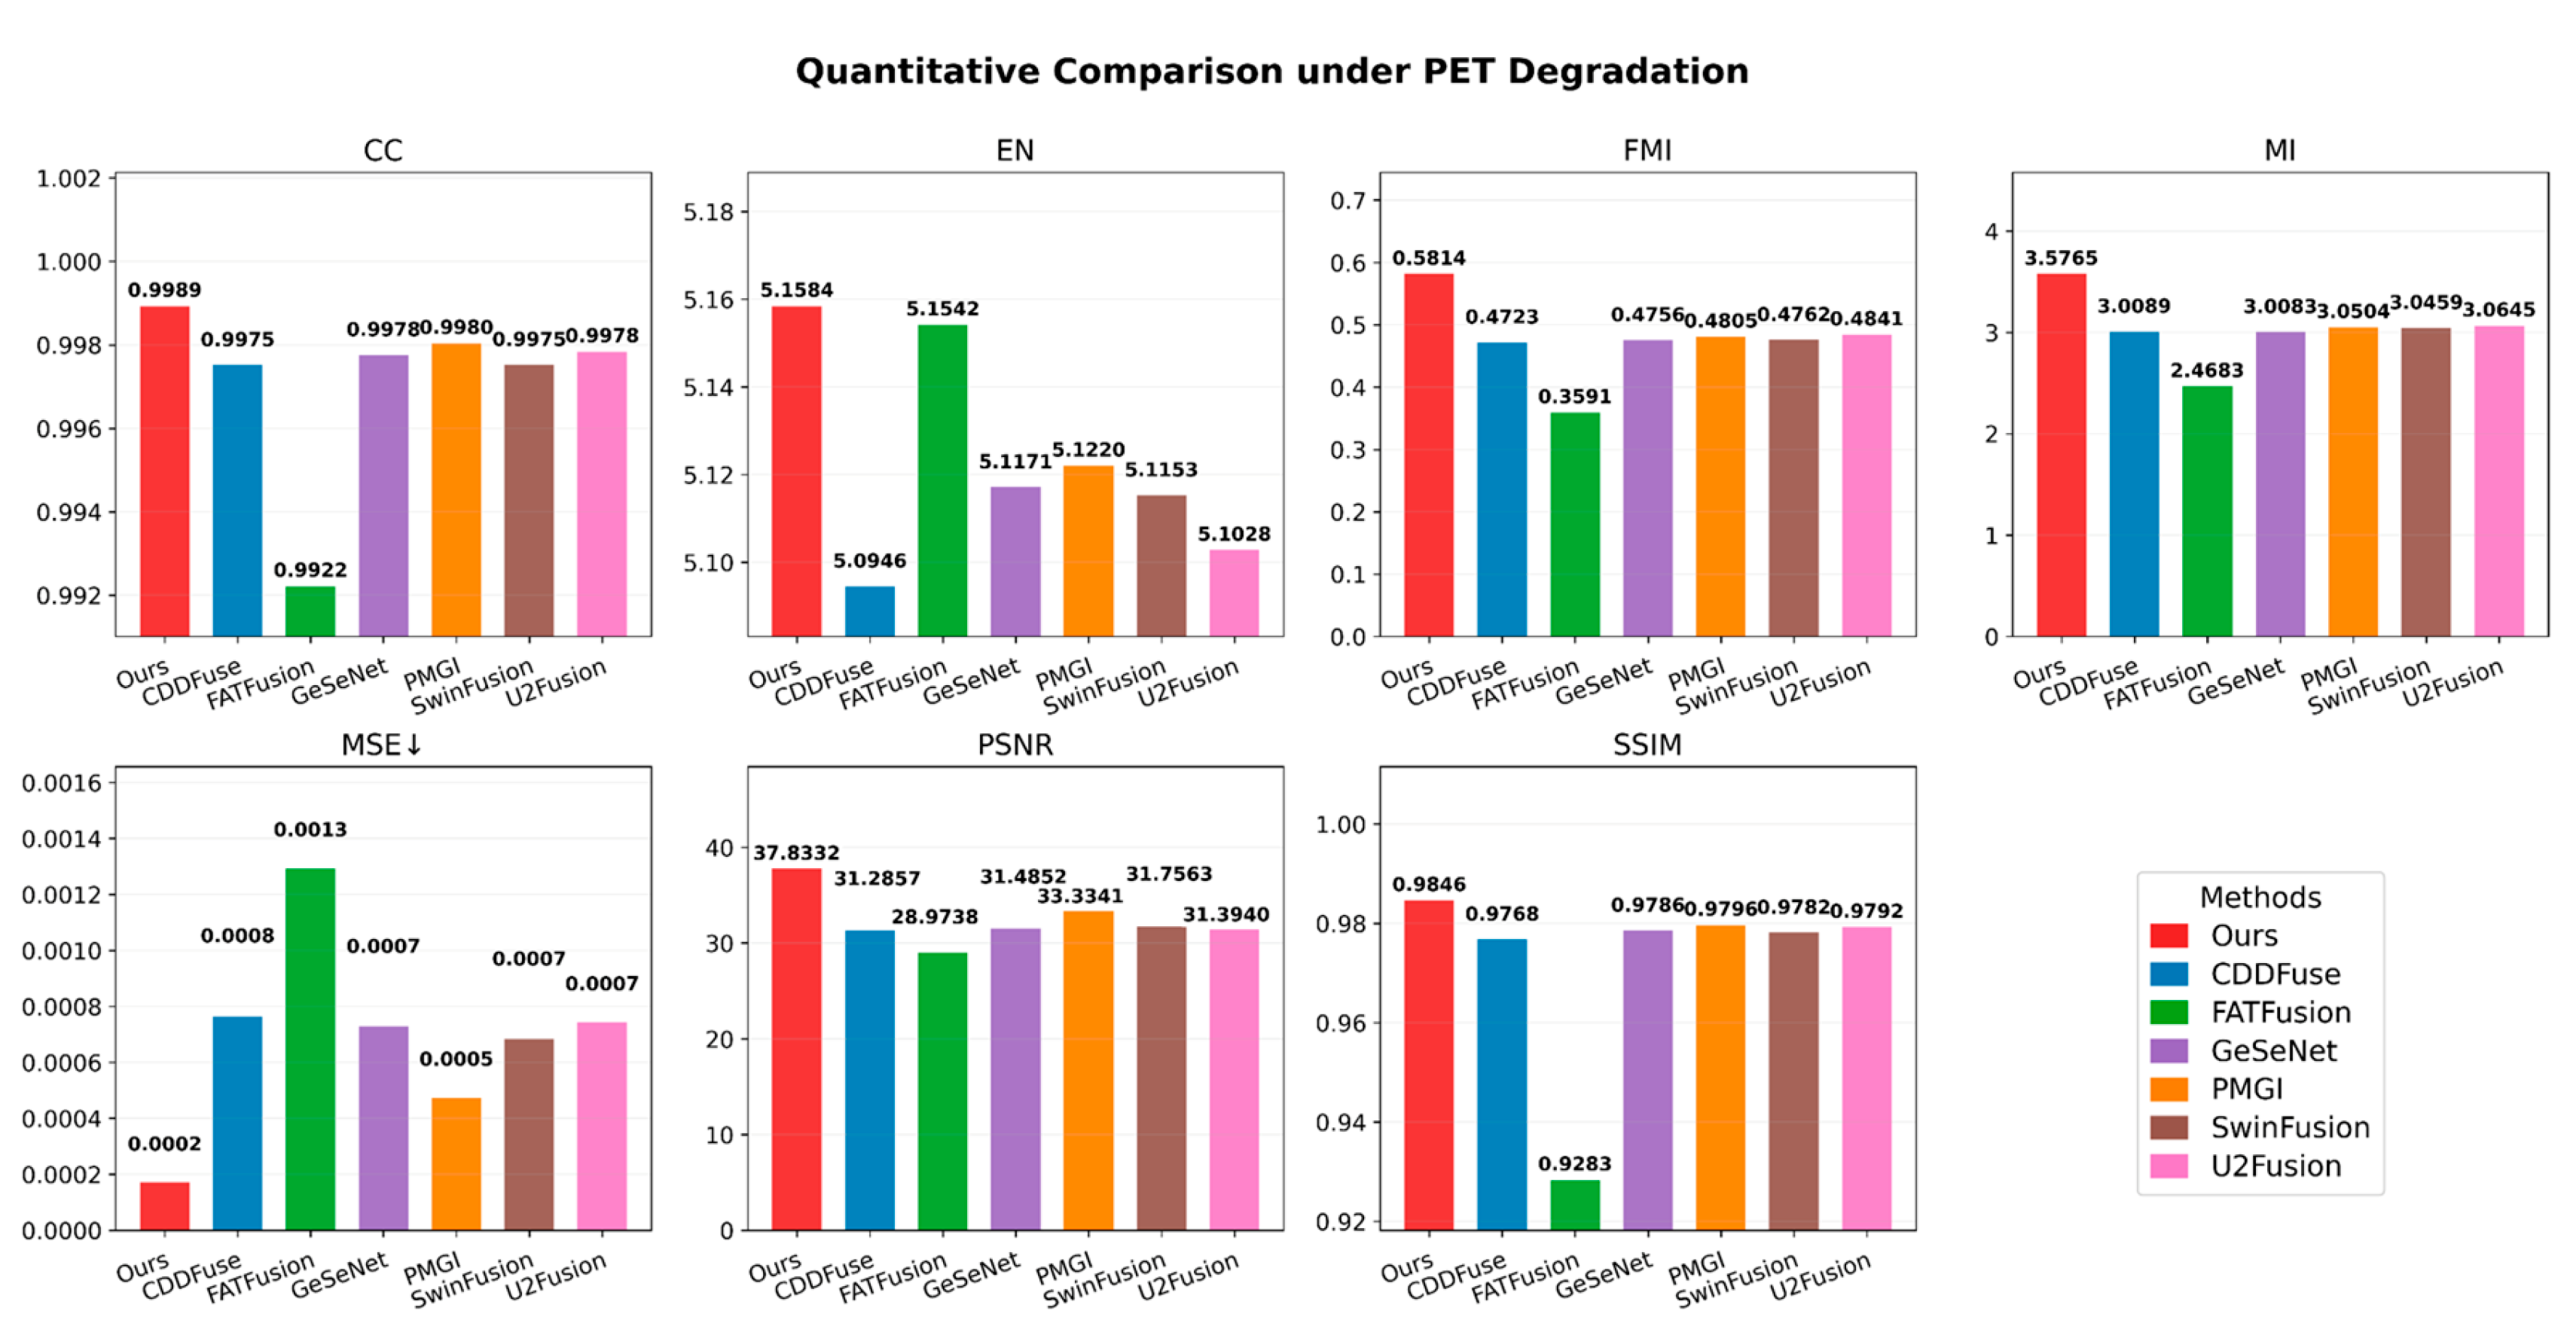
In the PET modality degradation experiments conducted on the MRI-PET dataset, quantitative results (
Figure 9) demonstrate that the proposed method achieves significant advantages across multiple critical metrics. The CC reaches 0.9989 and MSE drops to 0.0002, alongside an MI of 3.5765 and an EN of 5.1584. This indicates that the model effectively suppresses block artifacts and detail loss induced by degraded PET inputs, achieving high-precision structural reconstruction. The PGA Block improves robustness by adapting the fusion weights to differences in modality quality. When the PET image is degraded, the gating mechanism reduces the influence of unreliable PET features and relies more on the anatomical information from MRI. This helps maintain a high CC and a low MSE. Furthermore, it provides a stable feature foundation for cross-modal interaction, supporting elevated levels of information entropy and mutual information. The DEA Block further mitigates the information deficit caused by PET degradation by strengthening the transmission of MRI edge features, ultimately delivering high-quality fusion outputs even in modality-deficient scenarios.
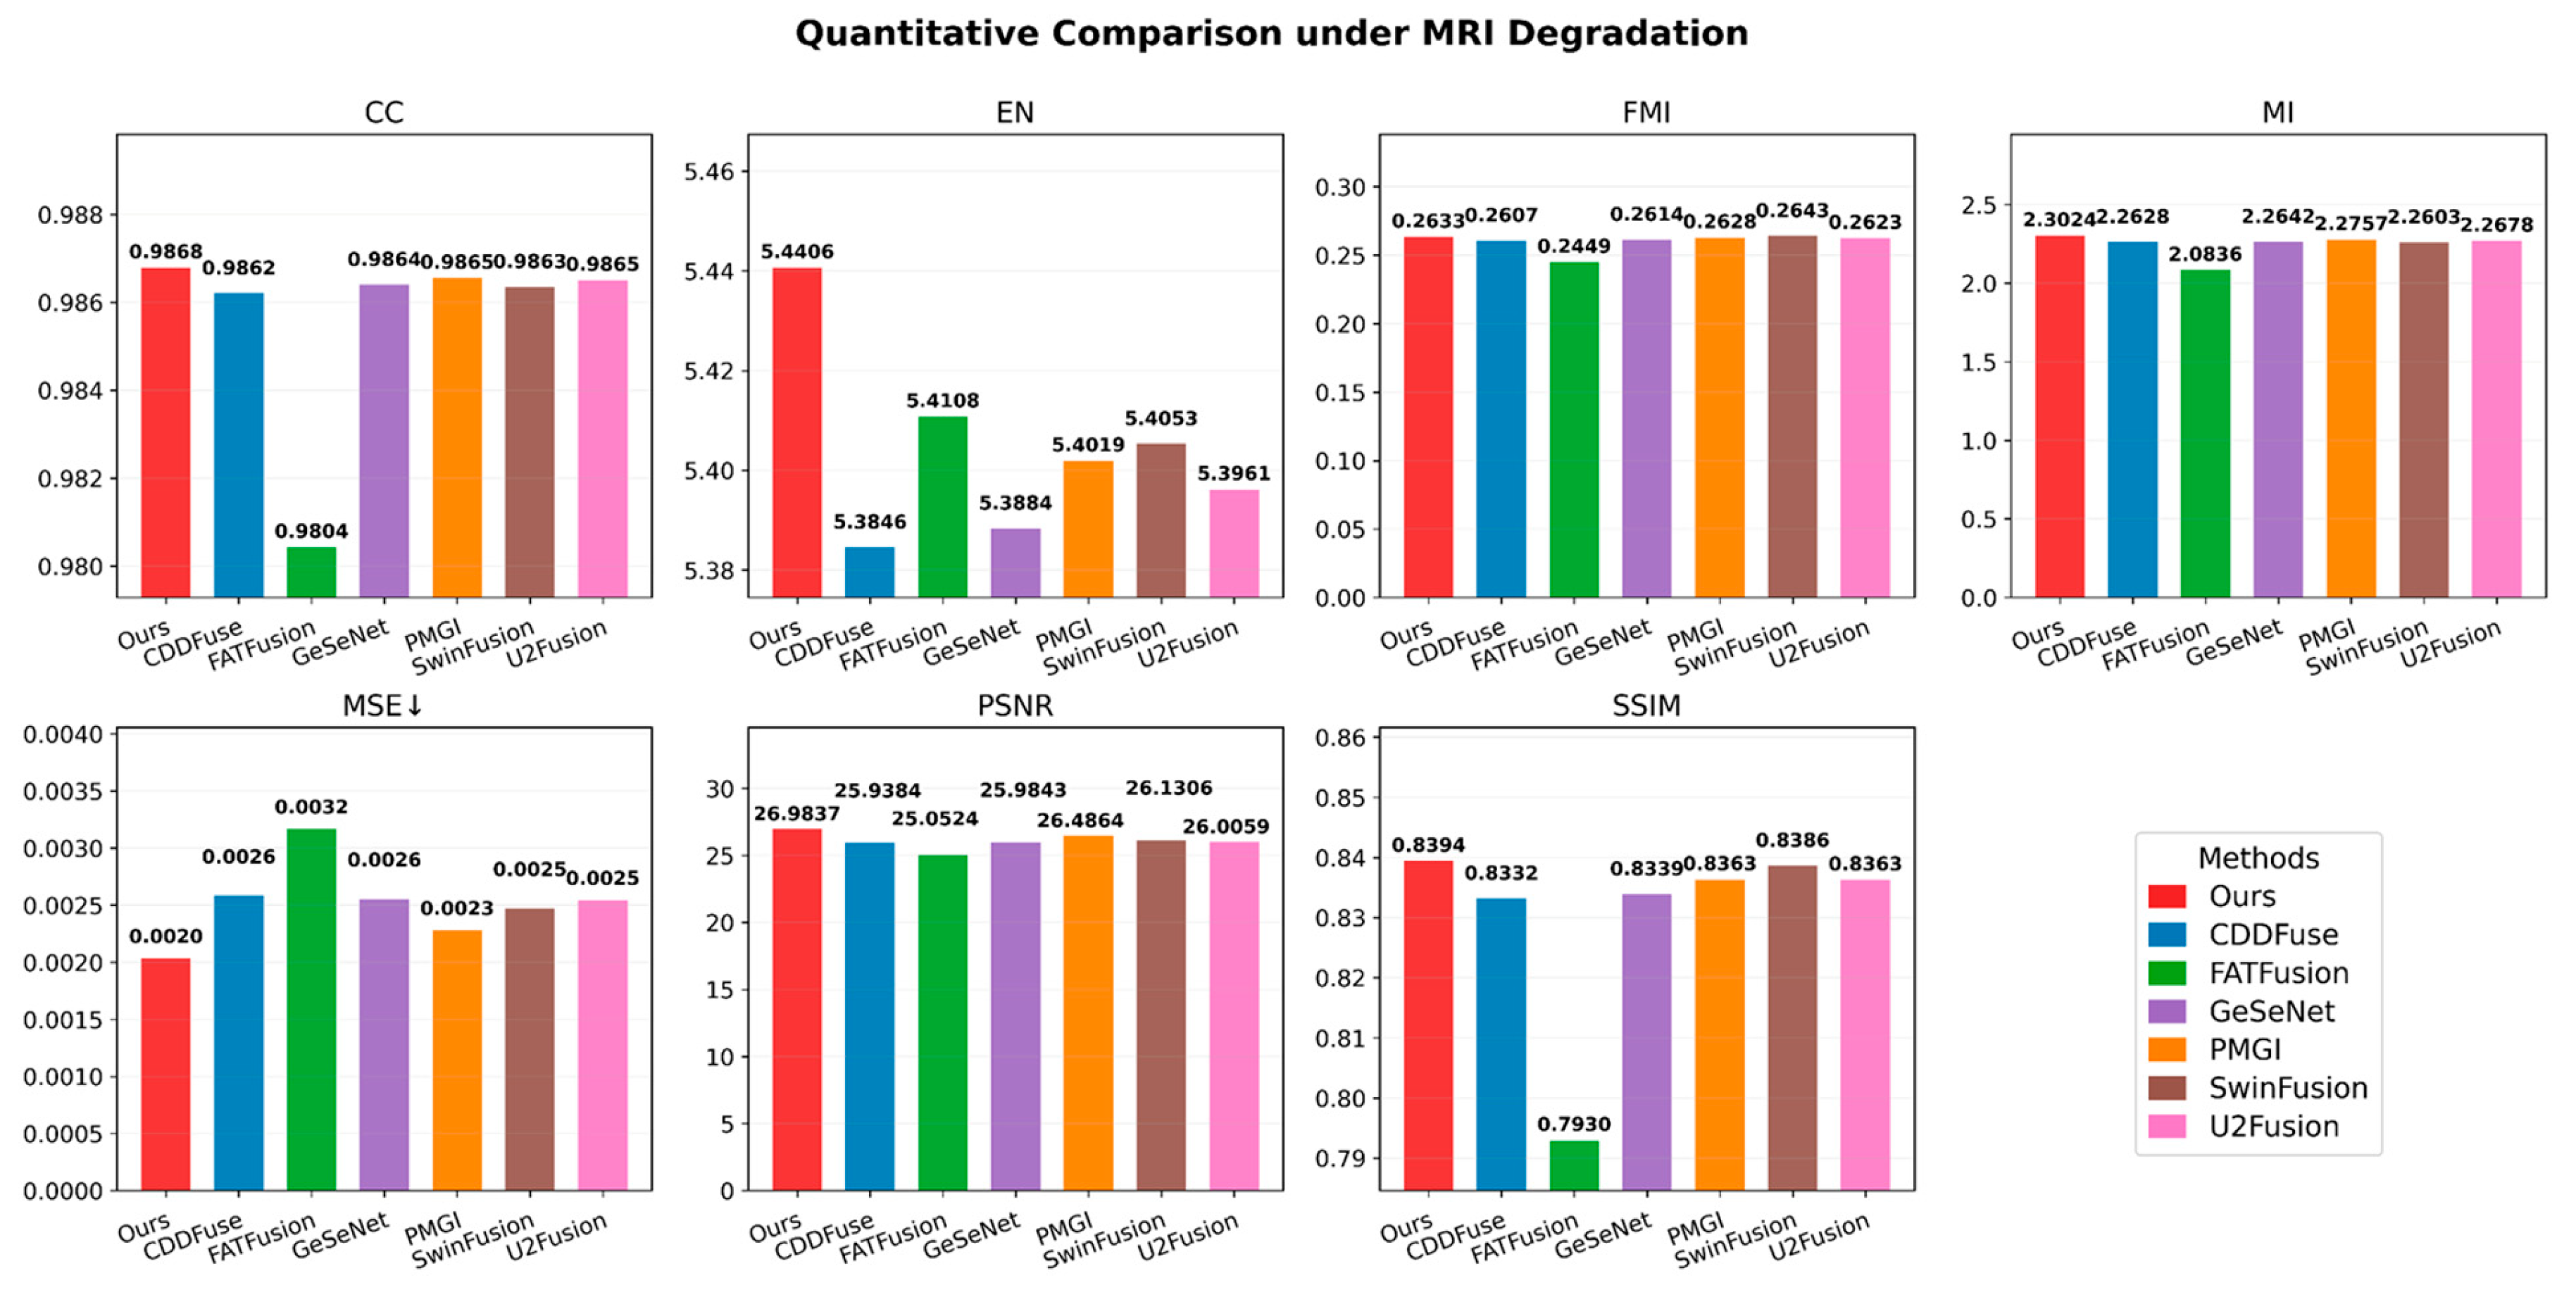
In the MRI modality degradation experiments (
Figure 10), quantitative outcomes show that the model achieves a CC of 0.9865, FMI of 0.2639, MI of 2.3024, PSNR of 26.9837, and SSIM of 0.8394, with the MSE reaching a low of 0.0020, significantly outperforming comparative methodologies. This demonstrates the model’s effectiveness in mitigating structural blurring and detail loss caused by MRI degradation, precisely preserving complementary multimodal information. The PGA Block senses the degradation in MRI quality and adaptively elevates the fusion weight of the functional PET modality, dodging structural interference from the compromised MRI to ensure high CC and low MSE. The Multi-Scale Encoder provides a stable base for cross-modal feature interactions, supporting high information entropy (EN = 5.4406) and mutual information. Meanwhile, the DEA Block bolsters the transmission of PET functional features alongside residual MRI edge features, bridging the anatomical information gap caused by MRI degradation and executing high-quality fusion despite missing modality data.