Article

Machine Learning-Based VO2 Estimation Using a Wearable Multiwavelength Photoplethysmography Device

1
Department of Biomedical Engineering, Texas A&M University, College Station, TX 77843, USA
2
School of Medicine, Texas A&M University, Bryan, TX 77807, USA
3
Center for Remote Health Technologies and Systems, Texas A&M Engineering Experiment Station, College Station, TX 77845, USA
4
Department of Electrical and Computer Engineering, Texas A&M University, College Station, TX 77843, USA
*
Author to whom correspondence should be addressed.
Biosensors 2025, 15(4), 208; https://doi.org/10.3390/bios15040208
Submission received: 11 February 2025 / Revised: 16 March 2025 / Accepted: 21 March 2025 / Published: 24 March 2025

Abstract

:
The rate of oxygen consumption, which is measured as the volume of oxygen consumed per mass per minute (VO2) mL/kg/min, is a critical metric for evaluating cardiovascular health, metabolic status, and respiratory function. Specifically, VO2 is a powerful prognostic predictor of survival in patients with heart failure (HF) because it provides an indirect assessment of a patient’s ability to increase cardiac output (CO). In addition, VO2 measurements, particularly VO2 max, are significant because they provide a reliable indicator of your cardiovascular fitness and aerobic endurance. However, traditional VO2 assessment requires bulky, breath-by-breath gas analysis systems, limiting frequent and continuous monitoring to specialized settings. This study presents a novel wrist-worn multiwavelength photoplethysmography (PPG) device and machine learning algorithm designed to estimate VO2 continuously. Unlike conventional wearables that rely on static formulas for VO2 max estimation, our algorithm leverages the data from the PPG wearable and uses the Beer–Lambert Law with inputs from five wavelengths (670 nm, 770 nm, 810 nm, 850 nm, and 950 nm), incorporating the isosbestic point at 810 nm to differentiate oxy- and deoxy-hemoglobin. A validation study was conducted with eight subjects using a modified Bruce protocol, comparing the PPG-based estimates to the gold-standard Parvo Medics gas analysis system. The results demonstrated a mean absolute error of 1.66 mL/kg/min and an R2 of 0.94. By providing precise, individualized VO2 estimates using direct tissue oxygenation data, this wearable solution offers significant clinical and practical advantages over traditional methods, making continuous and accurate cardiovascular assessment readily available beyond clinical environments.

1. Introduction

The rate of oxygen consumption (VO2) is a critical parameter in assessing cardiovascular, respiratory, and metabolic health [1,2,3,4]. It reflects the ability of the cardiopulmonary system to deliver oxygen and the body’s metabolic needs. It is widely used in evaluating exercise performance, monitoring chronic conditions, and diagnosing diseases such as heart failure and pulmonary disorders [5,6]. However, conventional methods for measuring VO2 require bulky and often expensive gas analysis systems, which limit their accessibility and practicality for routine use. This constraint has motivated researchers to explore alternative, non-invasive techniques for continuous VO2 monitoring.
The cardiovascular system consists of three main components: the heart, blood vessels, and blood [7]. As depicted in Figure 1a, the system operates as a closed-loop model. Re-oxygenated blood enters the left atrium from the lungs and flows into the left ventricle, from where it is pumped through the aorta to deliver oxygen via major arteries to various parts of the body. For example, blood flows through the radial artery to the capillaries in the left arm, then returns via the radial vein to the subclavian vein, then to the superior cava, ultimately reaching the right atrium and continuing to the lungs via the pulmonary artery for reoxygenation.
During this process, the fractional inspired oxygen (FiO2) represents the oxygen concentration in inhaled air, typically around 21% in room air [8], while end-tidal oxygen (EtO2) reflects the oxygen concentration in exhaled air. The arterial oxygen saturation (SaO2) indicates the oxygen content in arterial blood, and the venous oxygen saturation (SvO2) measures the oxygen content in venous blood. VO2 represents the difference in oxygen content before and after tissue delivery, providing a critical metric for cardiopulmonary delivery and metabolic activity [9].
Photoplethysmography (PPG) is a non-invasive optical method that measures blood volume changes within tissue, offering insights into cardiovascular dynamics. It is commonly used to measure physiological parameters such as heart rate, oxygen saturation (SpO2), and blood pressure [10,11,12]. As shown in Figure 1b, the PPG signal consists of an alternating current (AC) component, reflecting pulsatile changes caused by cardiac cycles that capture dynamic features such as heart rate and arterial compliance [13]. It also includes a quasi-direct current (DC) component, which represents baseline tissue and blood volume changes and holds untapped potential for analyzing slower occurring changes, such as cardiac output (low cardiac output will depress O2 content of this DC component). Most studies focus on the AC component for extracting cardiovascular metrics [14,15,16], utilizing its amplitude and periodicity to estimate metrics such as heart rate, blood pressure, stress levels, and beat-to-beat intervals [17,18,19,20,21,22]. However, the DC signal reflects the venous blood flow, diastolic portion of the arterial flow, tissue content, and tissue optical properties, providing information about overall blood perfusion. Thus, we focused on the quasi-DC portion of the PPG waveform to explore its relationship with VO2 in the forearm’s tissue, blood, and muscle, as shown in Figure 1b.
The traditional assessment of oxygen consumption (VO2) primarily relies on indirect calorimetry using metabolic carts, which measure the volume and concentration of inhaled and exhaled gases (primarily oxygen and carbon dioxide) breath-by-breath during physical exertion [23]. These systems are considered the gold standard because of high accuracy but have significant limitations. Metabolic carts are typically bulky, costly, and require controlled laboratory settings, trained personnel, and calibration before each measurement, which restricts their utility for continuous, real-world monitoring [24,25]. Furthermore, invasive approaches, such as the direct Fick method, involve arterial and venous catheterization to measure arterial-venous oxygen differences, presenting risks associated with invasive procedures, patient discomfort, and potential complications, thereby limiting their routine clinical applicability [26]. These drawbacks emphasize the need for alternative, non-invasive methods capable of continuous, real-time VO2 monitoring in various settings, motivating the development of innovative wearable technologies such as the multiwavelength PPG device proposed in this study.
In this study, we developed and tested a novel approach to estimate VO2 using a wrist-worn PPG device equipped with a multi-wavelength sensor [27]. By leveraging the Beer–Lambert law and analyzing the DC component of PPG signals using a novel machine learning model, we aimed to uncover insights into the static optical properties of the tissue, which correlate with metabolic activity and oxygen utilization. This expands the utility of PPG beyond conventional AC-based measurements to provide a deeper understanding of tissue-level oxygen dynamics. This will overcome the limitations of current measurement systems by addressing the need for compact, accessible, and continuous VO2 monitoring systems and will contribute to the growing field of wearable health technologies, with implications for personalized healthcare and chronic disease management.

2. Materials and Methods

Our wearable device includes a multi-spectral photoplethysmography (PPG) sensor [27] to measure VO2 non-invasively. By leveraging five wavelengths of light (670 nm, 770 nm, 810 nm, 850 nm, and 950 nm), including an isosbestic point at 810 nm, to enhance sensitivity to hemoglobin dynamics, this advanced sensor captures detailed optical signals on the palmar side of the arm, and uses the Beer–Lambert Law to enable differentiation between oxy-hemoglobin and deoxy-hemoglobin.

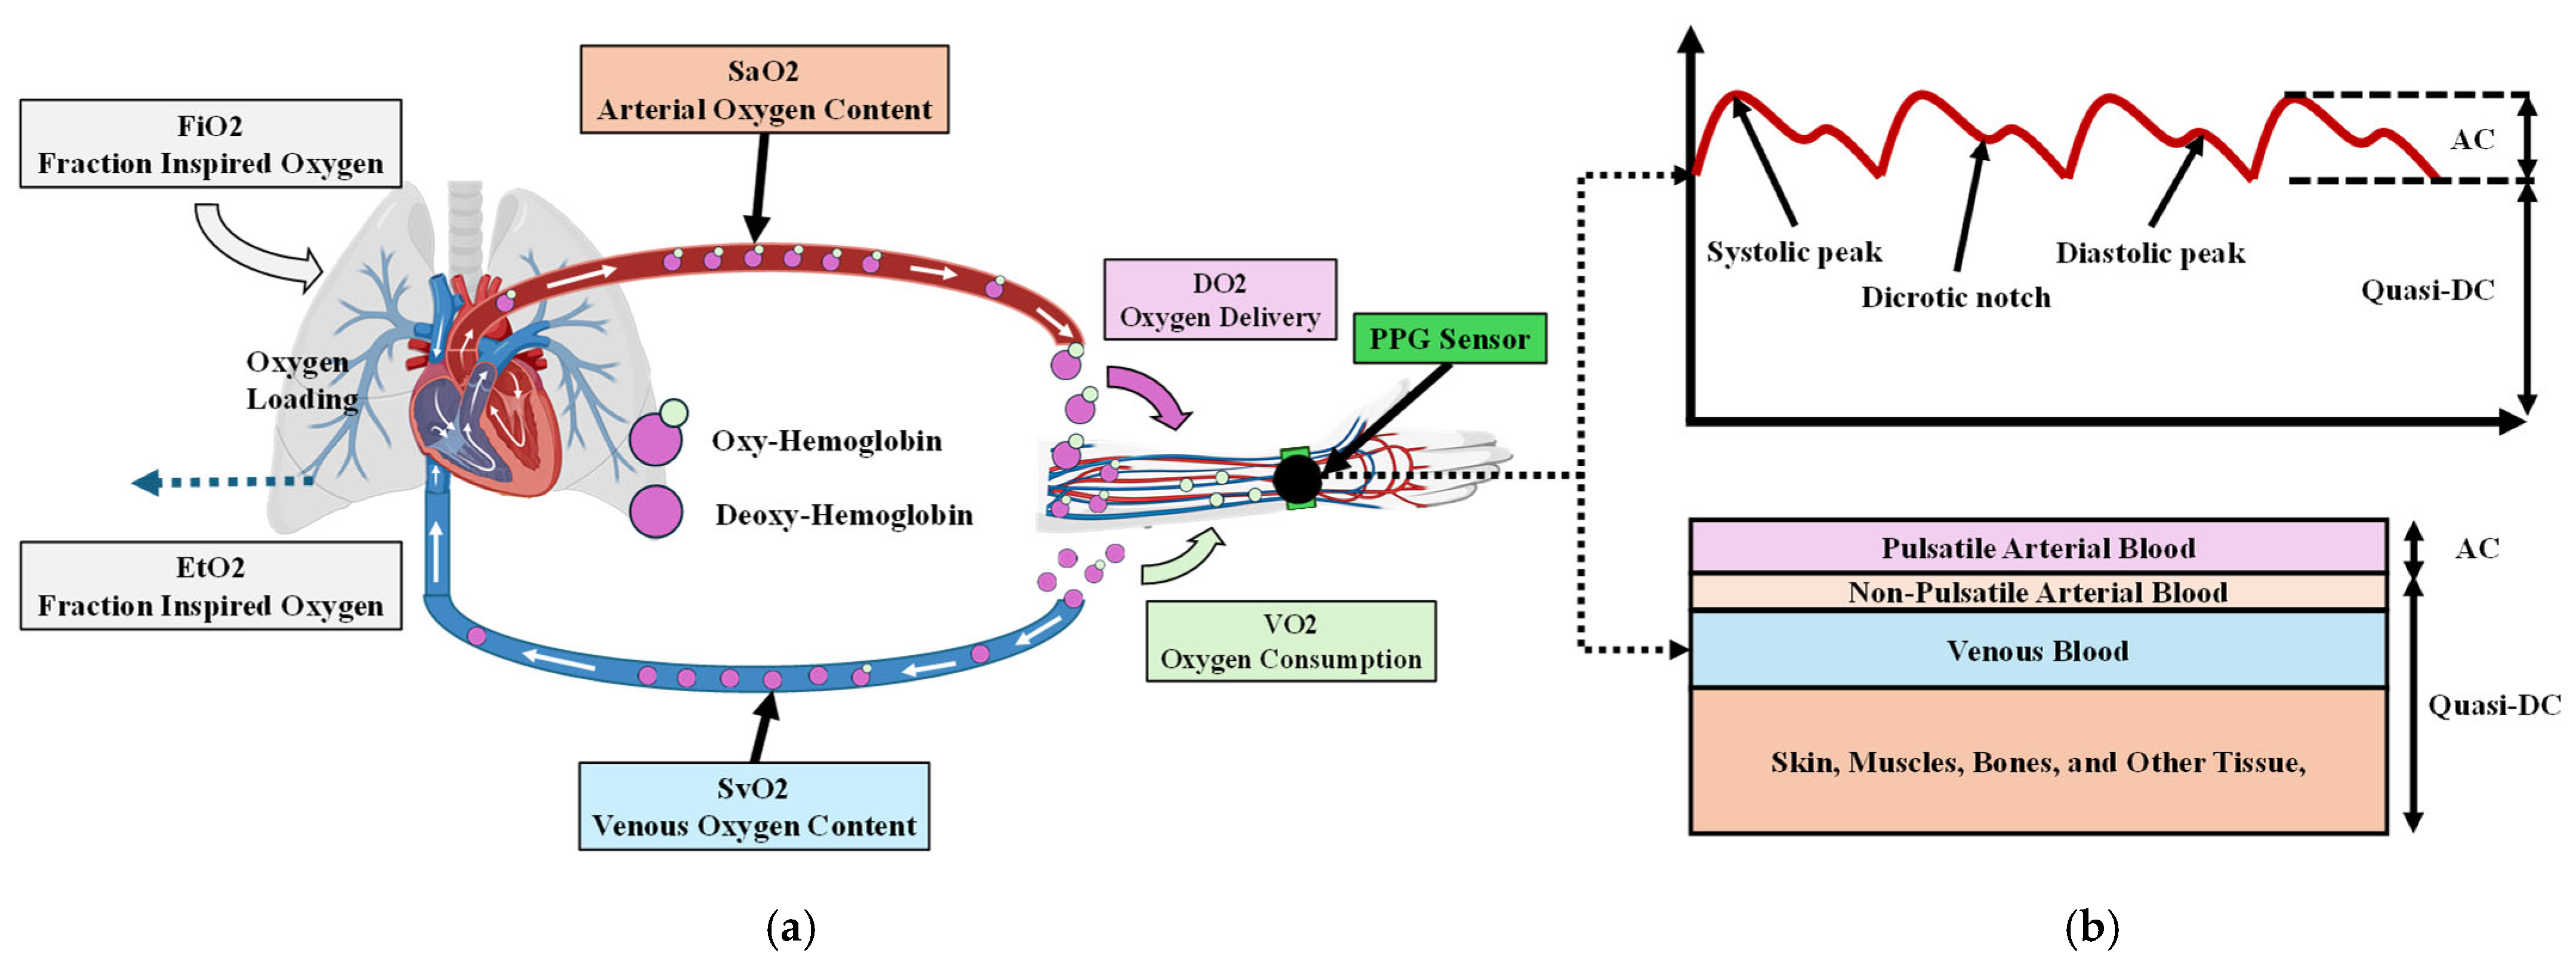
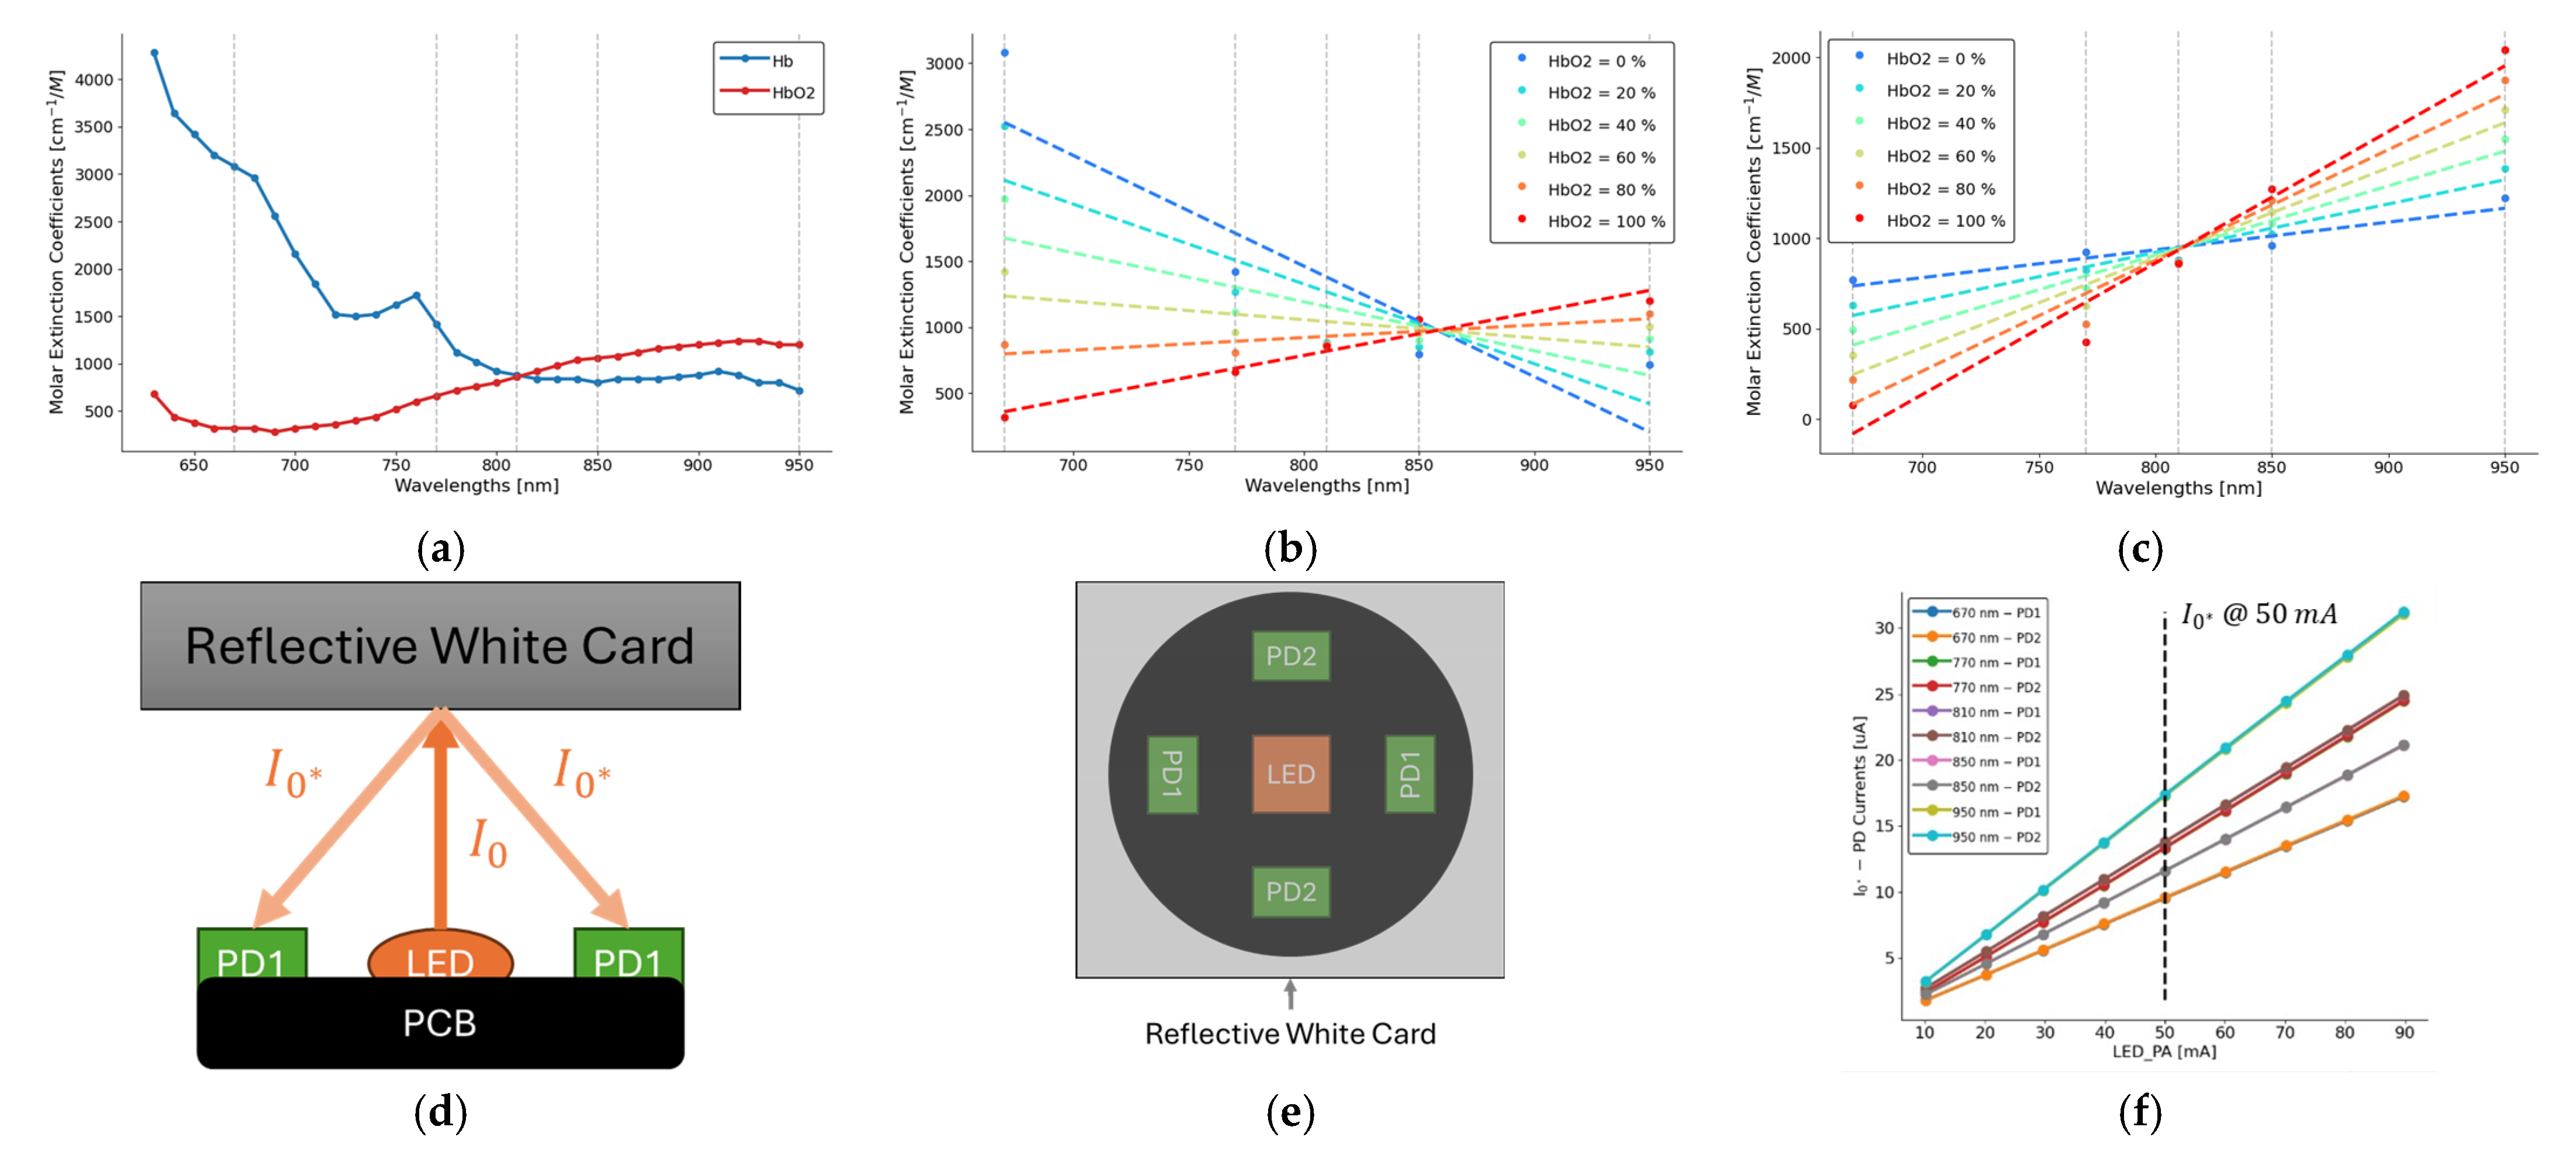
2.1. Beer–Lambert Law

The Beer–Lambert law is a fundamental principle in optical absorption spectroscopy, relating the attenuation of light to the properties of the material through which the light passes [28]. Mathematically, it expresses the relationship between the molar extinction coefficient (ε), the concentration (C), and the path length (l) as follows [28]:
I = I 0 × e ε c l
In this equation, I represents the transmitted light and I 0 represents the incident light. We applied the Beer–Lambert law using the extinction coefficients of oxy-hemoglobin (HbO2) and deoxy-hemoglobin (Hb) [29], at five distinct wavelengths (670 nm, 770 nm, 810 nm, 850 nm, and 950 nm), as shown in Figure 2a. The following describes the relationship between light attenuation and the concentrations of HbO2 and Hb [28]:
I λ = I 0 ( λ ) × e [ ε H b λ C H b + ε H b O 2 λ C H b O 2 ] l ( λ )
Figure 2b illustrates the interpolation of four points (20%, 40%, 60%, 80%) between 0% oxygenation (Hb) and 100% oxygenation (HbO2) in the blood. By performing a linear regression on these six oxygenation levels for the extinction coefficients across the five wavelengths, we observe changes in the slope of the fitted lines as oxygenation decreases. This observation underpins our approach to correlating the slope of these lines with oxygen consumption (VO2).
Figure 2c highlights the isosbestic point of Hb and HbO2 extinction coefficients at 810 nm. To standardize the analysis, we scale the extinction coefficients to align their intercept points by multiplying by a factor, α ( λ ) , as follows [28]:
I λ = I 0 ( λ ) × e [ ε H b λ C H b + ε H b O 2 λ C H b O 2 ] l ( λ ) × α ( λ )
The absorbance ( A H b ( λ ) ) of the hemoglobin (Hb and HbO2) is defined in Equation (4). This adjustment ensures consistency across the wavelengths and enhances the reliability of the calculated correlations with VO2.
A Hb ( λ ) = ln ( I λ I 0 λ ) = [ ε H b λ C H b + ε H b O 2 λ C H b O 2 ] l λ ) × α ( λ )
To measure the incident light I 0 , we developed a simple setup with a reflective white card, as shown in Figure 2d. The reflective light was transmitted to all 4 photodiodes as shown in Figure 2e. In this study, we combined photodiodes input horizontally (PD1) and vertically (PD2) into one signal. During the measurement process, we adjusted the LED pulse amplitude/intensity from 10 mA to 90 mA. The response in photodiode currents I 0 * is shown in Figure 2f. Each wavelength has 2 response curves from PD1 and PD2. In this study, we used 50 mA for all wavelengths during the entire data collection process. Assuming I 0 I 0 * and l λ is linear [30], the Beer–Lambert law provides a robust framework for leveraging multi-wavelength optical data to quantify oxygenation dynamics and to estimate oxygen consumption.

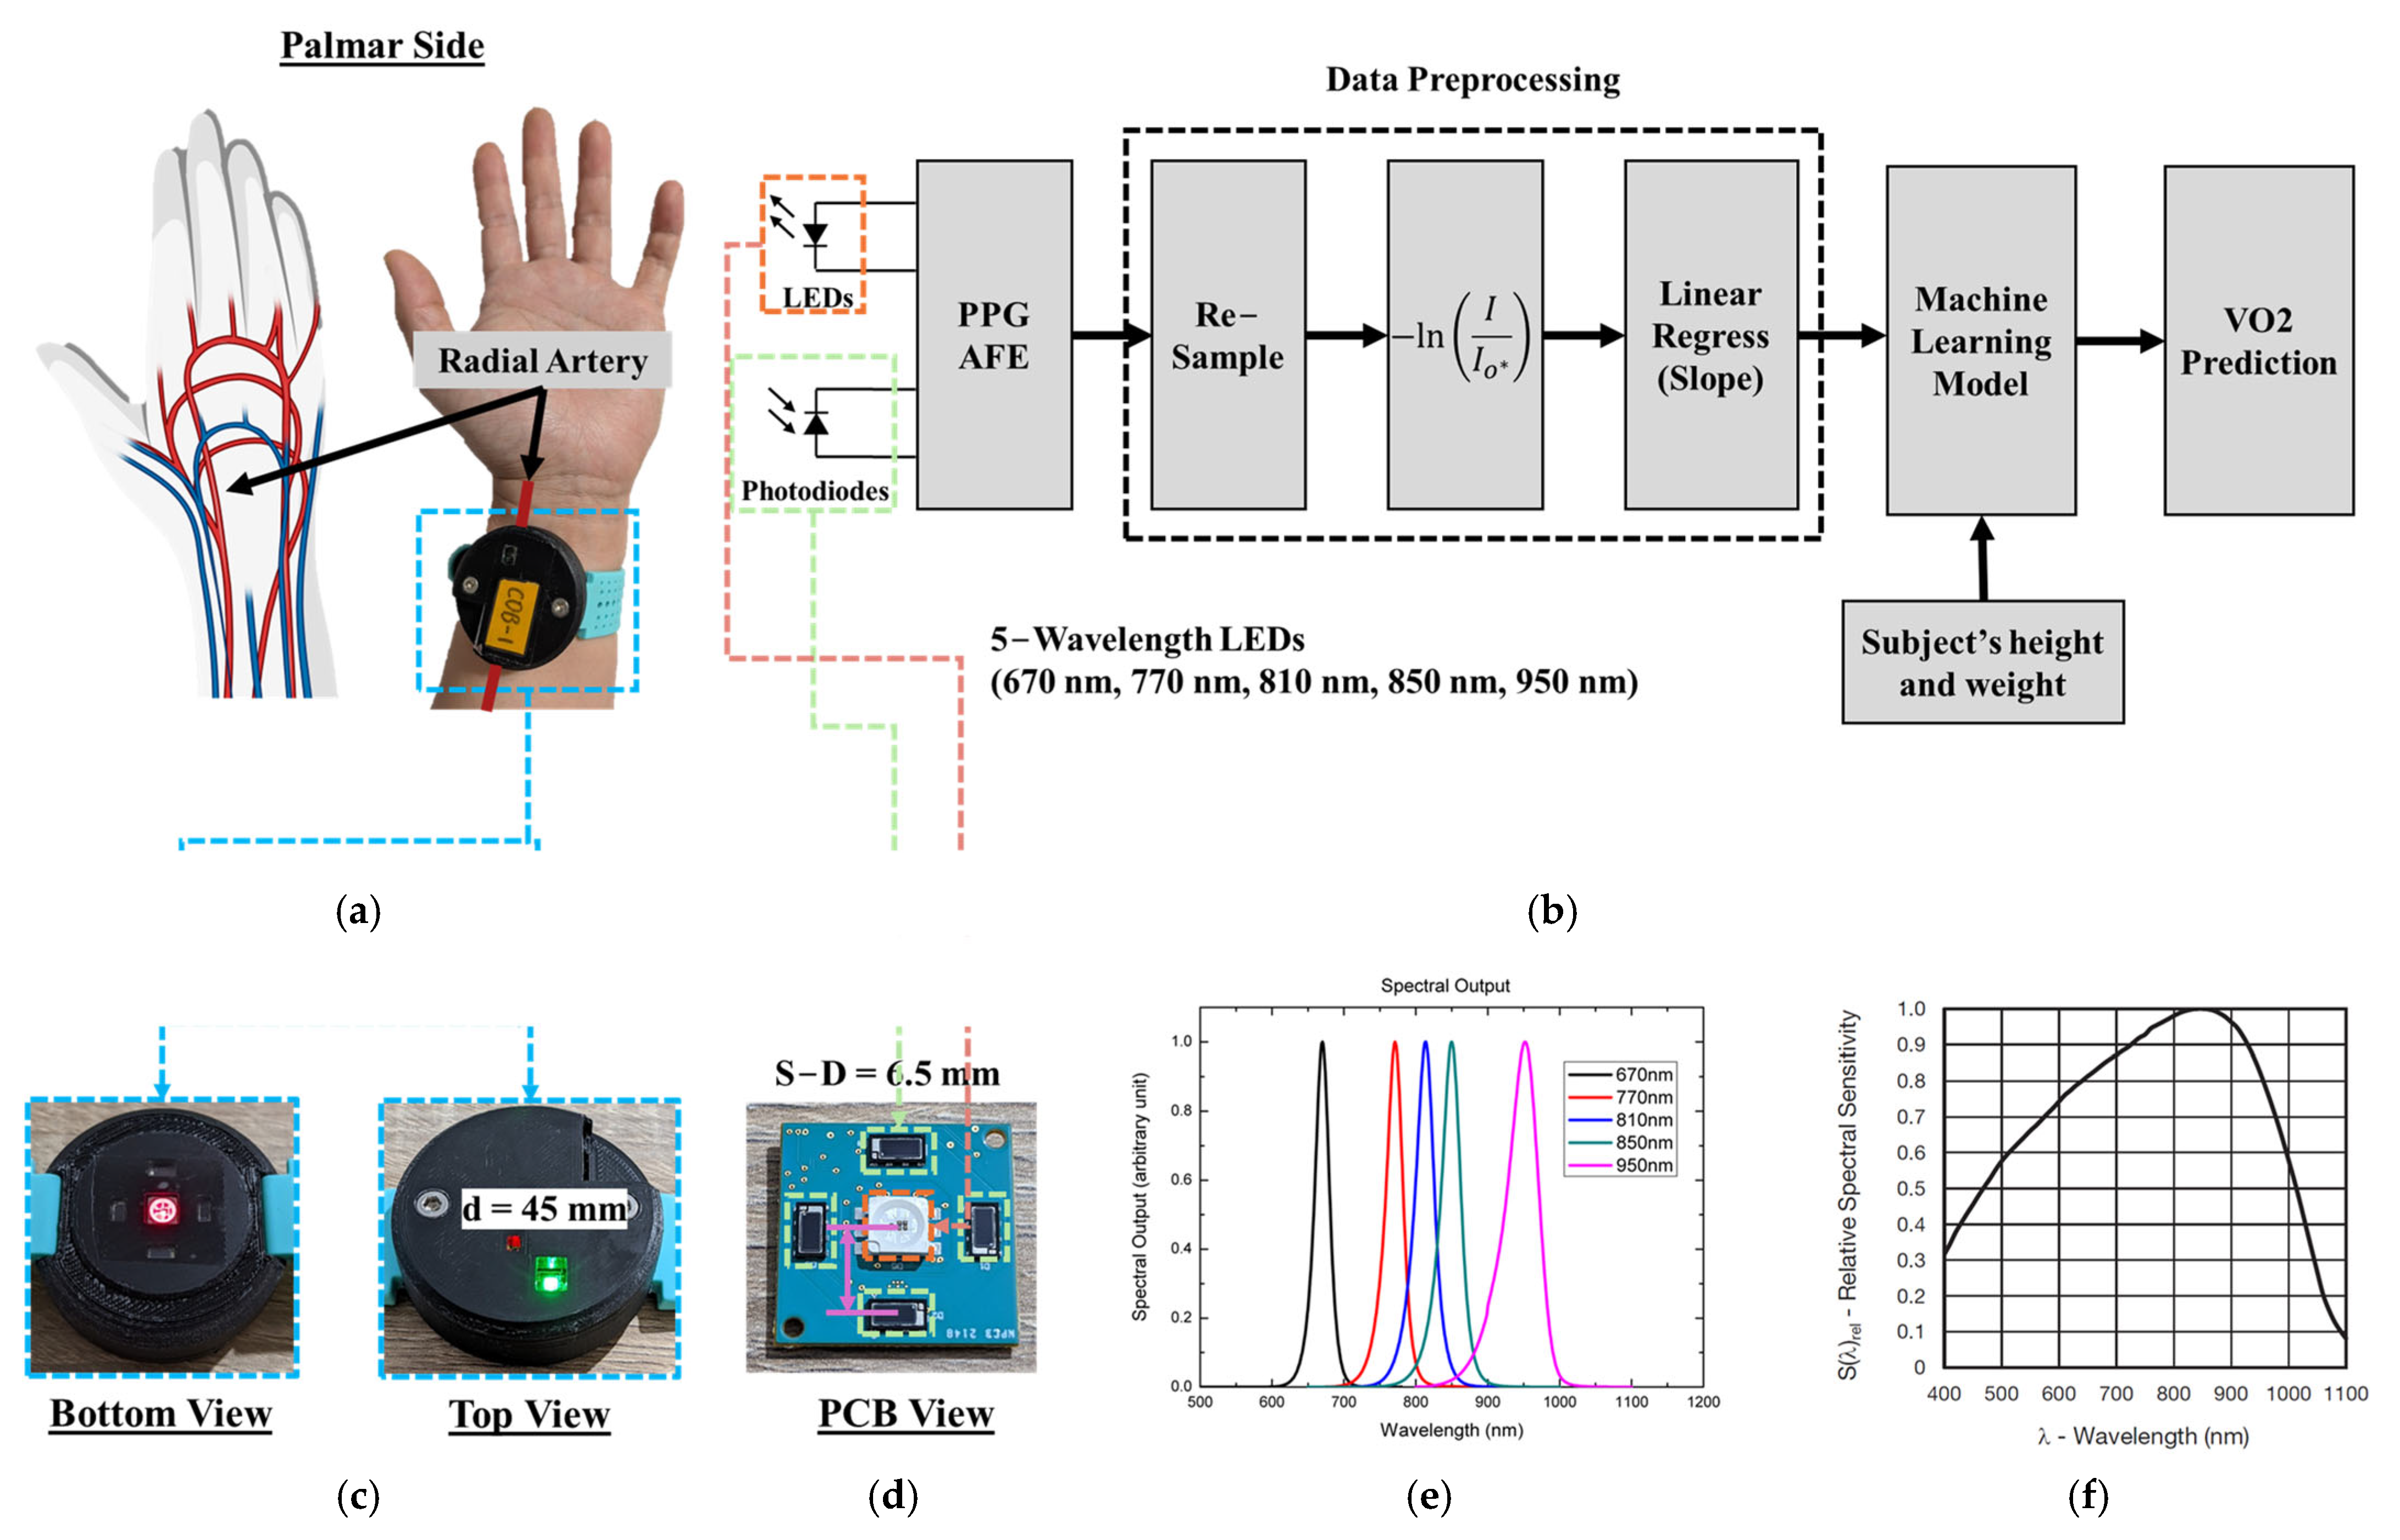
2.2. PPG Sensor System

The PPG sensor system was designed as a wrist-worn device targeting the radial artery, as described in a prior study [27]. The palmar side of the wrist was selected as the sensing location instead of the dorsal side due to the presence of major arteries and veins in the palmar region. Specifically, this study targeted the region of the radial artery and radial vein, as illustrated in Figure 3a.
Figure 3b depicts the signal processing chain, starting with the acquisition of PPG waveforms via the analog front-end (AFE). The initial sampling rate was set to 100 Hz but was down sampled to 0.1 Hz to focus on the quasi-DC components of the PPG signal, which changed more gradually compared to heart rate fluctuations. Using the photodiode current values I 0 * obtained from the lookup table in Figure 2f, the hemoglobin absorbance A H b λ was calculated. Linear regression of A H b λ was performed to compute the slope every 10 s for photodiodes PD1 and PD2, yielding slope values m 1 and m 2 , respectively.
Consequently, these slope values ( m 1 and m 2 ), combined with anthropometric measurements (height and weight) of the subjects, were used to train a random forest machine learning model. The model was developed to predict VO2 values using the metabolic measurement system (TrueOne 2400, Parvo Medics, Salt Lake City, UT, USA) as the reference.
The mechanical design of the device features a diameter of 45 mm, as shown in Figure 3c. The printed circuit board (PCB) incorporates a source-to-detector distance of 6.5 mm, as illustrated in Figure 3d. A multichip LED (MTMD6788594SMT6, Marktech Optoelectronics, Latham, NY, USA) was selected for this study. This LED integrates five wavelengths (670, 770, 810, 850, and 950 nm) within a single IC package, with its spectral output shown in Figure 3e [31]. The photodiode (VEMD8080, Vishay, Malvern, PA, USA) used in this device has its sensitivity profile displayed in Figure 3f [32].

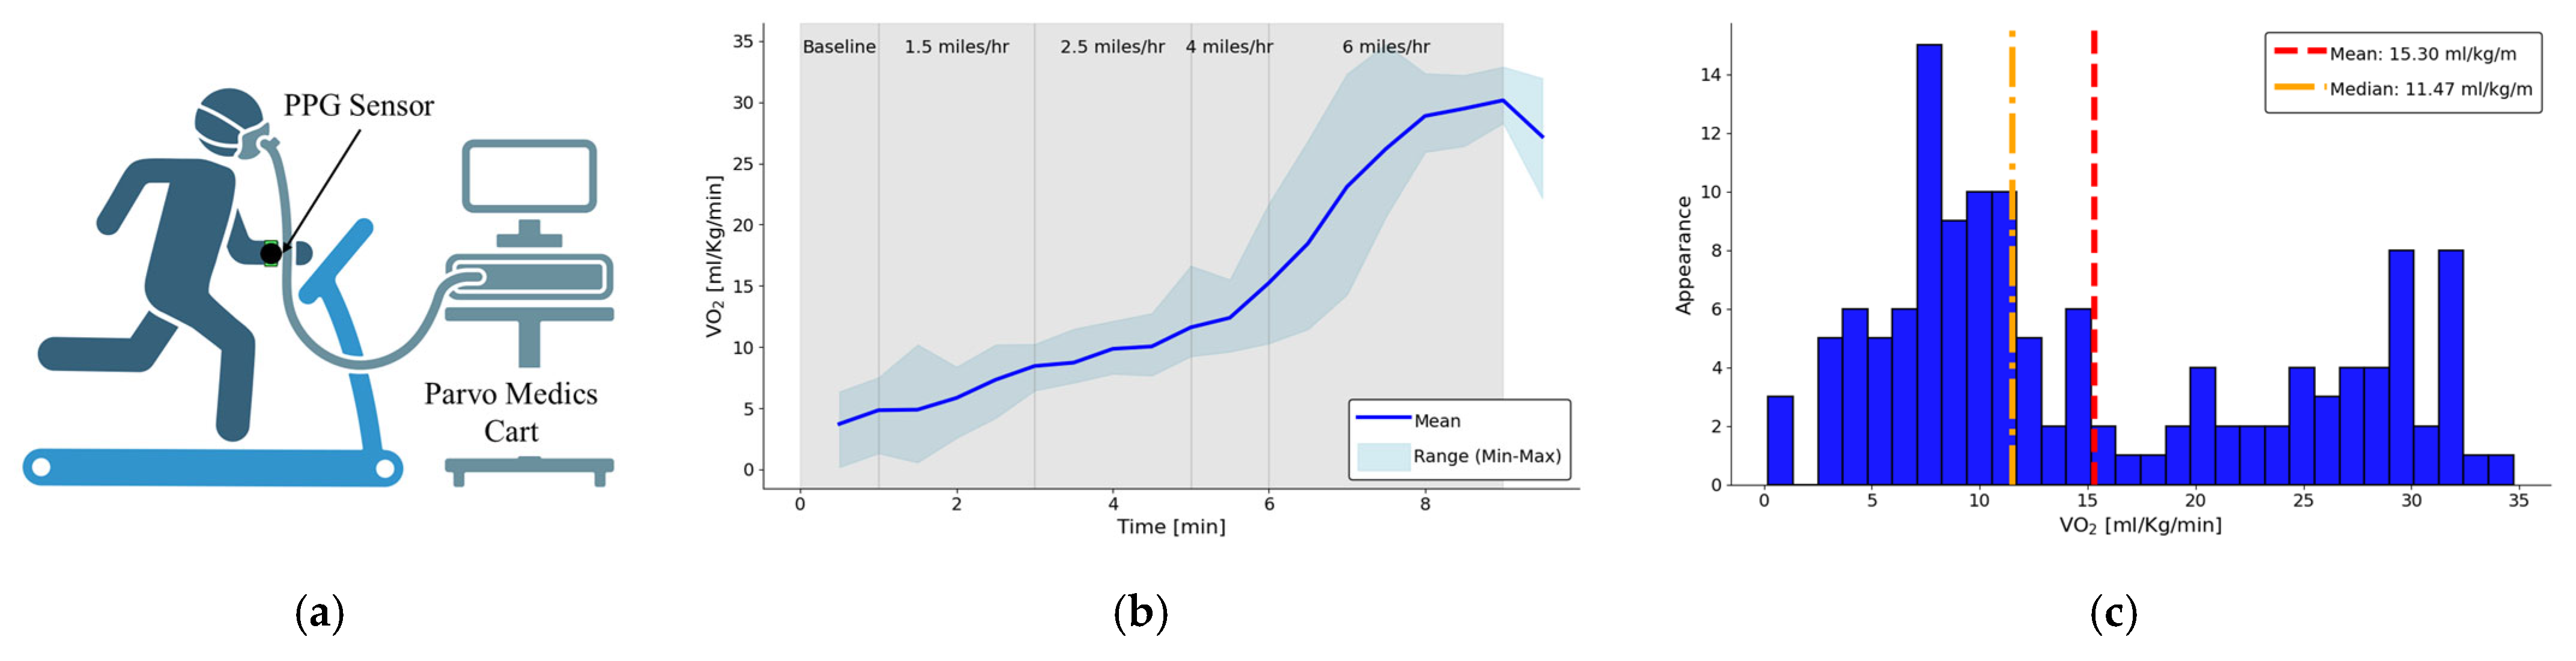
2.3. Human Subject Study Protocol

To validate the algorithm, a human subject study was conducted using a modified Bruce protocol [33], the protocol setup is shown in Figure 4a. Informed written consent was obtained, and the study was conducted under IRB2021-0962F, approved by the Texas A&M University Institutional Review Board (IRB). This exercise protocol was specifically designed to include low-intensity activities that naturally elevate heart rate and cardiac output (CO) without overexertion. Increasing CO will cause an increase in VO2. A total of 11 subject’s data were collected and 3 subject’s data were excluded due to the incomplete PPG data that was corrupted during the data saving process.
The participants performed a series of walking and jogging intervals on a treadmill with a flat incline, ensuring accessibility for individuals with varying fitness levels. The protocol began with warm-up periods at progressively increasing walking speeds, followed by a short jogging session to further stimulate cardiovascular activity, the exercise protocol is shown in Table 1.
Measurements were taken intermittently throughout the exercise, including data from the wrist-worn PPG device and a breath analyzer for oxygen consumption (VO2). The VO2 [mL/kg/min] trend during the exercise period from the 8 subjects is shown in Figure 4b and the distribution of all the VO2 [mL/kg/min] is shown in Figure 4c. Additionally, post-exercise echocardiography assessments were conducted to evaluate CO (CO = stroke volume (SV) X heart rate (HR)) changes and their correlation with the derived VO2 measurements.

3. Results

Figure 5a,b display the prediction curve and residuals plot for the random forest machine learning model using bootstrap aggregation (bagging) with five wavelengths. Bootstrap aggregation is a technique where multiple decision trees are trained on different subsets of the data, sampled with replacement, to reduce overfitting and improve prediction accuracy. The final prediction is obtained by averaging the outputs of all the trees in the ensemble, making the model robust to variability in the data.
It should be noted that we explored several regression-based algorithms, including linear regression, in the initial stages of model development. However, we observed that the relationships between our selected features and VO2 were inherently non-linear and complex, making linear regression methods inadequate without extensive transformations, which might risk introducing bias or reducing interpretability. Consequently, we selected the Random Forest algorithm due to its robustness in capturing complex, non-linear relationships, resistance to overfitting, and minimal need for feature transformation. Additionally, we utilized bootstrap predictions to further enhance model reliability and assess its generalization capability. While deep learning methods were considered, they typically require significantly larger datasets for optimal performance. Given the limited sample size in our study, Random Forest provided an ideal balance between complexity, interpretability, and accuracy.
Using this approach, the model achieved a mean absolute error (MAE) of 1.73 [mL/kg/min] and an R-squared value of 0.93. In comparison, as shown in Figure 5c,d, using only three wavelengths resulted in an MAE of 1.82 [ml/kg/m] and an R-squared value of 0.92. This demonstrates the potential to achieve similar accuracy with a reduction in the number of LEDs used in the algorithm to simplify the design.
In Figure 5, both the prediction accuracy (actual vs. predicted VO2) and residual analysis for the 5-wavelength and 3-wavelength PPG models are shown. Examining the residual plots as shown in Figure 5b,d, it is evident that residuals are randomly distributed around zero with no clear or systematic pattern. This indicates that the prediction errors are unbiased and consistent across the entire range of predicted VO2 values, demonstrating that the model performance does not significantly degrade at low, moderate, or high levels of VO2. A slight increase in variance can be observed at higher VO2 values (above ~25 mL/kg/min), which is expected due to physiological variability at higher intensities. However, this variability remains minimal, further reinforcing the robustness of our multiwavelength PPG-based VO2 estimation approach.

4. Discussion

The findings of this study highlight both the benefits and limitations of using the quasi-DC component of PPG waveforms for estimating rate of oxygen consumption (VO2).

4.1. Comparison with Existing Wearable VO2_max Estimation Methods

Traditional wearable fitness devices estimate VO2_max using static formulas that primarily rely on heart rate (HR) data and user demographics. For instance, the Polar A300™ estimates VO2_max from resting cardiac variability [34], while devices like the Apple Watch and Fitbit utilize HR and activity data during exercises to predict VO2_max [35,36,37]. These methods, while convenient, often lack the precision of direct measurements due to their reliance on generalized algorithms that do not account for individual physiological variations.
Recent studies have sought to enhance the accuracy of VO2_max estimation by integrating additional data sources. For example, Spathis et al. [38] developed a model predicting cardiorespiratory fitness using wearable sensor data, including HR and movement metrics, collected during daily activities, achieving a strong correlation with laboratory measurements. Similarly, a study by Amelard et al. [39] employed temporal convolutional networks to predict dynamic oxygen uptake responses from wearable sensors across various exercise intensities, demonstrating the potential of advanced machine learning techniques in this domain.
In contrast to these approaches, our study introduces a novel method for continuous VO2 estimation by leveraging oxygenation information obtained directly from a custom-designed, multiwavelength photoplethysmography (PPG) wearable sensor. This technique allows for real-time monitoring of VO2 without relying solely on HR or demographic data, thereby providing a more individualized and precise assessment. Our validation study demonstrated a mean absolute error of 1.66 mL/kg/min and an R2 of 0.94 when compared to the gold-standard Parvo Medics gas analysis system, indicating a high level of accuracy. By directly measuring oxygenation changes through PPG signals, our approach addresses the limitations of static formula-based estimations and enhances the potential for continuous, non-invasive VO2 monitoring in both clinical and everyday settings. Table 2 summarizes the comparison of our method with previously published wearable-based VO2 estimation studies.

4.2. Advantages of DC Analysis

In prior research [17,18,19,20,21,22], the AC component of PPG waveforms has been extensively utilized for extracting morphological features and amplitude variations, which are strongly correlated with cardiovascular metrics such as heart rate, blood pressure, and cardiac output. However, the primary limitation of relying on the AC component lies in its high susceptibility to motion artifacts [40,41,42,43,44,45].
This sensitivity is evident in Figure 6a, which displays the raw PPG waveforms from the analog front-end (AFE) for a single subject. While the zoomed-in window of the 660 nm waveform in Figure 6b illustrates the pulsatile signal produced by heartbeats during resting conditions, Figure 6c shows how motion during exercise severely disrupts the AC component, rendering it virtually impossible to discern heart rate signals or morphological features in the time domain.
In contrast, the quasi-DC component, as seen in Figure 6a, demonstrates significantly less sensitivity to motion artifacts. The gradual variations in the DC signal provide a robust metric for analysis without relying on beat-to-beat heart rate signals, offering a new avenue for extracting physiological information during dynamic activities.
Another advantage is that VO2 measurement provides critical medical physiology measurements that which arterial pulsation (AC) portion cannot do. VO2 consists of the body’s metabolic demand, the heart’s ability to vary cardiac output, and the pulmonary system’s ability to provide O2 exchange. In contrast, the AC portion only measures the pulmonary system’s ability to deliver O2 to the arterial system. Knowing VO2 can be used to quantify a wide span of human conditions from the severity of heart failure (low VO2) to sports performance (high VO2). Being light and portable, this system then can be used to guide outpatient treatment of heart failure patients, which has a current US prevalence of 6.7 M [46].

4.3. Limitations of the Study

The study’s findings are limited by the relatively homogeneous population of healthy subjects aged 21 to 31. Data from older adults or individuals with various health conditions, such as cardiovascular or respiratory diseases, were not included. Expanding the dataset to incorporate a more diverse population is essential to validate and generalize the algorithm’s applicability across different demographics and health states. Future research should aim to address these limitations by collecting data from larger, more diverse cohorts and further refining the algorithm to accommodate varying physiological conditions.

5. Conclusions

This study presents a novel approach to estimating oxygen consumption (VO2) non-invasively using a multi-wavelength photoplethysmography (PPG) wearable device and a random forest machine learning algorithm. By leveraging the Beer–Lambert law and analyzing the quasi-DC components of PPG waveforms, we demonstrated a robust methodology to overcome the limitations of conventional VO2 measurement systems, which rely on bulky gas analysis equipment. The results showed that the proposed system, which utilized five distinct wavelengths (670 nm, 770 nm, 810 nm, 850 nm, and 950 nm), achieved high accuracy with a mean absolute error (MAE) of 1.66 mL/kg/min and an R 2 value of 0.94 in predicting VO2. Unlike traditional wearable devices that rely solely on heart rate or demographic data, our method directly utilizes real-time oxygenation information, enabling individualized and precise VO2 monitoring. This highlights the advantage of multi-spectral sensing in capturing comprehensive hemoglobin dynamics for VO2 estimation. Additionally, the use of the DC component of the PPG signal provides a major advantage over the traditionally used AC component, particularly in reducing sensitivity to motion artifacts during exercise. This enables continuous monitoring of VO2 even under dynamic conditions, such as physical activity, where AC analysis is typically unreliable. This prediction approach has significant implications for other biomedical applications such as non-invasive cardiac output monitoring. By providing a reliable estimate of oxygen consumption (VO2), the system has the potential to indirectly assess cardiac output, offering a valuable tool for personalized healthcare and fitness monitoring. This innovation could lead to broader applications in clinical diagnostics, exercise physiology, and chronic disease management, advancing the capabilities of wearable health technologies. Future studies should expand validation to larger, more diverse populations to further confirm generalizability and reliability.

Author Contributions

Conceptualization, C.-T.H. and G.L.C.; methodology, C.-T.H.; validation, C.-T.H. and G.L.C.; formal analysis, C.-T.H.; investigation, C.-T.H., C.T. and G.L.C.; data curation, C.-T.H.; writing—original draft preparation, C.-T.H.; writing—review and editing, C.-T.H., C.T. and G.L.C.; visualization, C.-T.H.; supervision, G.L.C.; project administration, G.L.C.; All authors have read and agreed to the published version of the manuscript.

Funding

This research was funded, in part, by the National Science Foundation Engineering Research Center (NSF—ERC) Precise Advanced Technologies and Health Systems for Underserved Populations (PATHS-UP) (ERC—1648451).

Institutional Review Board Statement

All the human participant measurements were performed under the approval of the Institutional Review Board of Texas A&M University (IRB number: IRB2021-0962F) where written consent was obtained from each subject.

Informed Consent Statement

Informed consent has been obtained from the patients to publish.

Data Availability Statement

The data presented in this study are available on request from the corresponding author.

Acknowledgments

We would like to express our gratitude to Richard Horner for his assistance in PCB design as well as Kimberly Branan and Joshua Hale for their help in data collection.

Conflicts of Interest

The authors declare no conflicts of interest. The funders had no role in the design of the study; in the collection, analyses, or interpretation of data; in the writing of the manuscript; or in the decision to publish the results.

References

  1. Srivastava, S.; Tamrakar, S.; Nallathambi, N.; Vrindavanam, S.A.; Prasad, R.; Kothari, R. Assessment of Maximal Oxygen Uptake (VO2 Max) in Athletes and Nonathletes Assessed in Sports Physiology Laboratory. Cureus 2024, 16, e61124. [Google Scholar] [CrossRef] [PubMed]
  2. Herdy, A.H.; Ritt, L.E.; Stein, R.; Araújo, C.G.; Milani, M.; Meneghelo, R.S.; Ferraz, A.S.; Hossri, C.; Almeida, A.E.; Fernandes-Silva, M.M.; et al. Cardiopulmonary Exercise Test: Background, Applicability and Interpretation. Arq. Bras. Cardiol. 2016, 107, 467–481. [Google Scholar] [CrossRef] [PubMed]
  3. Divakaruni, A.S.; Jastroch, M. A practical guide for the analysis, standardization and interpretation of oxygen consumption measurements. Nat. Metab. 2022, 4, 978–994. [Google Scholar] [CrossRef] [PubMed]
  4. Ross, R.; Blair, S.N.; Arena, R.; Church, T.S.; Després, J.-P.; Franklin, B.A.; Haskell, W.L.; Kaminsky, L.A.; Levine, B.D.; Lavie, C.J.; et al. Importance of Assessing Cardiorespiratory Fitness in Clinical Practice: A Case for Fitness as a Clinical Vital Sign: A Scientific Statement from the American Heart Association. Circulation 2016, 134, e653–e699. [Google Scholar] [CrossRef]
  5. Grafton, G.; Cascino, T.M.; Perry, D.; Ashur, C.; Koelling, T.M. Resting Oxygen Consumption and Heart Failure: Importance of Measurement for Determination of Cardiac Output with the Use of the Fick Principle. J. Card. Fail. 2020, 26, 664–672. [Google Scholar] [CrossRef]
  6. Malhotra, R.; Bakken, K.; D’Elia, E.; Lewis, G.D. Cardiopulmonary Exercise Testing in Heart Failure. JACC Heart Fail. 2016, 4, 607–616. [Google Scholar] [CrossRef]
  7. Silverthorn, D.U.; Johnson, B.R.; Ober, W.C.; Garrison, C.W.; Silverthorn, A.C. Human Physiology: An Integrated Approach, 6th ed.; Pearson Education: Boston, MA, USA, 2013; pp. 436–439. [Google Scholar]
  8. Fuentes, S.; Chowdhury, Y.S. Fraction of Inspired Oxygen; StatPearls Publishing LLC: Treasure Island, Fl, USA, 2024. [Google Scholar]
  9. Schumacker, P.T.; Samsel, R.W. Analysis of oxygen delivery and uptake relationships in the Krogh tissue model. J. Appl. Physiol. 1989, 67, 1234–1244. [Google Scholar] [CrossRef]
  10. Abay, T.Y.; Kyriacou, P.A. Photoplethysmography for blood volumes and oxygenation changes during intermittent vascular occlusions. J. Clin. Monit. Comput. 2018, 32, 447–455. [Google Scholar] [CrossRef]
  11. Ray, D.; Collins, T.; Woolley, S.; Ponnapalli, P. A Review of Wearable Multi-Wavelength Photoplethysmography. IEEE Rev. Biomed. Eng. 2023, 16, 136–151. [Google Scholar] [CrossRef]
  12. Kim, K.B.; Baek, H.J. Photoplethysmography in Wearable Devices: A Comprehensive Review of Technological Advances, Current Challenges, and Future Directions. Electronics 2023, 12, 2923. [Google Scholar] [CrossRef]
  13. Sabeti, E.; Reamaroon, N.; Mathis, M.; Gryak, J.; Sjoding, M.; Najarian, K. Signal quality measure for pulsatile physiological signals using morphological features: Applications in reliability measure for pulse oximetry. Inform. Med. Unlocked 2019, 16, 100222. [Google Scholar] [CrossRef] [PubMed]
  14. Fine, J.; Branan, K.L.; Rodriguez, A.J.; Boonya-Ananta, T.; Ajmal; Ramella-Roman, J.C.; McShane, M.J.; Coté, G.L. Sources of Inaccuracy in Photoplethysmography for Continuous Cardiovascular Monitoring. Biosensors 2021, 11, 26. [Google Scholar] [CrossRef] [PubMed]
  15. Sharma, H. Heart rate extraction from PPG signals using variational mode decomposition. Biocybern. Biomed. Eng. 2019, 39, 75–86. [Google Scholar] [CrossRef]
  16. Park, J.; Seok, H.S.; Kim, S.-S.; Shin, H. Photoplethysmogram Analysis and Applications: An Integrative Review. Front. Physiol. 2022, 12, 808451. [Google Scholar] [CrossRef]
  17. Charlton, P.H.; Celka, P.; Farukh, B.; Chowienczyk, P.; Alastruey, J. Assessing mental stress from the photoplethysmogram: A numerical study. Physiol. Meas. 2018, 39, 054001. [Google Scholar] [CrossRef]
  18. Charlton, P.H.; Kotzen, K.; Mejía-Mejía, E.; Aston, P.J.; Budidha, K.; Mant, J.; Pettit, C.; Behar, J.A.; Kyriacou, P.A. Detecting beats in the photoplethysmogram: Benchmarking open-source algorithms. Physiol. Meas. 2022, 43, 085007. [Google Scholar] [CrossRef]
  19. Rohr, M.; Tarvainen, M.; Miri, S.; Güney, G.; Vehkaoja, A.; Hoog Antink, C. An extensive quantitative analysis of the effects of errors in beat-to-beat intervals on all commonly used HRV parameters. Sci. Rep. 2024, 14, 2498. [Google Scholar] [CrossRef]
  20. Hosanee, M.; Chan, G.; Welykholowa, K.; Cooper, R.; Kyriacou, P.A.; Zheng, D.; Allen, J.; Abbott, D.; Menon, C.; Lovell, N.H.; et al. Cuffless Single-Site Photoplethysmography for Blood Pressure Monitoring. J. Clin. Med. 2020, 9, 723. [Google Scholar] [CrossRef]
  21. Mahardika, T.N.; Fuadah, Y.N.; Jeong, D.U.; Lim, K.M. PPG Signals-Based Blood-Pressure Estimation Using Grid Search in Hyperparameter Optimization of CNN-LSTM. Diagnostics 2023, 13, 2566. [Google Scholar] [CrossRef]
  22. Qin, C.; Wang, X.; Xu, G.; Ma, X. Advances in Cuffless Continuous Blood Pressure Monitoring Technology Based on PPG Signals. BioMed Res. Int. 2022, 2022, 8094351. [Google Scholar] [CrossRef]
  23. Delsoglio, M.; Achamrah, N.; Berger, M.M.; Pichard, C. Indirect Calorimetry in Clinical Practice. J. Clin. Med. 2019, 8, 1387. [Google Scholar] [CrossRef] [PubMed]
  24. Levine, J.A. Measurement of energy expenditure. Public Health Nutr. 2005, 8, 1123–1132. [Google Scholar] [CrossRef] [PubMed]
  25. Poole, D.C.; Wilkerson, D.P.; Jones, A.M. Validity of criteria for establishing maximal O2 uptake during ramp exercise tests. Eur. J. Appl. Physiol. 2008, 102, 403–410. [Google Scholar] [CrossRef] [PubMed]
  26. Albouaini, K.; Egred, M.; Alahmar, A.; Wright, D.J. Cardiopulmonary exercise testing and its application. Postgrad. Med. J. 2007, 83, 675–682. [Google Scholar] [CrossRef]
  27. Hsiao, C.-T.; McMurray, J.; Branan, K.; Coté, G. Changes in Morphology of Multiwavelength Photoplethysmography Across and Down Major Arteries in the Forearm; SPIE: Bellingham, WA, USA, 2023; Volume 12387. [Google Scholar]
  28. Beatty, P.C.W. Design of Pulse Oximeters (Medical Science Series). Physiol. Meas. 1998, 19, 40. [Google Scholar] [CrossRef]
  29. Nitzan, M.; Romem, A.; Koppel, R. Pulse oximetry: Fundamentals and technology update. Med. Devices Evid. Res. 2014, 7, 231–239. [Google Scholar] [CrossRef]
  30. Nitzan, M.; Engelberg, S. Three-wavelength technique for the measurement of oxygen saturation in arterial blood and in venous blood. J. Biomed. Opt. 2009, 14, 024046. [Google Scholar] [CrossRef]
  31. Marktech Optoelectronics. MTMD6788594SMT6 Datasheet. Available online: https://specs.marktechopto.com/pdf/products/datasheet/MTMD6788594SMT6.pdf (accessed on 28 December 2024).
  32. Vishay. VEMD8080 Product Information. Available online: https://www.vishay.com/en/product/84565/ (accessed on 28 December 2024).
  33. Tannen, T. Robert A Bruce. Lancet 2004, 363, 1403. [Google Scholar] [CrossRef]
  34. Cooper, K.D.; Shafer, A.B. Validity and Reliability of the Polar A300’s Fitness Test Feature to Predict VO2max. Int. J. Exerc. Sci. 2019, 12, 393–401. [Google Scholar] [CrossRef]
  35. Freeberg, K.A.; Baughman, B.R.; Vickey, T.; Sullivan, J.A.; Sawyer, B.J. Assessing the ability of the Fitbit Charge 2 to accurately predict VO2max. Mhealth 2019, 5, 39. [Google Scholar] [CrossRef]
  36. Caserman, P.; Yum, S.; Göbel, S.; Reif, A.; Matura, S. Assessing the Accuracy of Smartwatch-Based Estimation of Maximum Oxygen Uptake Using the Apple Watch Series 7: Validation Study. JMIR Biomed. Eng. 2024, 9, e59459. [Google Scholar] [CrossRef]
  37. Klepin, K.; Wing, D.; Higgins, M.; Nichols, J.; Godino, J.G. Validity of Cardiorespiratory Fitness Measured with Fitbit Compared to VO2max. Med. Sci. Sports Exerc. 2019, 51, 2251–2256. [Google Scholar] [CrossRef]
  38. Spathis, D.; Perez-Pozuelo, I.; Gonzales, T.I.; Wu, Y.; Brage, S.; Wareham, N.; Mascolo, C. Longitudinal cardio-respiratory fitness prediction through wearables in free-living environments. npj Digit. Med. 2022, 5, 176. [Google Scholar] [CrossRef] [PubMed]
  39. Amelard, R.; Hedge, E.T.; Hughson, R.L. Temporal convolutional networks predict dynamic oxygen uptake response from wearable sensors across exercise intensities. npj Digit. Med. 2021, 4, 156. [Google Scholar] [CrossRef]
  40. Lee, J.; Kim, M.; Park, H.K.; Kim, I.Y. Motion Artifact Reduction in Wearable Photoplethysmography Based on Multi-Channel Sensors with Multiple Wavelengths. Sensors 2020, 20, 1493. [Google Scholar] [CrossRef]
  41. Gautam, Y.; Jebelli, H. Autoencoder-based Photoplethysmography (PPG) signal reliability enhancement in construction health monitoring. Autom. Constr. 2024, 165, 105537. [Google Scholar] [CrossRef]
  42. Dao, D.; Salehizadeh, S.M.A.; Noh, Y.; Chong, J.W.; Cho, C.H.; McManus, D.; Darling, C.E.; Mendelson, Y.; Chon, K.H. A Robust Motion Artifact Detection Algorithm for Accurate Detection of Heart Rates from Photoplethysmographic Signals Using Time–Frequency Spectral Features. IEEE J. Biomed. Health Inform. 2017, 21, 1242–1253. [Google Scholar] [CrossRef]
  43. Vicente-Samper, J.M.; Tamantini, C.; Ávila-Navarro, E.; De La Casa-Lillo, M.Á.; Zollo, L.; Sabater-Navarro, J.M.; Cordella, F. An ML-Based Approach to Reconstruct Heart Rate from PPG in Presence of Motion Artifacts. Biosensors 2023, 13, 718. [Google Scholar] [CrossRef]
  44. Pollreisz, D.; TaheriNejad, N. Detection and Removal of Motion Artifacts in PPG Signals. Mob. Netw. Appl. 2022, 27, 728–738. [Google Scholar] [CrossRef]
  45. Zhang, Y.; Song, S.; Vullings, R.; Biswas, D.; Simões-Capela, N.; van Helleputte, N.; van Hoof, C.; Groenendaal, W. Motion Artifact Reduction for Wrist-Worn Photoplethysmograph Sensors Based on Different Wavelengths. Sensors 2019, 19, 673. [Google Scholar] [CrossRef]
  46. Martin, S.S.; Aday, A.W.; Allen, N.B.; Almarzooq, Z.I.; Anderson, C.A.M.; Arora, P.; Avery, C.L.; Baker-Smith, C.M.; Bansal, N.; Beaton, A.Z.; et al. 2025 Heart Disease and Stroke Statistics: A Report of US and Global Data From the American Heart Association. Circulation 2025, 151, 8. [Google Scholar] [CrossRef]
Figure 1. (a) Simplified model of a closed-loop cardiovascular system with a heart, lungs, and a left arm. (Created with BioRender.com (accessed on 14 December 2024)) (b) PPG waveforms with the features (systolic peak, dicrotic notch, and diastolic peak) and the AC and quasi-DC component.
Biosensors 15 00208 g001
Figure 2. (a) Molar extinction coefficient of oxy-hemoglobin (HbO2) and deoxy-hemoglobin (Hb) from 600 nm to 950 nm. (b) Interpolation of molar extinction coefficient from Hb (0%) and HbO2 (100%) at 5 wavelengths (670 nm, 770 nm, 810 nm, 850 nm, and 950 nm) at a step of 20% increase. The dashed line represents the regression at each oxygen level. (c) Molar extinction coefficient multiplying a scaling factor α(λ) to move the intercept to 810 nm. (d) Illustration of a reflective white card setup to estimate the I 0 * (cross-sectional view). (e) Illustration of a reflective white card setup to estimate the I 0 * (top view). (f) The received photodiode currents of I 0 * in terms of LED pulse amplitude (PA). The black dashed line represents the corresponding I 0 * at LED PA of 50 [mA].
Biosensors 15 00208 g002
Figure 3. (a) An illustration of sensor location and demonstration of the target arteries and veins. (created with BioRender.com (accessed on 14 December 2024)) (b) Signal processing chain from LEDs and PDs to VO2 prediction (machine learning algorithm output) (c) Bottom and side view of the 3D printed mechanical/industrial design of the wearable PPG sensor. (d) PCB view of showing the source (LEDs) to detector (PDs) distance is 6.5 mm for all PDs (e) The LEDs spectral output of 5 wavelengths (adapted from the datasheet [31]) (f) The relative spectral sensitivity of the photodiode (adapted from the datasheet [32]).
Biosensors 15 00208 g003
Figure 4. (a) An illustration of the human subject study protocol setup with the proposed PPG sensor and reference device Parvo Medics TrueOne 2400 system (Created with BioRender.com (accessed on 14 December 2024)) (b) The average variation and range in VO2 [ml/kg/m] while running at 4 different speed (1.5, 2.5, 4, and 6 mile/h) from 8 subjects (c) The distribution of the VO2 [ml/kg/m] collected from the reference deice averaging at 15.3 mL/kg/m.
Biosensors 15 00208 g004
Figure 5. (a) A prediction curve (red dashed line) of VO2 [mL/kg/min] using five wavelengths as an input of machine learning model. (b) A residual plot that shows the mean error (red dashed line) and distribution of the error using five wavelengths as an input of machine learning model. (c) A prediction curve (red dashed line) of VO2 [mL/kg/min] using three wavelengths as an input of machine learning model. (d) A residual plot that shows the mean error (red dashed line) and distribution of the error using three wavelengths as an input of machine learning model.
Biosensors 15 00208 g005
Figure 6. (a) The raw PPG waveforms of five wavelengths from stationary to running. (b) A zoom-in view of the PPG waveform from 660 nm during the stationary period before starting running. (c) A zoom-in view of the PPG waveform from 660 nm while running at the speed of 6 miles per hour.
Biosensors 15 00208 g006
Table 1. Human subject study protocol with walking and running on the treadmill at different speeds.
Exercise ProtocolDurationComment
Sitting Sedentary0.5 minEstablish PPG baseline
Walking2 min1.5 miles/h
Walking2 min2.5 miles/h
Running1 min4 miles/h
Running3 min6 miles/h
Total~10 min
Table 2. Benchmark comparison of the current study with existing literature.
StudyMethodologySample SizeAdvantagesLimitations
Fitbit Charge 2 (Freeberg et al., 2019) [35]HR + activity data estimation30Convenient; Large user baseRelies on static formulas; less precise
Apple Watch Series 7 (Caserman et al., 2024) [36]HR-based estimation during exercise19Widely accessible; User-friendlyLower precision; Relies on demographic and HR data only
Neural Network model (Spathis et al., 2022) [38]HR + accelerometer data11,059Large, diverse dataset; Effective in daily life settingsHigh computational cost; No oxygenation data
Temporal convolutional network (Amelard et al., 2021) [39]Wearable sensors with advanced ML22Captures dynamics at varying intensities; RobustRequires extensive data and computational power
This studyMultiwavelength PPG + Random Forest8Direct oxygenation measurement; Real-time; Non-invasive; High accuracySmall sample; Preliminary validation
Disclaimer/Publisher’s Note: The statements, opinions and data contained in all publications are solely those of the individual author(s) and contributor(s) and not of MDPI and/or the editor(s). MDPI and/or the editor(s) disclaim responsibility for any injury to people or property resulting from any ideas, methods, instructions or products referred to in the content.

