Plasmonic Fluorescence Sensors in Diagnosis of Infectious Diseases


Abstract
1. Introduction
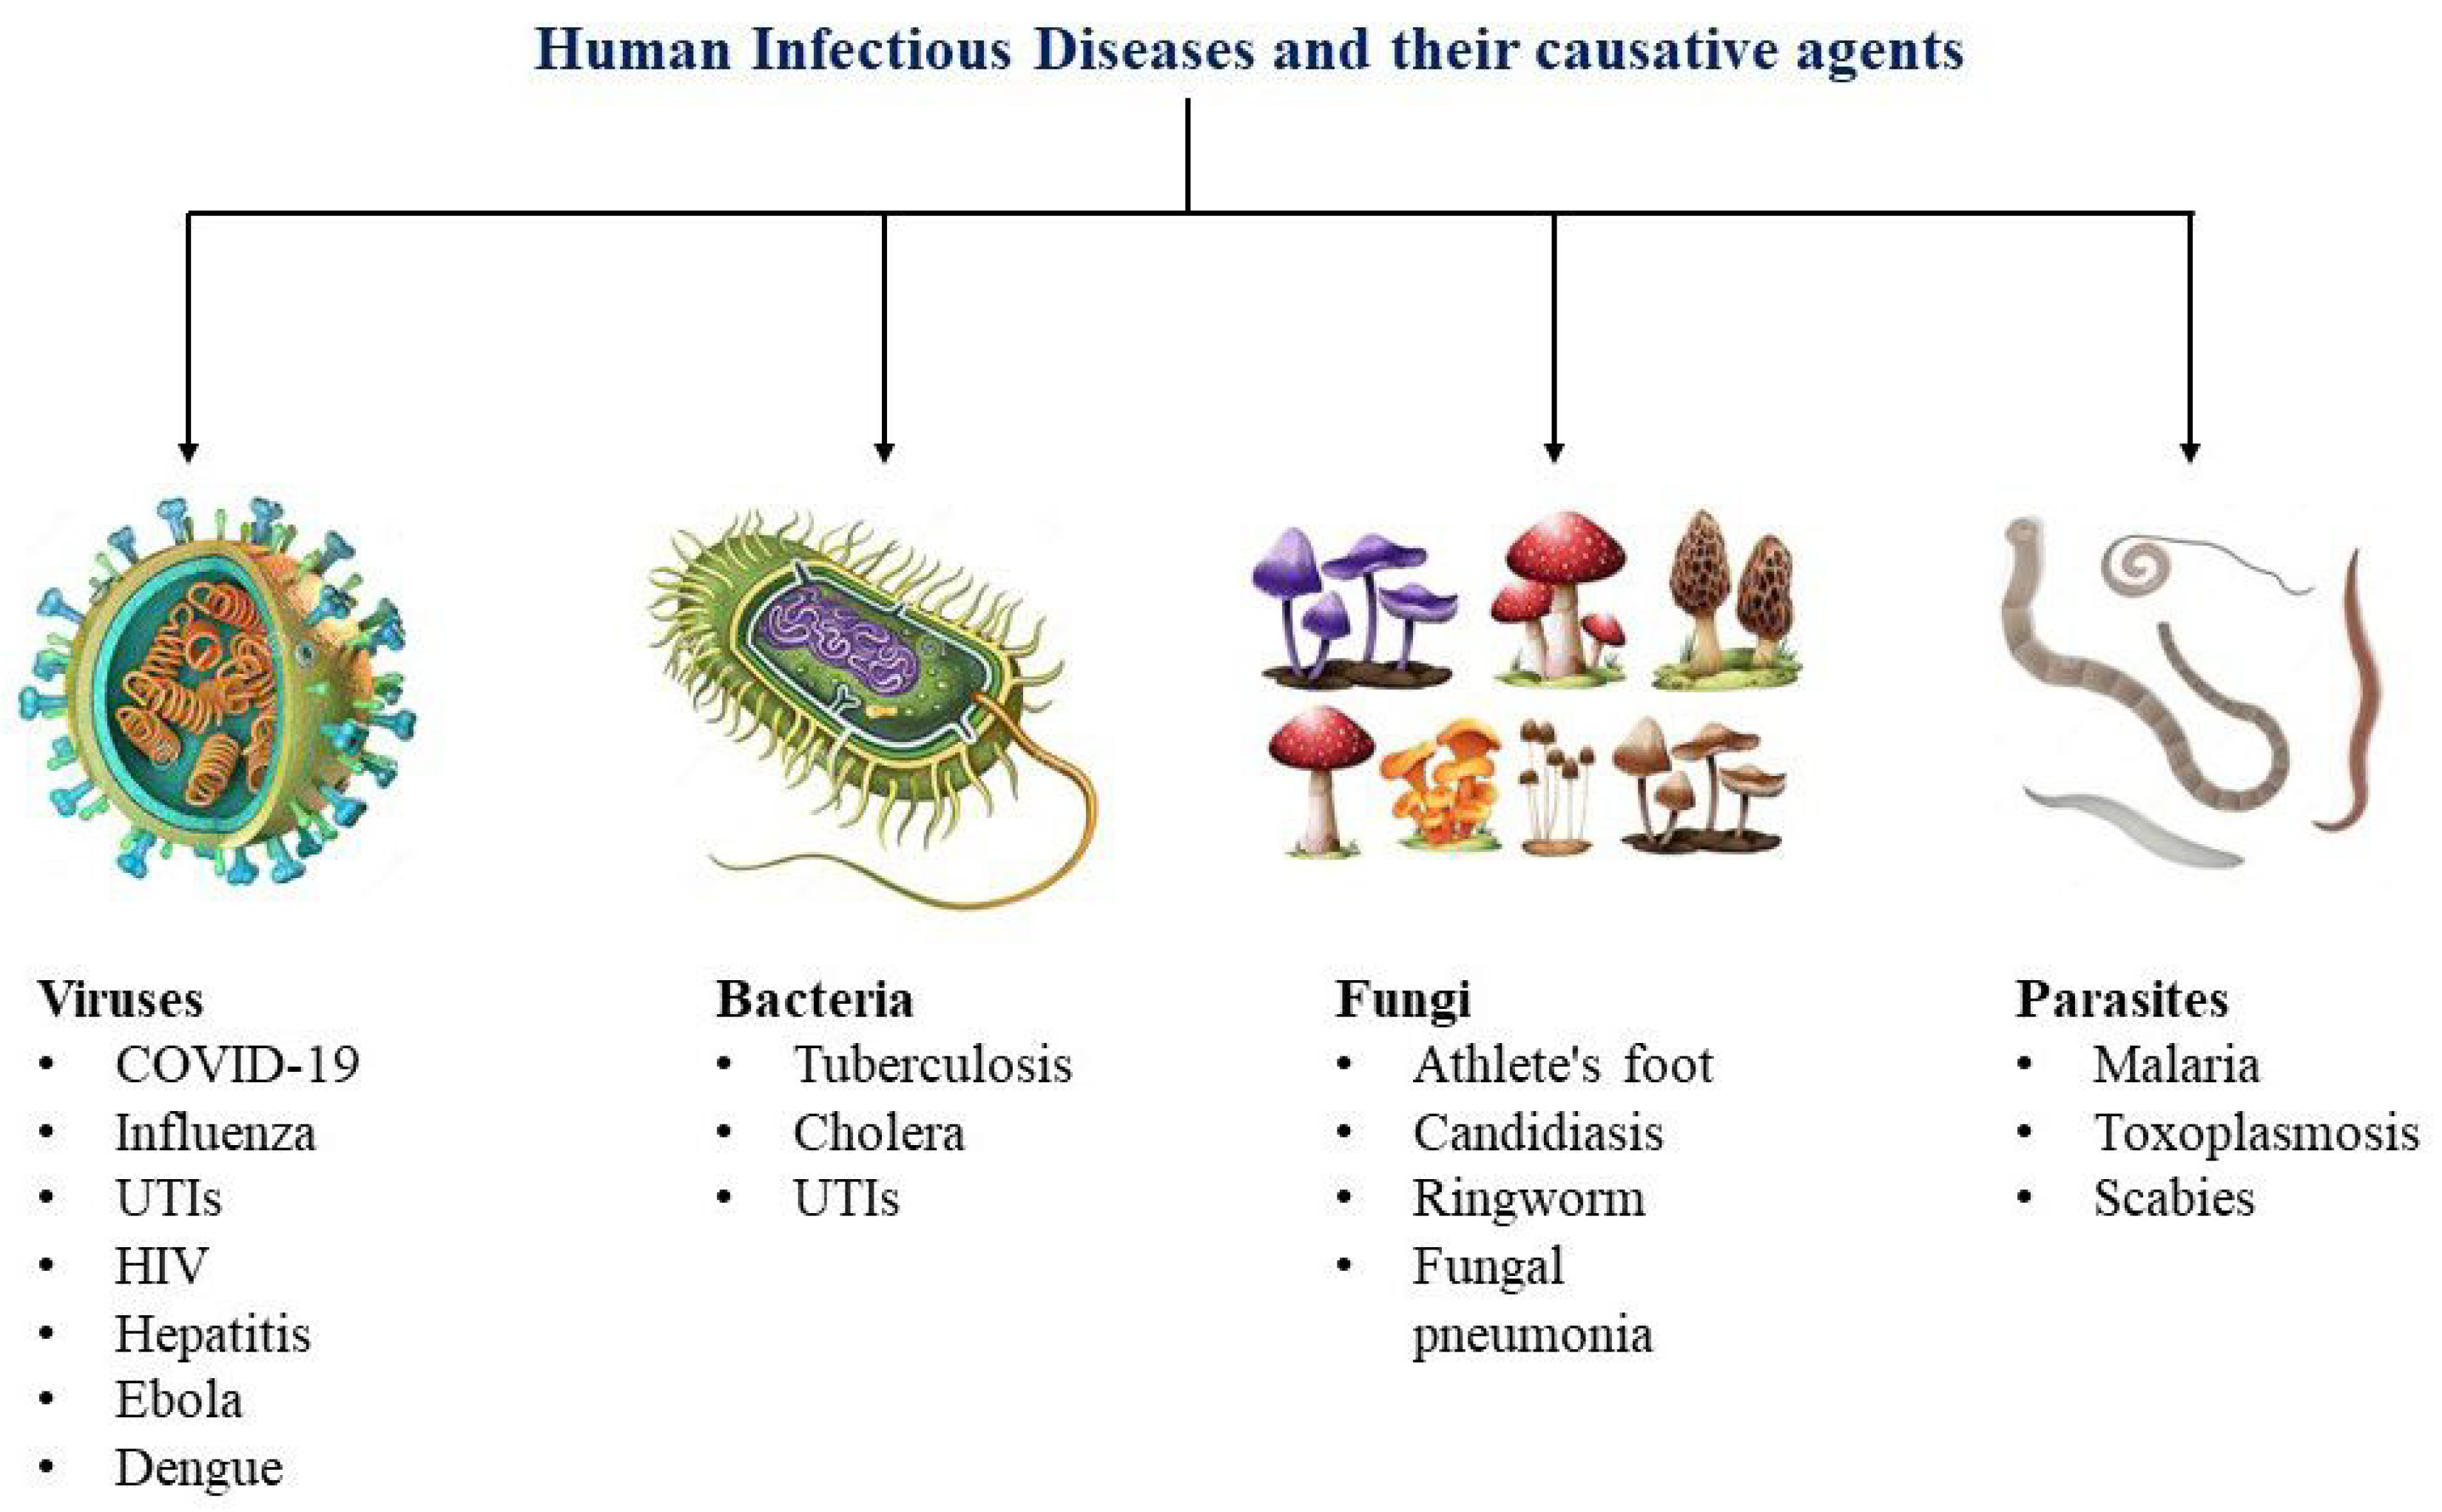
2. Types of Infectious Disease
2.1. Viral Infections
2.1.1. COVID-19
2.1.2. Influenza Virus
2.1.3. Human Immunodeficiency Virus (HIV) Infection
2.1.4. Hepatitis
2.1.5. Ebola Virus Disease
2.1.6. Dengue Fever
2.2. Bacterial Infections
2.2.1. Tuberculosis
2.2.2. Cholera
2.2.3. Urinary Tract Infections
2.3. Additional Infectious Pathogens
3. Methods for Fluorescence Enhancement
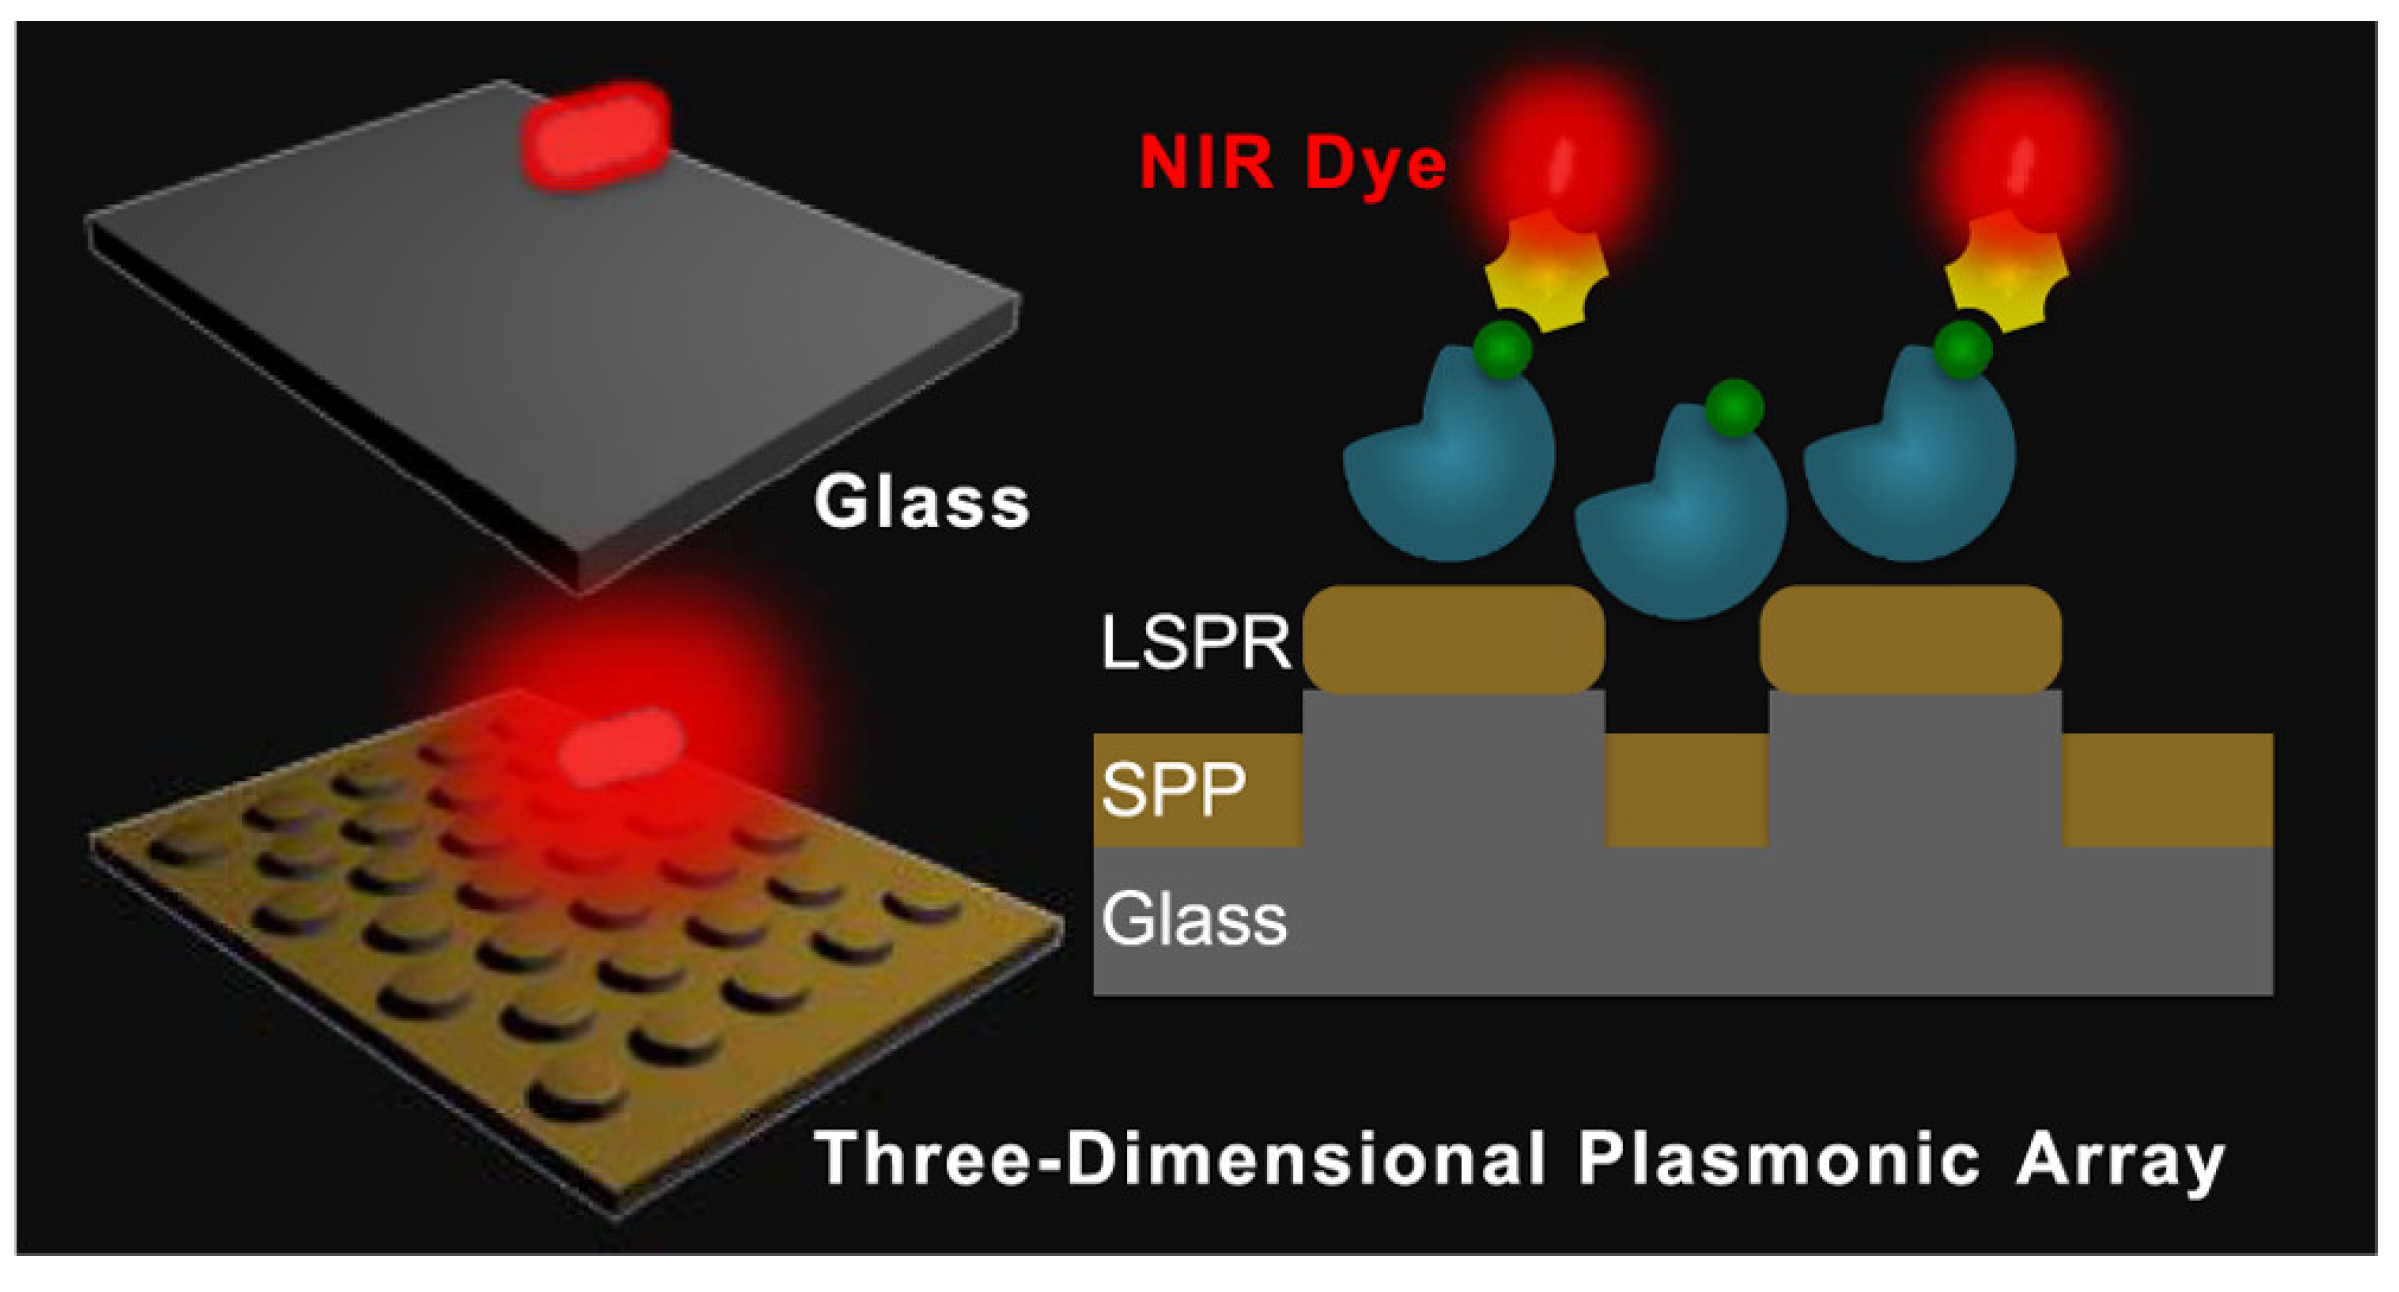
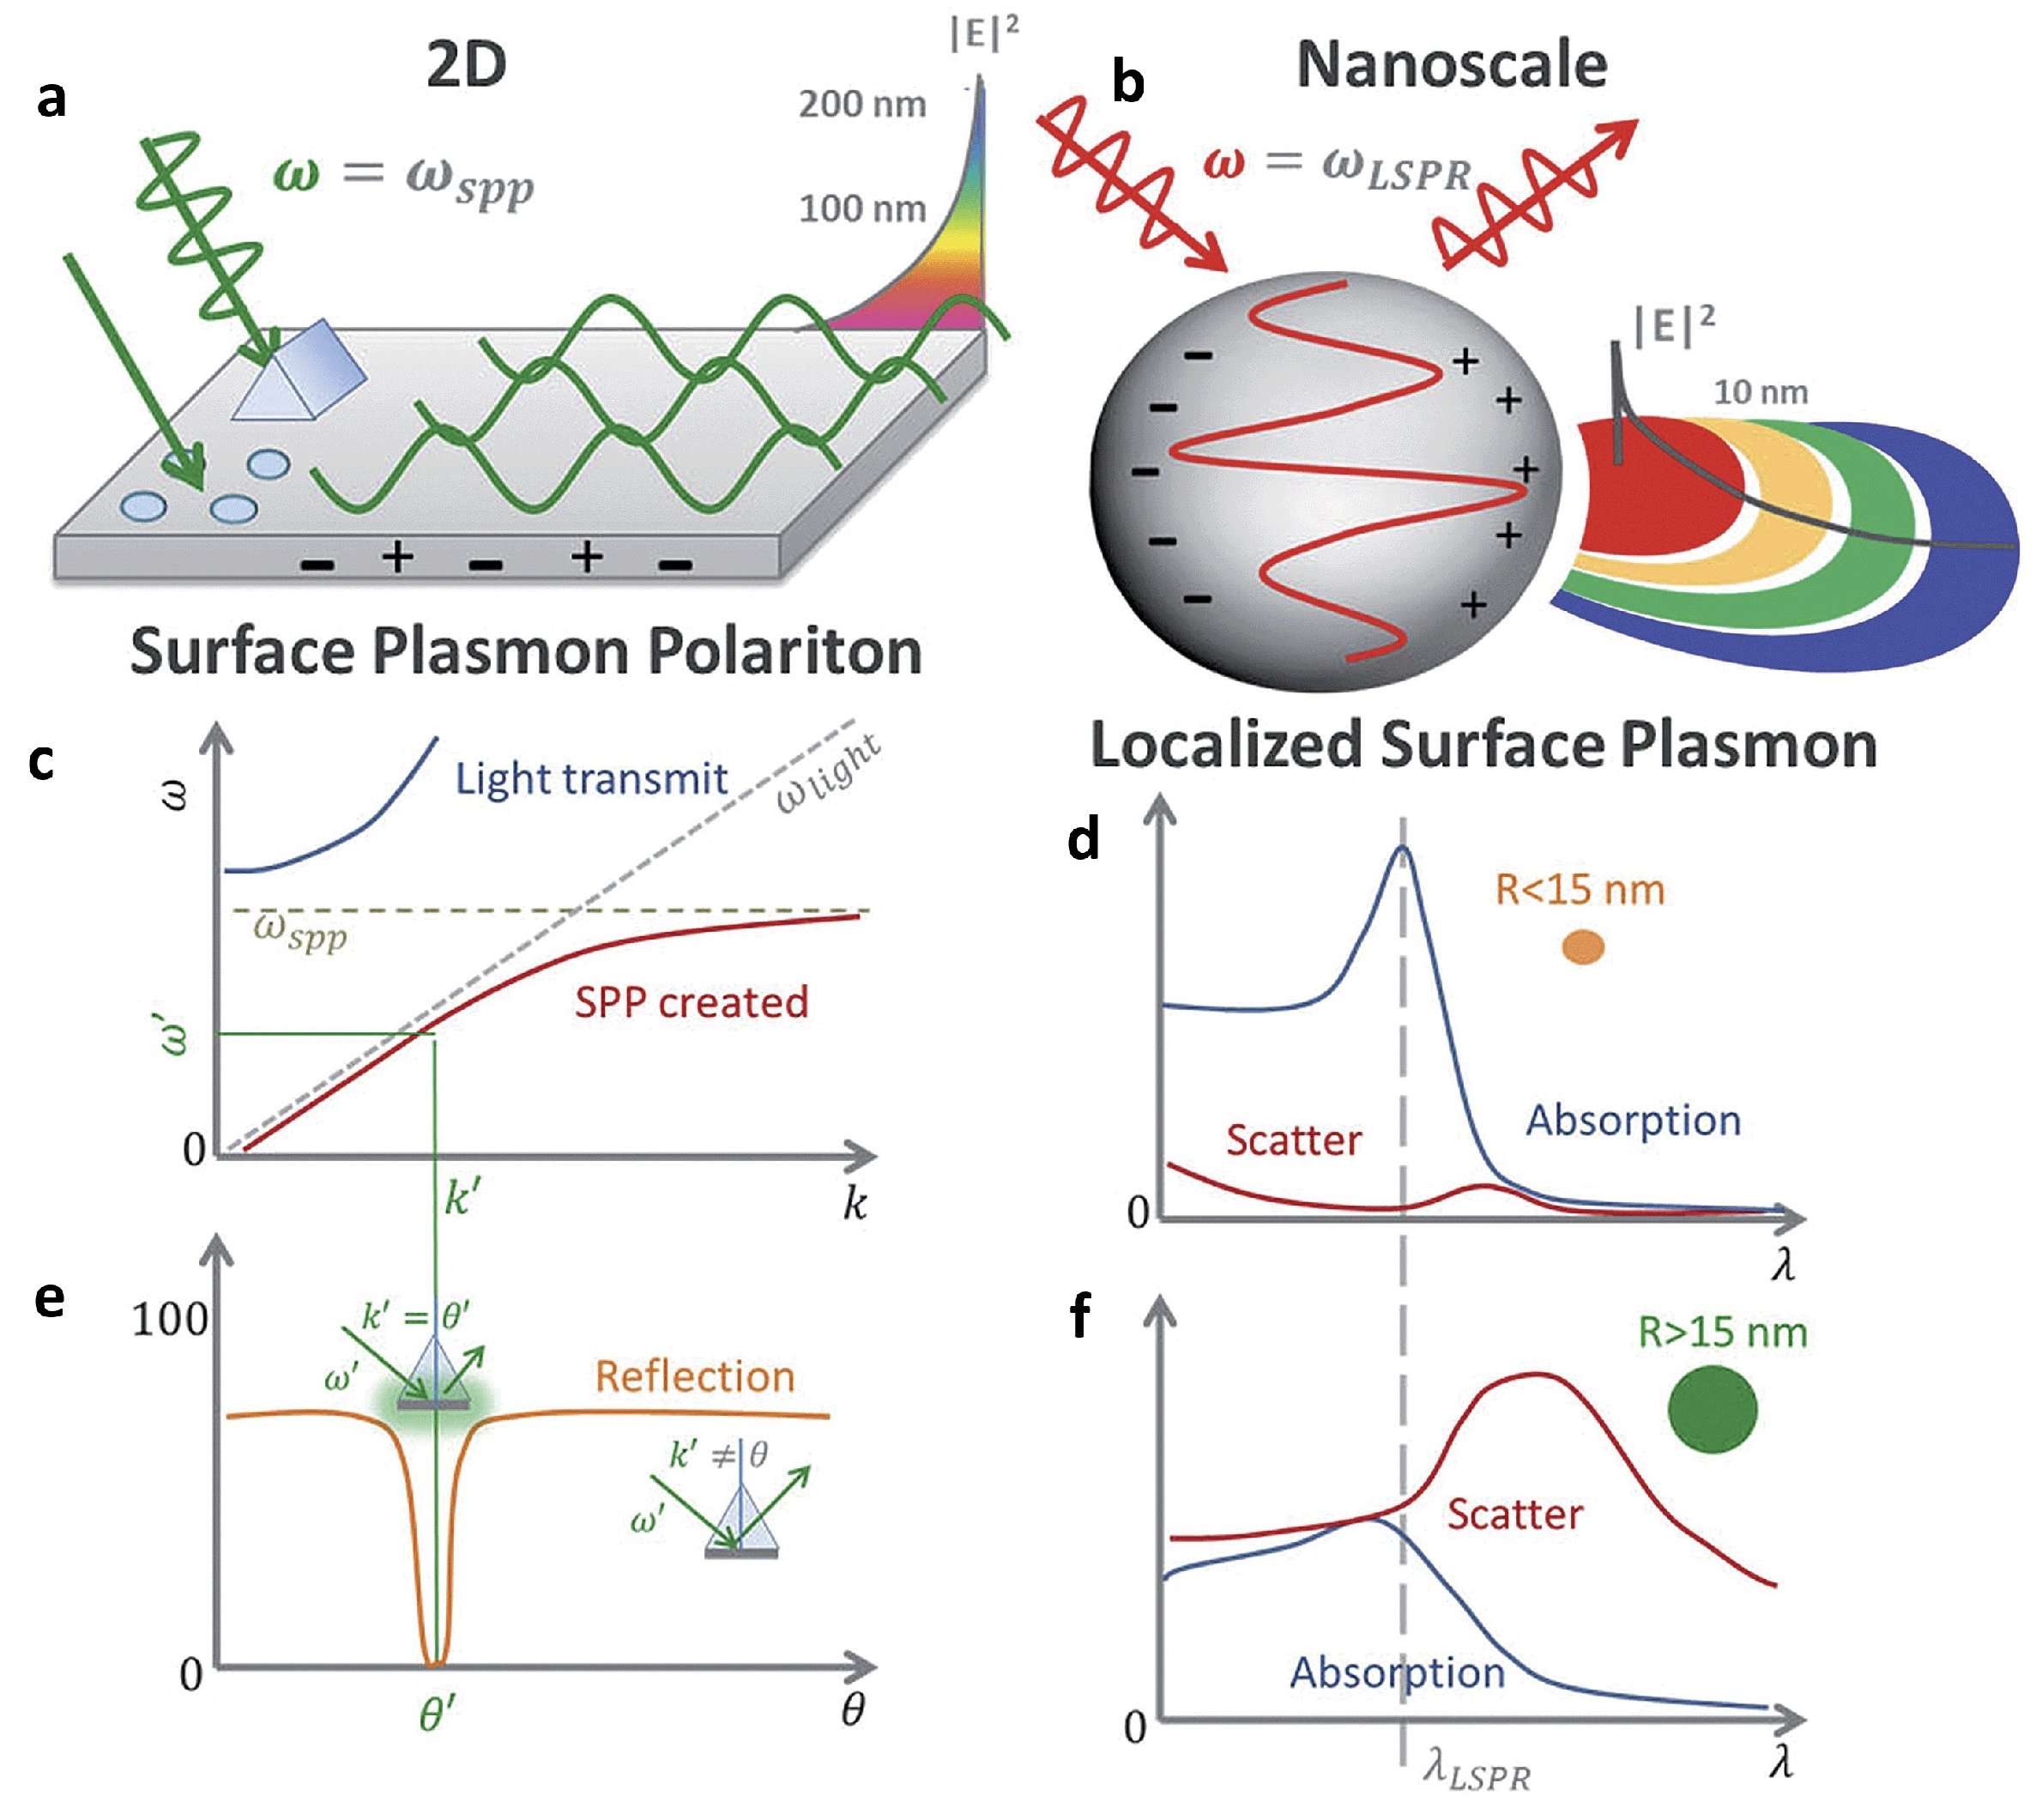
3.1. Fundamentals of Surface Plasmons
3.2. Plasmon-Enhanced Fluorescence (PEF)
3.2.1. Metal-Enhanced Fluorescence (MEF)
3.2.2. Plasmonic Photonic Crystal-Induced Fluorescence Enhancement (PPCIFE)
3.3. Photonic Crystal-Based Fluorescence Enhancement
3.4. Hydrogel-Based Fluorescence Enhancement
3.5. Other Enhancement Methods
4. Diagnostics by Plasmonic Fluorescence Sensors

| Enhancement Type | Process | Enhancement Factor * | References |
|---|---|---|---|
| MEF | SPCE | 30 and 110 times compared to normal SPCE and free space emission respectively | [178] |
| MEF | Nanosphere lithography for 3D Au-NHDAs | Over 400 times | [182] |
| MEF | Plasmonic Antenna Arrays | – times | [185] |
| MEF | TiO2 adhesion layer | 25 times | [186] |
| MEF | Metallic Nanoparticles | Over 50 times | [173] |
| MEF | Plasmonic Metasurfaces | 423 times | [249] |
| MEF | 2-color DNA assay | 1000 times | [176] |
| MEF | Plasmonic Nanodots | 2970 on average and times at hotspots | [190] |
| PPCIFE | Combining Ag plasmon with PCs | Upto 150 times | [196] |
| PPCIFE | Combining AuNPs with SPCMs | 20 times | [197] |
| PPCIFE | PCs coupled emission | 1200 times | [198] |
| PPCIFE | Lattice Arrangement with Au film | 40 times per molecule | [199] |
| PPCIFE | Combining plasmonic fluor NPs and PCs with a fluorescent dye | 52 times | [200] |
| PPCIFE | Hybrid Ag and hydrophobic 3D PCs | 87 times | [201] |
| PCs Based | CPCs coupling | 1000 times | [207] |
| PCs Based | CoFe2O4@SiO2@Ag CPCs | 12.6 and 17.6 times for RB and FITC, respectively | [209] |
| PCs Based | Sandwiched crystal using Al2O3 and TiO2 | Upto 60 times | [210] |
| PCs Based | TiO2 in conjunction with 2D PCs | 10 times | [211] |
| Hydrogel Based | Fructose exposure | 10 times | [220] |
4.1. Viral Infections
4.1.1. COVID-19
4.1.2. Influenza Virus
4.1.3. Human Immunodeficiency Virus (HIV) Infection
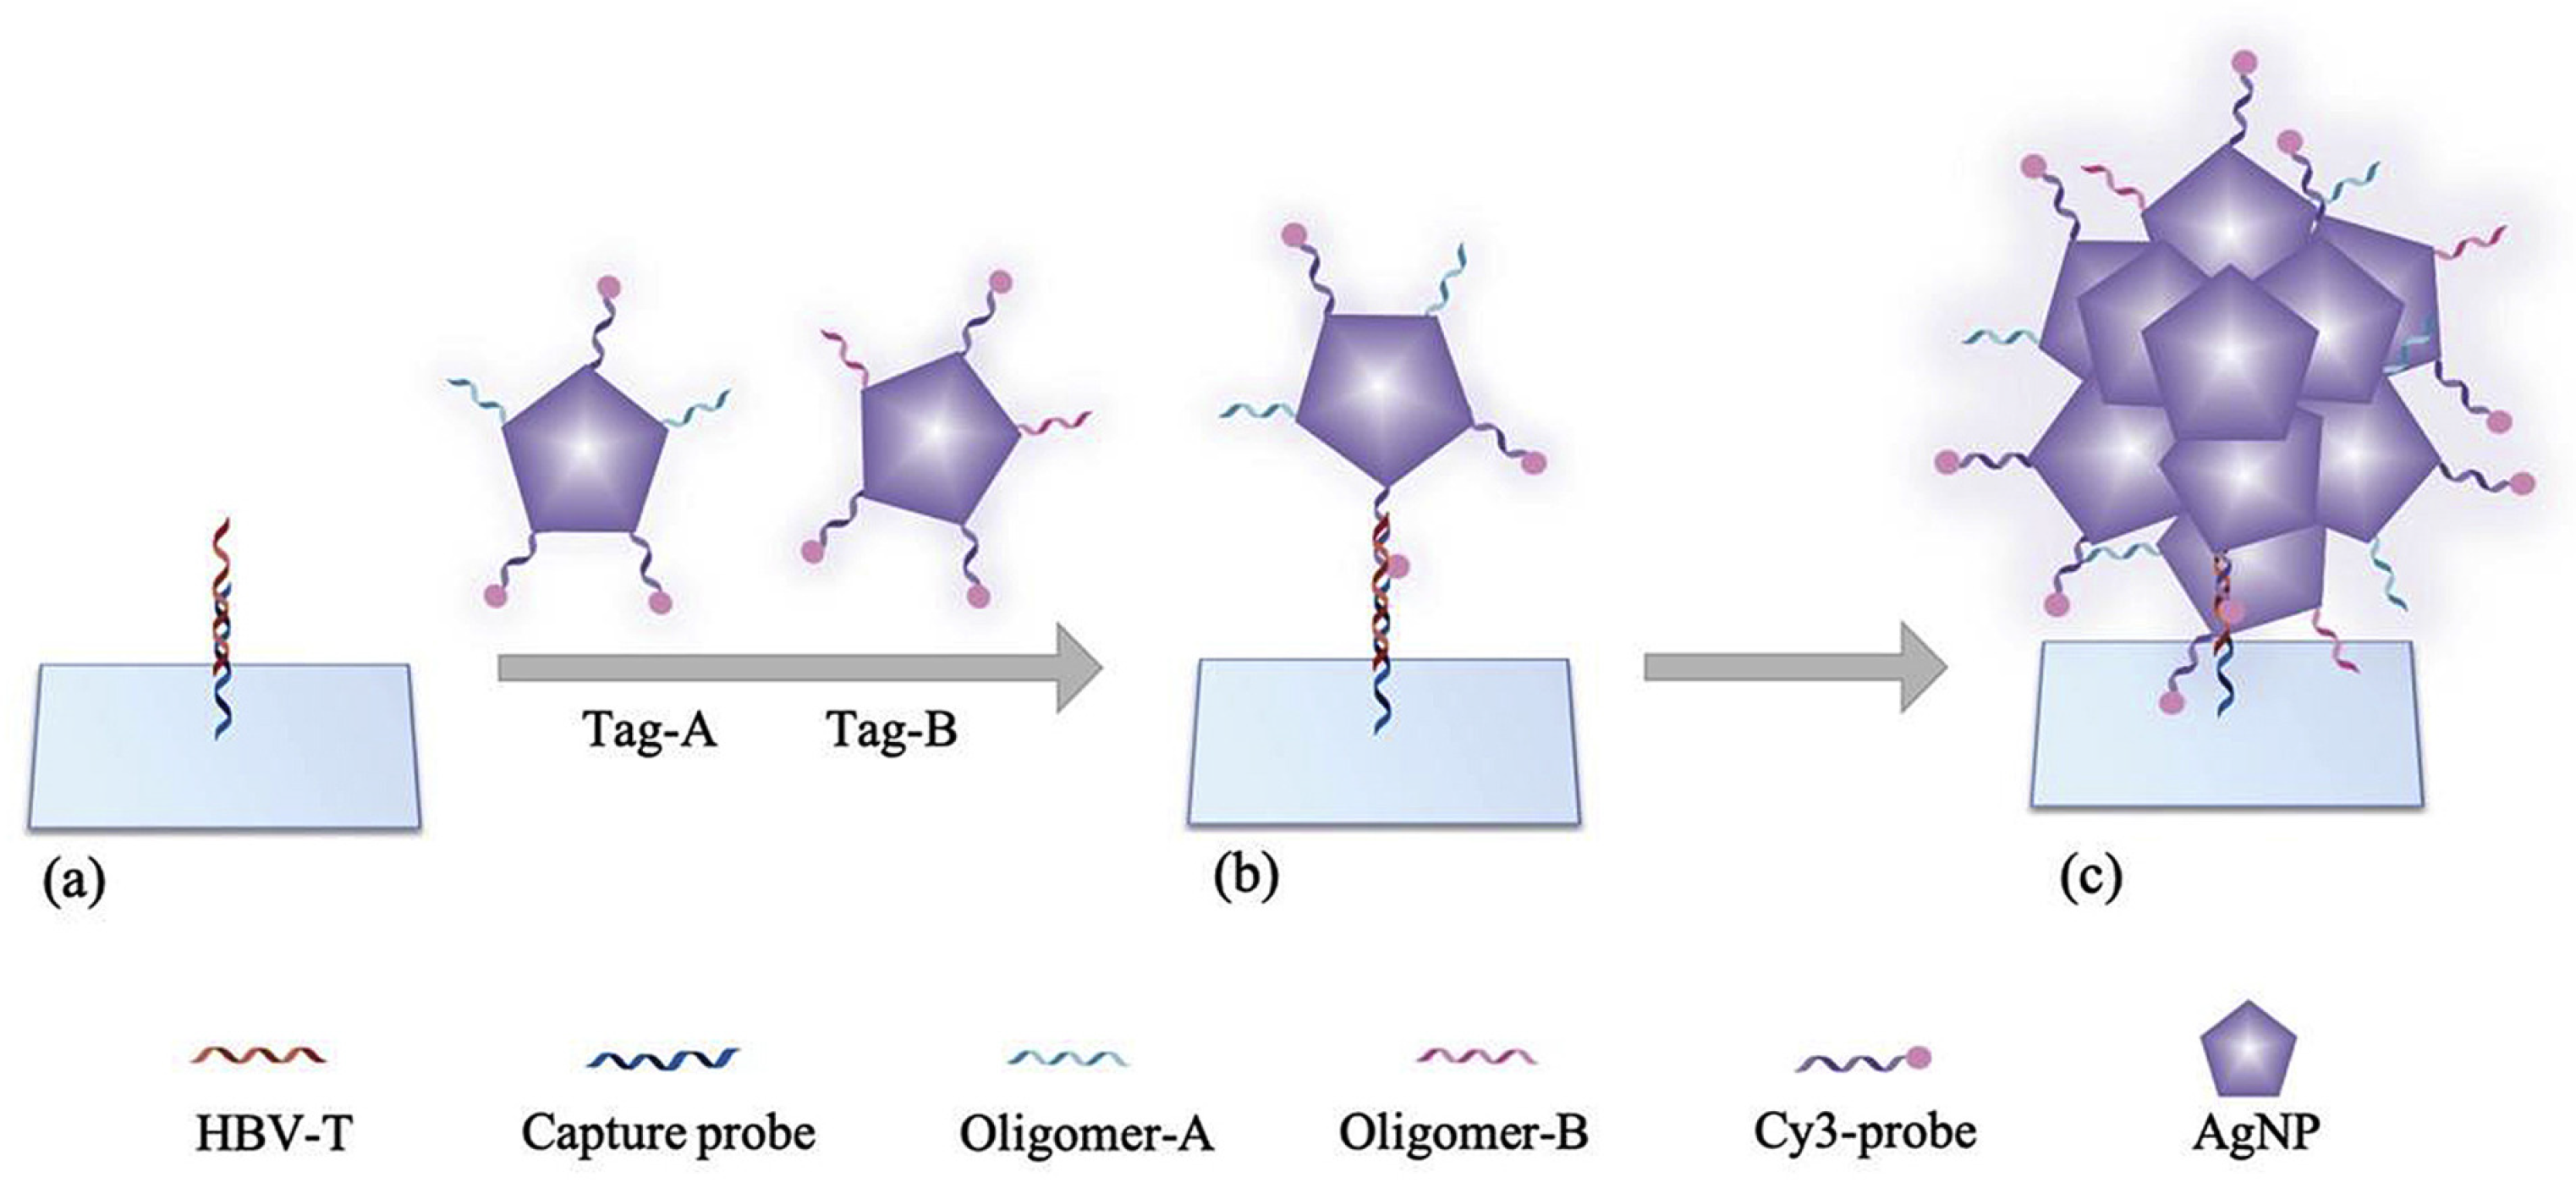
4.1.4. Hepatitis
4.1.5. Ebola
4.1.6. Dengue
4.2. Bacterial Infections
4.2.1. Tuberculosis (TB)
4.2.2. Cholera
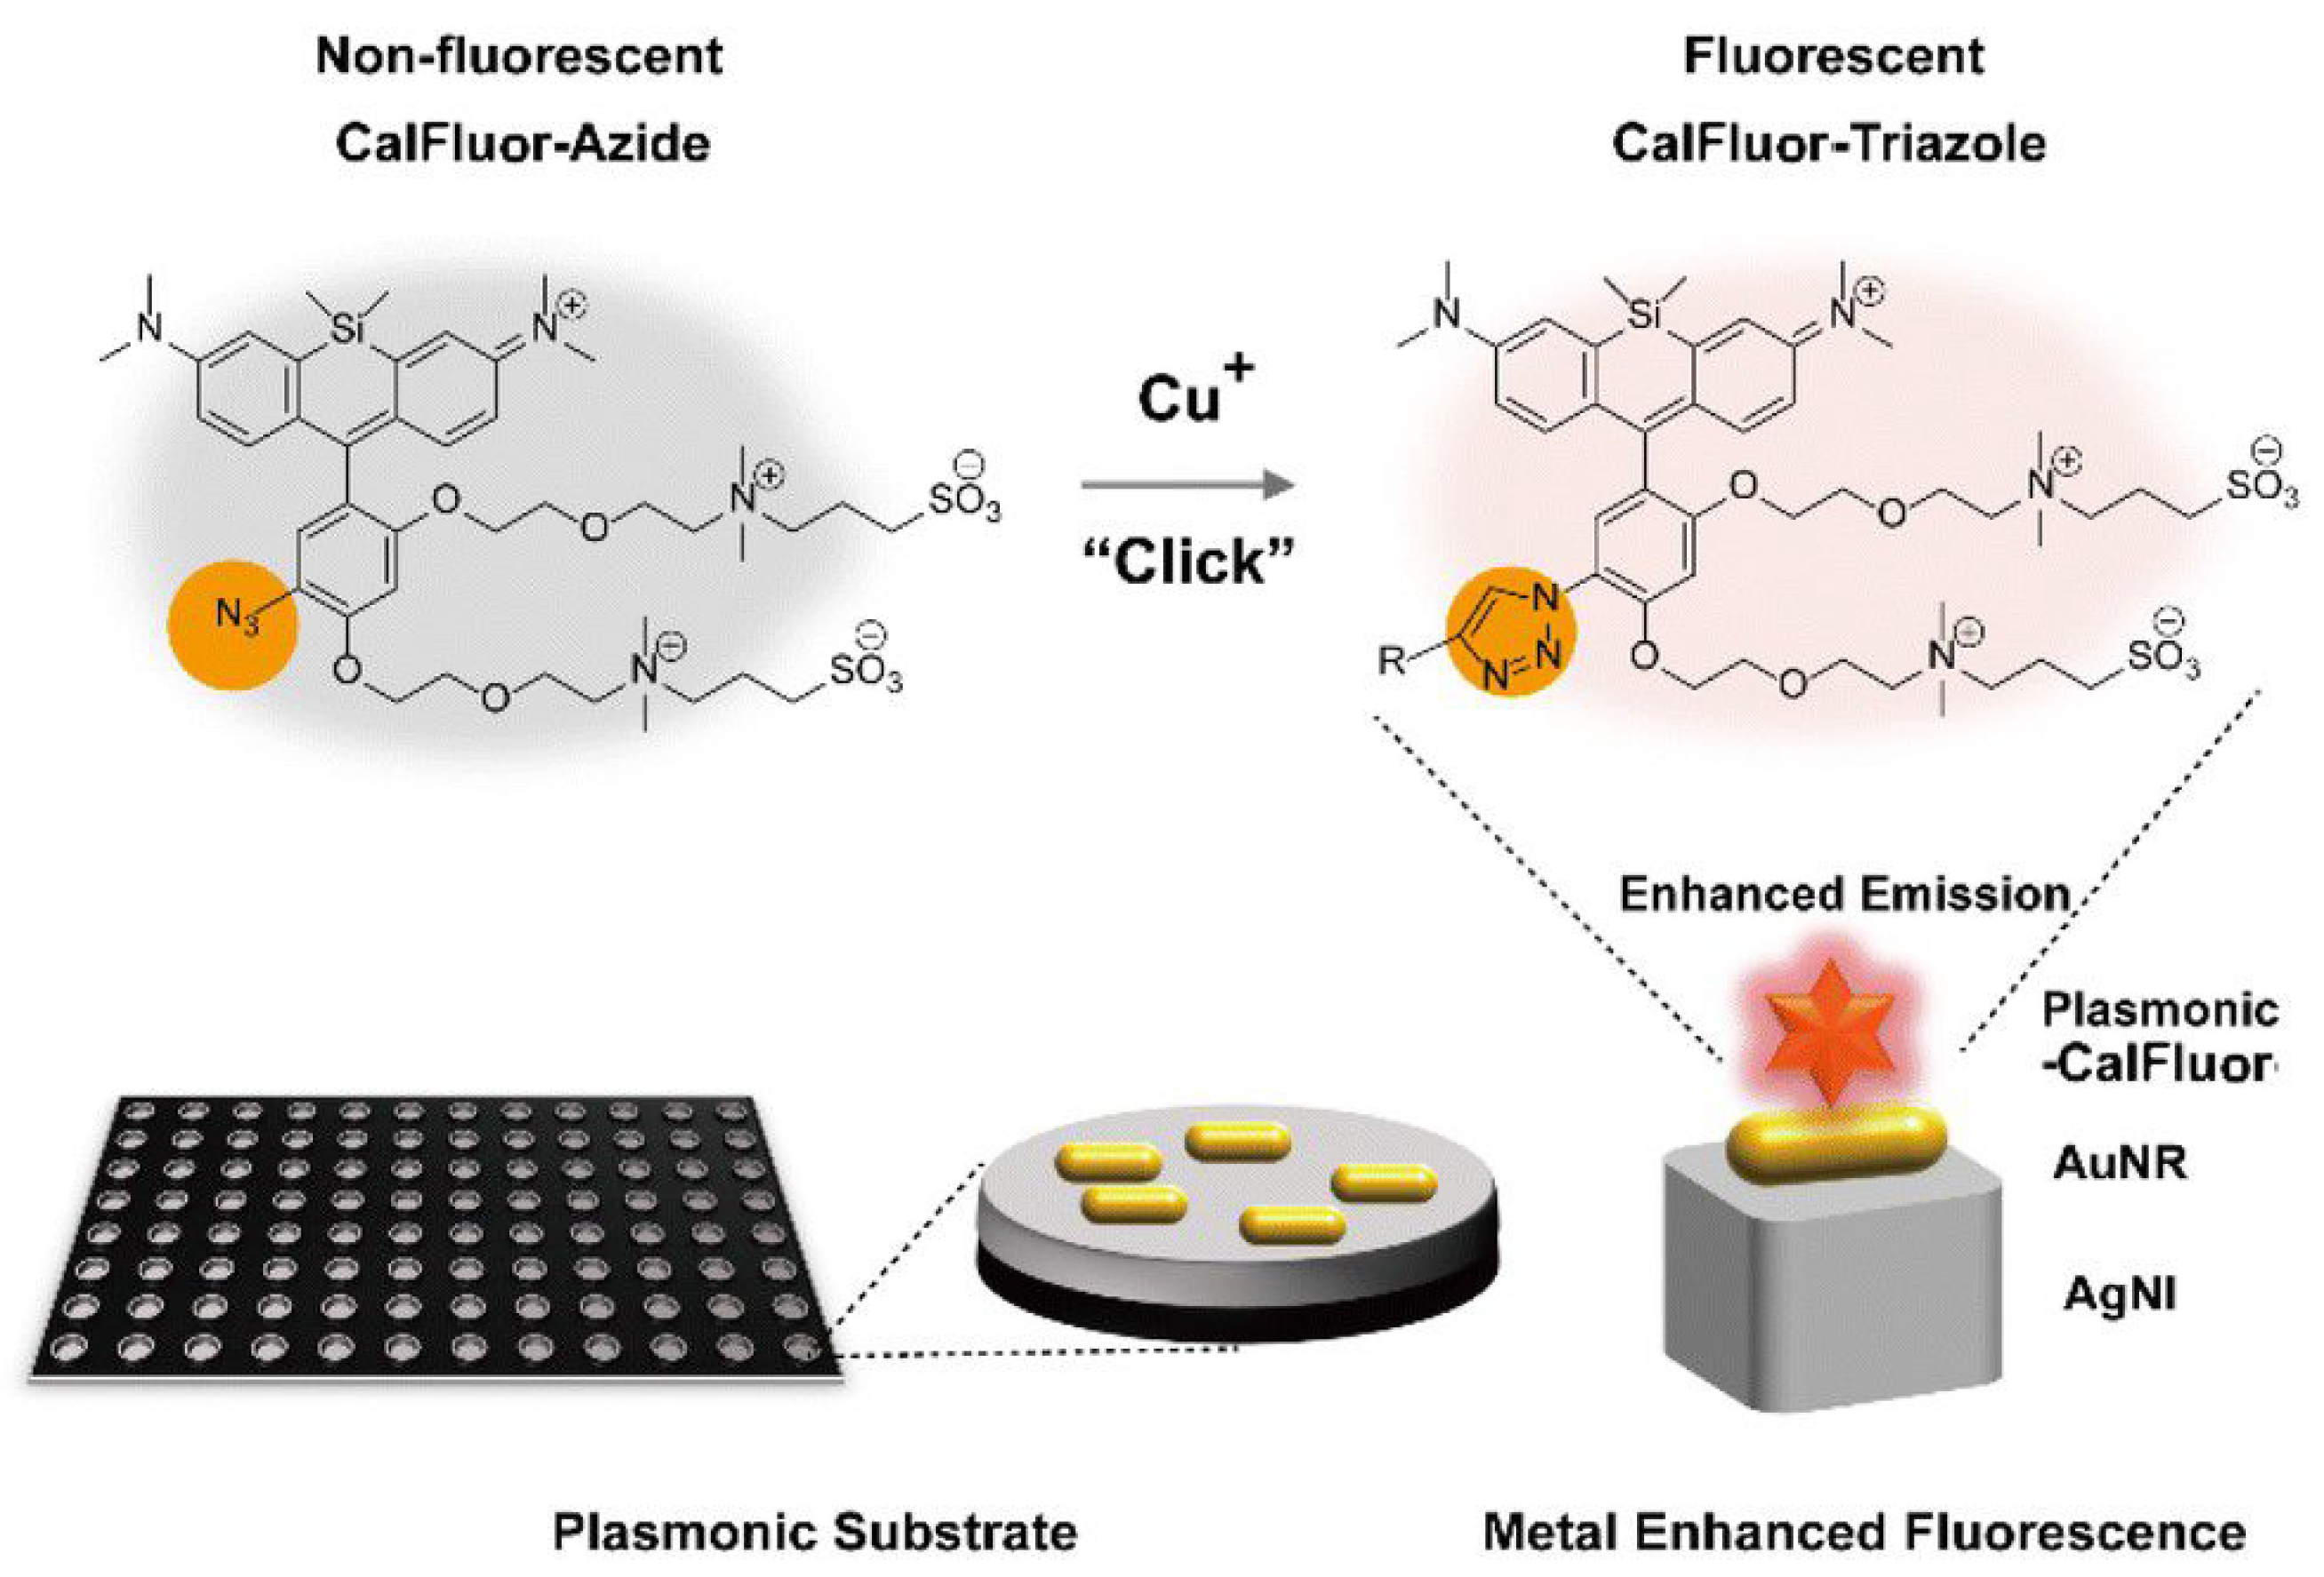
4.2.3. Urinary Tract Infections (UTIs)
| Disease | Analyte | Detection Method | LOD | References |
|---|---|---|---|---|
| COVID-19 | SARS-CoV-2 RNA | Multiplexed qPCR (RT-qPCR) | (2.2–4.4) copies per | [250] |
| COVID-19 | SARS-CoV-2 RNA | Triple-mode biosensing | 259 fM | [253] |
| Influenza Virus | Influenza A (H1N1) | localized surface plasmon coupled fluorescence | 13.9 pg/mL | [254] |
| Influenza Virus | Influenza A (H1N1) | LSPR combined with fluorescence signal amplification | 0.03 pg/mL in DI water, 0.4 pg/mL in human serum | [255] |
| Influenza Virus | Influenza A (H3N2) | LSPR combined with fluorescence signal amplification | 10 PFU/mL | [255] |
| Influenza Virus | Influenza A (H5N1) | MEF | 2 ng/mL in aqueous buffer, 3.5 ng/mL in human serum | [256] |
| HIV | HIV DNA | Single-molecule fluorescence | 0.83 fM | [258] |
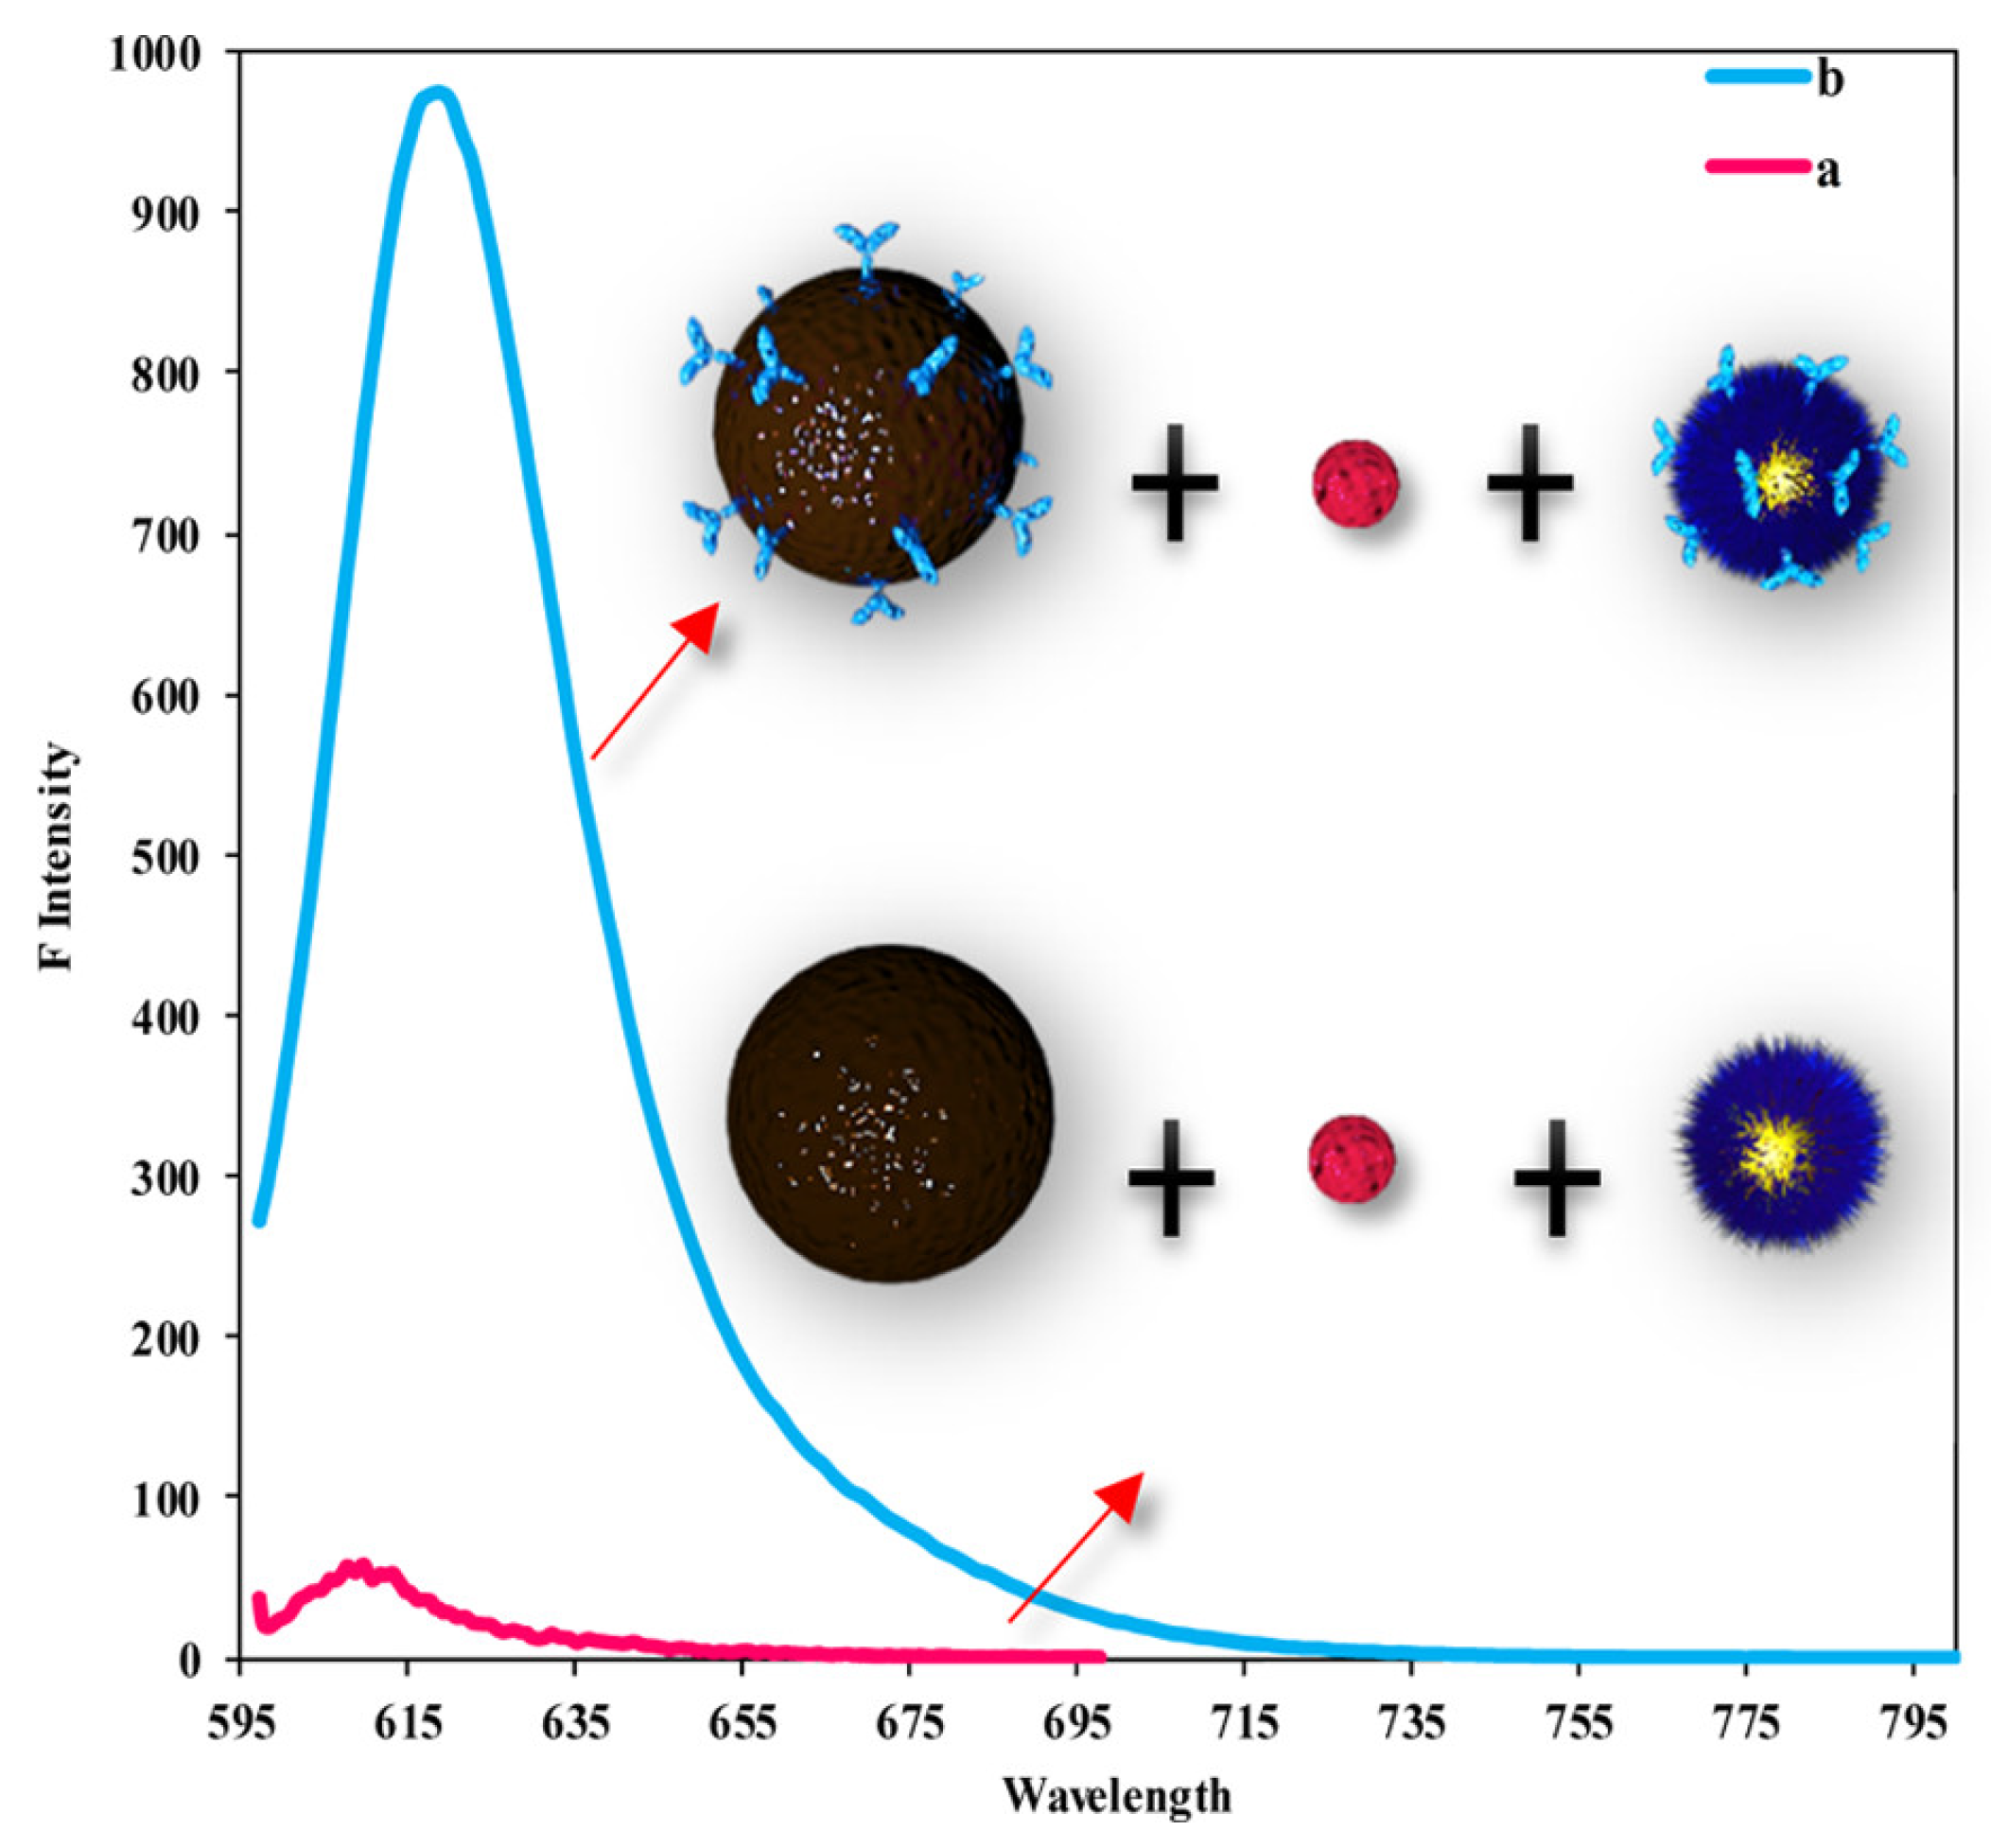
| HIV | HIV-1 p24 | MEF | 0.19 pg mL−1 | [259] |
| Hepatitis | HBV DNA | Fluorescence microarray | 50 fM | [260] |
| Hepatitis | HBsAg | Magneto-immunoassay | 4.6 | [262] |
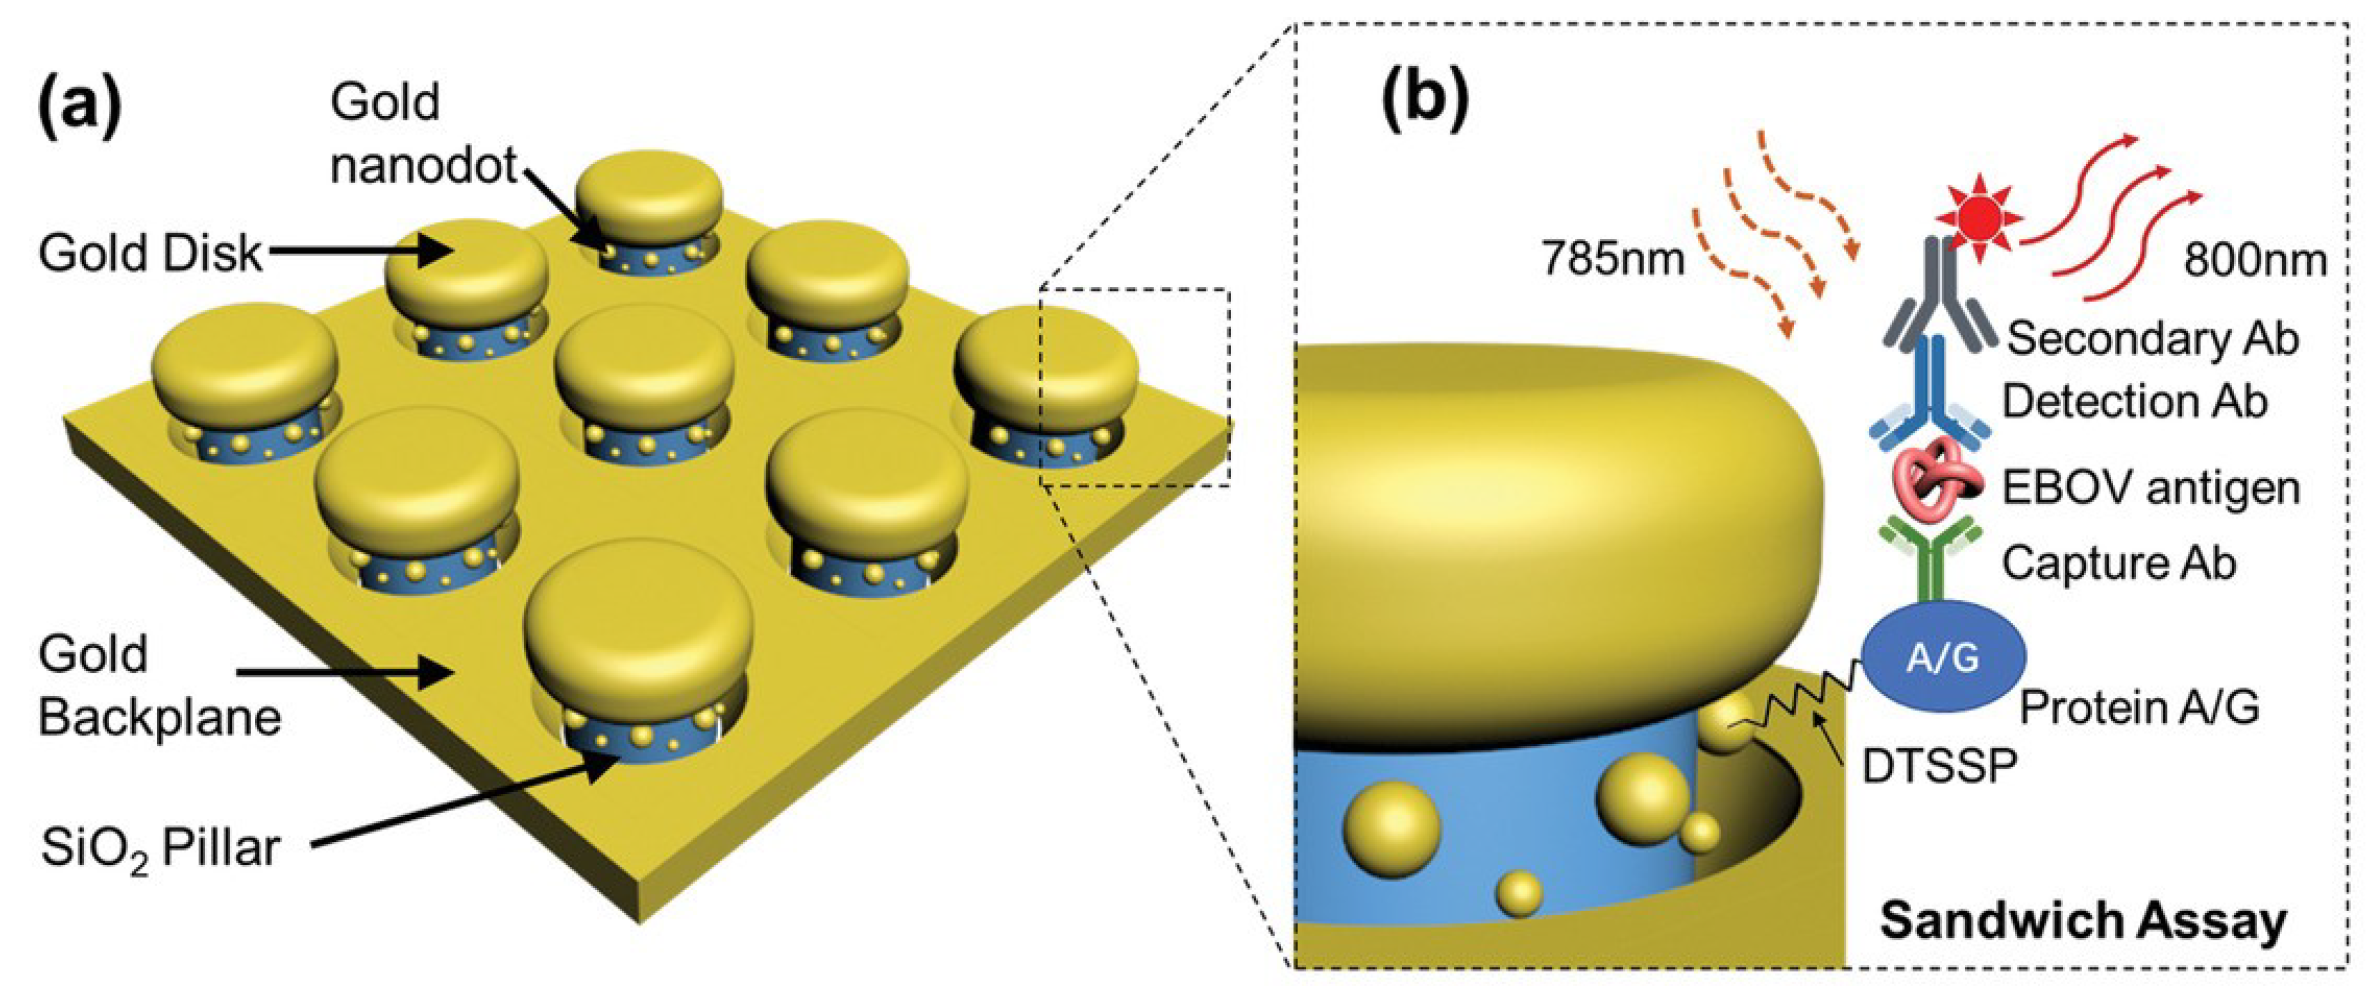
| Ebola | EBOV | On-chip immunoassay | 220 fg mL−1 | [263] |
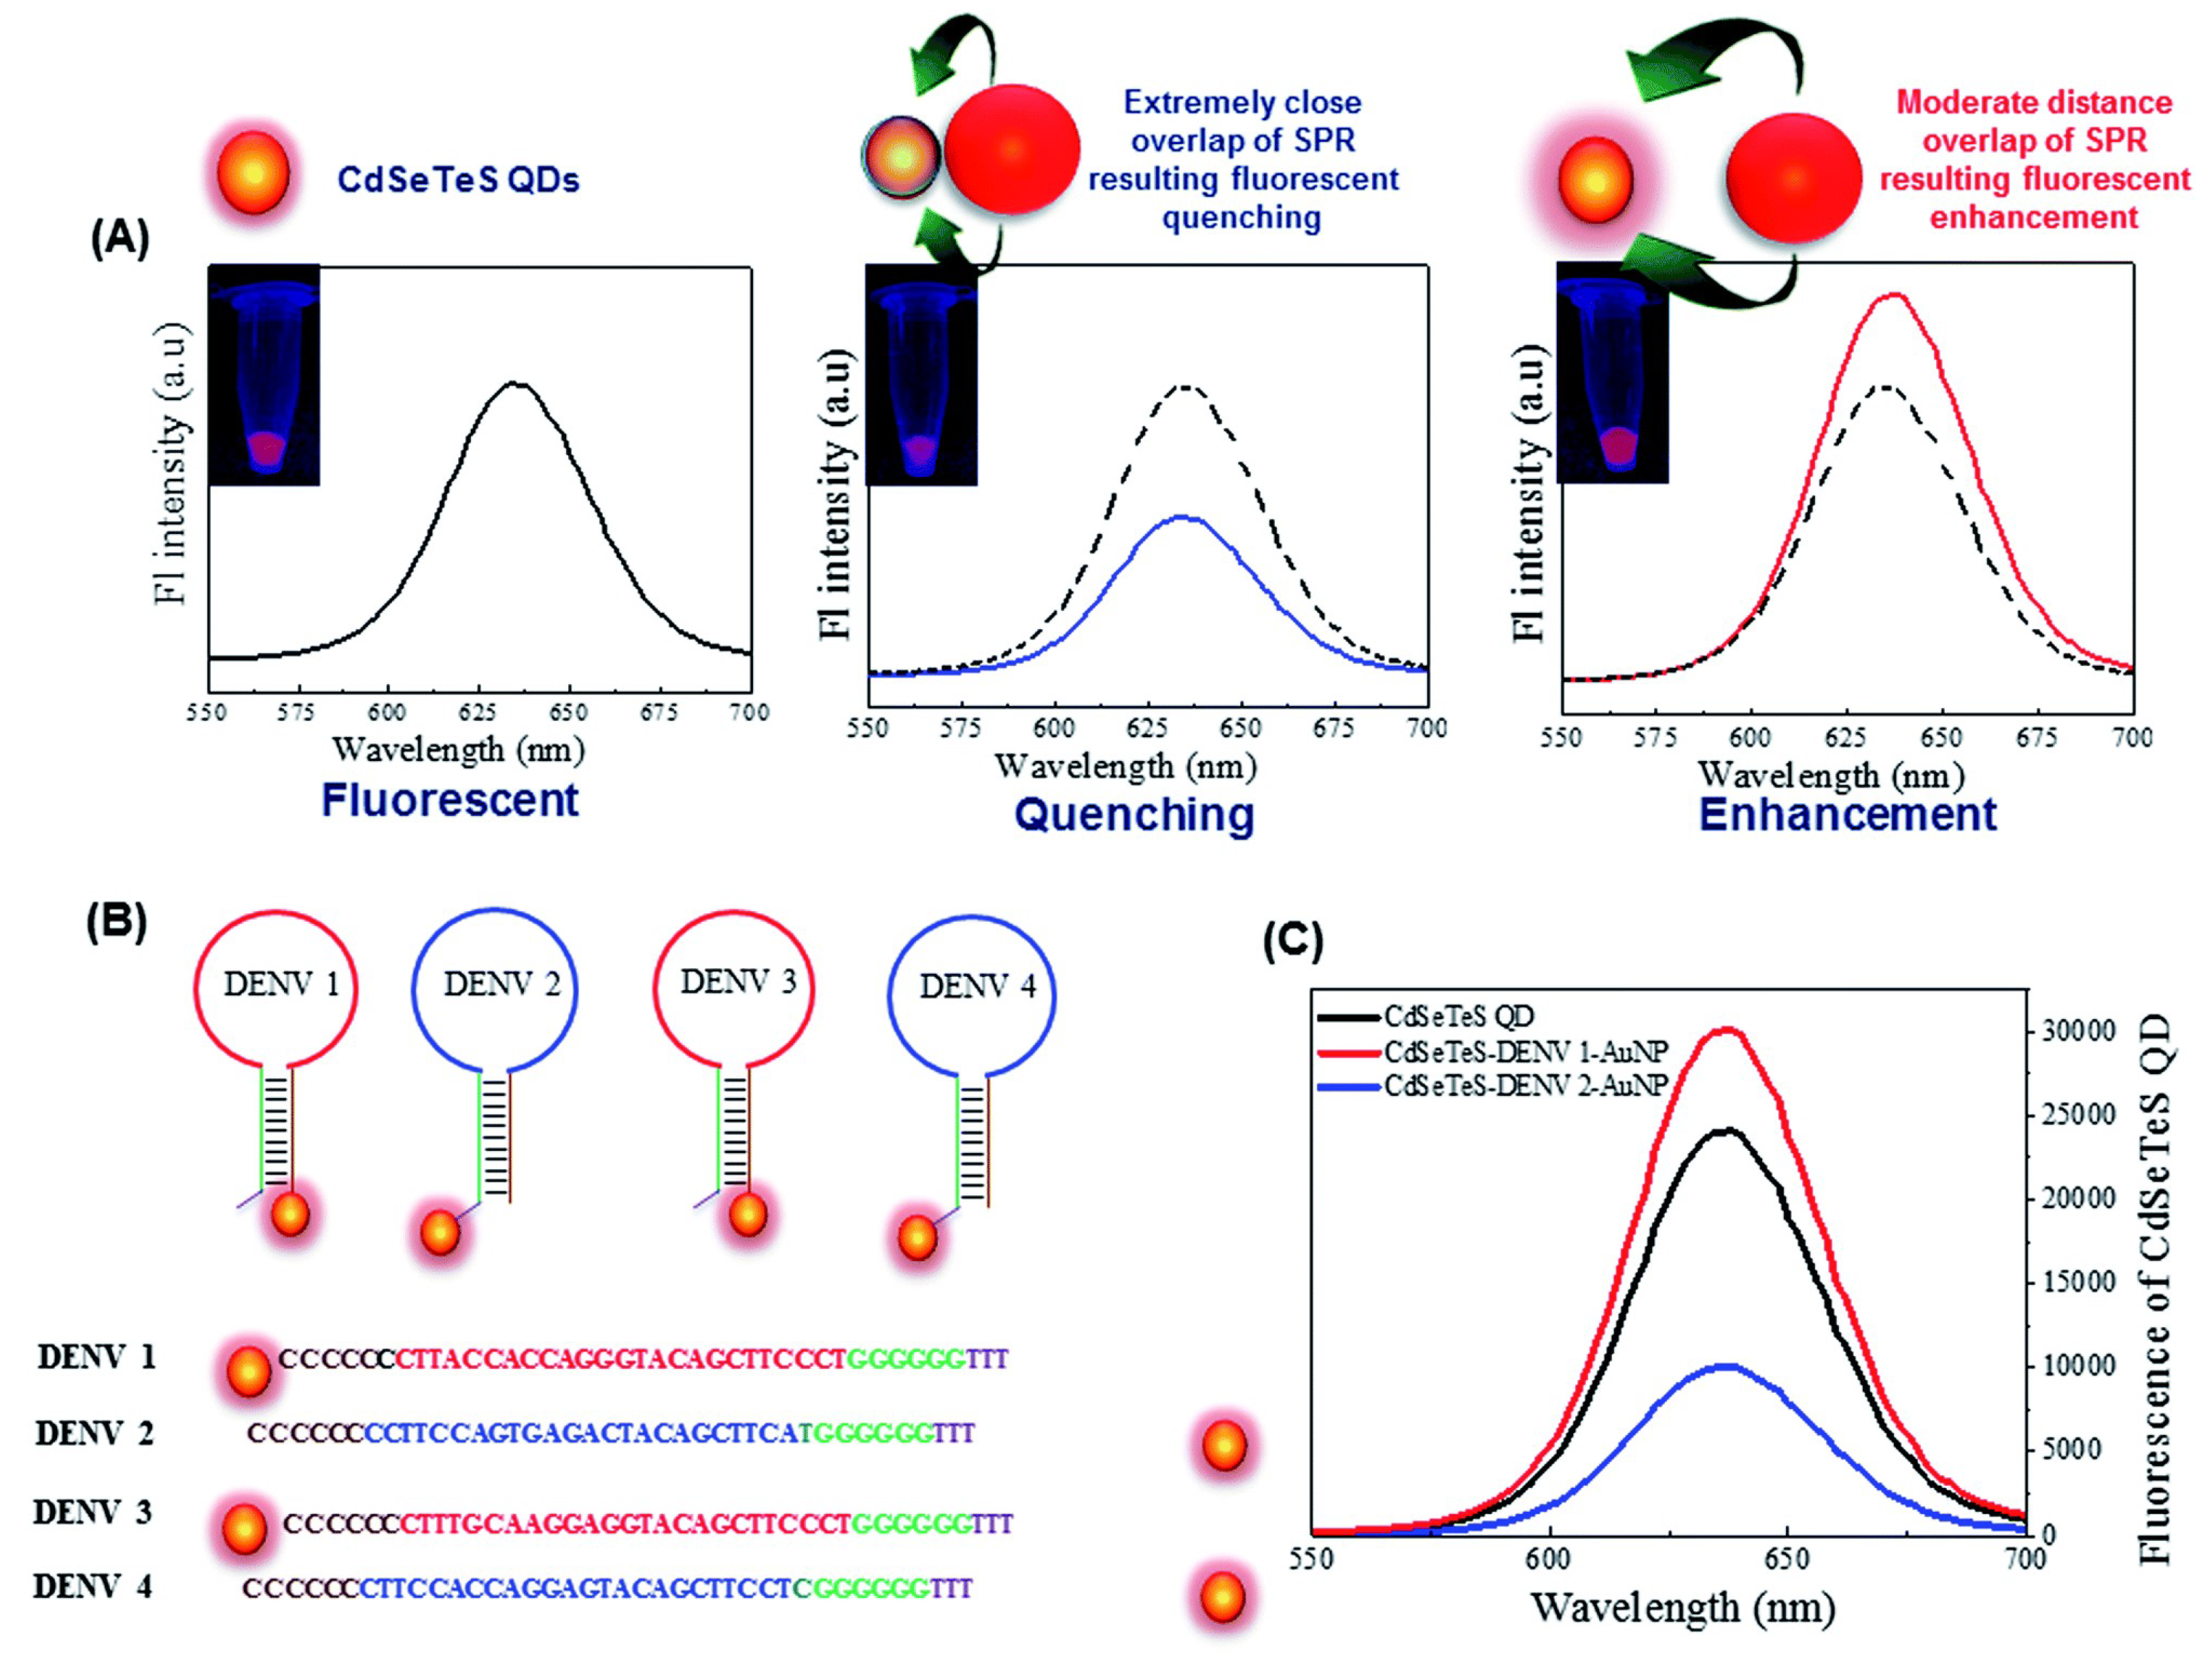
| Dengue | DENVs (1–4) | LSPR | 24.6, 11.4, 39.8 and 39.7 fM for DENVs 1, 2, 3 and 4 | [264] |
| Dengue | DENVs (1–4) | LSPR | 31 to 260 copies per mL | [265] |
| Dengue | IgM | SEF | 10 ng mL−1 | [266] |
| Dengue | DENVs (1–4) | N,S-GQDs@AuNP nanoassembly | 9.4 fM | [268] |
| Disease | Analyte | Detection Method | LOD | References |
|---|---|---|---|---|
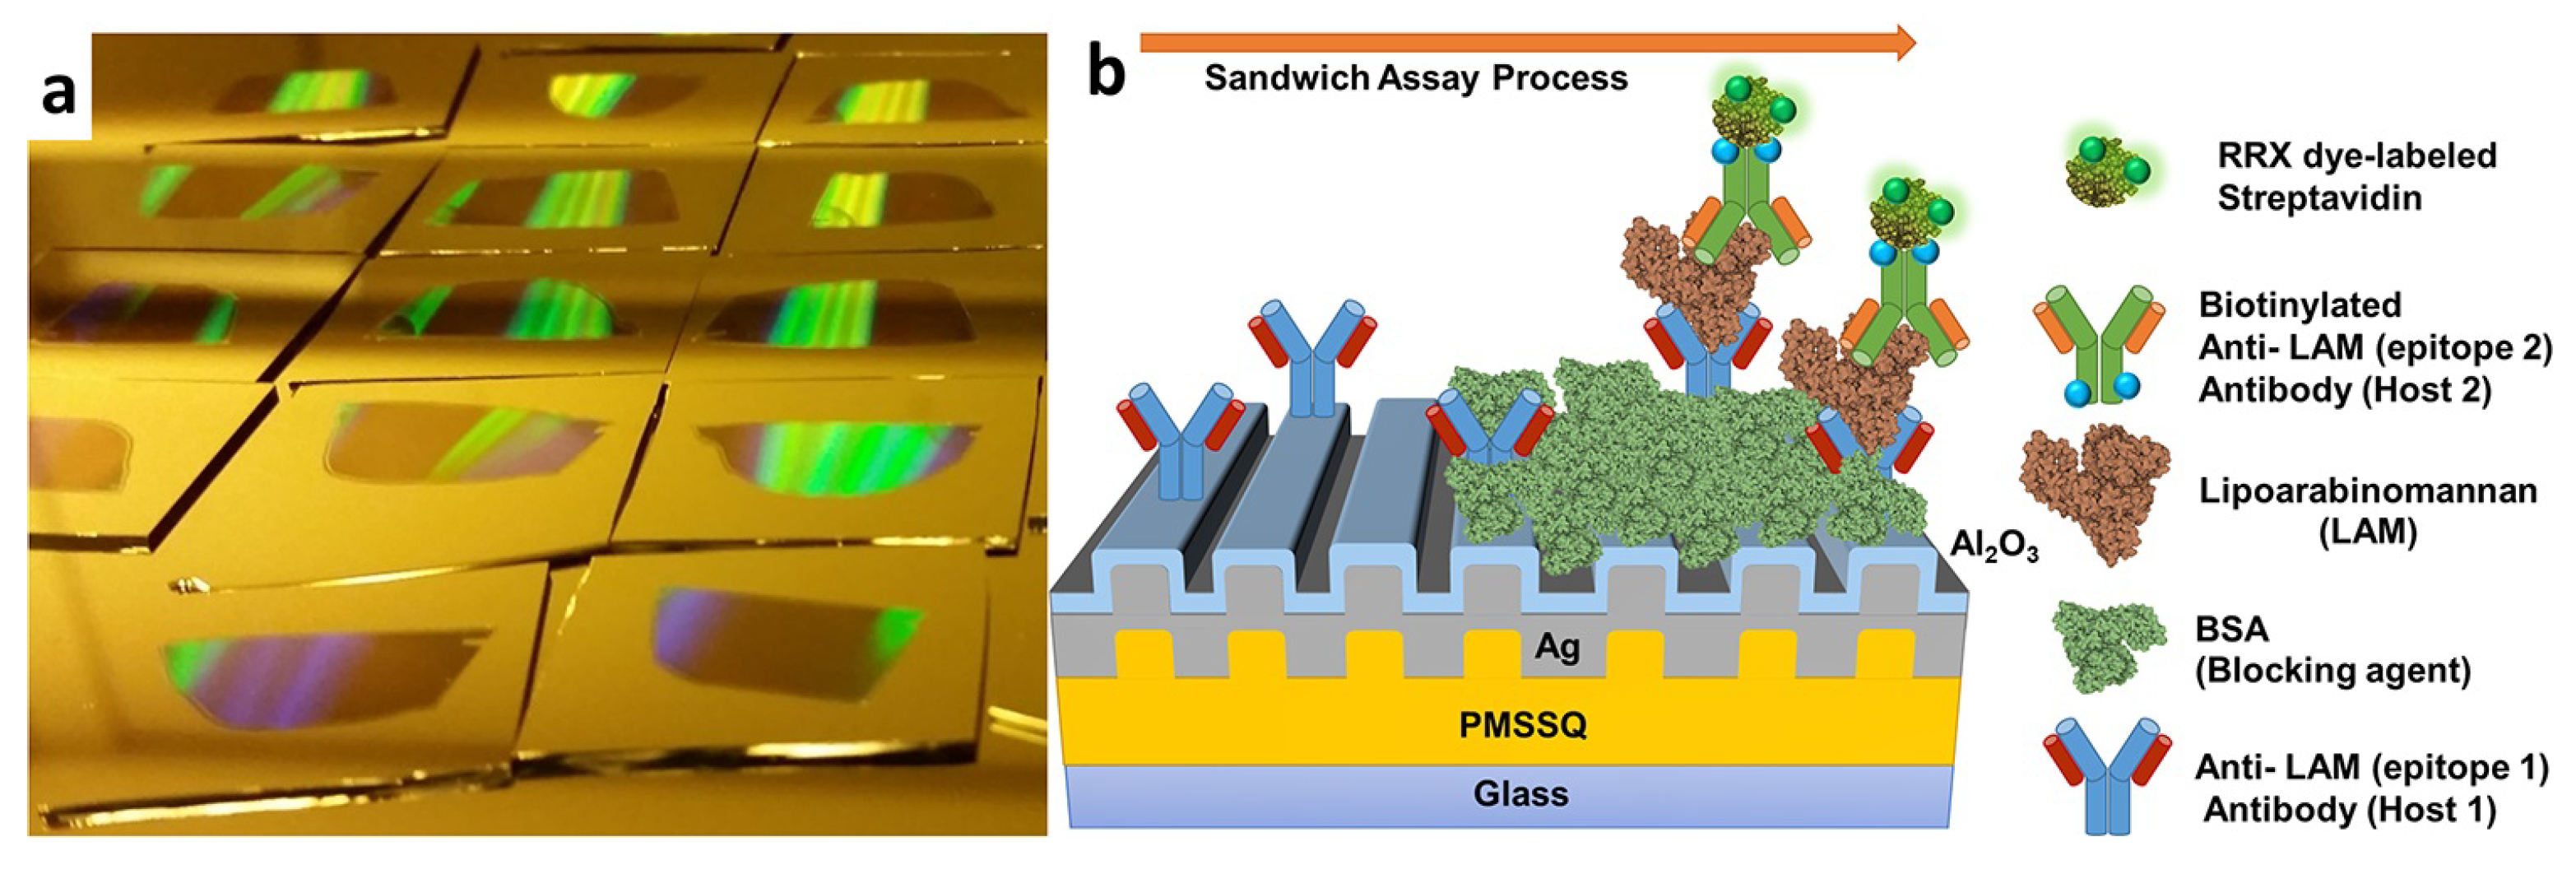
| Tuberculosis | LAM | FLISA | 1 fg mL−1 | [126] |
| Tuberculosis | IFN | Immunofluorescence assay | 500 fg mL−1 | [269] |
| Cholera | O1 OmpW gene | Fluorescent assay | 2.34 ng mL−1 | [270] |
| UTIs | E. coli | Cu-catalyzed click reaction | 3.87 nM | [271] |
5. Perspective and Future Directions
Author Contributions
Funding
Data Availability Statement
Conflicts of Interest
References
- Wang, C.; Liu, M.; Wang, Z.; Li, S.; Deng, Y.; He, N. Point-of-care diagnostics for infectious diseases: From methods to devices. Nano Today 2021, 37, 101092. [Google Scholar] [CrossRef] [PubMed]
- Espinosa, R.; Tago, D.; Treich, N. Infectious diseases and meat production. Environ. Resour. Econ. 2020, 76, 1019–1044. [Google Scholar] [CrossRef] [PubMed]
- Fonkwo, P.N. Pricing infectious disease: The economic and health implications of infectious diseases. Embo Rep. 2008, 9, S13–S17. [Google Scholar] [CrossRef]
- Morens, D.M.; Folkers, G.K.; Fauci, A.S. The challenge of emerging and re-emerging infectious diseases. Nature 2004, 430, 242–249. [Google Scholar] [CrossRef] [PubMed]
- Smith, K.M.; Machalaba, C.C.; Seifman, R.; Feferholtz, Y.; Karesh, W.B. Infectious disease and economics: The case for considering multi-sectoral impacts. One Health 2019, 7, 100080. [Google Scholar] [CrossRef] [PubMed]
- Bloom, D.E.; Kuhn, M.; Prettner, K. Modern infectious diseases: Macroeconomic impacts and policy responses. J. Econ. Lit. 2022, 60, 85–131. [Google Scholar] [CrossRef]
- Xiang, X.; Qian, K.; Zhang, Z.; Lin, F.; Xie, Y.; Liu, Y.; Yang, Z. CRISPR-cas systems based molecular diagnostic tool for infectious diseases and emerging 2019 novel coronavirus (COVID-19) pneumonia. J. Drug Target. 2020, 28, 727–731. [Google Scholar] [CrossRef]
- Heesterbeek, H.; Anderson, R.M.; Andreasen, V.; Bansal, S.; De Angelis, D.; Dye, C.; Eames, K.T.; Edmunds, W.J.; Frost, S.D.; Funk, S.; et al. Modeling infectious disease dynamics in the complex landscape of global health. Science 2015, 347, aaa4339. [Google Scholar] [CrossRef]
- Santhanam, M.; Algov, I.; Alfonta, L. DNA/RNA electrochemical biosensing devices a future replacement of PCR methods for a fast epidemic containment. Sensors 2020, 20, 4648. [Google Scholar] [CrossRef]
- Wang, X.; Hong, X.Z.; Li, Y.W.; Li, Y.; Wang, J.; Chen, P.; Liu, B.F. Microfluidics-based strategies for molecular diagnostics of infectious diseases. Mil. Med. Res. 2022, 9, 1–27. [Google Scholar] [CrossRef]
- Arya, S.K.; Estrela, P. Electrochemical ELISA-based platform for bladder cancer protein biomarker detection in urine. Biosens. Bioelectron. 2018, 117, 620–627. [Google Scholar] [CrossRef] [PubMed]
- Jalali, M.; Zaborowska, J.; Jalali, M. The polymerase chain reaction: PCR, qPCR, and RT-PCR. In Basic Science Methods for Clinical Researchers; Academic Press: Cambridge, MA, USA, 2017; pp. 1–18. [Google Scholar]
- Liu, W.; Yue, F.; Lee, L.P. Integrated point-of-care molecular diagnostic devices for infectious diseases. Acc. Chem. Res. 2021, 54, 4107–4119. [Google Scholar] [CrossRef] [PubMed]
- Mahapatra, S.; Baranwal, A.; Purohit, B.; Roy, S.; Mahto, S.K.; Chandra, P. Advanced biosensing methodologies for ultrasensitive detection of human coronaviruses. In Diagnostic Strategies for COVID-19 and Other Coronaviruses; Springer: Singapore, 2020; pp. 19–36. [Google Scholar]
- Sailapu, S.K.; Macchia, E.; Merino-Jimenez, I.; Esquivel, J.P.; Sarcina, L.; Scamarcio, G.; Minteer, S.D.; Torsi, L.; Sabaté, N. Standalone operation of an EGOFET for ultra-sensitive detection of HIV. Biosens. Bioelectron. 2020, 156, 112103. [Google Scholar] [CrossRef] [PubMed]
- Hasan, J.; Bok, S. Plasmonic Grating Based Biosensors for Multiplexed Detection. In Proceedings of the 2023 IEEE 23rd International Conference on Nanotechnology (NANO), Jeju City, Republic of Korea, 2–5 July 2023; pp. 767–771. [Google Scholar]
- Li, Z.; Leustean, L.; Inci, F.; Zheng, M.; Demirci, U.; Wang, S. Plasmonic-based platforms for diagnosis of infectious diseases at the point-of-care. Biotechnol. Adv. 2019, 37, 107440. [Google Scholar] [CrossRef] [PubMed]
- Semeniak, D.; Cruz, D.F.; Chilkoti, A.; Mikkelsen, M.H. Plasmonic Fluorescence Enhancement in Diagnostics for Clinical Tests at Point-of-Care: A Review of Recent Technologies. Adv. Mater. 2022, 35, 2107986. [Google Scholar] [CrossRef] [PubMed]
- Park, D.H.; Choi, M.Y.; Choi, J.H. Recent Development in Plasmonic Nanobiosensors for Viral DNA/RNA Biomarkers. Biosensors 2022, 12, 1121. [Google Scholar] [CrossRef] [PubMed]
- Bloom, D.E.; Cadarette, D. Infectious disease threats in the twenty-first century: Strengthening the global response. Front. Immunol. 2019, 10, 549. [Google Scholar] [CrossRef]
- Van den Driessche, P. Reproduction numbers of infectious disease models. Infect. Dis. Model. 2017, 2, 288–303. [Google Scholar] [CrossRef]
- Rohr, J.R.; Barrett, C.B.; Civitello, D.J.; Craft, M.E.; Delius, B.; DeLeo, G.A.; Hudson, P.J.; Jouanard, N.; Nguyen, K.H.; Ostfeld, R.S.; et al. Emerging human infectious diseases and the links to global food production. Nat. Sustain. 2019, 2, 445–456. [Google Scholar] [CrossRef]
- Beutler, B.; Eidenschenk, C.; Crozat, K.; Imler, J.L.; Takeuchi, O.; Hoffmann, J.A.; Akira, S. Genetic analysis of resistance to viral infection. Nat. Rev. Immunol. 2007, 7, 753–766. [Google Scholar] [CrossRef]
- Virgin, H.W.; Wherry, E.J.; Ahmed, R. Redefining Chronic Viral Infection. Cell 2009, 138, 30–50. [Google Scholar] [CrossRef]
- Kawai, T.; Akira, S. Innate immune recognition of viral infection. Nat. Immunol. 2006, 7, 131–137. [Google Scholar] [CrossRef] [PubMed]
- Drakesmith, H.; Prentice, A. Viral infection and iron metabolism. Nat. Rev. Microbiol. 2008, 6, 541–552. [Google Scholar] [CrossRef] [PubMed]
- Shereen, M.A.; Khan, S.; Kazmi, A.; Bashir, N.; Siddique, R. COVID-19 infection: Emergence, transmission, and characteristics of human coronaviruses. J. Adv. Res. 2020, 24, 91–98. [Google Scholar] [CrossRef] [PubMed]
- World Health Organization. COVID-19 Dashboard. Available online: https://data.who.int/dashboards/covid19/cases?n=c (accessed on 3 December 2023).
- Shi, Y.; Wang, G.; Cai, X.p.; Deng, J.w.; Zheng, L.; Zhu, H.h.; Zheng, M.; Yang, B.; Chen, Z. An overview of COVID-19. J. Zhejiang Univ. Sci. 2020, 21, 343. [Google Scholar] [CrossRef] [PubMed]
- Saadedine, M.; El Sabeh, M.; Borahay, M.A.; Daoud, G. The influence of COVID-19 infection-associated immune response on the female reproductive system. Biol. Reprod. 2023, 108, 172–182. [Google Scholar] [CrossRef] [PubMed]
- Esakandari, H.; Nabi-Afjadi, M.; Fakkari-Afjadi, J.; Farahmandian, N.; Miresmaeili, S.M.; Bahreini, E. A comprehensive review of COVID-19 characteristics. Biol. Proced. Online 2020, 22, 1–10. [Google Scholar] [CrossRef] [PubMed]
- Huang, C.; Wang, Y.; Li, X.; Ren, L.; Zhao, J.; Hu, Y.; Zhang, L.; Fan, G.; Xu, J.; Gu, X.; et al. Clinical features of patients infected with 2019 novel coronavirus in Wuhan, China. Lancet 2020, 395, 497–506. [Google Scholar] [CrossRef]
- Yang, L.; Liu, S.; Liu, J.; Zhang, Z.; Wan, X.; Huang, B.; Chen, Y.; Zhang, Y. COVID-19: Immunopathogenesis and Immunotherapeutics. Signal Transduct. Target. Ther. 2020, 5, 128. [Google Scholar] [CrossRef]
- Wang, X.; Tang, Q.; Li, H.; Jiang, H.; Xu, J.; Bergquist, R.; Qin, Z. Autoantibodies against type I interferons in COVID-19 infection: A systematic review and meta-analysis. Int. J. Infect. Dis. 2023, 130, 147–152. [Google Scholar] [CrossRef]
- Zhou, P.; Yang, X.L.; Wang, X.G.; Hu, B.; Zhang, L.; Zhang, W.; Si, H.R.; Zhu, Y.; Li, B.; Huang, C.L.; et al. A pneumonia outbreak associated with a new coronavirus of probable bat origin. Nature 2020, 579, 270–273. [Google Scholar] [CrossRef]
- Wang, D.; Hu, B.; Hu, C.; Zhu, F.; Liu, X.; Zhang, J.; Wang, B.; Xiang, H.; Cheng, Z.; Xiong, Y.; et al. Clinical characteristics of 138 hospitalized patients with 2019 novel coronavirus–infected pneumonia in Wuhan, China. JAMA 2020, 323, 1061–1069. [Google Scholar] [CrossRef]
- Shi, Y.; Wang, Y.; Shao, C.; Huang, J.; Gan, J.; Huang, X.; Bucci, E.; Piacentini, M.; Ippolito, G.; Melino, G. COVID-19 infection: The perspectives on immune responses. Cell Death Differ. 2020, 27, 1451–1454. [Google Scholar] [CrossRef]
- Xu, Z.; Shi, L.; Wang, Y.; Zhang, J.; Huang, L.; Zhang, C.; Liu, S.; Zhao, P.; Liu, H.; Zhu, L.; et al. Pathological findings of COVID-19 associated with acute respiratory distress syndrome. Lancet Respir. Med. 2020, 8, 420–422. [Google Scholar] [CrossRef]
- Farshi, E. An Overview of Approved COVID-19 Vaccines and Medications. Virology 2023, 7, S6. [Google Scholar]
- Francis, A.I.; Ghany, S.; Gilkes, T.; Umakanthan, S. Review of COVID-19 vaccine subtypes, efficacy and geographical distributions. Postgrad. Med. J. 2022, 98, 389–394. [Google Scholar] [CrossRef] [PubMed]
- Soheili, M.; Khateri, S.; Moradpour, F.; Mohammadzedeh, P.; Zareie, M.; Mortazavi, S.M.M.; Manifar, S.; Kohan, H.G.; Moradi, Y. The efficacy and effectiveness of COVID-19 vaccines around the world: A mini-review and meta-analysis. Ann. Clin. Microbiol. Antimicrob. 2023, 22, 42. [Google Scholar] [CrossRef] [PubMed]
- Petrova, V.N.; Russell, C.A. The evolution of seasonal influenza viruses. Nat. Rev. Microbiol. 2018, 16, 47–60. [Google Scholar] [CrossRef] [PubMed]
- Centers for Disease Control and Prevention (CDC). Types of Influenza Viruses. Available online: https://www.cdc.gov/flu/about/viruses/types.htm (accessed on 19 August 2023).
- Pleschka, S. Overview of influenza viruses. In Swine Influenza; Springer: Berlin/Heidelberg, Germany, 2012; pp. 1–20. [Google Scholar]
- Tong, S.; Zhu, X.; Li, Y.; Shi, M.; Zhang, J.; Bourgeois, M.; Yang, H.; Chen, X.; Recuenco, S.; Gomez, J.; et al. New World Bats Harbor Diverse Influenza A Viruses. PLoS Pathog. 2013, 9, e1003657. [Google Scholar] [CrossRef] [PubMed]
- Krammer, F.; Palese, P. Advances in the development of influenza virus vaccines. Nat. Rev. Drug Discov. 2015, 14, 167–182. [Google Scholar] [CrossRef] [PubMed]
- Krammer, F.; Smith, G.J.; Fouchier, R.A.; Peiris, M.; Kedzierska, K.; Doherty, P.C.; Palese, P.; Shaw, M.L.; Treanor, J.; Webster, R.G.; et al. Influenza. Nat. Rev. Dis. Prim. 2018, 4, 3. [Google Scholar] [CrossRef]
- Chen, R.; Holmes, E.C. The evolutionary dynamics of human influenza B virus. J. Mol. Evol. 2008, 66, 655–663. [Google Scholar] [CrossRef]
- Bedford, T.; Riley, S.; Barr, I.G.; Broor, S.; Chadha, M.; Cox, N.J.; Daniels, R.S.; Gunasekaran, C.P.; Hurt, A.C.; Kelso, A.; et al. Global circulation patterns of seasonal influenza viruses vary with antigenic drift. Nature 2015, 523, 217–220. [Google Scholar] [CrossRef]
- Vijaykrishna, D.; Holmes, E.C.; Joseph, U.; Fourment, M.; Su, Y.C.; Halpin, R.; Lee, R.T.; Deng, Y.M.; Gunalan, V.; Lin, X.; et al. The contrasting phylodynamics of human influenza B viruses. eLife 2015, 4, 5055. [Google Scholar] [CrossRef]
- Kreijtz, J.H.; Fouchier, R.A.; Rimmelzwaan, G.F. Immune responses to influenza virus infection. Virus Res. 2011, 162, 19–30. [Google Scholar] [CrossRef]
- Mancini, N.; Solforosi, L.; Clementi, N.; De Marco, D.; Clementi, M.; Burioni, R. A potential role for monoclonal antibodies in prophylactic and therapeutic treatment of influenza. Antivir. Res. 2011, 92, 15–26. [Google Scholar] [CrossRef]
- Soghoian, D.Z.; Streeck, H. Cytolytic CD4+ T cells in viral immunity. Expert Rev. Vaccines 2010, 9, 1453–1463. [Google Scholar] [CrossRef] [PubMed]
- Fields, B.N. Fields’ Virology; Lippincott Williams & Wilkins: Philadelphia, PA, USA, 2007; Volume 1. [Google Scholar]
- de St. Groth, S.F.; Webster,, R.G. Disquisitions on original antigenic sin: I. Evidence in man. J. Exp. Med. 1966, 124, 331–345. [Google Scholar]
- Davenport, F.M.; Hennessy, A.V. A serologic recapitulation of past experiences with influenza A; antibody response to monovalent vaccine. J. Exp. Med. 1956, 104, 85–97. [Google Scholar] [CrossRef] [PubMed]
- Cobey, S.; Hensley, S.E. Immune history and influenza virus susceptibility. Curr. Opin. Virol. 2017, 22, 105–111. [Google Scholar] [CrossRef] [PubMed]
- Linderman, S.L.; Hensley, S.E. Antibodies with ‘original antigenic sin’ properties are valuable components of secondary immune responses to influenza viruses. PLoS Pathog. 2016, 12, e1005806. [Google Scholar] [CrossRef] [PubMed]
- Kim, J.H.; Davis, W.G.; Sambhara, S.; Jacob, J. Strategies to alleviate original antigenic sin responses to influenza viruses. Proc. Natl. Acad. Sci. USA 2012, 109, 13751–13756. [Google Scholar] [CrossRef] [PubMed]
- Vemula, S.V.; Zhao, J.; Liu, J.; Wang, X.; Biswas, S.; Hewlett, I. Current approaches for diagnosis of influenza virus infections in humans. Viruses 2016, 8, 96. [Google Scholar] [CrossRef] [PubMed]
- Ganzenmueller, T.; Kluba, J.; Hilfrich, B.; Puppe, W.; Verhagen, W.; Heim, A.; Schulz, T.; Henke-Gendo, C. Comparison of the performance of direct fluorescent antibody staining, a point-of-care rapid antigen test and virus isolation with that of RT-PCR for the detection of novel 2009 influenza A (H1N1) virus in respiratory specimens. J. Med. Microbiol. 2010, 59, 713–717. [Google Scholar] [CrossRef] [PubMed]
- Ginocchio, C.C.; Zhang, F.; Manji, R.; Arora, S.; Bornfreund, M.; Falk, L.; Lotlikar, M.; Kowerska, M.; Becker, G.; Korologos, D.; et al. Evaluation of multiple test methods for the detection of the novel 2009 influenza A (H1N1) during the New York City outbreak. J. Clin. Virol. 2009, 45, 191–195. [Google Scholar] [CrossRef] [PubMed]
- Leonardi, G.P.; Mitrache, I.; Pigal, A.; Freedman, L. Public hospital-based laboratory experience during an outbreak of pandemic influenza A (H1N1) virus infections. J. Clin. Microbiol. 2010, 48, 1189–1194. [Google Scholar] [CrossRef] [PubMed]
- Stephenson, I.; Heath, A.; Major, D.; Newman, R.W.; Hoschler, K.; Junzi, W.; Katz, J.M.; Weir, J.P.; Zambon, M.C.; Wood, J.M. Reproducibility of serologic assays for influenza virus A (H5N1). Emerg. Infect. Dis. 2009, 15, 1250. [Google Scholar] [CrossRef] [PubMed]
- Zhang, P.; Vemula, S.V.; Zhao, J.; Du, B.; Mohan, H.; Liu, J.; El Mubarak, H.S.; Landry, M.L.; Hewlett, I. A highly sensitive europium nanoparticle-based immunoassay for detection of influenza A/B virus antigen in clinical specimens. J. Clin. Microbiol. 2014, 52, 4385–4387. [Google Scholar] [CrossRef]
- Cruz, A.T.; Demmler-Harrison, G.J.; Caviness, A.C.; Buffone, G.J.; Revell, P.A. Performance of a rapid influenza test in children during the H1N1 2009 influenza A outbreak. Pediatrics 2010, 125, e645–e650. [Google Scholar] [CrossRef]
- Stamm, B.D.; Tamerius, J.; Reddy, S.; Barlow, S.; Hamer, C.; Kempken, A.; Goss, M.; He, C.; Bell, C.; Arnold, M.; et al. The Influence of Rapid Influenza Diagnostic Testing on Clinician Decision-Making for Patients With Acute Respiratory Infection in Urgent Care. Clin. Infect. Dis. 2023, 76, 1942–1948. [Google Scholar] [CrossRef]
- Seki, Y.; Oda, Y.; Sugaya, N. Very high sensitivity of a rapid influenza diagnostic test in adults and elderly individuals within 48 h of the onset of illness. PloS ONE 2020, 15, e0231217. [Google Scholar] [CrossRef]
- Jacob, R.; White, B.; McCaskill, M.E. Does location of rapid influenza diagnostic testing influence treatment time and ancillary testing in a paediatric emergency department? Emerg. Med. Australas. 2021, 33, 88–93. [Google Scholar] [CrossRef]
- Courtney, S.J.; Stromberg, Z.R.; Kubicek-Sutherland, J.Z. Nucleic acid-based sensing techniques for diagnostics and surveillance of influenza. Biosensors 2021, 11, 47. [Google Scholar] [CrossRef]
- Mitamura, K.; Shimizu, H.; Yamazaki, M.; Ichikawa, M.; Abe, T.; Yasumi, Y.; Ichikawa, Y.; Shibata, T.; Yoshihara, M.; Shiozaki, K.; et al. Clinical evaluation of ID NOW influenza A & B 2, a rapid influenza virus detection kit using isothermal nucleic acid amplification technology-A comparison with currently available tests. J. Infect. Chemother. 2020, 26, 216–221. [Google Scholar]
- Sato, Y.; Nirasawa, S.; Saeki, M.; Yakuwa, Y.; Ono, M.; Kobayashi, R.; Nakafuri, H.; Murai, R.; Fujiya, Y.; Kuronuma, K.; et al. Comparative study of rapid antigen testing and two nucleic acid amplification tests for influenza virus detection. J. Infect. Chemother. 2022, 28, 1033–1036. [Google Scholar] [CrossRef]
- Wang, S.; Ai, Z.; Zhang, Z.; Tang, M.; Zhang, N.; Liu, F.; Han, G.; Hong, S.L.; Liu, K. Simultaneous and automated detection of influenza A virus hemagglutinin H7 and H9 based on magnetism and size mediated microfluidic chip. Sens. Actuators Chem. 2020, 308, 127675. [Google Scholar] [CrossRef]
- Bhattacharyya, A.; Klapperich, C.M. Thermoplastic microfluidic device for on-chip purification of nucleic acids for disposable diagnostics. Anal. Chem. 2006, 78, 788–792. [Google Scholar] [CrossRef]
- Huang, E.; Wang, Y.; Yang, N.; Shu, B.; Zhang, G.; Liu, D. A fully automated microfluidic PCR-array system for rapid detection of multiple respiratory tract infection pathogens. Anal. Bioanal. Chem. 2021, 413, 1787–1798. [Google Scholar] [CrossRef] [PubMed]
- Sun, Y.; Dhumpa, R.; Bang, D.D.; Høgberg, J.; Handberg, K.; Wolff, A. A lab-on-a-chip device for rapid identification of avian influenza viral RNA by solid-phase PCR. Lab Chip 2011, 11, 1457–1463. [Google Scholar] [CrossRef] [PubMed]
- Prakash, R.; Pabbaraju, K.; Wong, S.; Wong, A.; Tellier, R.; Kaler, K.V. Multiplex, quantitative, reverse transcription PCR detection of influenza viruses using droplet microfluidic technology. Micromachines 2014, 6, 63–79. [Google Scholar] [CrossRef]
- Chen, J.; Wang, J.; Zhang, J.; Ly, H. Advances in development and application of influenza vaccines. Front. Immunol. 2021, 12, 711997. [Google Scholar] [CrossRef]
- Huber, V.C. Influenza vaccines: From whole virus preparations to recombinant protein technology. Expert Rev. Vaccines 2014, 13, 31–42. [Google Scholar] [CrossRef] [PubMed]
- Houser, K.; Subbarao, K. Influenza vaccines: Challenges and solutions. Cell Host Microbe 2015, 17, 295–300. [Google Scholar] [CrossRef] [PubMed]
- Scorza, F.B.; Tsvetnitsky, V.; Donnelly, J.J. Universal influenza vaccines: Shifting to better vaccines. Vaccine 2016, 34, 2926–2933. [Google Scholar] [CrossRef] [PubMed]
- Sridhar, S.; Brokstad, K.; Cox, R. Influenza vaccination strategies: Comparing inactivated and live attenuated influenza vaccines. Vaccines 2015, 3, 373–389. [Google Scholar] [CrossRef] [PubMed]
- Wei, C.J.; Crank, M.C.; Shiver, J.; Graham, B.S.; Mascola, J.R.; Nabel, G.J. Next-generation influenza vaccines: Opportunities and challenges. Nat. Rev. Drug Discov. 2020, 19, 239–252. [Google Scholar] [CrossRef] [PubMed]
- Fauci, A.S.; Redfield, R.R.; Sigounas, G.; Weahkee, M.D.; Giroir, B.P. Ending the HIV epidemic: A plan for the United States. JAMA 2019, 321, 844–845. [Google Scholar] [CrossRef]
- CDC HIV Statistics Overview. Available online: https://www.cdc.gov/hiv/statistics/overview/index.html (accessed on 1 December 2023).
- Frieden, T.R.; Foti, K.E.; Mermin, J. Applying public health principles to the HIV epidemic—how are we doing? N. Engl. J. Med. 2015, 373, 2281–2287. [Google Scholar] [CrossRef]
- Centers for Disease Control and Prevention. Laboratory Testing for the Diagnosis of HIV Infection: Updated Recommendations. 2024. Available online: https://stacks.cdc.gov/view/cdc/23447 (accessed on 23 January 2024).
- Blood, G.A.C. Human immunodeficiency virus (HIV). Transfus. Med. Hemotherapy 2016, 43, 203. [Google Scholar]
- Gao, F.; Bailes, E.; Robertson, D.L.; Chen, Y.; Rodenburg, C.M.; Michael, S.F.; Cummins, L.B.; Arthur, L.O.; Peeters, M.; Shaw, G.M.; et al. Origin of HIV-1 in the chimpanzee Pan troglodytes troglodytes. Nature 1999, 397, 436–441. [Google Scholar] [CrossRef]
- Deeks, S.G.; Overbaugh, J.; Phillips, A.; Buchbinder, S. HIV infection. Nat. Rev. Dis. Prim. 2015, 1, 1–22. [Google Scholar] [CrossRef]
- Overbaugh, J.; Bangham, C.R. Selection forces and constraints on retroviral sequence variation. Science 2001, 292, 1106–1109. Available online: https://www.cdc.gov/hiv/statistics/overview/ataglance.html (accessed on 5 February 2019). [CrossRef]
- Gandhi, R.T.; Bedimo, R.; Hoy, J.F.; Landovitz, R.J.; Smith, D.M.; Eaton, E.F.; Lehmann, C.; Springer, S.A.; Sax, P.E.; Thompson, M.A.; et al. Antiretroviral drugs for treatment and prevention of HIV infection in adults: 2022 Recommendations of the International Antiviral Society–USA Panel. JAMA 2023, 329, 63–84. [Google Scholar] [CrossRef] [PubMed]
- Davey, R.T., Jr.; Bhat, N.; Yoder, C.; Chun, T.W.; Metcalf, J.A.; Dewar, R.; Natarajan, V.; Lempicki, R.A.; Adelsberger, J.W.; Miller, K.D.; et al. HIV-1 and T cell dynamics after interruption of highly active antiretroviral therapy (HAART) in patients with a history of sustained viral suppression. Proc. Natl. Acad. Sci. USA 1999, 96, 15109–15114. [Google Scholar] [CrossRef]
- Szabó, E.; Lotz, G.; Páska, C.; Kiss, A.; Schaff, Z. Viral hepatitis: New data on hepatitis C infection. Pathol. Oncol. Res. 2003, 9, 215–221. [Google Scholar] [CrossRef] [PubMed]
- Fishman, L.N.; Jonas, M.M.; Lavine, J.E. Update on viral hepatitis in children. Pediatr. Clin. 1996, 43, 57–74. [Google Scholar] [CrossRef] [PubMed]
- Ciocca, M. Clinical course and consequences of hepatitis A infection. Vaccine 2000, 18, S71–S74. [Google Scholar] [CrossRef] [PubMed]
- Trépo, C.; Chan, H.L.; Lok, A. Hepatitis B virus infection. Lancet 2014, 384, 2053–2063. [Google Scholar] [CrossRef]
- Revill, P.A.; Chisari, F.V.; Block, J.M.; Dandri, M.; Gehring, A.J.; Guo, H.; Hu, J.; Kramvis, A.; Lampertico, P.; Janssen, H.L.; et al. A global scientific strategy to cure hepatitis B. Lancet Gastroenterol. Hepatol. 2019, 4, 545–558. [Google Scholar] [CrossRef]
- Rehermann, B.; Nascimbeni, M. Immunology of hepatitis B virus and hepatitis C virus infection. Nat. Rev. Immunol. 2005, 5, 215–229. [Google Scholar] [CrossRef]
- Thimme, R.; Oldach, D.; Chang, K.M.; Steiger, C.; Ray, S.C.; Chisari, F.V. Determinants of viral clearance and persistence during acute hepatitis C virus infection. J. Exp. Med. 2001, 194, 1395–1406. [Google Scholar] [CrossRef] [PubMed]
- Major, M.E.; Dahari, H.; Mihalik, K.; Puig, M.; Rice, C.M.; Neumann, A.U.; Feinstone, S.M. Hepatitis C virus kinetics and host responses associated with disease and outcome of infection in chimpanzees. Hepatology 2004, 39, 1709–1720. [Google Scholar] [CrossRef] [PubMed]
- Lauer, G.M.; Walker, B.D. Hepatitis C virus infection. N. Engl. J. Med. 2001, 345, 41–52. [Google Scholar] [CrossRef] [PubMed]
- Kuhn, J.H.; Adachi, T.; Adhikari, N.K.; Arribas, J.R.; Bah, I.E.; Bausch, D.G.; Bhadelia, N.; Borchert, M.; Brantsæter, A.B.; Brett-Major, D.M.; et al. New filovirus disease classification and nomenclature. Nat. Rev. Microbiol. 2019, 17, 261–263. [Google Scholar] [CrossRef] [PubMed]
- Jacob, S.T.; Crozier, I.; Fischer, W.A.; Hewlett, A.; Kraft, C.S.; Vega, M.A.; Soka, M.J.; Wahl, V.; Griffiths, A.; Bollinger, L.; et al. Ebola virus disease. Nat. Rev. Dis. Prim. 2020, 6, 13. [Google Scholar] [CrossRef] [PubMed]
- World Health Organization. Ebola Outbreak 2014–2016. 2017. Available online: http://www.who.int/csr/disease/ebola/en/ (accessed on 5 December 2023).
- Bausch, D.G.; Towner, J.S.; Dowell, S.F.; Kaducu, F.; Lukwiya, M.; Sanchez, A.; Nichol, S.T.; Ksiazek, T.G.; Rollin, P.E. Assessment of the risk of Ebola virus transmission from bodily fluids and fomites. J. Infect. Dis. 2007, 196, S142–S147. [Google Scholar] [CrossRef]
- Malvy, D.; McElroy, A.K.; de Clerck, H.; Günther, S.; van Griensven, J. Ebola virus disease. Lancet 2019, 393, 936–948. [Google Scholar] [CrossRef]
- Rewar, S.; Mirdha, D. Transmission of Ebola virus disease: An overview. Ann. Glob. Health 2014, 80, 444–451. [Google Scholar] [CrossRef]
- Feldmann, H. Filoviridae. In Virus Taxonomy: VIII report of the International Committee on Taxonomy of Viruses; Fauquet, C., Mayo, M.A., Maniloff, J., Desselberger, U., Ball, L.A., Eds.; Elsevier/Academic Press: Cambridge, MA, USA, 2005. [Google Scholar]
- Bosio, C.M.; Aman, M.J.; Grogan, C.; Hogan, R.; Ruthel, G.; Negley, D.; Mohamadzadeh, M.; Bavari, S.; Schmaljohn, A. Ebola and Marburg viruses replicate in monocyte-derived dendritic cells without inducing the production of cytokines and full maturation. J. Infect. Dis. 2003, 188, 1630–1638. [Google Scholar] [CrossRef] [PubMed]
- Lindblade, K.A.; Kateh, F.; Nagbe, T.K.; Neatherlin, J.C.; Pillai, S.K.; Attfield, K.R.; Dweh, E.; Barradas, D.T.; Williams, S.G.; Blackley, D.J.; et al. Decreased Ebola transmission after rapid response to outbreaks in remote areas, Liberia, 2014. Emerg. Infect. Dis. 2015, 21, 1800. [Google Scholar] [CrossRef] [PubMed]
- Woolsey, C.; Geisbert, T.W. Current state of Ebola virus vaccines: A snapshot. PLoS Pathog. 2021, 17, e1010078. [Google Scholar] [CrossRef] [PubMed]
- Bhatt, P.; Sabeena, S.P.; Varma, M.; Arunkumar, G. Current understanding of the pathogenesis of dengue virus infection. Curr. Microbiol. 2021, 78, 17–32. [Google Scholar] [CrossRef] [PubMed]
- Eivazzadeh-Keihan, R.; Pashazadeh-Panahi, P.; Mahmoudi, T.; Chenab, K.K.; Baradaran, B.; Hashemzaei, M.; Radinekiyan, F.; Mokhtarzadeh, A.; Maleki, A. Dengue virus: A review on advances in detection and trends–from conventional methods to novel biosensors. Microchim. Acta 2019, 186, 1–24. [Google Scholar] [CrossRef] [PubMed]
- Roy, S.K.; Bhattacharjee, S. Dengue virus: Epidemiology, biology, and disease aetiology. Can. J. Microbiol. 2021, 67, 687–702. [Google Scholar] [CrossRef] [PubMed]
- Anderson, K.B.; Gibbons, R.V.; Cummings, D.A.; Nisalak, A.; Green, S.; Libraty, D.H.; Jarman, R.G.; Srikiatkhachorn, A.; Mammen, M.P.; Darunee, B.; et al. A shorter time interval between first and second dengue infections is associated with protection from clinical illness in a school-based cohort in Thailand. J. Infect. Dis. 2014, 209, 360–368. [Google Scholar] [CrossRef] [PubMed]
- Bhatt, S.; Gething, P.W.; Brady, O.J.; Messina, J.P.; Farlow, A.W.; Moyes, C.L.; Drake, J.M.; Brownstein, J.S.; Hoen, A.G.; Sankoh, O.; et al. The global distribution and burden of dengue. Nature 2013, 496, 504–507. [Google Scholar] [CrossRef]
- Martina, B.E.; Koraka, P.; Osterhaus, A.D. Dengue virus pathogenesis: An integrated view. Clin. Microbiol. Rev. 2009, 22, 564–581. [Google Scholar] [CrossRef]
- St. John, A.L.; Rathore, A.P. Adaptive immune responses to primary and secondary dengue virus infections. Nat. Rev. Immunol. 2019, 19, 218–230. [Google Scholar] [CrossRef]
- Hatch, S.; Endy, T.P.; Thomas, S.; Mathew, A.; Potts, J.; Pazoles, P.; Libraty, D.H.; Gibbons, R.; Rothman, A.L. Intracellular cytokine production by dengue virus–specific T cells correlates with subclinical secondary infection. J. Infect. Dis. 2011, 203, 1282–1291. [Google Scholar] [CrossRef]
- Rey, F.A.; Stiasny, K.; Vaney, M.C.; Dellarole, M.; Heinz, F.X. The bright and the dark side of human antibody responses to flaviviruses: Lessons for vaccine design. EMBO Rep. 2018, 19, 206–224. [Google Scholar] [CrossRef]
- Doron, S.; Gorbach, S.L. Bacterial infections: Overview. In International Encyclopedia of Public Health; Elsevier: Amsterdam, The Netherlands, 2008; p. 273. [Google Scholar]
- World Health Organization. Global Tuberculosis Report 2022—Factsheet. 2022. Available online: https://www.who.int/publications/m/item/global-tuberculosis-report-2022-factsheet (accessed on 5 December 2023).
- Kiazyk, S.; Ball, T. Tuberculosis (TB): Latent tuberculosis infection: An overview. Can. Commun. Dis. Rep. 2017, 43, 62. [Google Scholar] [CrossRef]
- Wolf, A.J.; Desvignes, L.; Linas, B.; Banaiee, N.; Tamura, T.; Takatsu, K.; Ernst, J.D. Initiation of the adaptive immune response to Mycobacterium tuberculosis depends on antigen production in the local lymph node, not the lungs. J. Exp. Med. 2008, 205, 105–115. [Google Scholar] [CrossRef]
- Wood, A.; Barizuddin, S.; Darr, C.M.; Mathai, C.J.; Ball, A.; Minch, K.; Somoskovi, A.; Hamasur, B.; Connelly, J.T.; Weigl, B.; et al. Ultrasensitive detection of lipoarabinomannan with plasmonic grating biosensors in clinical samples of HIV negative patients with tuberculosis. PLoS ONE 2019, 14, e0214161. [Google Scholar] [CrossRef]
- Drouillon, V.; Delogu, G.; Dettori, G.; Lagrange, P.; Benecchi, M.; Houriez, F.; Baroli, K.; Ardito, F.; Torelli, R.; Chezzi, C.; et al. Multicenter evaluation of a transcription-reverse transcription concerted assay for rapid detection of Mycobacterium tuberculosis complex in clinical specimens. J. Clin. Microbiol. 2009, 47, 3461–3465. [Google Scholar] [CrossRef]
- Fernebro, J. Fighting bacterial infections—Future treatment options. Drug Resist. Updat. 2011, 14, 125–139. [Google Scholar] [CrossRef]
- Kumar, P.; Erturk, V.S. Dynamics of cholera disease by using two recent fractional numerical methods. Math. Model. Numer. Simul. Appl. 2021, 1, 102–111. [Google Scholar] [CrossRef]
- Morris, J.G., Jr. Cholera—Modern pandemic disease of ancient lineage. Emerg. Infect. Dis. 2011, 17, 2099. [Google Scholar] [CrossRef] [PubMed]
- Asadgol, Z.; Mohammadi, H.; Kermani, M.; Badirzadeh, A.; Gholami, M. The effect of climate change on cholera disease: The road ahead using artificial neural network. PLoS ONE 2019, 14, e0224813. [Google Scholar] [CrossRef] [PubMed]
- Sharland, M.; Butler, K.; Cant, A.; Dagan, R.; Davies, G.; de Groot, R.; Elliman, D.; Esposito, S.; Finn, A.; Galanakis, M.; et al. Manual of Childhood Infections: The Blue Book; Oxford University Press: Oxford, UK, 2016. [Google Scholar]
- Richie, E.; Punjabi, N.H.; Sidharta, Y.; Peetosutan, K.; Sukandar, M.; Wasserman, S.S.; Lesmana, M.; Wangsasaputra, F.; Pandam, S.; Levine, M.M.; et al. Efficacy trial of single-dose live oral cholera vaccine CVD 103-HgR in North Jakarta, Indonesia, a cholera-endemic area. Vaccine 2000, 18, 2399–2410. [Google Scholar] [CrossRef]
- Yang, X.; Chen, H.; Zheng, Y.; Qu, S.; Wang, H.; Yi, F. Disease burden and long-term trends of urinary tract infections: A worldwide report. Front. Public Health 2022, 10, 888205. [Google Scholar] [CrossRef] [PubMed]
- Flores-Mireles, A.L.; Walker, J.N.; Caparon, M.; Hultgren, S.J. Urinary tract infections: Epidemiology, mechanisms of infection and treatment options. Nat. Rev. Microbiol. 2015, 13, 269–284. [Google Scholar] [CrossRef]
- Abou Heidar, N.F.; Degheili, J.A.; Yacoubian, A.A.; Khauli, R.B. Management of urinary tract infection in women: A practical approach for everyday practice. Urol. Ann. 2019, 11, 339. [Google Scholar] [PubMed]
- Salvatore, S.; Salvatore, S.; Cattoni, E.; Siesto, G.; Serati, M.; Sorice, P.; Torella, M. Urinary tract infections in women. Eur. J. Obstet. Gynecol. Reprod. Biol. 2011, 156, 131–136. [Google Scholar] [CrossRef] [PubMed]
- American College of Obstetricians and Gynecologists. ACOG Practice Bulletin No. 91: Treatment of urinary tract infections in nonpregnant women. Obstet. Gynecol. 2008, 111, 785–794. [Google Scholar] [CrossRef] [PubMed]
- Vogel, T.; Verreault, R.; Gourdeau, M.; Morin, M.; Grenier-Gosselin, L.; Rochette, L. Optimal duration of antibiotic therapy for uncomplicated urinary tract infection in older women: A double-blind randomized controlled trial. CMAJ 2004, 170, 469–473. [Google Scholar] [PubMed]
- Crawford, F. Athlete’s foot. BMJ Clin. Evid. 2009, 2009, 1712. [Google Scholar]
- Makola, N.F.; Magongwa, N.M.; Matsaung, B.; Schellack, G.; Schellack, N. Managing athlete’s foot. S. Afr. Fam. Pract. 2018, 60, 37–41. [Google Scholar] [CrossRef]
- Gupta, A.K.; Daigle, D.; Paquet, M.; Gandhi, B.; Simpson, F.; Villanueva, E.; Verreault, M.; Lyons, D. Topical treatments for athlete’s foot. Cochrane Database Syst. Rev. 2018, 2018, CD010863. [Google Scholar] [CrossRef]
- Sharma, M.; Chakrabarti, A. Candidiasis and Other Emerging Yeasts. Curr. Fungal Infect. Rep. 2023, 17, 15–24. [Google Scholar] [CrossRef]
- An, R.; Rafiq, N. Candidiasis; StatPearls Publishing: Treasure Island, FL, USA, 2020. [Google Scholar]
- Reddy, K. Fungal Infections (Mycoses): Dermatophytoses (Tinea, Ringworm). J. Gandaki Med. Coll. Nepal 2017, 10. [Google Scholar] [CrossRef]
- Schmiedel, Y.; Zimmerli, S. Common invasive fungal diseases: An overview of invasive candidiasis, aspergillosis, cryptococcosis, and Pneumocystis pneumonia. Swiss Med. Wkly. 2016, 146, w14281. [Google Scholar] [CrossRef]
- Cowman, A.F.; Healer, J.; Marapana, D.; Marsh, K. Malaria: Biology and disease. Cell 2016, 167, 610–624. [Google Scholar] [CrossRef] [PubMed]
- Talapko, J.; Škrlec, I.; Alebić, T.; Jukić, M.; Včev, A. Malaria: The past and the present. Microorganisms 2019, 7, 179. [Google Scholar] [CrossRef]
- Dubey, J.P. Outbreaks of clinical toxoplasmosis in humans: Five decades of personal experience, perspectives and lessons learned. Parasites Vectors 2021, 14, 1–12. [Google Scholar] [CrossRef]
- Smith, N.C.; Goulart, C.; Hayward, J.A.; Kupz, A.; Miller, C.M.; van Dooren, G.G. Control of human toxoplasmosis. Int. J. Parasitol. 2021, 51, 95–121. [Google Scholar] [CrossRef] [PubMed]
- Engelman, D.; Cantey, P.T.; Marks, M.; Solomon, A.W.; Chang, A.Y.; Chosidow, O.; Enbiale, W.; Engels, D.; Hay, R.J.; Hendrickx, D.; et al. The public health control of scabies: Priorities for research and action. Lancet 2019, 394, 81–92. [Google Scholar] [CrossRef] [PubMed]
- Engelman, D.; Steer, A.C. Control strategies for scabies. Trop. Med. Infect. Dis. 2018, 3, 98. [Google Scholar] [CrossRef]
- Micali, G.; Lacarrubba, F.; Verzì, A.E.; Chosidow, O.; Schwartz, R.A. Scabies: Advances in noninvasive diagnosis. PLoS Neglected Trop. Dis. 2016, 10, e0004691. [Google Scholar] [CrossRef]
- Iwasaki, Y. Creutzfeldt-Jakob disease. Neuropathology 2017, 37, 174–188. [Google Scholar] [CrossRef]
- Zanusso, G.; Monaco, S.; Pocchiari, M.; Caughey, B. Advanced tests for early and accurate diagnosis of Creutzfeldt–Jakob disease. Nat. Rev. Neurol. 2016, 12, 325–333. [Google Scholar] [CrossRef]
- Brandel, J.P.; Knight, R. Variant Creutzfeldt–Jakob disease. In Handbook of Clinical Neurology; Elsevier: Amsterdam, The Netherlands, 2018; Volume 153, pp. 191–205. [Google Scholar]
- Elezgarai, S.R.; Fernández-Borges, N.; Eraña, H.; Sevillano, A.M.; Charco, J.M.; Harrathi, C.; Saá, P.; Gil, D.; Kong, Q.; Requena, J.R.; et al. Generation of a new infectious recombinant prion: A model to understand Gerstmann–Sträussler–Scheinker syndrome. Sci. Rep. 2017, 7, 9584. [Google Scholar] [CrossRef]
- Kinkhabwala, A.; Yu, Z.; Fan, S.; Avlasevich, Y.; Müllen, K.; Moerner, W. Large single-molecule fluorescence enhancements produced by a bowtie nanoantenna. Nat. Photonics 2009, 3, 654–657. [Google Scholar] [CrossRef]
- Sahl, S.J.; Hell, S.W.; Jakobs, S. Fluorescence nanoscopy in cell biology. Nat. Rev. Mol. Cell Biol. 2017, 18, 685–701. [Google Scholar] [CrossRef] [PubMed]
- Bauch, M.; Toma, K.; Toma, M.; Zhang, Q.; Dostalek, J. Plasmon-enhanced fluorescence biosensors: A review. Plasmonics 2014, 9, 781–799. [Google Scholar] [CrossRef] [PubMed]
- Heo, M.; Cho, H.; Jung, J.W.; Jeong, J.R.; Park, S.; Kim, J.Y. High-performance organic optoelectronic devices enhanced by surface plasmon resonance. Adv. Mater. 2011, 23, 5689–5693. [Google Scholar] [CrossRef]
- Yang, Q.; Li, J.; Wang, X.; Peng, H.; Xiong, H.; Chen, L. Strategies of molecular imprinting-based fluorescence sensors for chemical and biological analysis. Biosens. Bioelectron. 2018, 112, 54–71. [Google Scholar] [CrossRef]
- Kühn, S.; Håkanson, U.; Rogobete, L.; Sandoghdar, V. Enhancement of single-molecule fluorescence using a gold nanoparticle as an optical nanoantenna. Phys. Rev. Lett. 2006, 97, 017402. [Google Scholar] [CrossRef]
- Anger, P.; Bharadwaj, P.; Novotny, L. Enhancement and quenching of single-molecule fluorescence. Phys. Rev. Lett. 2006, 96, 113002. [Google Scholar] [CrossRef]
- Yuan, H.; Khatua, S.; Zijlstra, P.; Yorulmaz, M.; Orrit, M. Thousand-fold enhancement of single-molecule fluorescence near a single gold nanorod. Angew. Chem. 2013, 125, 1255–1259. [Google Scholar] [CrossRef]
- Jeong, Y.; Kook, Y.M.; Lee, K.; Koh, W.G. Metal enhanced fluorescence (MEF) for biosensors: General approaches and a review of recent developments. Biosens. Bioelectron. 2018, 111, 102–116. [Google Scholar] [CrossRef]
- Dulkeith, E.; Ringler, M.; Klar, T.A.; Feldmann, J.; Munoz Javier, A.; Parak, W.J. Gold nanoparticles quench fluorescence by phase induced radiative rate suppression. Nano Lett. 2005, 5, 585–589. [Google Scholar] [CrossRef] [PubMed]
- Li, M.; Cushing, S.K.; Wu, N. Plasmon-enhanced optical sensors: A review. Analyst 2015, 140, 386–406. [Google Scholar] [CrossRef] [PubMed]
- Malekzad, H.; Zangabad, P.S.; Mohammadi, H.; Sadroddini, M.; Jafari, Z.; Mahlooji, N.; Abbaspour, S.; Gholami, S.; Houshangi, M.G.; Pashazadeh, R.; et al. Noble metal nanostructures in optical biosensors: Basics, and their introduction to anti-doping detection. TrAC Trends Anal. Chem. 2018, 100, 116–135. [Google Scholar] [CrossRef] [PubMed]
- Bardhan, R.; Grady, N.K.; Cole, J.R.; Joshi, A.; Halas, N.J. Fluorescence enhancement by Au nanostructures: Nanoshells and nanorods. ACS Nano 2009, 3, 744–752. [Google Scholar] [CrossRef] [PubMed]
- Angelini, M.; Manobianco, E.; Pellacani, P.; Floris, F.; Marabelli, F. Plasmonic Modes and Fluorescence Enhancement Coupling Mechanism: A Case with a Nanostructured Grating. Nanomaterials 2022, 12, 4339. [Google Scholar] [CrossRef]
- Martin-Moreno, L.; Garcia-Vidal, F.J.; Lezec, H.J.; Pellerin, K.M.; Thio, T.; Pendry, J.B.; Ebbesen, T.W. Theory of extraordinary optical transmission through subwavelength hole arrays. Phys. Rev. Lett. 2001, 86, 1114. [Google Scholar] [CrossRef]
- Tam, F.; Goodrich, G.P.; Johnson, B.R.; Halas, N.J. Plasmonic enhancement of molecular fluorescence. Nano Lett. 2007, 7, 496–501. [Google Scholar] [CrossRef]
- Deng, W.; Goldys, E.M. Plasmonic approach to enhanced fluorescence for applications in biotechnology and the life sciences. Langmuir 2012, 28, 10152–10163. [Google Scholar] [CrossRef] [PubMed]
- Tang, L.; Casas, J.; Venkataramasubramani, M. Magnetic nanoparticle mediated enhancement of localized surface plasmon resonance for ultrasensitive bioanalytical assay in human blood plasma. Anal. Chem. 2013, 85, 1431–1439. [Google Scholar] [CrossRef] [PubMed]
- Mei, Z.; Tang, L. Surface-plasmon-coupled fluorescence enhancement based on ordered gold nanorod array biochip for ultrasensitive DNA analysis. Anal. Chem. 2017, 89, 633–639. [Google Scholar] [CrossRef]
- Gerber, S.; Reil, F.; Hohenester, U.; Schlagenhaufen, T.; Krenn, J.R.; Leitner, A. Tailoring light emission properties of fluorophores by coupling to resonance-tuned metallic nanostructures. Phys. Rev. B 2007, 75, 073404. [Google Scholar] [CrossRef]
- Xie, K.X.; Liu, Q.; Jia, S.S.; Xiao, X.X. Fluorescence enhancement by hollow plasmonic assembly and its biosensing application. Anal. Chim. Acta 2021, 1144, 96–101. [Google Scholar] [CrossRef] [PubMed]
- Yuk, J.S.; Guignon, E.F.; Lynes, M.A. Sensitivity enhancement of a grating-based surface plasmon-coupled emission (SPCE) biosensor chip using gold thickness. Chem. Phys. Lett. 2014, 591, 5–9. [Google Scholar] [CrossRef] [PubMed]
- Bhaskar, S. Biosensing Technologies: A Focus Review on Recent Advancements in Surface Plasmon Coupled Emission. Micromachines 2023, 14, 574. [Google Scholar] [CrossRef]
- Xie, K.X.; Liu, Q.; Song, X.L.; Huo, R.P.; Shi, X.H.; Liu, Q.L. Amplified fluorescence by hollow-porous plasmonic assembly: A new observation and its application in multiwavelength simultaneous detection. Anal. Chem. 2021, 93, 3671–3676. [Google Scholar] [CrossRef]
- Pang, J.S.; Theodorou, I.G.; Centeno, A.; Petrov, P.K.; Alford, N.M.; Ryan, M.P.; Xie, F. Tunable three-dimensional plasmonic arrays for large near-infrared fluorescence enhancement. ACS Appl. Mater. Interfaces 2019, 11, 23083–23092. [Google Scholar] [CrossRef]
- Hu, J.; Yu, H.; Su, G.; Song, B.; Wang, J.; Wu, Z.; Zhan, P.; Liu, F.; Wu, W.; Wang, Z. Dual-Electromagnetic Field Enhancements through Suspended Metal/Dielectric/Metal Nanostructures and Plastic Phthalates Detection in Child Urine. Adv. Opt. Mater. 2020, 8, 1901305. [Google Scholar] [CrossRef]
- Liu, F.; Song, B.; Su, G.; Liang, O.; Zhan, P.; Wang, H.; Wu, W.; Xie, Y.; Wang, Z. Sculpting extreme electromagnetic field enhancement in free space for molecule sensing. Small 2018, 14, 1801146. [Google Scholar] [CrossRef]
- Flauraud, V.; Regmi, R.; Winkler, P.M.; Alexander, D.T.; Rigneault, H.; Van Hulst, N.F.; García-Parajo, M.F.; Wenger, J.; Brugger, J. In-plane plasmonic antenna arrays with surface nanogaps for giant fluorescence enhancement. Nano Lett. 2017, 17, 1703–1710. [Google Scholar] [CrossRef] [PubMed]
- Aouani, H.; Wenger, J.; Gérard, D.; Rigneault, H.; Devaux, E.; Ebbesen, T.W.; Mahdavi, F.; Xu, T.; Blair, S. Crucial role of the adhesion layer on the plasmonic fluorescence enhancement. ACS Nano 2009, 3, 2043–2048. [Google Scholar] [CrossRef]
- Dragan, A.I.; Golberg, K.; Elbaz, A.; Marks, R.; Zhang, Y.; Geddes, C.D. Two-color, 30 s microwave-accelerated Metal-Enhanced Fluorescence DNA assays: A new Rapid Catch and Signal (RCS) technology. J. Immunol. Methods 2011, 366, 1–7. [Google Scholar] [CrossRef]
- Hasegawa, Y.; Wada, Y.; Yanagida, S. Strategies for the design of luminescent lanthanide (III) complexes and their photonic applications. J. Photochem. Photobiol. Photochem. Rev. 2004, 5, 183–202. [Google Scholar] [CrossRef]
- Zheng, H.; Gao, D.; Fu, Z.; Wang, E.; Lei, Y.; Tuan, Y.; Cui, M. Fluorescence enhancement of Ln3+ doped nanoparticles. J. Lumin. 2011, 131, 423–428. [Google Scholar] [CrossRef]
- Zhang, W.; Ding, F.; Li, W.D.; Wang, Y.; Hu, J.; Chou, S.Y. Giant and uniform fluorescence enhancement over large areas using plasmonic nanodots in 3D resonant cavity nanoantenna by nanoimprinting. Nanotechnology 2012, 23, 225301. [Google Scholar] [CrossRef]
- Li, D.; Chen, Z.; Mei, X. Fluorescence enhancement for noble metal nanoclusters. Adv. Colloid Interface Sci. 2017, 250, 25–39. [Google Scholar] [CrossRef] [PubMed]
- Yang, L.; Cao, Y.; Chen, J.; Sun, Z.; Yao, T.; Jiang, Y.; Wei, S. Luminescence of Au (I)-thiolate complex affected by solvent. Radiat. Phys. Chem. 2017, 137, 68–71. [Google Scholar] [CrossRef]
- Tian, R.; Zhang, S.; Li, M.; Zhou, Y.; Lu, B.; Yan, D.; Wei, M.; Evans, D.G.; Duan, X. Localization of Au nanoclusters on layered double hydroxides nanosheets: Confinement-induced emission enhancement and temperature-responsive luminescence. Adv. Funct. Mater. 2015, 25, 5006–5015. [Google Scholar] [CrossRef]
- Dou, X.; Yuan, X.; Yu, Y.; Luo, Z.; Yao, Q.; Leong, D.T.; Xie, J. Lighting up thiolated Au@ Ag nanoclusters via aggregation-induced emission. Nanoscale 2014, 6, 157–161. [Google Scholar] [CrossRef]
- Miao, H.; Feng, Y.; Zhong, D.; Yang, X. Enhanced-fluorescence of europium–copper nanoclusters for cell imaging. J. Mater. Sci. 2016, 51, 7229–7235. [Google Scholar] [CrossRef]
- Li, D.; Zhou, D.; Xu, W.; Chen, X.; Pan, G.; Zhou, X.; Ding, N.; Song, H. Plasmonic photonic crystals induced two-order fluorescence enhancement of blue perovskite nanocrystals and its application for high-performance flexible ultraviolet photodetectors. Adv. Funct. Mater. 2018, 28, 1804429. [Google Scholar] [CrossRef]
- Dai, S.; Li, W.; Xu, R.; Wang, X.; Li, Q.; Dou, M.; Li, J. Label-Free Fluorescence Quantitative Detection Platform on Plasmonic Silica Photonic Crystal Microsphere Array. Anal. Chem. 2022, 94, 17939–17946. [Google Scholar] [CrossRef]
- Bhaskar, S.; Das, P.; Srinivasan, V.; Bhaktha, S.B.; Ramamurthy, S.S. Plasmonic-silver sorets and dielectric-Nd2O3 nanorods for ultrasensitive photonic crystal-coupled emission. Mater. Res. Bull. 2022, 145, 111558. [Google Scholar] [CrossRef]
- Langguth, L.; Punj, D.; Wenger, J.; Koenderink, A.F. Plasmonic band structure controls single-molecule fluorescence. ACS Nano 2013, 7, 8840–8848. [Google Scholar] [CrossRef]
- Barya, P.; Xiong, Y.; Shepherd, S.; Gupta, R.; Akin, L.D.; Tibbs, J.; Lee, H.; Singamaneni, S.; Cunningham, B.T. Photonic-Plasmonic Coupling Enhanced Fluorescence Enabling Digital-Resolution Ultrasensitive Protein Detection. Small 2023, 2207239. [Google Scholar] [CrossRef] [PubMed]
- Chen, G.; Wang, D.; Hong, W.; Sun, L.; Zhu, Y.; Chen, X. Fluorescence enhancement on large area self-assembled plasmonic-3D photonic crystals. Small 2017, 13, 1602612. [Google Scholar] [CrossRef] [PubMed]
- Nair, R.V.; Vijaya, R. Photonic crystal sensors: An overview. Prog. Quantum Electron. 2010, 34, 89–134. [Google Scholar] [CrossRef]
- Sinibaldi, A. Cancer biomarker detection with photonic crystals-based biosensors: An overview. J. Light. Technol. 2021, 39, 3871–3881. [Google Scholar] [CrossRef]
- Xuan, H.; Yao, C.; Hao, X.; Liu, C.; Ren, J.; Zhu, Y.; Xu, C.; Ge, L. Fluorescence enhancement with one-dimensional photonic crystals/nanoscaled ZnO composite thin films. Colloids Surfaces Physicochem. Eng. Asp. 2016, 497, 251–256. [Google Scholar] [CrossRef]
- Rout, D.; Vijaya, R. Localized surface plasmon-influenced fluorescence decay in dye-doped metallo-dielectric opals. J. Appl. Phys. 2016, 119. [Google Scholar] [CrossRef]
- Li, M.; Lai, X.; Li, C.; Song, Y. Recent advantages of colloidal photonic crystals and their applications for luminescence enhancement. Mater. Today Nano 2019, 6, 100039. [Google Scholar] [CrossRef]
- Eftekhari, E.; Li, X.; Kim, T.H.; Gan, Z.; Cole, I.S.; Zhao, D.; Kielpinski, D.; Gu, M.; Li, Q. Anomalous fluorescence enhancement from double heterostructure 3D colloidal photonic crystals–a multifunctional fluorescence-based sensor platform. Sci. Rep. 2015, 5, 14439. [Google Scholar] [CrossRef]
- Eftekhari, E.; Cole, I.S.; Li, Q. The effect of fluorophore incorporation on fluorescence enhancement in colloidal photonic crystals. Phys. Chem. Chem. Phys. 2016, 18, 1743–1749. [Google Scholar] [CrossRef]
- Li, Y.; Lu, X.; Yang, S. Preparation and properties of silver-deposited magnetically responsive colloidal photonic crystals for significant fluorescence enhancement. Opt. Mater. 2021, 122, 111815. [Google Scholar] [CrossRef]
- Song, J.; Feng, G.; Liu, X.; Hou, H.; Chen, Z. Genetic Algorithm-Assisted Design of Sandwiched One-Dimensional Photonic Crystals for Efficient Fluorescence Enhancement of 3.18-μm-Thick Layer of the Fluorescent Solution. Materials 2022, 15, 7803. [Google Scholar] [CrossRef]
- Cheng, Q.; Wang, S.; Liu, N. Enhancement Based on a Two-Dimensional Photonic Crystal Structure for Highly Sensitivity Flourescence-Based SO 2 Sensing. IEEE Sens. J. 2021, 21, 17785–17789. [Google Scholar] [CrossRef]
- Gao, Y.; Xu, S.; Liu, Z.; Yu, K.; Wang, C.; Wu, S.; Wang, J.; Pan, X. Fluorescence enhanced microfluidic sensor with CsPbI3 probe for lubricant copper ions on-site rapid detection based on SiO2 inverse opal photonic crystals. J. Lumin. 2021, 238, 118276. [Google Scholar] [CrossRef]
- Hu, J.; Hiwatashi, K.; Kurokawa, T.; Liang, S.M.; Wu, Z.L.; Gong, J.P. Microgel-reinforced hydrogel films with high mechanical strength and their visible mesoscale fracture structure. Macromolecules 2011, 44, 7775–7781. [Google Scholar] [CrossRef]
- Eelkema, R.; Pich, A. Pros and cons: Supramolecular or macromolecular: What is best for functional hydrogels with advanced properties? Adv. Mater. 2020, 32, 1906012. [Google Scholar] [CrossRef] [PubMed]
- Cayuela, A.; Soriano, M.L.; Kennedy, S.R.; Steed, J.; Valcárcel, M. Fluorescent carbon quantum dot hydrogels for direct determination of silver ions. Talanta 2016, 151, 100–105. [Google Scholar] [CrossRef]
- Leong, W.L.; Batabyal, S.K.; Kasapis, S.; Vittal, J.J. Fluorescent magnesium (II) coordination polymeric hydrogel. Chem. Eur. J. 2008, 14, 8822–8829. [Google Scholar] [CrossRef] [PubMed]
- Cayuela, A.; Kennedy, S.R.; Soriano, M.L.; Jones, C.D.; Valcárcel, M.; Steed, J.W. Fluorescent carbon dot–molecular salt hydrogels. Chem. Sci. 2015, 6, 6139–6146. [Google Scholar] [CrossRef] [PubMed]
- Kim, S.; Kim, H.; Qiao, T.; Cha, C.; Lee, S.K.; Lee, K.; Ro, H.J.; Kim, Y.; Lee, W.; Lee, H. Fluorescence enhancement from nitro-compound-sensitive bacteria within spherical hydrogel scaffolds. ACS Appl. Mater. Interfaces 2019, 11, 14354–14361. [Google Scholar] [CrossRef] [PubMed]
- Ikeda, M.; Ochi, R.; Hamachi, I. Supramolecular hydrogel-based protein and chemosensor array. Lab Chip 2010, 10, 3325–3334. [Google Scholar] [CrossRef] [PubMed]
- Xu, S.; Sedgwick, A.C.; Elfeky, S.A.; Chen, W.; Jones, A.S.; Williams, G.T.; Jenkins, A.T.A.; Bull, S.D.; Fossey, J.S.; James, T.D. A boronic acid-based fluorescent hydrogel for monosaccharide detection. Front. Chem. Sci. Eng. 2020, 14, 112–116. [Google Scholar] [CrossRef]
- Lu, Q.; Huang, T.; Zhou, J.; Zeng, Y.; Wu, C.; Liu, M.; Li, H.; Zhang, Y.; Yao, S. Limitation-induced fluorescence enhancement of carbon nanoparticles and their application for glucose detection. Spectrochim. Acta Part A Mol. Biomol. Spectrosc. 2021, 244, 118893. [Google Scholar] [CrossRef] [PubMed]
- Hwang, H.; Kim, H.; Myong, S. Protein induced fluorescence enhancement as a single molecule assay with short distance sensitivity. Proc. Natl. Acad. Sci. USA 2011, 108, 7414–7418. [Google Scholar] [CrossRef] [PubMed]
- Ploetz, E.; Ambrose, B.; Barth, A.; Börner, R.; Erichson, F.; Kapanidis, A.N.; Kim, H.D.; Levitus, M.; Lohman, T.M.; Mazumder, A.; et al. A new twist on PIFE: Photoisomerisation-related fluorescence enhancement. arXiv 2023, arXiv:2302.12455. [Google Scholar] [CrossRef] [PubMed]
- Koh, H.R.; Wang, X.; Myong, S. Visualizing repetitive diffusion activity of double-strand RNA binding proteins by single molecule fluorescence assays. Methods 2016, 105, 109–118. [Google Scholar] [CrossRef][Green Version]
- Deng, H.; Zhu, X. Emission enhancement and application of synthetic green fluorescent protein chromophore analogs. Mater. Chem. Front. 2017, 1, 619–629. [Google Scholar] [CrossRef]
- Dragan, A.; Casas-Finet, J.; Bishop, E.; Strouse, R.; Schenerman, M.; Geddes, C. Characterization of PicoGreen interaction with dsDNA and the origin of its fluorescence enhancement upon binding. Biophys. J. 2010, 99, 3010–3019. [Google Scholar] [CrossRef]
- Licchelli, M.; Orbelli Biroli, A.; Poggi, A. A prototype for the chemosensing of Ba2+ based on self-assembling fluorescence enhancement. Org. Lett. 2006, 8, 915–918. [Google Scholar] [CrossRef]
- Li, H.; Fan, J.; Song, F.; Zhu, H.; Du, J.; Sun, S.; Peng, X. Fluorescent probes for Pd2+ detection by allylidene–hydrazone ligands with excellent selectivity and large fluorescence enhancement. Chem. Eur. J. 2010, 16, 12349–12356. [Google Scholar] [CrossRef] [PubMed]
- Yang, J.S.; Chiou, S.Y.; Liau, K.L. Fluorescence enhancement of trans-4-aminostilbene by N-phenyl substitutions: The “amino conjugation effect”. J. Am. Chem. Soc. 2002, 124, 2518–2527. [Google Scholar] [CrossRef]
- Baglole, K.N.; Boland, P.G.; Wagner, B.D. Fluorescence enhancement of curcumin upon inclusion into parent and modified cyclodextrins. J. Photochem. Photobiol. Chem. 2005, 173, 230–237. [Google Scholar] [CrossRef]
- Jiang, L.; Ding, H.; Lu, S.; Geng, T.; Xiao, G.; Zou, B.; Bi, H. Photoactivated fluorescence enhancement in F, N-doped carbon dots with piezochromic behavior. Angew. Chem. 2020, 132, 10072–10077. [Google Scholar] [CrossRef]
- Bok, S.; Korampally, V.; Polo-Parada, L.; Mamidi, V.; Baker, G.A.; Gangopadhyay, K.; Gangopadhyay, S. Confeito-like assembly of organosilicate-caged fluorophores: Ultrabright suprananoparticles for fluorescence imaging. Nanotechnology 2012, 23, 175601. [Google Scholar] [CrossRef] [PubMed][Green Version]
- Bok, S.; Korampally, V.; Darr, C.M.; Folk, W.R.; Polo-Parada, L.; Gangopadhyay, K.; Gangopadhyay, S. Femtogram-level detection of Clostridium botulinum neurotoxin type A by sandwich immunoassay using nanoporous substrate and ultra-bright fluorescent suprananoparticles. Biosens. Bioelectron. 2013, 41, 409–416. [Google Scholar] [CrossRef] [PubMed]
- Oliverio, M.; Perotto, S.; Messina, G.C.; Lovato, L.; De Angelis, F. Chemical functionalization of plasmonic surface biosensors: A tutorial review on issues, strategies, and costs. ACS Appl. Mater. Interfaces 2017, 9, 29394–29411. [Google Scholar] [CrossRef]
- Balbinot, S.; Srivastav, A.M.; Vidic, J.; Abdulhalim, I.; Manzano, M. Plasmonic biosensors for food control. Trends Food Sci. Technol. 2021, 111, 128–140. [Google Scholar] [CrossRef]
- Usman, F.; Dennis, J.O.; Aljameel, A.I.; Ali, M.K.; Aldaghri, O.; Ibnaouf, K.H.; Zango, Z.U.; Beygisangchin, M.; Alsadig, A.; Meriaudeau, F. Plasmonic Biosensors for the Detection of Lung Cancer Biomarkers: A Review. Chemosensors 2021, 9, 326. [Google Scholar] [CrossRef]
- Hamza, M.E.; Othman, M.A.; Swillam, M.A. Plasmonic biosensors. Biology 2022, 11, 621. [Google Scholar] [CrossRef]
- Mondal, B.; Zeng, S. Recent advances in Surface Plasmon Resonance for biosensing applications and future prospects. Nanophotonics Biomed. Eng. 2021, 21–48. [Google Scholar]
- Miyazaki, C.M.; Shimizu, F.M.; Ferreira, M. Surface plasmon resonance (SPR) for sensors and biosensors. In Nanocharacterization Techniques; Elsevier: Amsterdam, The Netherlands, 2017; pp. 183–200. [Google Scholar]
- Hill, R.T. Plasmonic biosensors. Wiley Interdiscip. Rev. Nanomed. Nanobiotechnol. 2015, 7, 152–168. [Google Scholar] [CrossRef]
- Esfandyarpour, R.; Esfandyarpour, H.; Harris, J.S.; Davis, R.W. Simulation and fabrication of a new novel 3D injectable biosensor for high throughput genomics and proteomics in a lab-on-a-chip device. Nanotechnology 2013, 24, 465301. [Google Scholar] [CrossRef]
- Qasim, M.; Lim, D.J.; Park, H.; Na, D. Nanotechnology for diagnosis and treatment of infectious diseases. J. Nanosci. Nanotechnol. 2014, 14, 7374–7387. [Google Scholar] [CrossRef] [PubMed]
- Zhao, X.; Lin, C.W.; Wang, J.; Oh, D.H. Advances in rapid detection methods for foodborne pathogens. J. Microbiol. Biotechnol. 2014, 24, 297–312. [Google Scholar] [CrossRef] [PubMed]
- Bağcı, U.; Bray, M.; Caban, J.; Yao, J.; Mollura, D.J. Computer-assisted detection of infectious lung diseases: A review. Comput. Med. Imaging Graph. 2012, 36, 72–84. [Google Scholar] [CrossRef] [PubMed]
- Yamamoto, K.; Ohmagari, N. Microbiological testing for coronavirus disease 2019. JMA J. 2021, 4, 67–75. [Google Scholar] [PubMed]
- Li, D.; Zhang, J.; Li, J. Primer design for quantitative real-time PCR for the emerging Coronavirus SARS-CoV-2. Theranostics 2020, 10, 7150. [Google Scholar] [CrossRef] [PubMed]
- Mauriz, E. Recent progress in plasmonic biosensing schemes for virus detection. Sensors 2020, 20, 4745. [Google Scholar] [CrossRef] [PubMed]
- Singh, P. Surface plasmon resonance: A boon for viral diagnostics. Ref. Modul. Life Sci. 2017, 2017, B978-0-12-809633-8.12245-9. [Google Scholar]
- Li, A.; Singh, S.; Sievenpiper, D. Metasurfaces and their applications. Nanophotonics 2018, 7, 989–1011. [Google Scholar] [CrossRef]
- Blumenfeld, N.R.; Bolene, M.A.E.; Jaspan, M.; Ayers, A.G.; Zarrandikoetxea, S.; Freudman, J.; Shah, N.; Tolwani, A.M.; Hu, Y.; Chern, T.L.; et al. Multiplexed reverse-transcriptase quantitative polymerase chain reaction using plasmonic nanoparticles for point-of-care COVID-19 diagnosis. Nat. Nanotechnol. 2022, 17, 984–992. [Google Scholar] [CrossRef] [PubMed]
- Liu, T.; Hsiung, J.; Zhao, S.; Kost, J.; Sreedhar, D.; Hanson, C.V.; Olson, K.; Keare, D.; Chang, S.T.; Bliden, K.P.; et al. Quantification of antibody avidities and accurate detection of SARS-CoV-2 antibodies in serum and saliva on plasmonic substrates. Nat. Biomed. Eng. 2020, 4, 1188–1196. [Google Scholar] [CrossRef] [PubMed]
- Li, D.; Zhou, Z.; Sun, J.; Mei, X. Prospects of NIR fluorescent nanosensors for green detection of SARS-CoV-2. Sensors Actuators B Chem. 2022, 362, 131764. [Google Scholar] [CrossRef]
- Gao, Y.; Han, Y.; Wang, C.; Qiang, L.; Gao, J.; Wang, Y.; Liu, H.; Han, L.; Zhang, Y. Rapid and sensitive triple-mode detection of causative SARS-CoV-2 virus specific genes through interaction between genes and nanoparticles. Anal. Chim. Acta 2021, 1154, 338330. [Google Scholar] [CrossRef]
- Chang, Y.F.; Wang, S.F.; Huang, J.C.; Su, L.C.; Yao, L.; Li, Y.C.; Wu, S.C.; Chen, Y.M.A.; Hsieh, J.P.; Chou, C. Detection of swine-origin influenza A (H1N1) viruses using a localized surface plasmon coupled fluorescence fiber-optic biosensor. Biosens. Bioelectron. 2010, 26, 1068–1073. [Google Scholar] [CrossRef] [PubMed]
- Takemura, K.; Adegoke, O.; Takahashi, N.; Kato, T.; Li, T.C.; Kitamoto, N.; Tanaka, T.; Suzuki, T.; Park, E.Y. Versatility of a localized surface plasmon resonance-based gold nanoparticle-alloyed quantum dot nanobiosensor for immunofluorescence detection of viruses. Biosens. Bioelectron. 2017, 89, 998–1005. [Google Scholar] [CrossRef]
- Pang, Y.; Rong, Z.; Wang, J.; Xiao, R.; Wang, S. A fluorescent aptasensor for H5N1 influenza virus detection based-on the core–shell nanoparticles metal-enhanced fluorescence (MEF). Biosens. Bioelectron. 2015, 66, 527–532. [Google Scholar] [CrossRef]
- Eksin, E.; Erdem, A. Recent progress on optical biosensors developed for nucleic acid detection related to infectious viral diseases. Micromachines 2023, 14, 295. [Google Scholar] [CrossRef]
- Shi, K.; Na, N.; Ouyang, J. Label-and enzyme-free plasmon-enhanced single molecule fluorescence detection of HIV DNA fragments based on a catalytic hairpin assembly. Analyst 2022, 147, 604–613. [Google Scholar] [CrossRef]
- Kurdekar, A.; Chunduri, L.A.; Haleyurgirisetty, M.K.; Hewlett, I.K.; Kamisetti, V. Sub-picogram level sensitivity in HIV diagnostics achieved with the europium nanoparticle immunoassay through metal enhanced fluorescence. Nanoscale Adv. 2019, 1, 273–280. [Google Scholar] [CrossRef]
- Jin, F.; Li, H.; Xu, D. Enzyme-free fluorescence microarray for determination of hepatitis B virus DNA based on silver nanoparticle aggregates-assisted signal amplification. Anal. Chim. Acta 2019, 1077, 297–304. [Google Scholar] [CrossRef] [PubMed]
- Riedel, T.; Hageneder, S.; Surman, F.; Pop-Georgievski, O.; Noehammer, C.; Hofner, M.; Brynda, E.; Rodriguez-Emmenegger, C.; Dostalek, J. Plasmonic hepatitis B biosensor for the analysis of clinical saliva. Anal. Chem. 2017, 89, 2972–2977. [Google Scholar] [CrossRef]
- Ghafary, Z.; Hallaj, R.; Salimi, A.; Akhtari, K. A novel immunosensing method based on the capture and enzymatic release of sandwich-type covalently conjugated thionine–gold nanoparticles as a new fluorescence label used for ultrasensitive detection of hepatitis B virus surface antigen. ACS Omega 2019, 4, 15323–15336. [Google Scholar] [CrossRef] [PubMed]
- Zang, F.; Su, Z.; Zhou, L.; Konduru, K.; Kaplan, G.; Chou, S.Y. Ultrasensitive Ebola virus antigen sensing via 3D nanoantenna arrays. Adv. Mater. 2019, 31, 1902331. [Google Scholar] [CrossRef] [PubMed]
- Chowdhury, A.D.; Takemura, K.; Khorish, I.M.; Nasrin, F.; Tun, M.M.N.; Morita, K.; Park, E.Y. The detection and identification of dengue virus serotypes with quantum dot and AuNP regulated localized surface plasmon resonance. Nanoscale Adv. 2020, 2, 699–709. [Google Scholar] [CrossRef]
- Adegoke, O.; Park, E.Y. Bright luminescent optically engineered core/alloyed shell quantum dots: An ultrasensitive signal transducer for dengue virus RNA via localized surface plasmon resonance-induced hairpin hybridization. J. Mater. Chem. B 2017, 5, 3047–3058. [Google Scholar] [CrossRef]
- Camacho, S.; Sobral-Filho, R.; Aoki, P.; Constantino, C.; Brolo, A. Immunoassay quantification using surface-enhanced fluorescence (SEF) tags. Analyst 2017, 142, 2717–2724. [Google Scholar] [CrossRef]
- Della Ventura, B.; Gelzo, M.; Battista, E.; Alabastri, A.; Schirato, A.; Castaldo, G.; Corso, G.; Gentile, F.; Velotta, R. Biosensor for point-of-care analysis of immunoglobulins in urine by metal enhanced fluorescence from gold nanoparticles. ACS Appl. Mater. Interfaces 2019, 11, 3753–3762. [Google Scholar] [CrossRef]
- Dutta Chowdhury, A.; Ganganboina, A.B.; Nasrin, F.; Takemura, K.; Doong, R.a.; Utomo, D.I.S.; Lee, J.; Khoris, I.M.; Park, E.Y. Femtomolar detection of dengue virus DNA with serotype identification ability. Anal. Chem. 2018, 90, 12464–12474. [Google Scholar] [CrossRef] [PubMed]
- Bok, S.; Pathan, S.; Wood, A.; Chen, B.; Mathai, C.; Gangopadhyay, K.; Grant, S.; McArthur, C.; Gangopadhyay, S. Highly sensitive plasmonic grating platform for the detection of a wide range of infectious diseases. In Proceedings of the 2015 Transducers-2015 18th International Conference on Solid-State Sensors, Actuators and Microsystems (TRANSDUCERS), Anchorage, AK, USA, 21–25 June 2015; pp. 1573–1576. [Google Scholar]
- Narmani, A.; Kamali, M.; Amini, B.; Kooshki, H.; Amini, A.; Hasani, L. Highly sensitive and accurate detection of Vibrio cholera O1 OmpW gene by fluorescence DNA biosensor based on gold and magnetic nanoparticles. Process. Biochem. 2018, 65, 46–54. [Google Scholar] [CrossRef]
- Huang, R.; Xu, Y.; Du, J.; Guan, Q.; Cai, X.; Li, F.; Wang, J.; Chen, W. A fluorescent sensor based on the cascade signal amplification strategy for ultra-sensitive detection of Cu2+. Nanoscale 2023, 15, 1806–1812. [Google Scholar] [CrossRef] [PubMed]


Disclaimer/Publisher’s Note: The statements, opinions and data contained in all publications are solely those of the individual author(s) and contributor(s) and not of MDPI and/or the editor(s). MDPI and/or the editor(s) disclaim responsibility for any injury to people or property resulting from any ideas, methods, instructions or products referred to in the content. |
© 2024 by the authors. Licensee MDPI, Basel, Switzerland. This article is an open access article distributed under the terms and conditions of the Creative Commons Attribution (CC BY) license (https://creativecommons.org/licenses/by/4.0/).
Share and Cite
Hasan, J.; Bok, S. Plasmonic Fluorescence Sensors in Diagnosis of Infectious Diseases. Biosensors 2024, 14, 130. https://doi.org/10.3390/bios14030130
Hasan J, Bok S. Plasmonic Fluorescence Sensors in Diagnosis of Infectious Diseases. Biosensors. 2024; 14(3):130. https://doi.org/10.3390/bios14030130
Chicago/Turabian StyleHasan, Juiena, and Sangho Bok. 2024. "Plasmonic Fluorescence Sensors in Diagnosis of Infectious Diseases" Biosensors 14, no. 3: 130. https://doi.org/10.3390/bios14030130
APA StyleHasan, J., & Bok, S. (2024). Plasmonic Fluorescence Sensors in Diagnosis of Infectious Diseases. Biosensors, 14(3), 130. https://doi.org/10.3390/bios14030130