An Accelerometer-Based Wearable Patch for Robust Respiratory Rate and Wheeze Detection Using Deep Learning

 ,
,
Abstract
1. Introduction
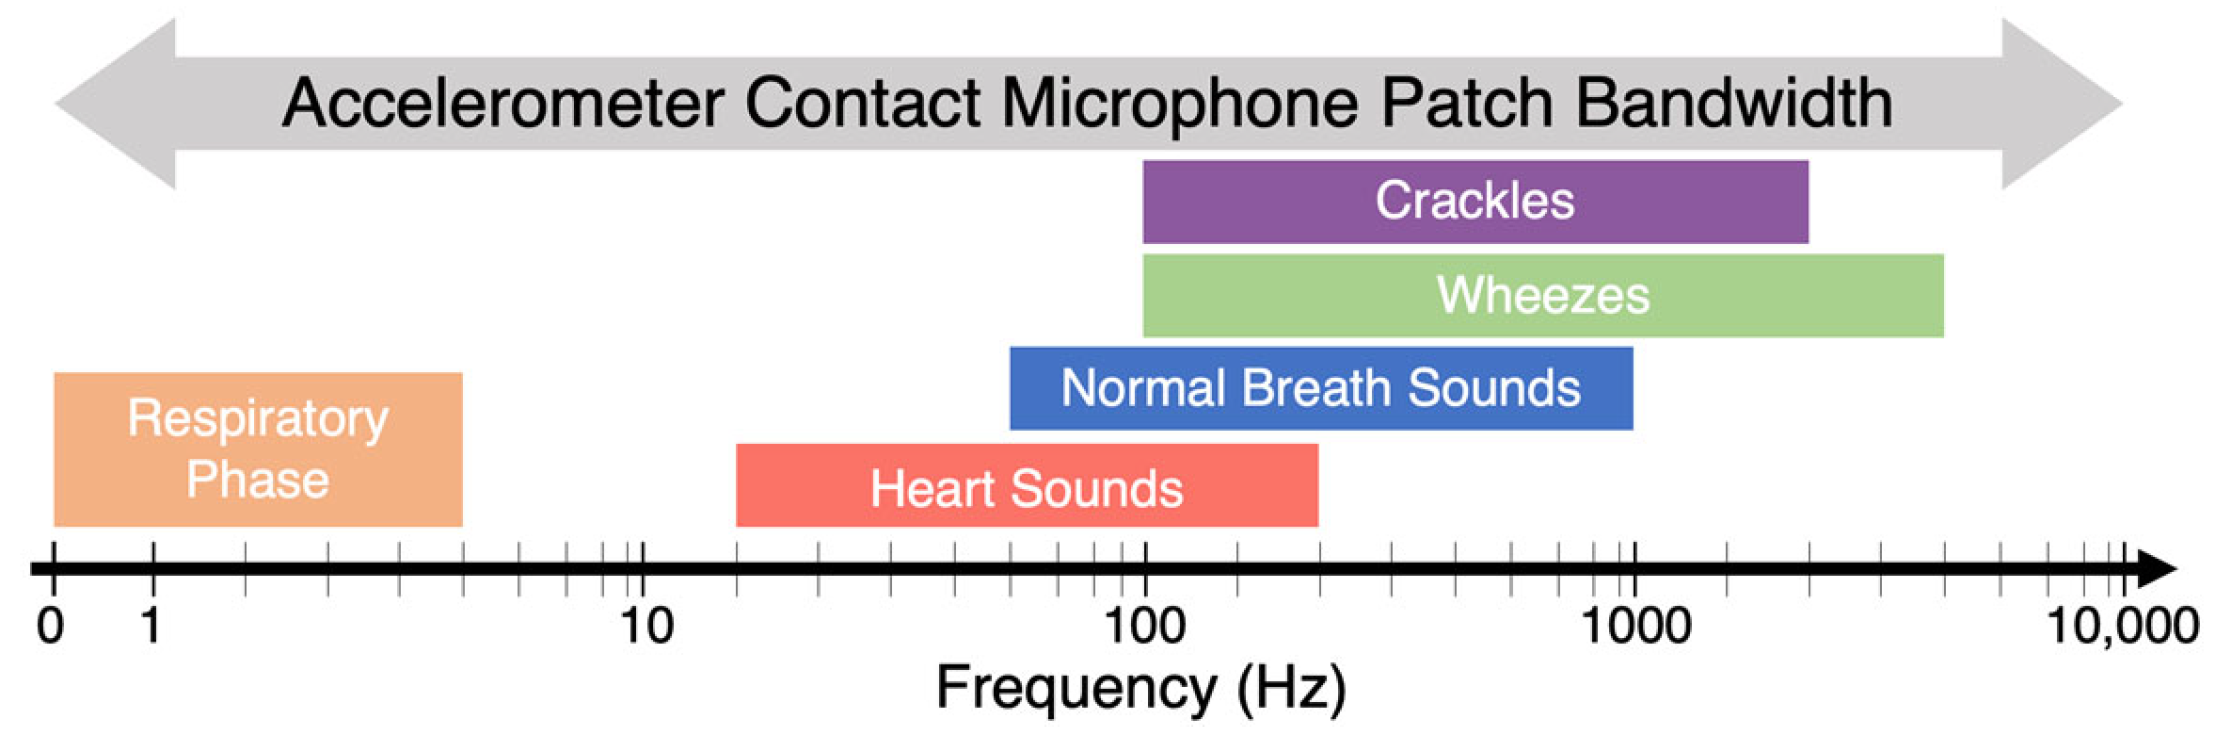
1.1. Lung Auscultation
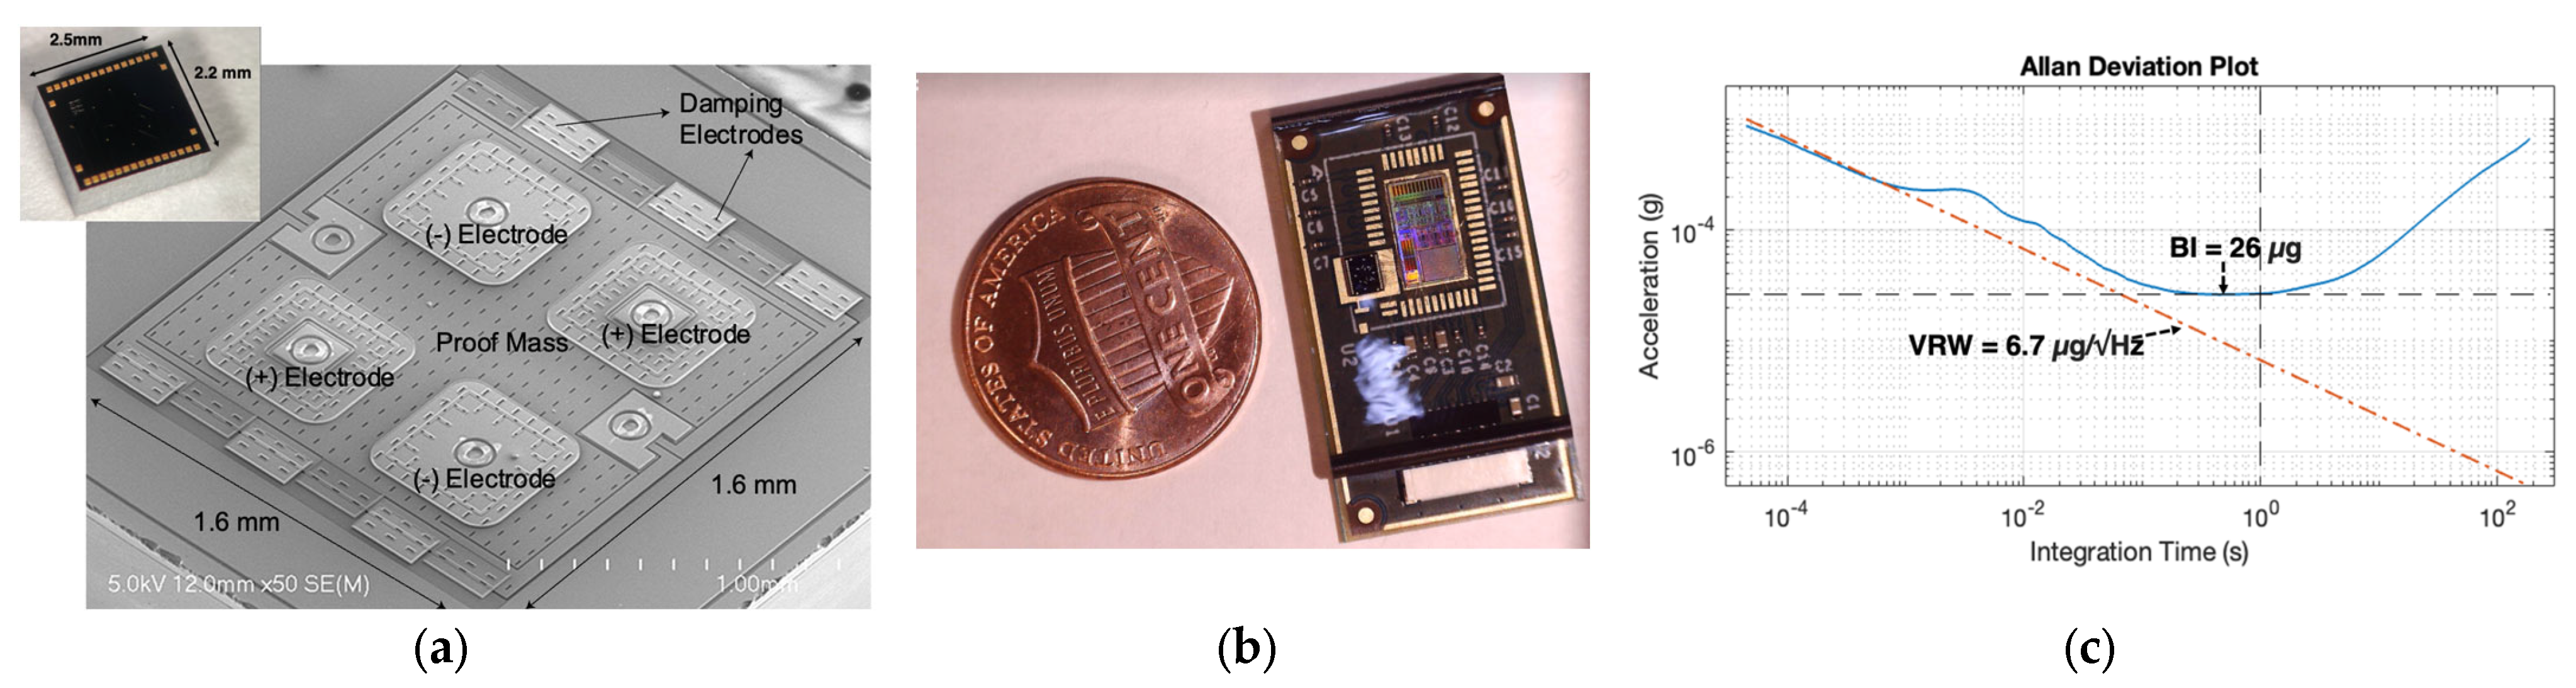
1.2. Accelerometer-Based Wearable Patch
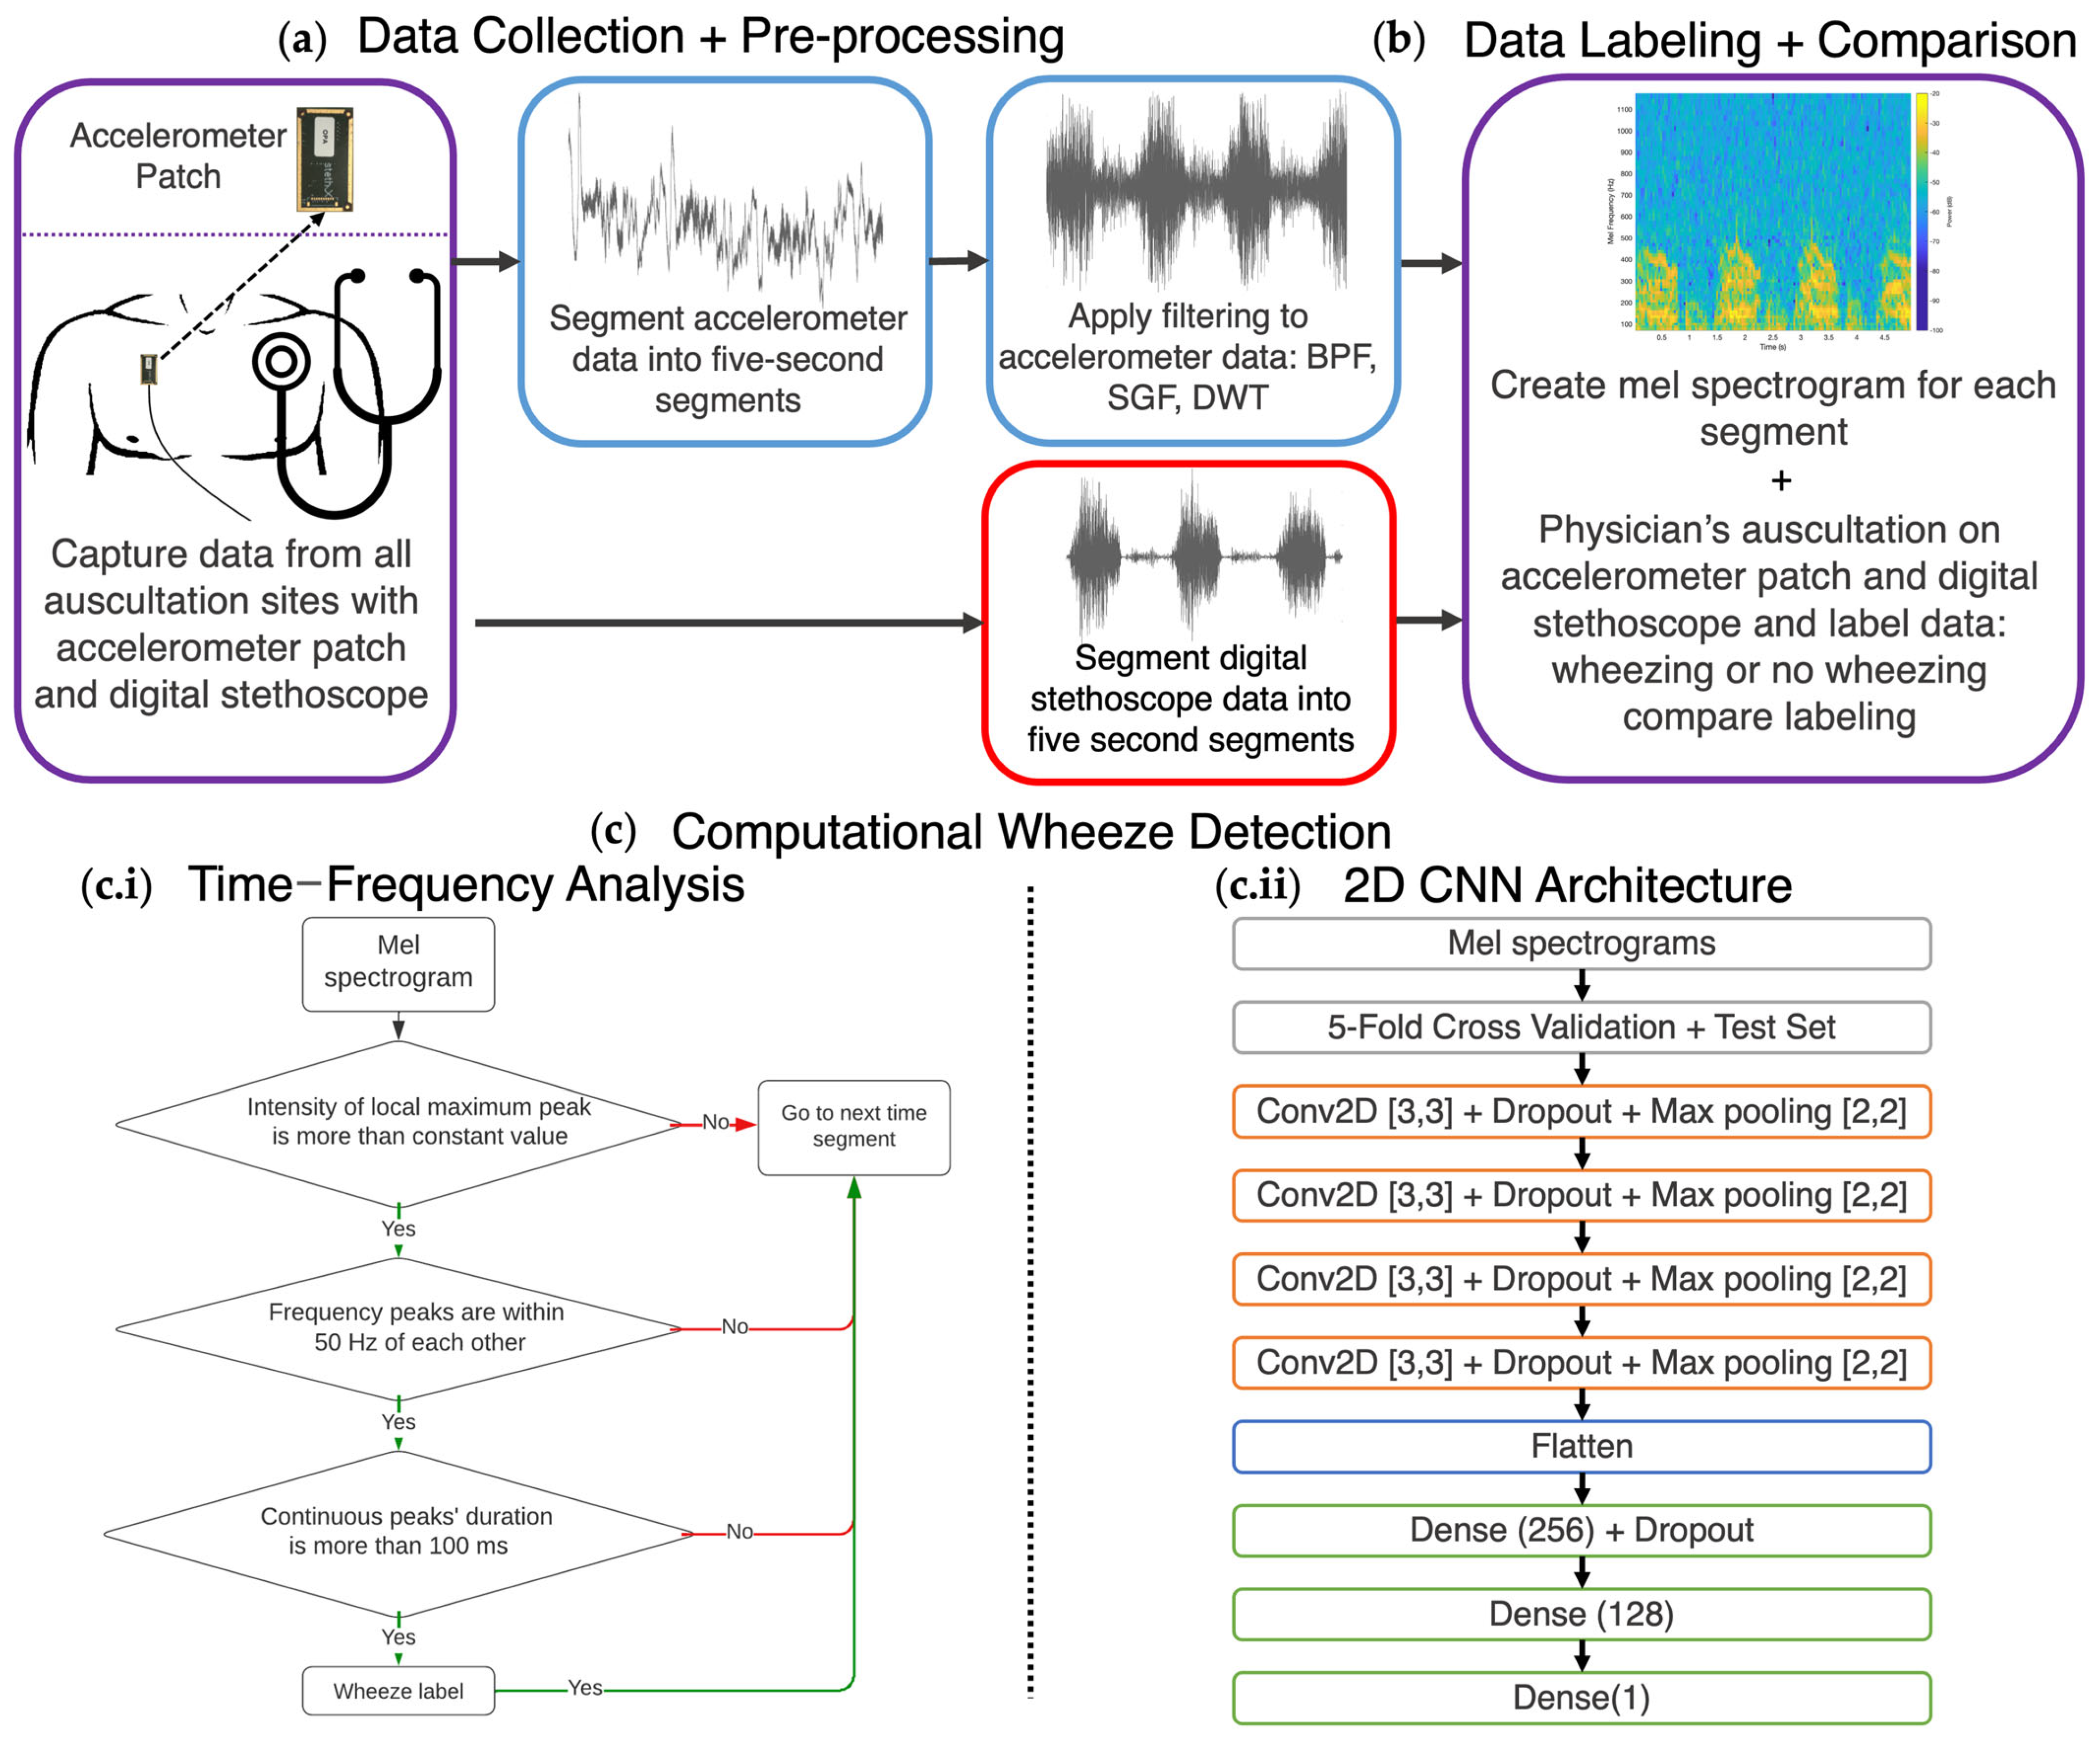
2. Methodology
2.1. Participants
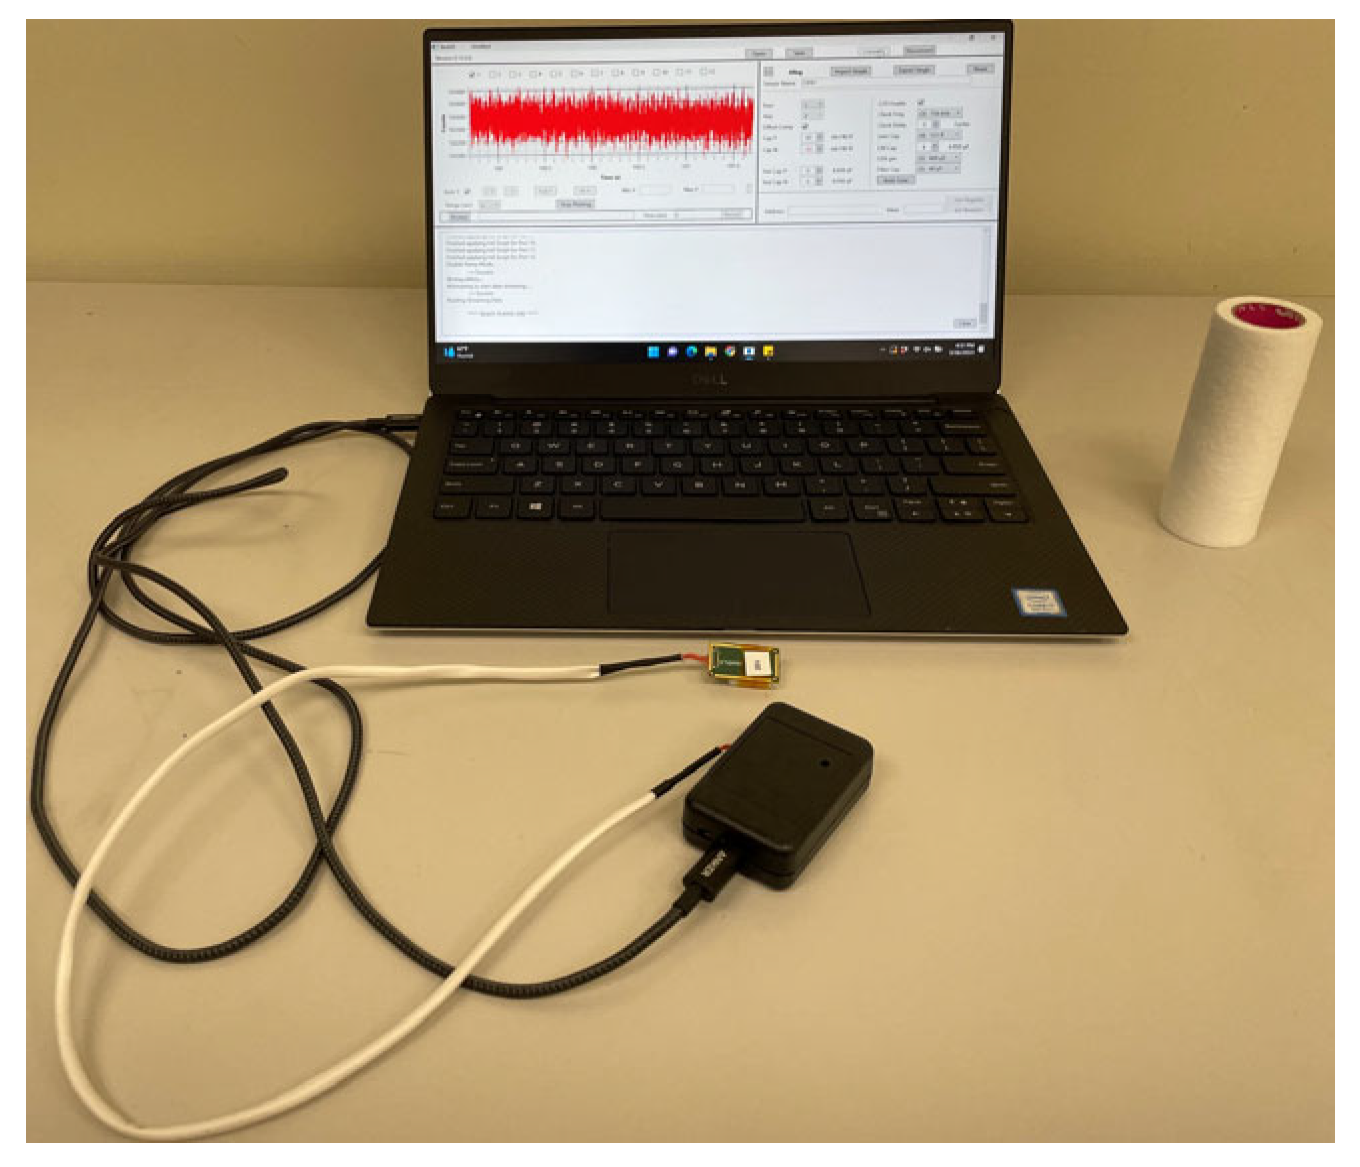
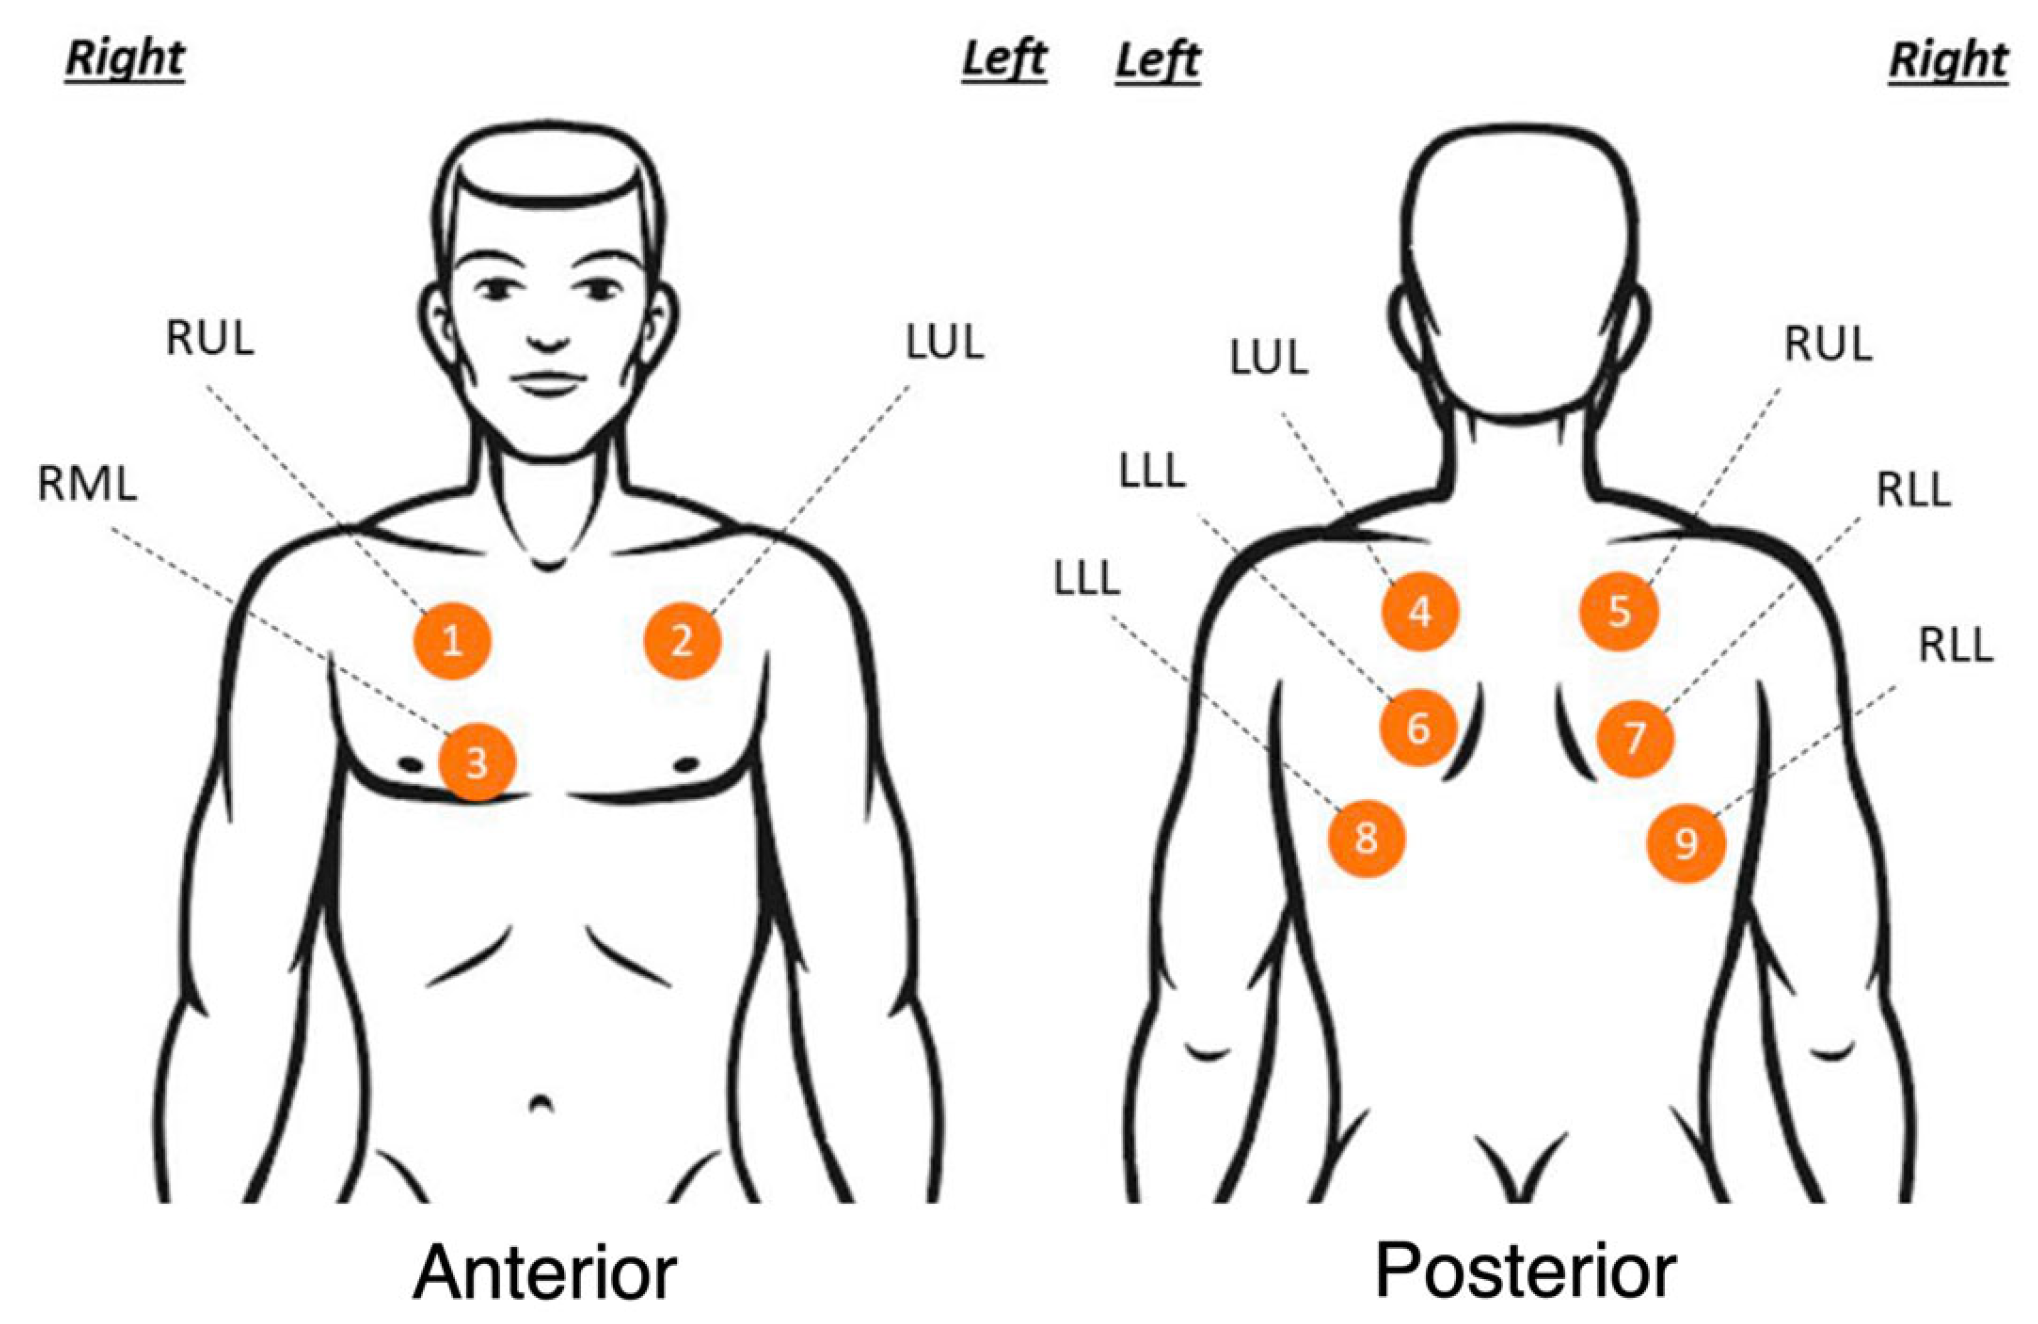
2.2. Study Protocol
2.3. Signal Denoising and Analysis
2.4. Wheeze Detection Time–Frequency Analysis
2.5. Classification of Wheezing via Convolutional Neural Network (CNN)
2.6. Digital Stethoscope Computational Wheeze Detection
3. Results
3.1. Patient Clinical Characteristics
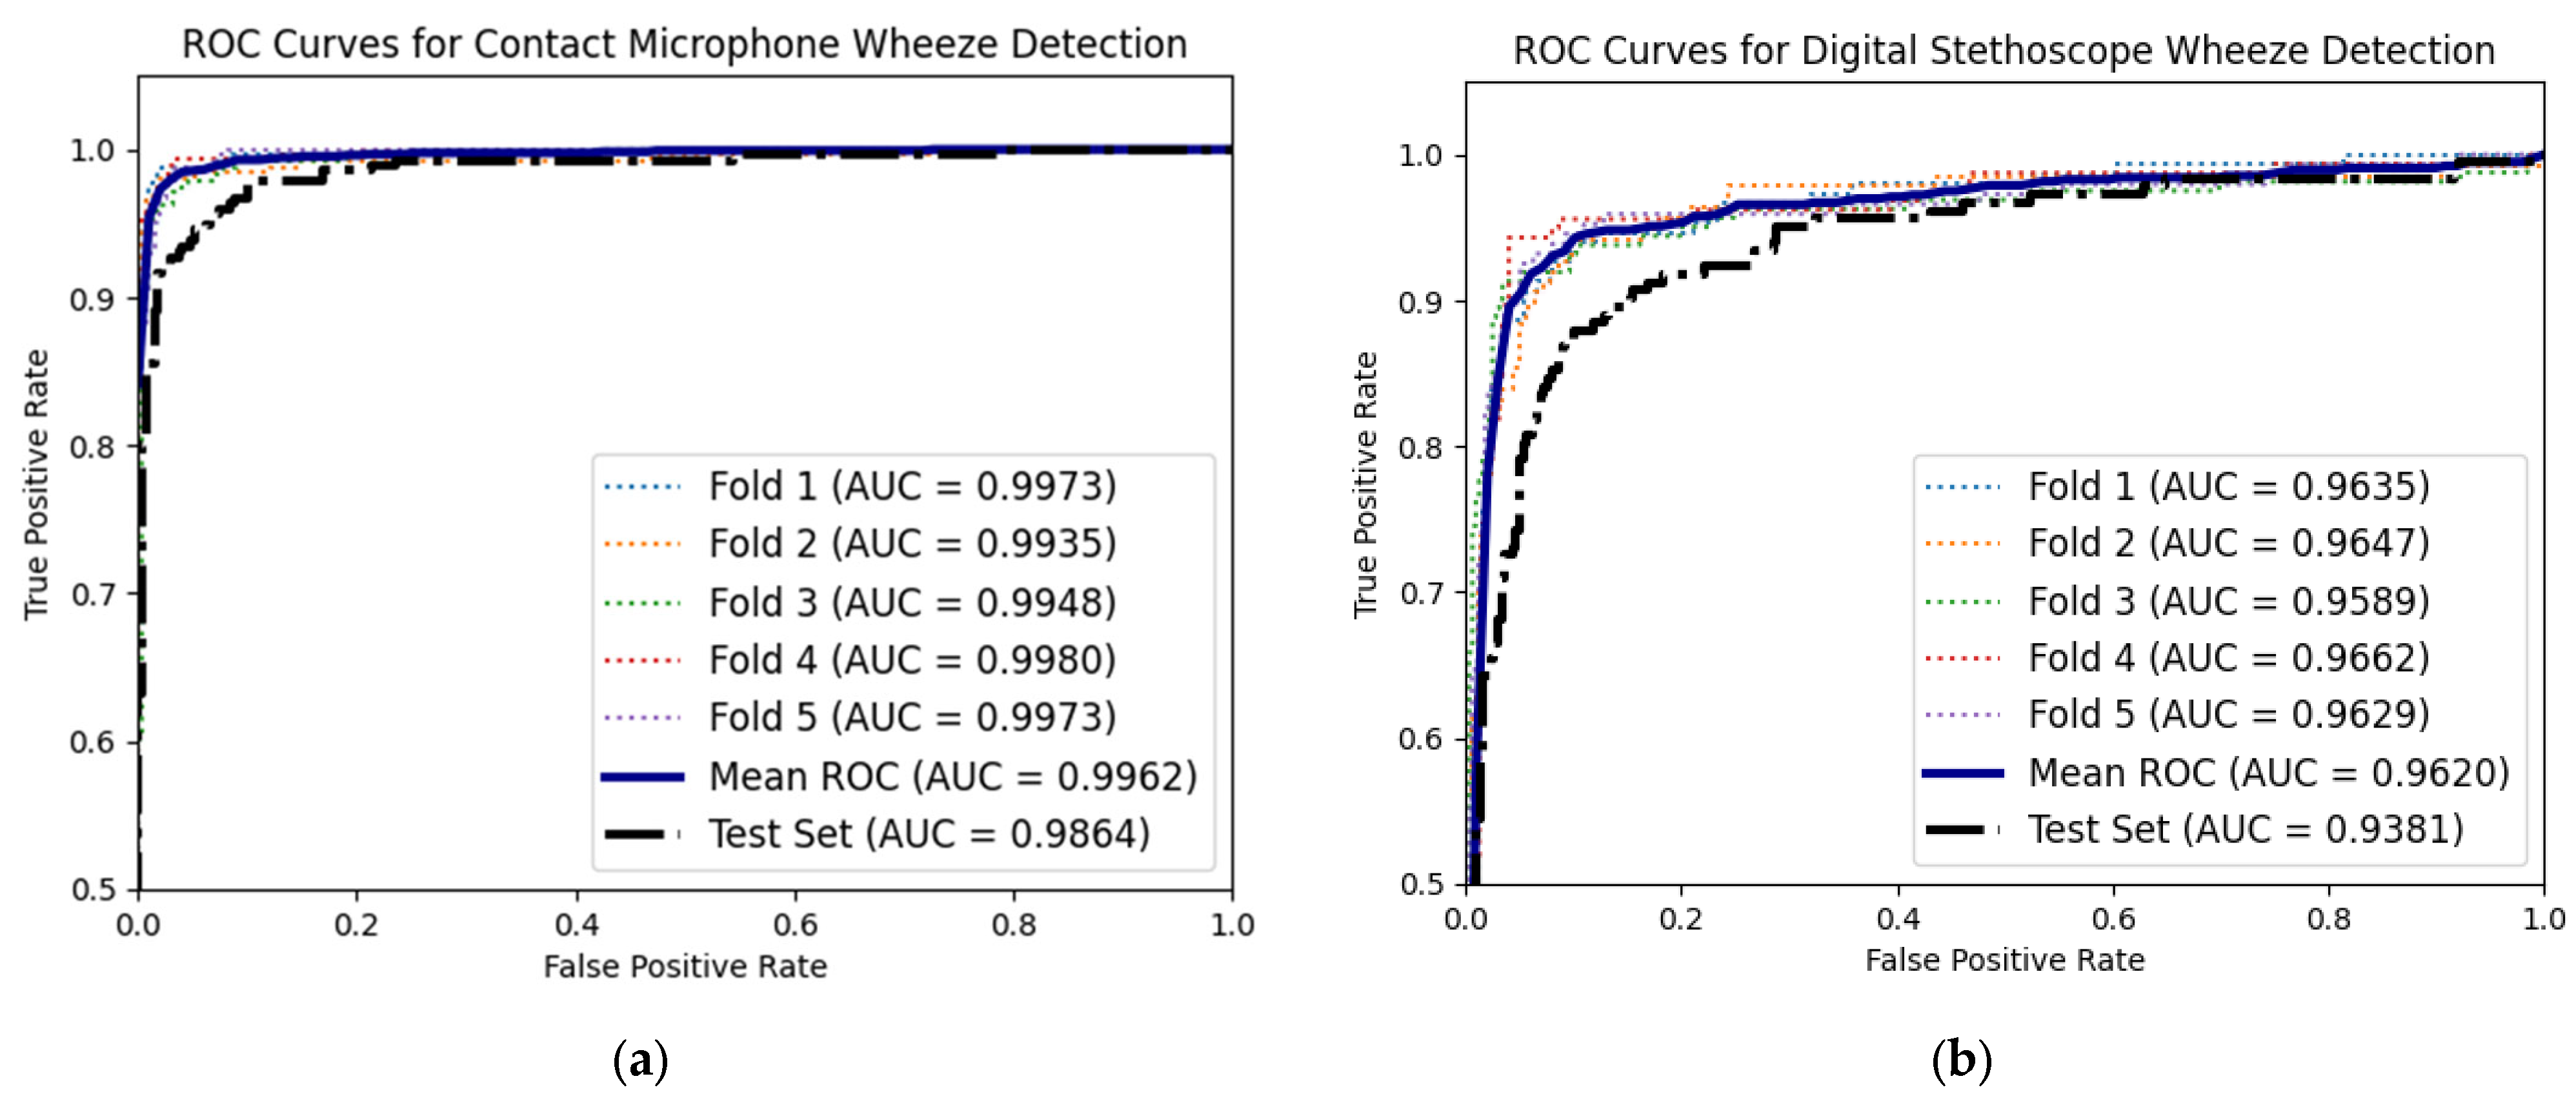
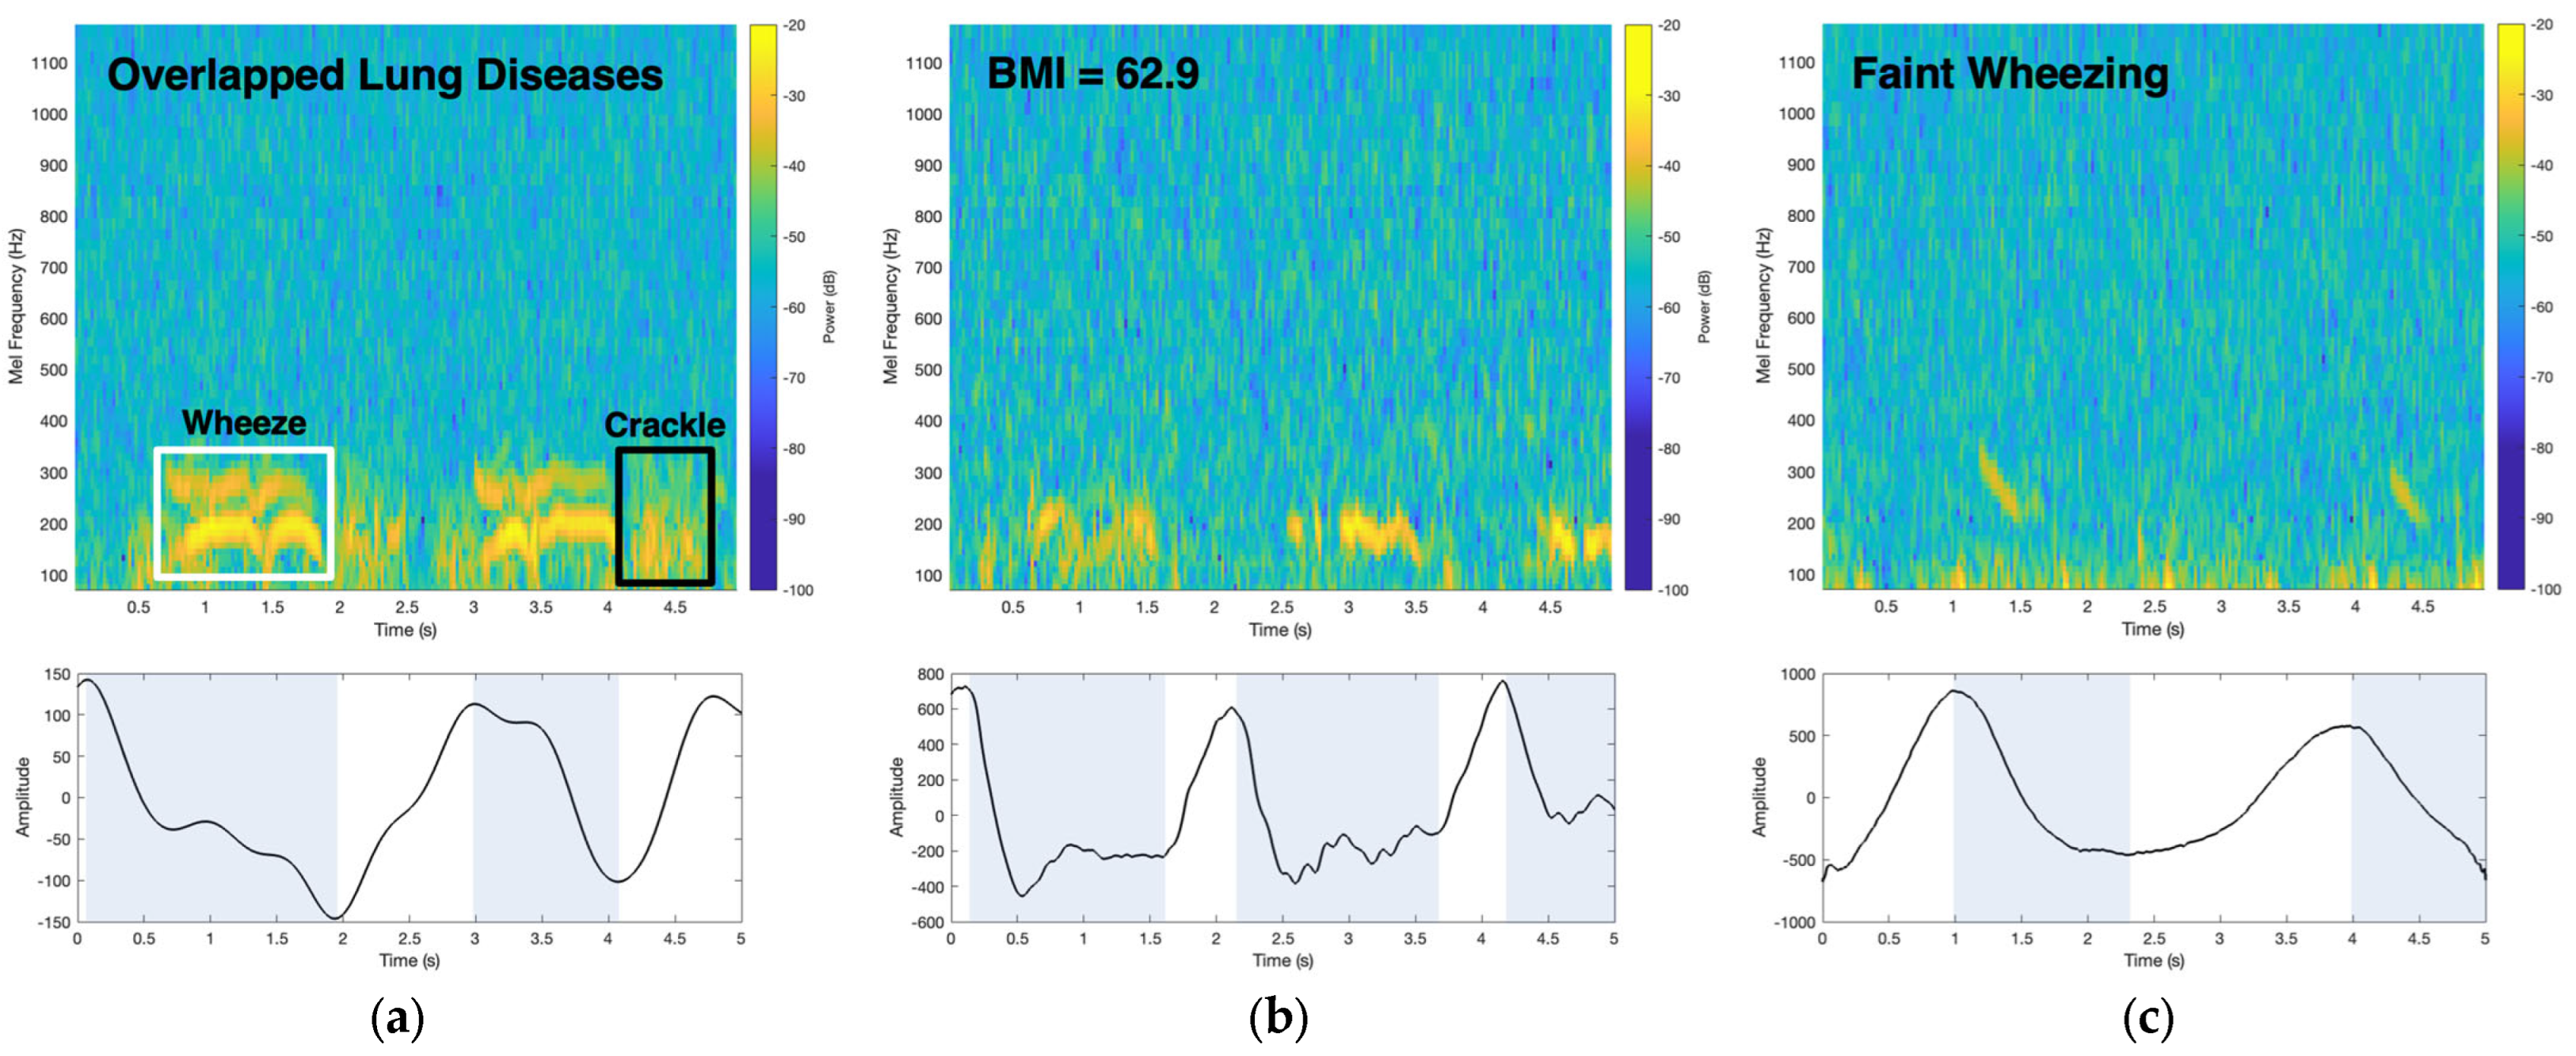
3.2. Comparing Time–Frequency Wheeze Detecting with Deep Learning Wheeze Classifier Using Accelerometer Mel Spectrograms
3.3. Digital Stethoscope Computational Wheeze-Detection Method Performance
3.4. Patient Data
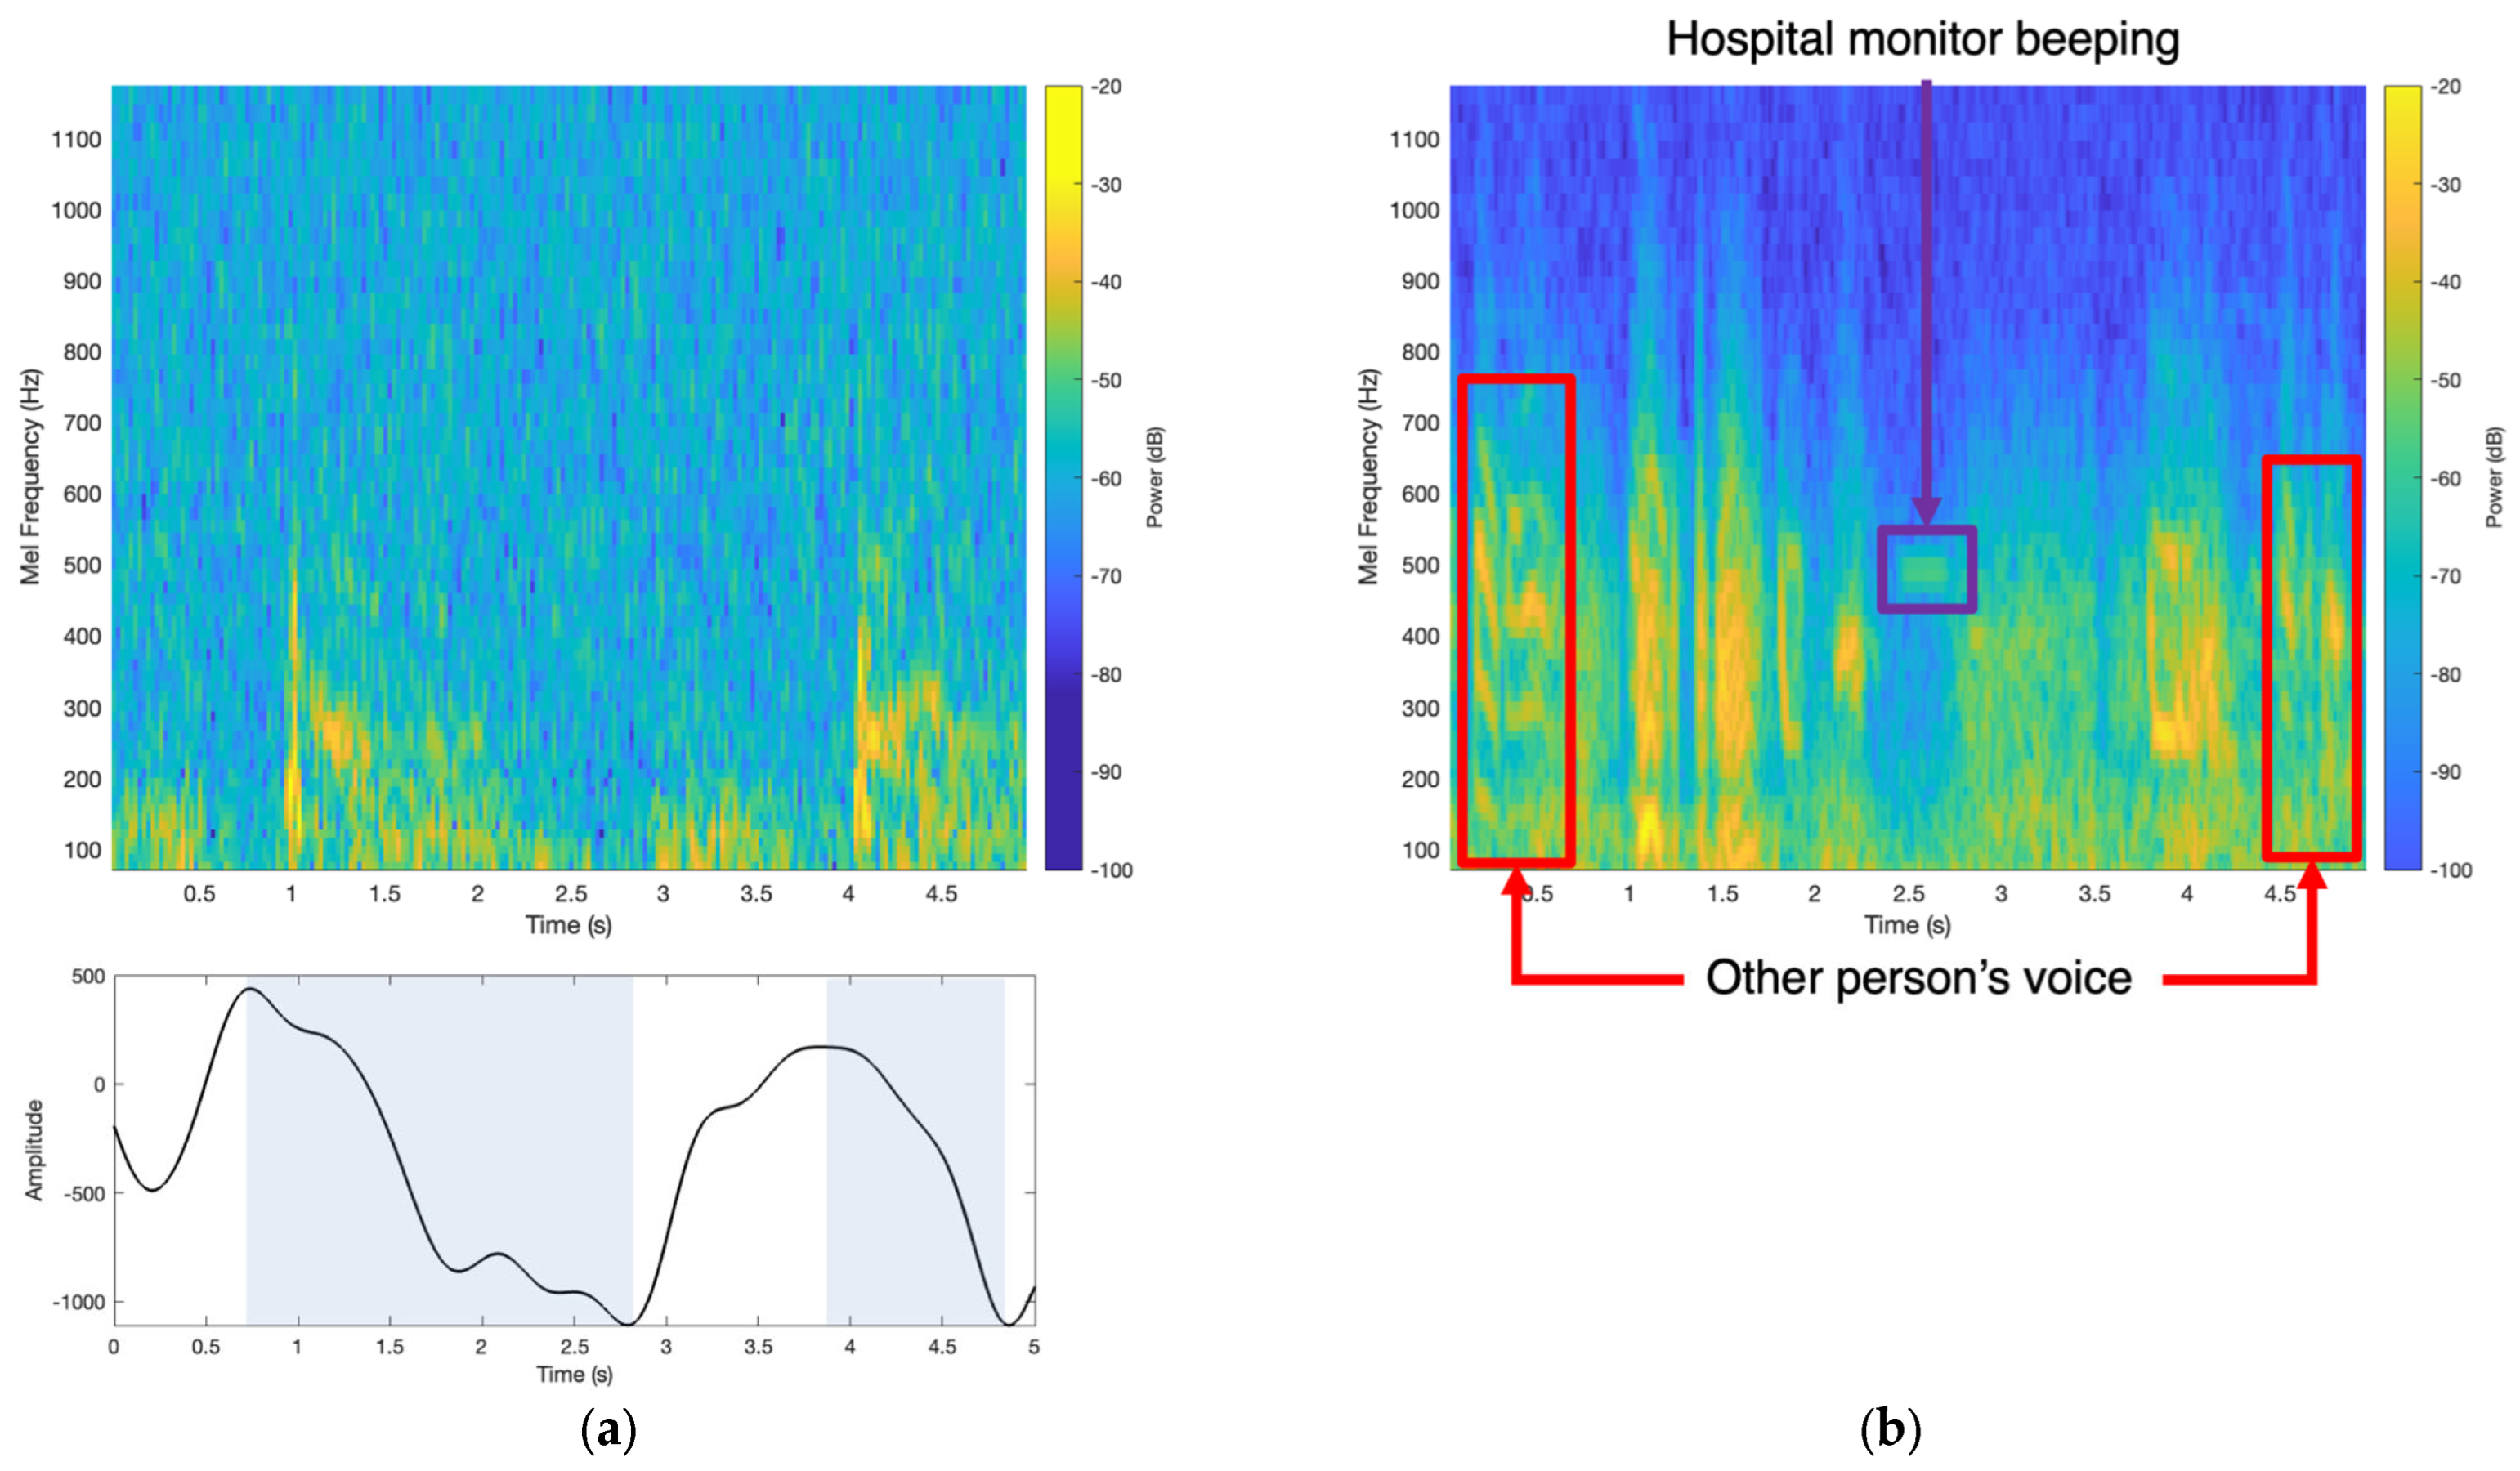
3.5. Comparison of Accelerometer Patch and Digital Stethoscope in a Noisy Environment
4. Discussion
5. Conclusions
Supplementary Materials
Author Contributions
Funding
Institutional Review Board Statement
Informed Consent Statement
Data Availability Statement
Conflicts of Interest
References
- Stern, J.; Pier, J.; Litonjua, A.A. Asthma epidemiology and risk factors. Semin. Immunopathol. 2020, 42, 5–15. [Google Scholar] [CrossRef]
- Enilari, O.; Sinha, S. The global impact of asthma in adult populations. Ann. Glob. Health 2019, 85, 2. [Google Scholar] [CrossRef] [PubMed]
- Serebrisky, D.; Wiznia, A. Pediatric asthma: A global epidemic. Ann. Glob. Health 2019, 85, 6. [Google Scholar] [CrossRef]
- Braman, S.S. The global burden of asthma. Chest 2006, 130, 4S–12S. [Google Scholar] [CrossRef]
- Barnes, P.; Jonsson, B.; Klim, J. The costs of asthma. Eur. Respir. J. 1996, 9, 636–642. [Google Scholar] [CrossRef]
- Quaderi, S.A.; Hurst, J.R. The unmet global burden of COPD. Glob. Health Epidemiol. Genom. 2018, 3, e4. [Google Scholar] [CrossRef] [PubMed]
- Momtazmanesh, S.; Moghaddam, S.S.; Ghamari, S.-H.; Rad, E.M.; Rezaei, N.; Shobeiri, P.; Aali, A.; Abbasi-Kangevari, M.; Abbasi-Kangevari, Z.; Abdelmasseh, M.; et al. Global burden of chronic respiratory diseases and risk factors, 1990–2019: An update from the Global Burden of Disease Study 2019. EClinicalMedicine 2023, 59, 101936. [Google Scholar] [CrossRef]
- Dharmage, S.C.; Perret, J.L.; Custovic, A. Epidemiology of asthma in children and adults. Front. Pediatr. 2019, 7, 246. [Google Scholar] [CrossRef] [PubMed]
- Agustí, A.; Vogelmeier, C.; Faner, R. COPD 2020: Changes and challenges. Am. J. Physiol. Cell. Mol. Physiol. 2020, 319, L879–L883. [Google Scholar] [CrossRef]
- Lamprecht, B.; Soriano, J.B.; Studnicka, M.; Kaiser, B.; Vanfleteren, L.E.; Gnatiuc, L.; Burney, P.; Miravitlles, M.; García-Rio, F.; Akbari, K.; et al. Determinants of Underdiagnosis of COPD in National and International surveys. Chest 2015, 148, 971–985. Available online: http://journal.publications.chestnet.org/ (accessed on 12 December 2023). [CrossRef]
- Aaron, S.D.; Boulet, L.P.; Reddel, H.K.; Gershon, A.S. Underdiagnosis and overdiagnosis of asthma. Am. J. Respir. Crit. Care Med. 2018, 198, 1012–1020. [Google Scholar] [CrossRef]
- van Schayck, O.C. Global strategies for reducing the burden from asthma: A report of a lecture given at the university of Edinburgh, Edinburgh, UK, october 1st 2012. Prim. Care Respir. J. 2013, 22, 239–243. [Google Scholar] [CrossRef]
- Thomas, M. Why aren’t we doing better in asthma: Time for personalised medicine? NPJ Prim. Care Respir. Med. 2015, 25, 15004. [Google Scholar] [CrossRef]
- Vestbo, J.; Hurd, S.S.; Agustí, A.G.; Jones, P.W.; Vogelmeier, C.; Anzueto, A.; Barnes, P.J.; Fabbri, L.M.; Martinez, F.J.; Nishimura, M.; et al. Global strategy for the diagnosis, management, and prevention of chronic obstructive pulmonary disease GOLD executive summary. Am. J. Respir. Crit. Care Med. 2013, 187, 347–365. [Google Scholar] [CrossRef]
- Noah, B.; Keller, M.S.; Mosadeghi, S.; Stein, L.; Johl, S.; Delshad, S.; Tashjian, V.C.; Lew, D.; Kwan, J.T.; Jusufagic, A.; et al. Impact of remote patient monitoring on clinical outcomes: An updated meta-analysis of randomized controlled trials. NPJ Digit. Med. 2018, 1, 20172. [Google Scholar] [CrossRef] [PubMed]
- Chau, J.P.-C.; Lee, D.T.F.; Yu, D.S.-F.; Chow, A.Y.-M.; Yu, W.-C.; Chair, S.Y.; Lai, A.S.F.; Chick, Y.-L. A feasibility study to investigate the acceptability and potential effectiveness of a telecare service for older people with chronic obstructive pulmonary disease. Int. J. Med. Inform. 2012, 81, 674–682. [Google Scholar] [CrossRef] [PubMed]
- Dieffenderfer, J.; Goodell, H.; Mills, S.; McKnight, M.; Yao, S.; Lin, F.; Beppler, E.; Bent, B.; Lee, B.; Misra, V.; et al. Low-Power Wearable Systems for Continuous Monitoring of Environment and Health for Chronic Respiratory Disease. IEEE J. Biomed. Health Inform. 2016, 20, 1251–1264. [Google Scholar] [CrossRef]
- Lai, Q.; Zhao, X.; Sun, Q.; Tang, Z.; Tang, X.; Roy, V.A.L. Emerging MXene-Based Flexible Tactile Sensors for Health Monitoring and Haptic Perception. Small 2023, 19, e2300283. [Google Scholar] [CrossRef] [PubMed]
- Lai, Q.-T.; Liang, H.-Q.; Tang, X.-G.; Zhang, D.; Roy, V.A.; Sun, Q.-J. Printing paper-derived ultralight and highly sensitive E-skin for health monitoring and information encryption. J. Alloy. Compd. 2024, 976, 173411. [Google Scholar] [CrossRef]
- Whitehead, D.; Conley, J. The Next Frontier of Remote Patient Monitoring: Hospital at Home. J. Med. Internet Res. 2023, 25, e42335. [Google Scholar] [CrossRef] [PubMed]
- Bohadana, A.; Izbicki, G.; Kraman, S.S. Fundamentals of Lung Auscultation. N. Engl. J. Med. 2014, 370, 744–751. [Google Scholar] [CrossRef]
- Sarkar, M.; Madabhavi, I.; Niranjan, N.; Dogra, M. Auscultation of the respiratory system. Ann. Thorac. Med. 2015, 10, 158–168. [Google Scholar] [CrossRef]
- Gavriely, N.; Shee, T.R.; Cugell, D.W.; Grotberg, J.B. Flutter in flow-limited collapsible tubes: A mechanism for generation of wheezes. J. Appl. Physiol. 1989, 66, 2251–2261. [Google Scholar] [CrossRef]
- Cruz, J.D.L.T.; Quesada, F.J.C.; Reyes, N.R.; Galán, S.G.; Orti, J.J.C.; Chica, G.P. Monophonic and polyphonic wheezing classification based on constrained low-rank non-negative matrix factorization. Sensors 2021, 21, 1661. [Google Scholar] [CrossRef]
- Meslier, N.; Charbonneau, G.; Racineux, J. Wheezes. Eur. Respir. J. 1995, 8, 1942–1948. [Google Scholar] [CrossRef]
- Pasterkamp, H.; Kraman, S.S.; Wodicka, G.R. State of the Art Respiratory Sounds Advances Beyond the Stethoscope. Am. J. Respir. Crit. Care Med. 1997, 156, 974–987. [Google Scholar]
- Shim, C.S.; Williams, M.H. Relationship of Wheezing to the Severity of Obstruction in Asthma. Arch. Intern. Med. 1983, 143, 890–892. [Google Scholar] [CrossRef]
- Nabi, F.G.; Sundaraj, K.; Lam, C.K. Identification of asthma severity levels through wheeze sound characterization and classification using integrated power features. Biomed. Signal Process. Control 2019, 52, 302–311. [Google Scholar] [CrossRef]
- Weaver, J. The sound of medicine. BMJ 2020, 371, m4682. [Google Scholar] [CrossRef]
- Gupta, P.; Moghimi, M.J.; Jeong, Y.; Gupta, D.; Inan, O.T.; Ayazi, F. Precision wearable accelerometer contact microphones for longitudinal monitoring of mechano-acoustic cardiopulmonary signals. NPJ Digit. Med. 2020, 3, 19. [Google Scholar] [CrossRef]
- Gupta, P.; Wen, H.; Di Francesco, L.; Ayazi, F. Detection of pathological mechano-acoustic signatures using precision accelerometer contact microphones in patients with pulmonary disorders. Sci. Rep. 2021, 11, 13427. [Google Scholar] [CrossRef]
- Grant, D.; McLane, I.; Rennoll, V.; West, J. Considerations and Challenges for Real-World Deployment of an Acoustic-Based COVID-19 Screening System. Sensors 2022, 22, 9530. [Google Scholar] [CrossRef]
- Habukawa, C.; Ohgami, N.; Matsumoto, N.; Hashino, K.; Asai, K.; Sato, T.; Murakami, K. A wheeze recognition algorithm for practical implementation in children. PLoS ONE 2020, 15, e0240048. [Google Scholar] [CrossRef]
- Dellinger, R.P.; Jean, S.; Cinel, I.; Tay, C.; Rajanala, S.; A Glickman, Y.; E Parrillo, J. Regional distribution of acoustic-based lung vibration as a function of mechanical ventilation mode. Crit. Care 2007, 11, R26. [Google Scholar] [CrossRef]
- Gupta, P.; Wen, H.; Daruwalla, A.; Moghimi, M.J.; Ayazi, F. Hermetically-Encapsulated Unidirectional Accelerometer Contact Microphone for Wearable Applications. In Proceedings of the 2019 IEEE Sensors, Montreal, QC, Canada, 27–30 October 2019; pp. 1–4. [Google Scholar]
- Sang, B.; Wen, H.; Gupta, P.; Shokouhmand, A.; Khan, S.; Puma, J.A.; Patel, A.; Green, P.; Tavassolian, N.; Ayazi, F. Detection of Normal and Paradoxical Splitting in Second Heart Sound (S2) using a Wearable Accelerometer Contact Microphone. In Proceedings of the 2022 IEEE Sensors, Dallas, TX, USA, 30 October–2 November 2022; pp. 1–4. [Google Scholar]
- Sang, B.; Shokouhmand, A.; Wen, H.; Khan, S.; Puma, J.A.; Patel, A.; Green, P.; Ebadi, N.; Ayazi, F. Identification of S2 Paradoxical Splitting in Aortic Stenosis Subjects via Seismocardiogram Signals from a Wearable Accelerometer Contact Microphone. IEEE Sens. J. 2023, 23, 15424–15434. [Google Scholar] [CrossRef]
- Sang, B.; Wen, H.; Junek, G.; Di Francesco, L.; Ayazi, F. Detection of Respiratory Crackles and Respiration Phase Using a Wearable MEMS Contact Microphone. In Proceedings of the 2023 IEEE 19th International Conference on Body Sensor Networks (BSN), Boston, MA, USA, 9–11 October 2023; pp. 1–4. [Google Scholar] [CrossRef]
- Gupta, P.; Jeong, Y.; Choi, J.; Faingold, M.; Ayazi, F. Precision high-bandwidth out-of-plane accelerometer as contact microphone for body-worn auscultation devices. In Proceedings of the 2018 Solid-State Sensors, Actuators and Microsystems Workshop, Hilton Head 2018, Hilton Head Island, SC, USA, 3–7 June 2018; pp. 30–33. [Google Scholar] [CrossRef]
- Kim, B.J.; Kim, B.S.; Mun, J.H.; Lim, C.; Kim, K.H. An accurate deep learning model for wheezing in children using real world data. Sci. Rep. 2022, 12, 22465. [Google Scholar] [CrossRef]
- Kim, Y.; Hyon, Y.; Jung, S.S.; Lee, S.; Yoo, G.; Chung, C.; Ha, T. Respiratory sound classification for crackles, wheezes, and rhonchi in the clinical field using deep learning. Sci. Rep. 2021, 11, 17186. [Google Scholar] [CrossRef]
- Homs-Corbera, A.; Fiz, J.; Morera, J.; Jane, R. Time-Frequency Detection and Analysis of Wheezes during Forced Exhalation. IEEE Trans. Biomed. Eng. 2004, 51, 182–186. [Google Scholar] [CrossRef]
- Taplidou, S.A.; Hadjileontiadis, L.J. Wheeze detection based on time-frequency analysis of breath sounds. Comput. Biol. Med. 2007, 37, 1073–1083. [Google Scholar] [CrossRef]
- Eko Health Inc. Eko Health. Available online: ekohealth.com (accessed on 3 October 2023).
- Leng, S.; Tan, R.S.; Chai, K.T.C.; Wang, C.; Ghista, D.; Zhong, L. The electronic stethoscope. Biomed. Eng. Online 2015, 14, 66. [Google Scholar] [CrossRef]
- Hashemi, A.; Agin, K.; Arabalibiek, H. Classification of Wheeze Sounds Using Wavelets and Neural Networks A decision support system for boosting warfarin maintenance dose using fuzzy logic View project Classification of Wheeze Sounds Using Wavelets and Neural Networks. In Proceedings of the International Conference on Biomedical Engineering and Technology, Kuala Lumpur, Malaysia, 4–5 June 2011; Available online: https://www.researchgate.net/publication/266569975 (accessed on 10 November 2023).
- Zhao, J.; Mao, X.; Chen, L. Speech emotion recognition using deep 1D & 2D CNN LSTM networks. Biomed. Signal Process. Control 2018, 47, 312–323. [Google Scholar] [CrossRef]
- Gurung, A.; Scrafford, C.G.; Tielsch, J.M.; Levine, O.S.; Checkley, W. Computerized lung sound analysis as diagnostic aid for the detection of abnormal lung sounds: A systematic review and meta-analysis. Respir. Med. 2011, 105, 1396–1403. [Google Scholar] [CrossRef]
- Park, S.; Kwak, N. Analysis on the Dropout Effect in Convolutional Neural Networks. In Computer Vision—ACCV 2016; Lai, S.-H., Lepetit, V., Nishino, K., Sato, Y., Eds.; Lecture Notes in Computer Science; Springer International Publishing: Cham, Switzerland, 2017; Volume 10112, pp. 189–204. [Google Scholar] [CrossRef]
- Lee, S.H.; Kim, Y.-S.; Yeo, M.-K.; Mahmood, M.; Zavanelli, N.; Chung, C.; Heo, J.Y.; Kim, Y.; Jung, S.-S.; Yeo, W.-H. Fully portable continuous real-time auscultation with a soft wearable stethoscope designed for automated disease diagnosis. Sci. Adv. 2022, 8, eabo5867. Available online: https://www.science.org (accessed on 12 December 2023). [CrossRef]
- Oletic, D.; Bilas, V. Asthmatic Wheeze Detection From Compressively Sensed Respiratory Sound Spectra. IEEE J. Biomed. Health Inform. 2017, 22, 1406–1414. [Google Scholar] [CrossRef]
- Rocha, B.M.; Pessoa, D.; Marques, A.; de Carvalho, P.; Paiva, R.P. Automatic wheeze segmentation using harmonic-percussive source separation and empirical mode decomposition. IEEE J. Biomed. Health Inform. 2023, 27, 1926–1934. [Google Scholar] [CrossRef]
- Melbye, H.; Solis, J.C.A.; Jácome, C.; Pasterkamp, H. Inspiratory crackles—Early and late—Revisited: Identifying COPD by crackle characteristics. BMJ Open Respir. Res. 2021, 8, e000852. [Google Scholar] [CrossRef]
- Poulain, M.; Doucet, M.; Major, G.C.; Drapeau, V.; Sériès, F.; Boulet, L.-P.; Tremblay, A.; Maltais, F. The effect of obesity on chronic respiratory diseases: Pathophysiology and therapeutic strategies. Can. Med. Assoc. J. 2006, 174, 1293–1299. [Google Scholar] [CrossRef]
- Emmanouilidou, D.; Elhilal, M. Characterization of noise contaminations in lung sound recordings. In Proceedings of the Annual International Conference of the IEEE Engineering in Medicine and Biology Society, EMBS 2013, Osaka, Japan, 3–7 July 2013; pp. 2551–2554. [Google Scholar] [CrossRef]
- Khademi, G.; Roudi, M.; Farhat, A.S.; Shahabian, M. Noise Pollution in Intensive Care Units and Emergency Wards. Iran. J. Otorhinolaryngol. 2011, 23, 141–148. [Google Scholar]
- Gibson, P.G.; Simpson, J.L. The overlap syndrome of asthma and COPD: What are its features and how important is it? Thorax 2009, 64, 728–735. [Google Scholar] [CrossRef]
- Korpáš, J.; Sadloň Ová, J.; Vrabec, M. Methods of Assessing Cough and Antitussives in Man Analysis of the Cough Sound: An Overview. Pulm. Pharmacol. 1996, 9, 261–268. [Google Scholar] [CrossRef]
- Morice, A.H. Recommendations for the management of cough in adults. Thorax 2006, 61, i1–i24. [Google Scholar] [CrossRef] [PubMed]
- Irwin, R.S.; Boulet, L.P.; Cloutier, M.M.; Fuller, R.; Gold, P.M.; Hoffstein, V.; Ing, A.J.; McCool, F.D.; O’Byrne, P.; Poe, R.H.; et al. Managing Cough as a Defense Mechanism and as a Symptom: A Consensus Panel Report of the American College of Chest Physicians Summary and Recommendations. Chest 1998, 114, 113S–181S. Available online: www.chestjournal.org (accessed on 26 January 2024). [CrossRef] [PubMed]
- Chang, A.B. The physiology of cough. Paediatr. Respir. Rev. 2006, 7, 2–8. [Google Scholar] [CrossRef] [PubMed]
- Infante, C.; Chamberlain, D.; Fletcher, R.; Thorat, Y.; Kodgule, R. Use of cough sounds for diagnosis and screening of pulmonary disease. In Proceedings of the 2017 IEEE Global Humanitarian Technology Conference (GHTC), San Jose, CA, USA, 19–22 October 2017. [Google Scholar]
- Piirila, P.; Sovijarvi, A. Objective assessment of cough. Eur. Respir. J. 1995, 8, 1949–1956. [Google Scholar] [CrossRef]
- Mohammadi, H.; Samadani, A.-A.; Steele, C.; Chau, T. Automatic discrimination between cough and non-cough accelerometry signal artefacts. Biomed. Signal Process. Control 2018, 52, 394–402. [Google Scholar] [CrossRef]


| Patient Characteristics | Values |
|---|---|
| Gender (Male/Female) | 23/29 |
| Emergency Room/In Clinic | 34/18 |
| Age: mean (standard deviation: SD), range | 56.74 (13.63), 33–87 |
| Height (m): mean (SD), range | 1.71 (0.11), 1.47–1.96 |
| Weight (kg): mean (SD), range | 96.32 (35.41), 55.3–215 |
| BMI: mean (SD), range | 31.76 (9.14), 18.55–62.9 |
| Patient # | Age (Years Old) | Sex | Height (m) | Weight (kg) | BMI | Lung Auscultation Notes | Diagnosis | Testing Location |
|---|---|---|---|---|---|---|---|---|
| 1 | 53 | M | 182.9 | 83 | 24.8 | Polyphonic Wheezing | Severe Asthma | Clinic |
| 2 | 50 | M | 195.6 | 112.9 | 29.5 | No Wheezing | Mild Asthma | Clinic |
| 3 | 61 | F | 152.3 | 77.6 | 33.4 | No Wheezing | ACOS | Clinic |
| 4 | 60 | M | 182.2 | 85.3 | 25.5 | No Wheezing | Mild Asthma | Clinic |
| 5 | 67 | M | 185.4 | 108 | 31.4 | No Wheezing | Severe Asthma | Clinic |
| 6 | 52 | F | 157.5 | 55.8 | 22.5 | Wheezing | Severe Asthma | Clinic |
| 7 | 45 | F | 172.7 | 97.5 | 32.7 | No Wheezing | Mild Asthma | Clinic |
| 8 | 63 | F | 167.6 | 102.1 | 36.3 | No Wheezing | Mild Asthma | Clinic |
| 9 | 53 | F | 170.2 | 126.1 | 43.5 | Wheezing | Severe Asthma | Clinic |
| 10 | 36 | F | 157.5 | 109.3 | 44.1 | No Wheezing | Moderate Asthma | Clinic |
| 11 | 58 | F | 147.3 | 83.9 | 38.7 | Wheezing | Severe Asthma | Clinic |
| 12 | 50 | F | 167.6 | 106.6 | 37.9 | No Wheezing | Chronic Hives | Clinic |
| 13 | 70 | M | 185.4 | 66.2 | 19.3 | Wheezing | Severe ACOS | Clinic |
| 14 | 39 | F | 172.7 | 65.8 | 22 | Wheezing | Severe Asthma | Clinic |
| 15 | 57 | F | 165.1 | 78.5 | 28.8 | Wheezing | Severe Asthma | Clinic |
| 16 | 75 | F | 178 | 87.3 | 27.62 | No Wheezing | Acute Respiratory Failure | Emergency Room |
| 17 | 50 | F | 165 | 124.7 | 46.1 | No Wheezing | Acute Respiratory Failure | Emergency Room |
| 18 | 75 | F | 155 | 71.2 | 29.6 | No Wheezing | COPD Exacerbation | Emergency Room |
| 19 | 56 | M | 185 | 98.4 | 28.8 | No Wheezing | ADHF | Emergency Room |
| 20 | 58 | M | 172 | 55.3 | 18.55 | No Wheezing | COPD Exacerbation | Emergency Room |
| 21 | 79 | F | 168 | 90 | 32.12 | No Wheezing | ESRD | Emergency Room |
| 22 | 38 | F | 170 | 210 | 32.89 | No Wheezing | ADHF | Emergency Room |
| 23 | 67 | F | 165 | 215 | 35.84 | No Wheezing | COPD Exacerbation | Emergency Room |
| 24 | 55 | F | 157.5 | 79.4 | 31.2 | Wheezing | Severe Asthma | Clinic |
| 25 | 63 | M | 170.2 | 62.6 | 21.6 | No Wheezing | Bilateral Pleural Effusion | Emergency Room |
| 26 | 33 | M | 167.6 | 93 | 33.1 | No Wheezing | CAP | Emergency Room |
| 27 | 62 | F | 170.8 | 106.1 | 36.6 | Wheezing | Moderate Asthma | Clinic |
| 28 | 57 | F | 165.1 | 80.3 | 29.5 | Wheezing | Severe Asthma | Clinic |
| 29 | 36 | M | 188 | 98.4 | 27.9 | Polyphonic Wheezing | Severe Asthma | Emergency Room |
| 30 | 60 | M | 175.3 | 100.7 | 32.8 | No Wheezing | COPD Exacerbation | Emergency Room |
| 31 | 43 | F | 167.5 | 150.6 | 53.6 | No Wheezing | Sarcoid | Emergency Room |
| 32 | 87 | F | 152.7 | 91.2 | 39.26 | Wheezing and Crackle | Reactive Airway Disease | Emergency Room |
| 33 | 35 | F | 160 | 161 | 62.9 | Wheezing | Severe Asthma | Emergency Room |
| 34 | 63 | M | 175.2 | 90.7 | 29.53 | Wheezing and Crackle | Reactive Airway Disease | Emergency Room |
| 35 | 43 | F | 175.6 | 63.5 | 20.7 | Wheezing | Asthma Exacerbation | Emergency Room |
| 36 | 35 | M | 165.1 | 72.6 | 26.63 | No Wheezing | Pneumonia | Emergency Room |
| 37 | 64 | M | 180.3 | 92.5 | 28.06 | Wheezing | Acute Respiratory Failure | Emergency Room |
| 38 | 77 | M | 177.8 | 76.7 | 24.36 | Wheezing | COPD Exacerbation | Emergency Room |
| 39 | 59 | F | 162.2 | 99.3 | 37.6 | Wheezing | COPD Exacerbation | Emergency Room |
| 40 | 72 | M | 162 | 59 | 22.5 | Wheezing | COPD Exacerbation | Emergency Room |
| 41 | missing | F | 167.7 | 63 | 22.4 | Wheezing | Severe Asthma | Emergency Room |
| 42 | 40 | F | 165.8 | 81.6 | 29.7 | Wheezing | Acute Respiratory Failure | Emergency Room |
| 43 | 56 | M | 180.3 | 120.2 | 37 | Wheezing and Crackle | ADHF | Emergency Room |
| 44 | 84 | M | 188 | 147.4 | 41.7 | Wheezing | ADHF + CAP | Emergency Room |
| 45 | 67 | F | 170 | 89.4 | 37.2 | Wheezing and Crackle | COPD Exacerbation | Emergency Room |
| 46 | 65 | F | 167.6 | 44.9 | 16 | Wheezing and Crackle | COPD Exacerbation | Emergency Room |
| 47 | 72 | M | 178 | 100.2 | 31.7 | Wheezing and Crackle | COPD Exacerbation | Emergency Room |
| 48 | 80 | M | 180 | 83 | 25.5 | Wheezing | Right Upper Lobe Mass | Emergency Room |
| 49 | 49 | M | 185.4 | 91.2 | 26.5 | Wheezing and Crackle | Acute Respiratory Failure | Emergency Room |
| 50 | 43 | M | 190.5 | 68 | 18.7 | Wheezing | Severe Asthma | Emergency Room |
| 51 | 27 | M | 175.3 | 74.8 | 24.3 | Wheezing | Severe Asthma | Emergency Room |
| 52 | 55 | F | 154.9 | 123.9 | 51.6 | Wheezing | Severe Asthma | Emergency Room |
| Detection Method | Accuracy (%) | Sensitivity (%) | Specificity (%) |
|---|---|---|---|
| Accelerometer Patch Time–Frequency Analysis | 87.45 | 81.39 | 92.53 |
| Accelerometer Patch 2D CNN on Test Set | 94.52 | 93.45 | 95.72 |
| Digital Stethoscope Time–Frequency Analysis | 86.83 | 82.98 | 87.52 |
| Digital Stethoscope 2D CNN on Test Set | 88.95 | 91.36 | 86.65 |
Disclaimer/Publisher’s Note: The statements, opinions and data contained in all publications are solely those of the individual author(s) and contributor(s) and not of MDPI and/or the editor(s). MDPI and/or the editor(s) disclaim responsibility for any injury to people or property resulting from any ideas, methods, instructions or products referred to in the content. |
© 2024 by the authors. Licensee MDPI, Basel, Switzerland. This article is an open access article distributed under the terms and conditions of the Creative Commons Attribution (CC BY) license (https://creativecommons.org/licenses/by/4.0/).
Share and Cite
Sang, B.; Wen, H.; Junek, G.; Neveu, W.; Di Francesco, L.; Ayazi, F. An Accelerometer-Based Wearable Patch for Robust Respiratory Rate and Wheeze Detection Using Deep Learning. Biosensors 2024, 14, 118. https://doi.org/10.3390/bios14030118
Sang B, Wen H, Junek G, Neveu W, Di Francesco L, Ayazi F. An Accelerometer-Based Wearable Patch for Robust Respiratory Rate and Wheeze Detection Using Deep Learning. Biosensors. 2024; 14(3):118. https://doi.org/10.3390/bios14030118
Chicago/Turabian StyleSang, Brian, Haoran Wen, Gregory Junek, Wendy Neveu, Lorenzo Di Francesco, and Farrokh Ayazi. 2024. "An Accelerometer-Based Wearable Patch for Robust Respiratory Rate and Wheeze Detection Using Deep Learning" Biosensors 14, no. 3: 118. https://doi.org/10.3390/bios14030118
APA StyleSang, B., Wen, H., Junek, G., Neveu, W., Di Francesco, L., & Ayazi, F. (2024). An Accelerometer-Based Wearable Patch for Robust Respiratory Rate and Wheeze Detection Using Deep Learning. Biosensors, 14(3), 118. https://doi.org/10.3390/bios14030118