Photoacoustic Chemical Imaging Sodium Nano-Sensor Utilizing a Solvatochromic Dye Transducer for In Vivo Application


Abstract
:1. Introduction
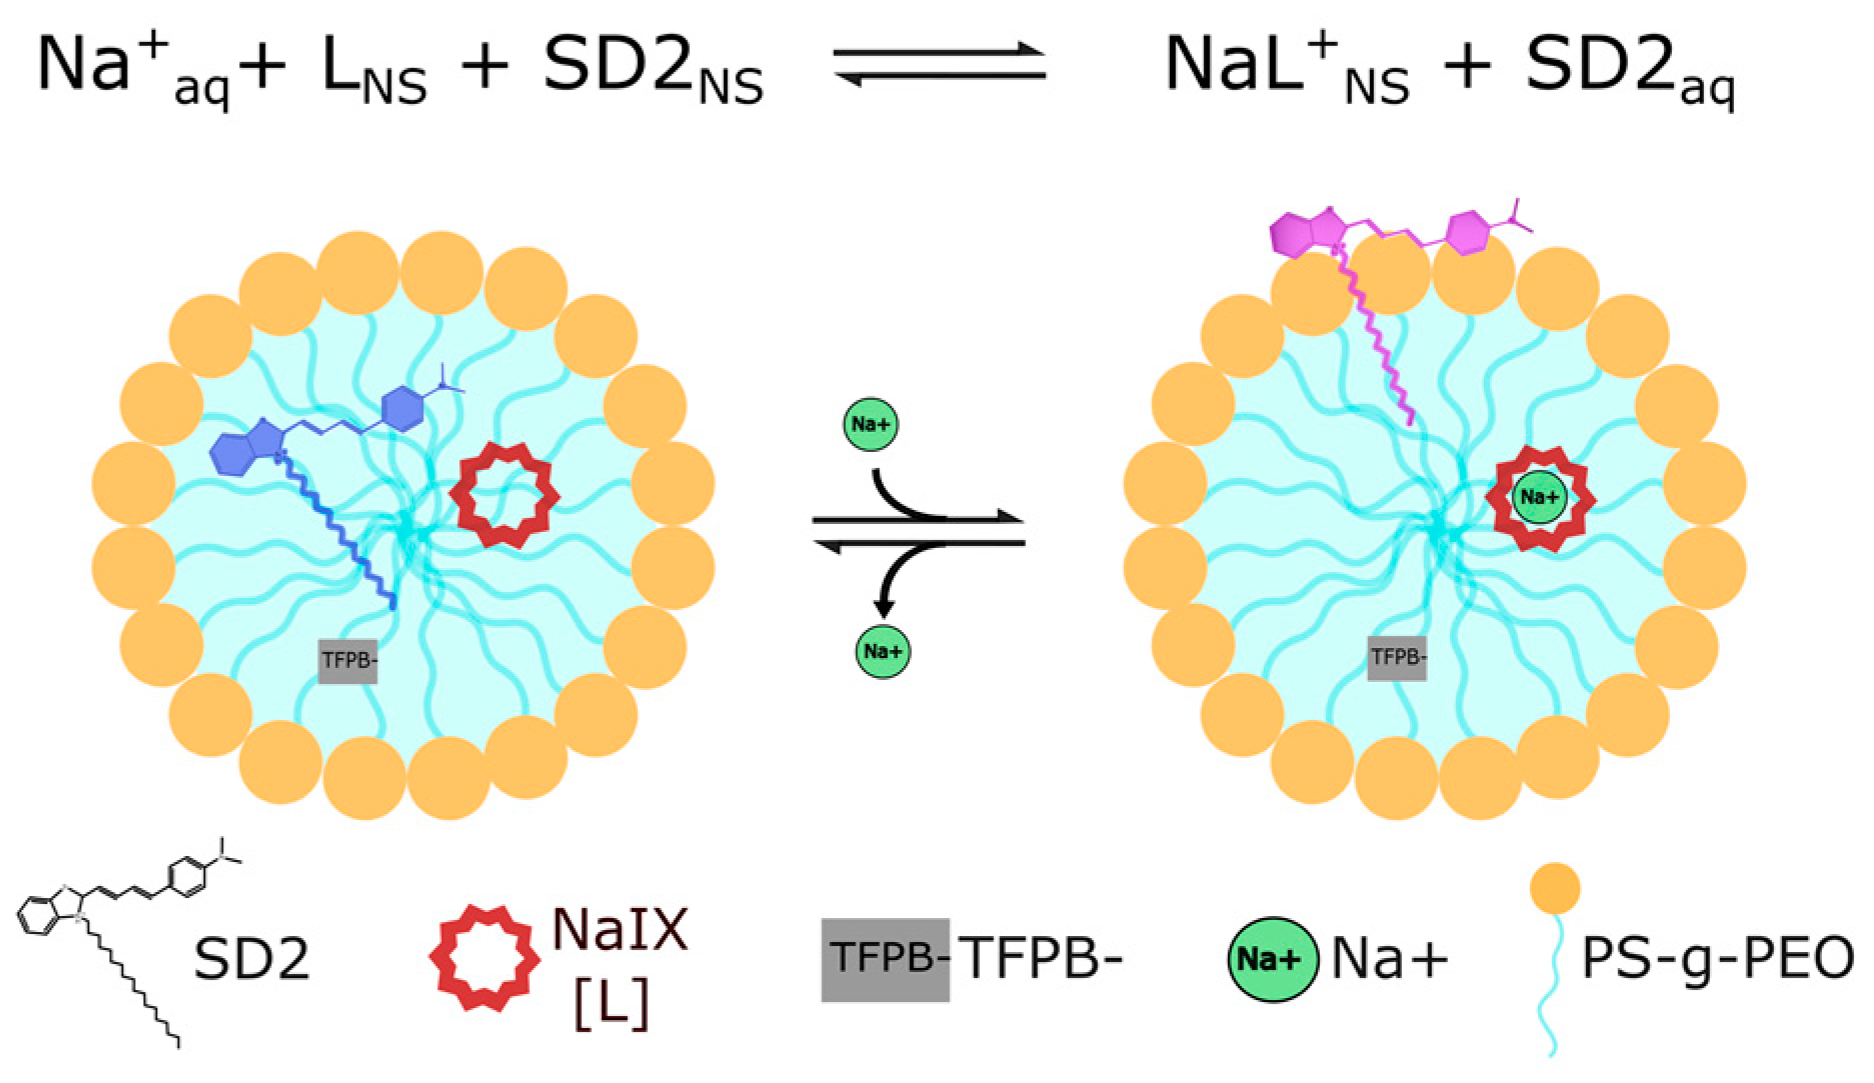
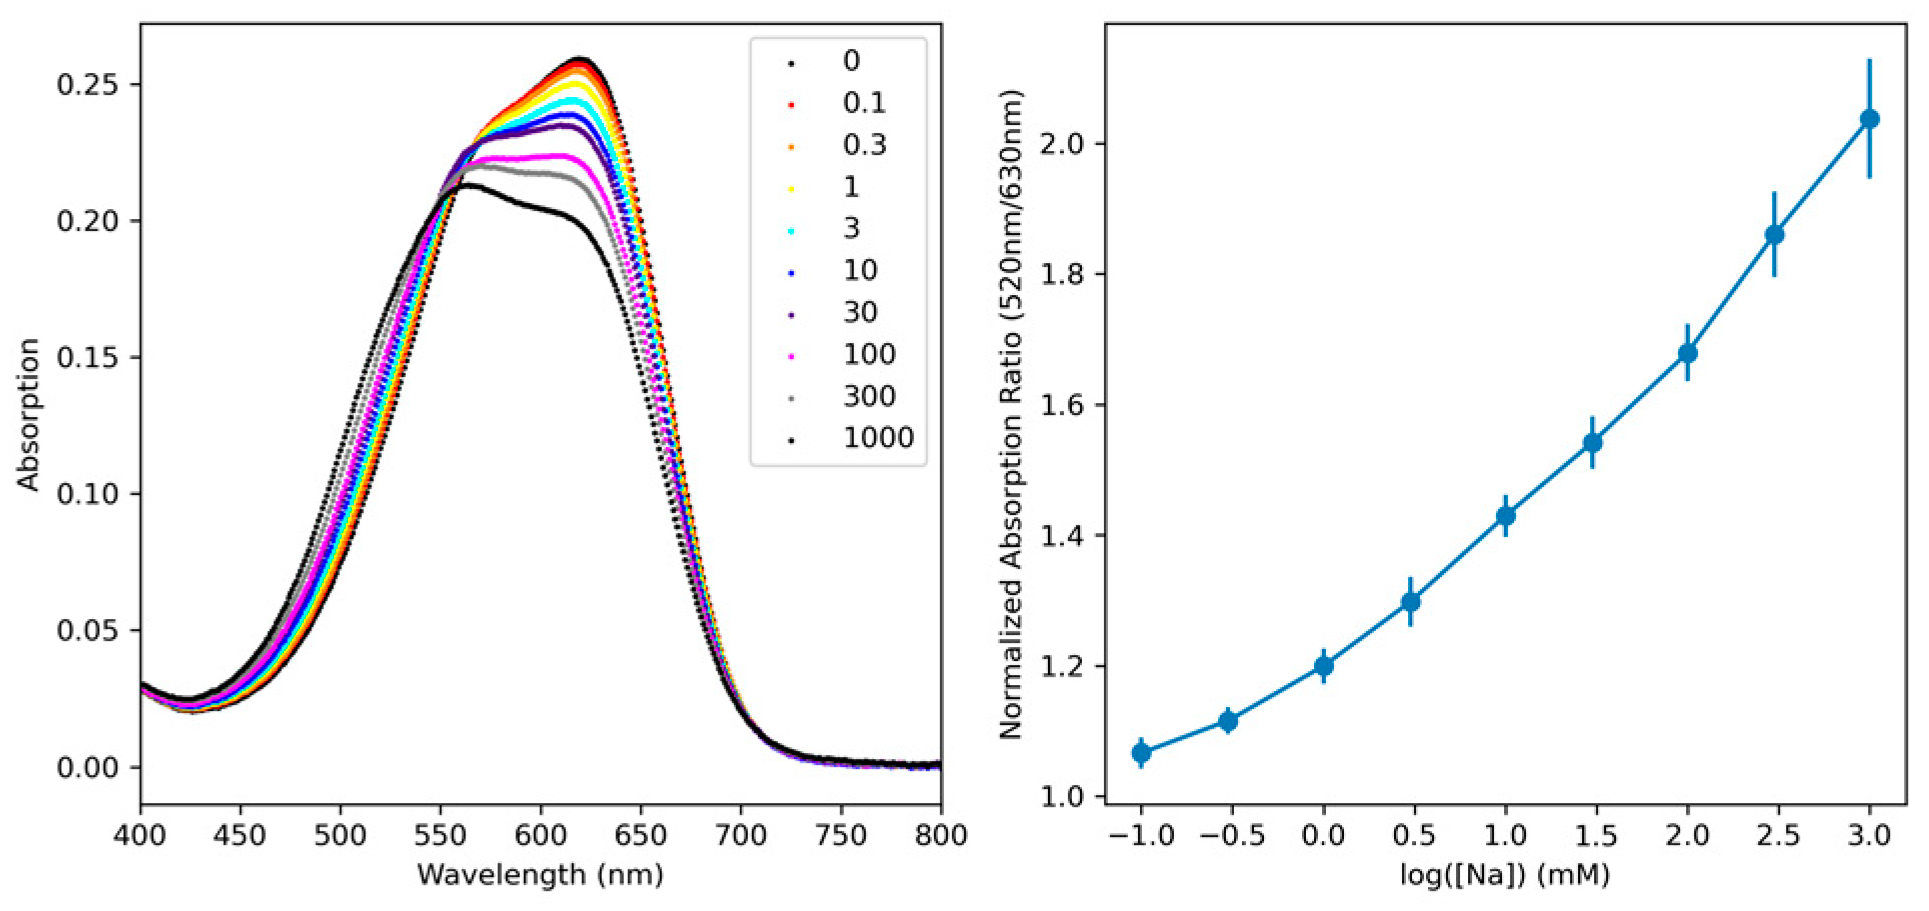
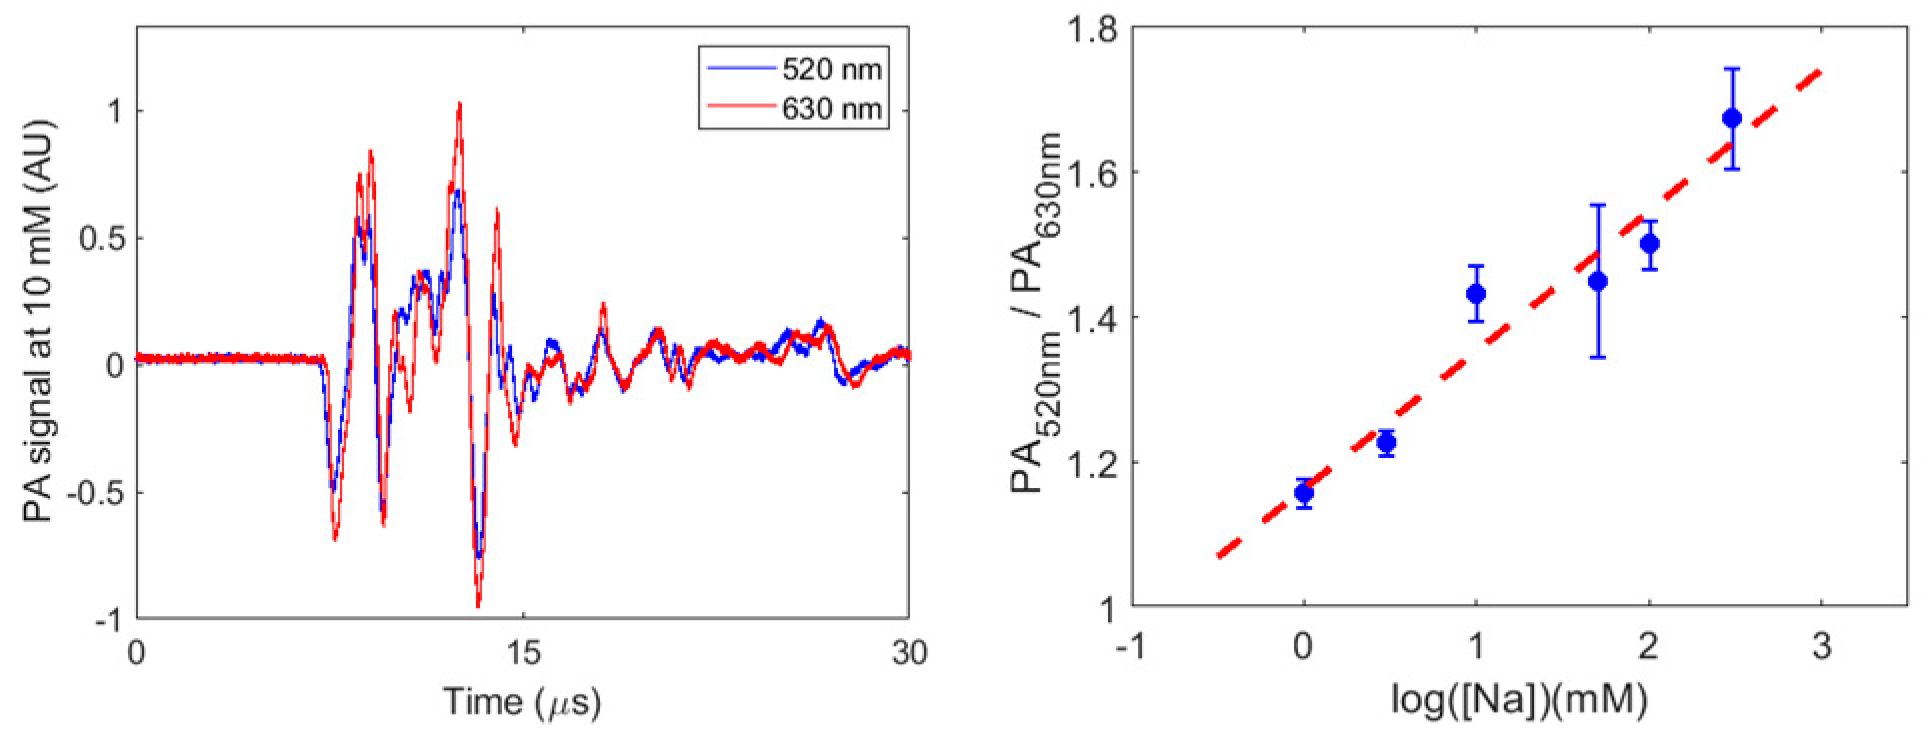
2. Results
3. Discussion
4. Methods
5. Associated Content
Supplementary Materials
Author Contributions
Funding
Institutional Review Board Statement
Informed Consent Statement
Data Availability Statement
Acknowledgments
Conflicts of Interest
References
- Sigel, A.; Sigel, H.; Sigel, R.K.O. Interrelations between Essential Metal Ions and Human Disease; Springer Science: Berlin/Heidelberg, Germany, 2013. [Google Scholar]
- Barrett, K.E.; Barman, S.M.; Brooks, H.L.; Yuan, J.X.-J. Gangong’s Review of Medical Physiology, 26e; McGraw Hill: New York, NY, USA, 2019. [Google Scholar]
- Leslie, T.K.; James, A.D.; Zaccagna, F.; Grist, J.T.; Deen, S.; Kennerley, A.; Riemer, F.; Kaggie, J.D.; Gallagher, F.A.; Gilbert, F.J.; et al. Sodium homeostasis in the tumour microenvironment. Biochim. Biophys. Acta Rev. Cancer 2019, 1872, 188304. [Google Scholar] [CrossRef] [PubMed]
- Amara, S.; Tiriveedhi, V. Inflammatory role of high salt level in tumor microenvironment. Int. J. Oncol. 2017, 50, 1477–1481. [Google Scholar] [CrossRef]
- Sparks, R.L.; Pool, T.B.; Smith, N.K.; Cameron, I.L. Effects of amiloride on tumor growth and intracellular element content of tumor cells in vivo. Cancer Res. 1983, 43, 73–77. [Google Scholar] [PubMed]
- O’Donnell, M.E.; Villereal, M.L. Membrane potential and sodium flux in neuroblastoma X glioma hybrid cells: Effects of amiloride and serum. J. Cell. Physiol. 1982, 113, 405–412. [Google Scholar] [CrossRef]
- O’Donnell, M.E.; Cragoe, E., Jr.; Villereal, M.L. Inhibition of Na+ influx and DNA synthesis in human fibroblasts and neuroblastoma-glioma hybrid cells by amiloride analogs. J. Pharmacol. Exp. Ther. 1983, 226, 368–372. [Google Scholar] [PubMed]
- Amara, S.; Zheng, M.; Tiriveedhi, V. Oleanolic acid inhibits high salt-induced exaggeration of Warburg-like metabolism in breast cancer cells. Cell Biochem. Biophys. 2016, 74, 427–434. [Google Scholar] [CrossRef]
- Amara, S.; Alotaibi, D.; Tiriveedhi, V. NFAT5/STAT3 interaction mediates synergism of high salt with IL-17 towards induction of VEGF-A expression in breast cancer cells. Oncol. Lett. 2016, 12, 933–943. [Google Scholar] [CrossRef]
- Hanahan, D.; Weinberg, R.A. The hallmarks of cancer. Cell 2000, 100, 57–70. [Google Scholar] [CrossRef]
- Biller, A.; Badde, S.; Nagel, A.; Neumann, J.-O.; Wick, W.; Hertenstein, A.; Bendszus, M.; Sahm, F.; Benkhedah, N.; Kleesiek, J. Improved brain tumor classification by Sodium Mr Imaging: Prediction of IDH mutation status and tumor progression. Am. J. Neuroradiol. 2015, 37, 66–73. [Google Scholar] [CrossRef]
- Hartmann, C.; Hentschel, B.; Wick, W.; Capper, D.; Felsberg, J.; Simon, M.; Westphal, M.; Schackert, G.; Meyermann, R.; Pietsch, T.; et al. Patients with IDH1 wild type anaplastic astrocytomas exhibit worse prognosis than IDH1-mutated glioblastomas, and IDH1 mutation status accounts for the unfavorable prognostic effect of higher age: Implications for classification of gliomas. Acta Neuropathol. 2010, 120, 707–718. [Google Scholar] [CrossRef]
- Olar, A.; Wani, K.M.; Alfaro-Munoz, K.D.; Heathcock, L.E.; van Thuijl, H.F.; Gilbert, M.R.; Armstrong, T.S.; Sulman, E.P.; Cahill, D.P.; Vera-Bolanos, E.; et al. IDH mutation status and role of WHO grade and mitotic index in overall survival in grade II-III diffuse gliomas. Acta Neuropathol. 2015, 129, 585–596. [Google Scholar] [CrossRef]
- Boutilier, A.J.; Elsawa, S.F. Macrophage polarization states in the tumor microenvironment. Int. J. Mol. Sci. 2021, 22, 6995. [Google Scholar] [CrossRef] [PubMed]
- Nagel, A.M.; Bock, M.; Hartmann, C.; Gerigk, L.; Neumann, J.-O.; Weber, M.-A.; Bendszus, M.; Radbruch, A.; Wick, W.; Schlemmer, H.-P.; et al. The potential of relaxation-weighted sodium magnetic resonance imaging as demonstrated on brain tumors. Investig. Radiol. 2011, 46, 539–547. [Google Scholar] [CrossRef]
- Thulborn, K.R.; Lu, A.; Atkinson, I.C.; Pauliah, M.; Beal, K.; Chan, T.A.; Omuro, A.; Yamada, J.; Bradbury, M.S. Residual tumor volume, cell volume fraction, and tumor cell kill during fractionated chemoradiation therapy of human glioblastoma using quantitative sodium Mr Imaging. Clin. Cancer Res. 2018, 25, 1226–1232. [Google Scholar] [CrossRef] [PubMed]
- James, A.D.; Leslie, T.K.; Kaggie, J.D.; Wiggins, L.; Patten, L.; O’Duinn, J.M.; Langer, S.; Labarthe, M.-C.; Reimer, F.; Baxter, G.; et al. Sodium accumulation in breast cancer predicts malignancy and treatment response. Br. J. Cancer 2022, 127, 337–349. [Google Scholar] [CrossRef]
- Hashimoto, T.; Ikehira, H.; Fukuda, H.; Yamaura, A.; Watanabe, O.; Tateno, Y.; Tanaka, R.; Simon, H.E. In vivo sodium-23 MRI in brain tumors: Evaluation of preliminary clinical experience. Am. J. Physiol. Imaging 1991, 6, 74–80. [Google Scholar]
- Ouwerkerk, R.; Jacobs, M.A.; Macura, K.J.; Wolff, A.C.; Stearns, V.; Mezban, S.D.; Khouri, N.F.; Bluemke, D.A.; Bottomley, P.A. Elevated tissue sodium concentration in malignan4t breast lesions detected with non-invasive 23NA MRI. Breast Cancer Res. Treat. 2017, 106, 151–160. [Google Scholar] [CrossRef] [PubMed]
- Boada, F.E.; Gillen, J.S.; Shen, G.X.; Chang, S.Y.; Thulborn, K.R. Fast three dimensional sodium imaging. Magn. Reason. Med. 1997, 37, 706–715. [Google Scholar] [CrossRef]
- Feinberg, D.A.; Crooks, L.A.; Kaufman, L.; Brant-Zawadzki, M.; Posin, J.P.; Arakawa, M.; Watts, J.C.; Hoenninger, J. Magnetic Resonance Imaging Performance: A comparison of sodium and hydrogen. Radiology 1985, 156, 133–138. [Google Scholar] [CrossRef]
- Nunes Neto, L.P.; Madelin, G.; Sood, T.P.; Wu, C.-C.; Kondziolka, D.; Placantonakis, D.; Golfinos, J.G.; Chi, A.; Jain, R. Quantitative sodium imaging and Gliomas: A feasibility study. Neuroradiology 2018, 60, 795–802. [Google Scholar] [CrossRef]
- Zaric, O.; Pinker, K.; Zbyn, S.; Strasser, B.; Robinson, S.; Minarikova, L.; Gruber, S.; Farr, A.; Singer, C.; Helbich, T.H.; et al. Quantitative Sodium Mr Imaging at 7 T: Initial results and comparison with diffusion-weighted imaging in patients with breast tumors. Radiology 2016, 280, 39–48. [Google Scholar] [CrossRef]
- Paling, D.; Solanky, B.S.; Riemer, F.; Tozer, D.J.; Wheeler-Kingshott, C.A.M.; Kapoor, R.; Golay, X.; Miller, D.H. Sodium accumulation is associated with disability and a progressive course in multiple sclerosis. Brain 2013, 136, 2305–2317. [Google Scholar] [CrossRef]
- Petracca, M.; Vancea, R.O.; Fleysher, L.; Jonkman, L.E.; Oesingmann, N.; Inglese, M. Brain intra- and extracellular sodium concentration in multiple sclerosis: A 7 T MRI study. Brain 2016, 139, 795–806. [Google Scholar] [CrossRef] [PubMed]
- Cash, K.J.; Li, C.; Xia, J.; Wang, L.V.; Clark, H.A. Optical drug monitoring: Photoacoustic imaging of nanosensors to monitor therapeutic lithium in vivo. ACS Nano 2015, 9, 1692–1698. [Google Scholar] [CrossRef] [PubMed]
- Lee, C.H.; Folz, J.; Tan, J.W.Y.; Jo, J.; Wang, X.; Kopelman, R. Chemical imaging in vivo: Photoacoustic-based 4-dimensional chemical analysis. Anal. Chem. 2019, 91, 2561–2569. [Google Scholar] [CrossRef] [PubMed]
- Tan, J.W.Y.; Folz, J.; Kopelman, R.; Wang, X. In vivo photoacoustic potassium imaging of the tumor microenvironment. Biomed. Opt. Express 2020, 11, 3507–3522. [Google Scholar] [CrossRef]
- Wang, L.V. Multiscale photoacoustic microscopy and computed tomography. Nat. Photonics 2009, 3, 503–509. [Google Scholar] [CrossRef]
- Zhai, J.; Xie, X.; Bakker, E. Solvatochromic dyes as ph-independent indicators for ionophore Nanosphere-based complexometric titrations. Anal. Chem. 2015, 87, 12318–12323. [Google Scholar] [CrossRef]
- Wang, L.; Bakker, E. A tunable detection range of ion-selective nano-optodes by controlling solvatochromic dye transducer lipophilicity. Chem. Commun. 2019, 55, 12539–12542. [Google Scholar] [CrossRef]
- Xie, X.; Szilagyi, I.; Zhai, J.; Wang, L.; Bakker, E. Ion-selective optical nanosensors based on solvatochromic dyes of different lipophilicity: From bulk partitioning to interfacial accumulation. ACS Sens. 2016, 1, 516–520. [Google Scholar] [CrossRef]
- Nussbaum, R.; Robinson, K.J.; Soda, Y.; Bakker, E. Optical detection of heparin in whole blood samples using nanosensors embedded in an agarose hydrogel. ACS Sens. 2022, 7, 3956–3962. [Google Scholar] [PubMed]
- Deng, L.; Zhai, J.; Du, X.; Xie, X. Ionophore-based ion-selective nanospheres based on monomer-dimer conversion in the near-infrared region. ACS Sens. 2021, 6, 1279–1285. [Google Scholar] [CrossRef]
- Wang, R.; Zhou, Y.; Ghanbari Ghalehjoughi, N.; Mawaldi, Y.; Wang, X. Ion-induced phase transfer of cationic dyes for fluorescence-based electrolyte sensing in droplet microfluidics. Anal. Chem. 2021, 93, 13694–13702. [Google Scholar] [CrossRef] [PubMed]
- Wang, L.; Sadler, S.; Cao, T.; Xie, X.; Von Filseck, J.M.; Bakker, E. Simplified fabrication for ion-selective optical emulsion sensor with hydrophobic solvatochromic Dye Transducer: A cautionary tale. Anal. Chem. 2019, 91, 8973–8978. [Google Scholar] [CrossRef]
- Du, X.; Wang, R.; Zhai, J.; Li, X.; Xie, X. Ionophore-based ion-selective nanosensors from brush block copolymer Nanodots. ACS Appl. Nano Mater. 2020, 3, 782–788. [Google Scholar] [CrossRef]
- Mistlberger, G.; Crespo, G.A.; Bakker, E. Ionophore-based optical sensors. Annu. Rev. Anal. Chem. 2014, 7, 483–512. [Google Scholar] [CrossRef] [PubMed]
- Dubach, J.M.; Das, S.; Rosenzweig, A.; Clark, H.A. Visualizing sodium dynamics in isolated cardiomyocytes using fluorescent nanosensors. Proc. Natl. Acad. Sci. USA 2009, 106, 16145. [Google Scholar] [CrossRef] [PubMed]
- Balaconis, M.K.; Clark, H.A. Biodegradable optode-based nanosensors for in vivo monitoring. Anal. Chem. 2012, 84, 5787–5793. [Google Scholar] [CrossRef]
- Ruckh, T.T.; Mehta, A.A.; Dubach, J.M.; Clark, H.A. Polymer-free optode nanosensors for dynamic, reversible, and ratiometric sodium imaging in the physiological range. Sci. Rep. 2013, 3, 3366. [Google Scholar] [CrossRef]
- Xie, X.; Mistlberger, G.; Bakker, E. Ultrasmall fluorescent ion-exchanging nanospheres containing selective ionophores. Anal. Chem. 2013, 85, 9932–9938. [Google Scholar] [CrossRef]
- Galyean, A.A.; Behr, M.R.; Cash, K.J. Ionophore-based optical nanosensors incorporating hydrophobic carbon dots and a pH-sensitive quencher dye for sodium detection. Analyst 2018, 143, 458–465. [Google Scholar] [CrossRef]
- Ferris, M.S.; Behr, M.R.; Cash, K.J. An ionophore-based persistent luminescent ‘Glow Sensor’ for sodium detection. RSC Adv. 2019, 9, 32821–32825. [Google Scholar] [CrossRef]
- Shortreed, M.; Bakker, E.; Kopelman, R. Miniature sodium-selective ion-exchange optode with fluorescent pH chromoionophores and tunable dynamic range. Anal. Chem. 1996, 68, 2656–2662. [Google Scholar] [CrossRef]
- Kaur, G.; Kaur, N. Estimation of sodium ions using easily engineered organic nanoparticles-based turn-on fluorescent sensor: Application in biological and environmental samples. Sens. Actuators D Chem. 2018, 265, 134–141. [Google Scholar] [CrossRef]
- Lamy, C.M.; Sallin, O.; Loussert, C.; Chatton, J.-Y. Sodium sensing in neurons with dendrimer-based nanoprobe. ACS Nano 2012, 6, 1176–1187. [Google Scholar] [CrossRef]
- Horvath, T.D.; Kim, G.; Kopelman, R.; Ashkenazi, S. Ratiometric photoacoustic sensing of pH using a “sonophore”. Analyst 2008, 133, 747. [Google Scholar] [CrossRef]
- Li, X.; Zhai, J.; Xie, X. The Hofmeister anion effect on ionophore-based ion-selective nanospheres containing solvatochromic dyes. Electroanalysis 2019, 32, 749–754. [Google Scholar] [CrossRef]
- Watanabe, K.; Nakagawa, E.; Yamada, H.; Hisamoto, H.; Suzuki, K. Lithium ion-selective optical sensor-based on a novel neutral ionophore and a lipophilic anionic dye. Anal. Chem. 1993, 65, 2704–2710. [Google Scholar] [CrossRef]
- Mohamed, S.A.; Herrmann, K.; Adlung, A.; Paschke, N.; Hausner, L.; Frölich, L.; Schad, L.; Groden, C.; Kerl, H.U. Evaluation of Sodium (23Na) MR-imaging as a biomarker and predictor for neurodegenerative changes in patients with Alzheimer’s Disease. In Vivo 2021, 35, 429–435. [Google Scholar] [CrossRef]
- Bakker, E.; Qin, Y. Electrochemical sensors. Anal. Chem. 2006, 78, 3965–3984. [Google Scholar] [CrossRef]
- Driscoll, N.; Rosch, R.E.; Murphy, B.B.; Ashourvan, A.; Vishnubhotla, R.; Dickens, O.O.; Johnson, A.; Davis, K.A.; Litt, B.; Bassett, D.S.; et al. Multimodal in vivo recording using transparent graphene microelectrodes illuminates spatiotemporal seizure dynamics at the microscale. Commun. Biol. 2021, 4, 136. [Google Scholar] [CrossRef] [PubMed]
- Kumar, R.; Wang, Z.J.; Forsythe, C.; Fu, Y.; Yunn-Yi, C.; Yeh, B.M. Dual energy CT monitoring of the renal corticomedullary sodium gradient in swine. Eur. J. Radiol. 2012, 81, 423–429. [Google Scholar] [CrossRef] [PubMed]
- Dubach, J.M.; Harjes, D.I.; Clark, H.A. Fluorescent ion-selective nanosensors for intracellular analysis with improved lifetime and size. Nano Lett. 2007, 7, 1827–1831. [Google Scholar] [CrossRef] [PubMed]

Disclaimer/Publisher’s Note: The statements, opinions and data contained in all publications are solely those of the individual author(s) and contributor(s) and not of MDPI and/or the editor(s). MDPI and/or the editor(s) disclaim responsibility for any injury to people or property resulting from any ideas, methods, instructions or products referred to in the content. |
© 2023 by the authors. Licensee MDPI, Basel, Switzerland. This article is an open access article distributed under the terms and conditions of the Creative Commons Attribution (CC BY) license (https://creativecommons.org/licenses/by/4.0/).
Share and Cite
Folz, J.; Wasserman, J.H.; Jo, J.; Wang, X.; Kopelman, R. Photoacoustic Chemical Imaging Sodium Nano-Sensor Utilizing a Solvatochromic Dye Transducer for In Vivo Application. Biosensors 2023, 13, 923. https://doi.org/10.3390/bios13100923
Folz J, Wasserman JH, Jo J, Wang X, Kopelman R. Photoacoustic Chemical Imaging Sodium Nano-Sensor Utilizing a Solvatochromic Dye Transducer for In Vivo Application. Biosensors. 2023; 13(10):923. https://doi.org/10.3390/bios13100923
Chicago/Turabian StyleFolz, Jeff, Jacalyn H. Wasserman, Janggun Jo, Xueding Wang, and Raoul Kopelman. 2023. "Photoacoustic Chemical Imaging Sodium Nano-Sensor Utilizing a Solvatochromic Dye Transducer for In Vivo Application" Biosensors 13, no. 10: 923. https://doi.org/10.3390/bios13100923
APA StyleFolz, J., Wasserman, J. H., Jo, J., Wang, X., & Kopelman, R. (2023). Photoacoustic Chemical Imaging Sodium Nano-Sensor Utilizing a Solvatochromic Dye Transducer for In Vivo Application. Biosensors, 13(10), 923. https://doi.org/10.3390/bios13100923