Article

A Proof-of-Concept Electrochemical Cytosensor Based on Chlamydomonas reinhardtii Functionalized Carbon Black Screen-Printed Electrodes: Detection of Escherichia coli in Wastewater as a Case Study

1
Institute of Crystallography, National Research Council, Department of Chemical Sciences and Materials Technologies, Via Salaria km 29.300, 00015 Monterotondo, Italy
2
Department of Chemical Science and Technologies, University of Rome “Tor Vergata”, Via della Ricerca Scientifica, 00133 Rome, Italy
3
SENSE4MED, via Renato Rascel 30, 00128 Rome, Italy
4
Faculty of Sciences and Techniques, Hassan II University of Casablanca, Casablanca 20000, Morocco
5
Biosensors S.r.l., Via degli Olmetti 44, Formello, 00060 Rome, Italy
*
Author to whom correspondence should be addressed.
Biosensors 2022, 12(6), 401; https://doi.org/10.3390/bios12060401
Submission received: 17 May 2022 / Revised: 7 June 2022 / Accepted: 8 June 2022 / Published: 10 June 2022
(This article belongs to the Special Issue Microbial Toxins and Pathogen Biodetection)

Abstract

:
Herein, we report a proof-of-concept algal cytosensor for the electrochemical quantification of bacteria in wastewater, exploiting the green photosynthetic alga Chlamydomonas reinhardtii immobilized on carbon black (CB) nanomodified screen-printed electrodes. The CB nanoparticles are used as nanomodifiers, as they are able to sense the oxygen produced by the algae and thus the current increases when algae are exposed to increasing concentrations of bacteria. The sensor was tested on both standard solutions and real wastewater samples for the detection Escherichia coli in a linear range of response from 100 to 2000 CFU/100 mL, showing a limit of detection of 92 CFU/100 mL, in agreement with the maximum E. coli concentration established by the Italian law for wastewater (less than 5000 CFU/100 mL). This bacterium was exploited as a case study target of the algal cytosensor to demonstrate its ability as an early warning analytical system to signal heavy loads of pathogens in waters leaving the wastewater treatment plants. Indeed, the cytosensor is not selective towards E. coli but it is capable of sensing all the bacteria that induce the algae oxygen evolution by exploiting the effect of their interaction. Other known toxicants, commonly present in wastewater, were also analyzed to test the cytosensor selectivity, with any significant effect, apart from atrazine, which is a specific target of the D1 protein of the Chlamydomonas photosystem II. However, the latter can also be detected by chlorophyll fluorescence simultaneously to the amperometric measurements. The matrix effect was evaluated, and the recovery values were calculated as 105 ± 8, 83 ± 7, and 88 ± 7% for 1000 CFU/100 mL of E. coli in Lignano, San Giorgio, and Pescara wastewater samples, respectively.

1. Introduction

Currently, water resources face severe quantitative and qualitative threats due to the industrialization and rapid economic development in many areas worldwide. Issues related to the ecological, health, and hygienic state of the water bodies are well-documented and represent a crucial concern to minimize the human impact on both fresh and saltwater bodies [1]. One crucial point in preserving the quality of bodies of water is wastewater management. Many quality indicators are routinely used to measure the different characteristics of disposing or reusing waste fluids. The most prominent parameters to monitor are reported in the Directive 2006/118/EC of the European Parliament on the protection of groundwater against pollution and deterioration [2].
Commonly approved techniques to monitor wastewater contaminants (e.g., pesticides, herbicides and fertilizers among others) are laboratory-based ones, which require frequent calibration, sample pre-treatment, and long and expensive procedures. Furthermore, sampling happens only at fixed intervals of time, meaning that high pollution phenomena occur in a short window of time (e.g., heavy rain that washes away pesticides/herbicides/fertilizers from cultivated fields or an accidental or malicious release of toxic compounds from an industry) may go undetected. These aspects support the necessity for novel analytical tools with similar or better sensitivity when compared to currently approved techniques but, which are at the same time, portable and easy to integrate directly on-site, with on-line detection of multi-pollutants with minimal or no pretreatment.
Biosensors offer numerous advantages compared to classical monitoring techniques. Being smaller and cheaper, they require less maintenance and show a lower frequency of calibration. This makes biosensors easily integrated into water and wastewater treatment plants, before and after the treatment process, allowing for precise and fast estimation of the incoming pollutant’s load, the efficiency of the applied treatments, and the pollutant’s load in the effluent waters. In turn, these properties allow for real-time corrections to the treatment process or, in case of heavy loads of pollutants or the presence of species difficult to degrade, a shutdown of the plant outstream to prevent downstream pollution. Due to the flexibility of both the transduction method and sensing material, biosensors can be easily adapted to detect a wide range of water parameters and pollutant species presence and concentration [3,4,5,6,7,8,9,10]. A large number of algal biosensors have also been described in the literature [11], based on diverse transduction systems [12], support materials [13], and nanomaterials [14], towards many target analytes, including herbicides [15], endocrine-disrupting chemicals [16], and chemical warfare agents [17]. A recent requirement that interrogates the algal biosensor is the detection of pathogens in wastewater, where the concentration of bacteria can be compatible with the algae sensitivity. Indeed, diverse matrices must comply with the limits imposed by European regulations for the presence of pathogens. As an example, the EU requires that “foodstuffs must not contain residue levels of veterinary medicines or biocidal products that might represent a hazard to the health of the consumer” [18]. Similar regulations have been promulgated for surface waters (e.g., lakes, rivers, and seawater) [2,19,20] and concerning wastewater treatment, with particular attention to the contaminant levels in the water leaving the treatment plant [21].
Current biosensing methods for the detection of microorganisms in various matrices are mostly centered on the antigen–antibody interaction, which in turn triggers variation in the physic-chemical parameters recorded by the transducer. These methods are very effective for monitoring microorganisms in fresh and saltwater but suffer when applied in wastewater due to the complexity, both chemical and physical, of the matrix involved. On the other hand, bacteria present in wastewater could be monitored by leveraging the effect of their interaction with certain microalgae species, e.g., algae. The beneficial effects of bacteria–algae co-cultures have been recently demonstrated, with bacteria being considered as an important source of vitamins, organic growth factors, and CO2, crucial for algal development, especially during carbon limitation periods [22]. However, the amount of CO2 produced by bacteria would be lower than the algal demand [23]. Further studies highlighted that “aerobic bacteria can promote algal growth by reducing the photosynthetic oxygen tension within the microenvironment of the algal cells” [24], boosting in turn algae to augment oxygen evolution.
Based on these findings, we hypothesized that by integrating algae cells of Chlamydomonas reinhardtii, immobilized on screen-printed electrodes nanomodified with carbon black (CB), in an electrochemical transduction system, we would be able to record the rising currents under light illumination and the applied potential, due to algae oxygen production in the presence of bacteria. Indeed, we demonstrated in our previous article [14] the capability of CB nanoparticles to “sensitively sense changes in algae oxygen evolution during the photosynthetic process”. To the best of our knowledge, this is the first cytosensor developed for pathogen detection that uses algae as bioreceptors.

2. Materials and Methods

2.1. Chemicals

All reagents were purchased as high purity grade. Tris-acetate-phosphate, tricine, sucrose, methanol, sodium alginate, sodium chloride, calcium chloride, atrazine, and catechol, bisphenol A were purchased from Sigma-Aldrich (St. Louis, MO, USA). Copper (Cu2+) and arsenic (AsIII) were purchased from Carlo Erba. Carbon black nanomodified screen-printed electrodes (CB-SPEs) were delivered by SENSE4MED, Italy.

2.2. Algae Growth Conditions and Physiological Characterization of the Algal Liquid Cultures

Algae growth and characterization was accomplished according to the protocols described in Ref. [14]. C. reinhardtii F255N was grown under continuous light (50 µL photons m−2 s−1), on tris-acetate-phosphate (TAP) culture medium into an orbital shaker at 25 °C, stirring at 150 rpm. At 72 h inoculation, the algae culture was diluted in TAP to an optical density of 0.15 OD750. Then the refreshed culture was grown under the same conditions for all the periods of the physiological characterization, using cell culture in an early mid-exponential growth phase, with Abs750 0.5 O.D., 106 cells/mL, and 5 µg/mL chlorophyll content. Cell number was quantified using a Bio-Rad TC-10 automated counter (Hemel Hempstead, UK), using a 10 µL-volume cell counting slide. Pigment content was spectrophotometrically measured by quantifying the absorbance (O.D.) of the chlorophylls a and b at 652 nm wavelength, once extracted with 80% acetone. The calculation of the total chlorophyll concentration expressed as µg/mL was performed by the equation (O.D.652 × 1000)/34.5. The photosynthetic profile was assessed by the chlorophyll a fluorescence induction (Kautsky) curves, recorded with a Plant Efficiency Analyzer (PEA) at room temperature after 10 min of dark adaptation and with a 5 s saturating pulse excitation light (3500 µL photons m−2 s−1) using an array of six red light-emitting diodes (650 nm peak). Kautsky curves or OJIP curves are defined by a polyphasic fluorescence rise in time, with O as the minimal dark-acclimated fluorescence level (indicating that all QA are oxidised) and P as the maximal level (indicating that all PSII quinone acceptors are fully reduced). The difference in the fluorescence signal of these distinct states helps to evaluate the PSII functionality through the following parameters calculated by the fluorimeter:
F0 or fluorescence in the initial state: minimum fluorescence intensity in the state acclimated to the darkness, recorded when all PSII reaction centres are open (oxidized quinones);
FM or maximum fluorescence: maximum fluorescence intensity reached after 10 min of darkness and a subsequent saturating light pulse, recorded when all reaction centres of the PSII are closed (reduced);
FV/FM: maximum fluorescence yield of PSII photochemical reaction expressed as a ratio of variable fluorescence (FM − F0) and maximum fluorescence, calculated according to the Equation (1):
FV/FM = (FM − F0)/FM,
where FV represents the maximum variable fluorescence calculated as FM-F0, FM corresponds to the maximum fluorescence emission and F0 is the minimum fluorescence emission. It reflects the efficiency of PSII in using light for photochemical conversion and its value is usually at 0.8 in physiological conditions or decreased values under stress.
Optical microscopy was conducted on liquid cultures of C. reinhardtii algae cells in TAP medium at different grow stages, using a Leitz Diavert Microscope.

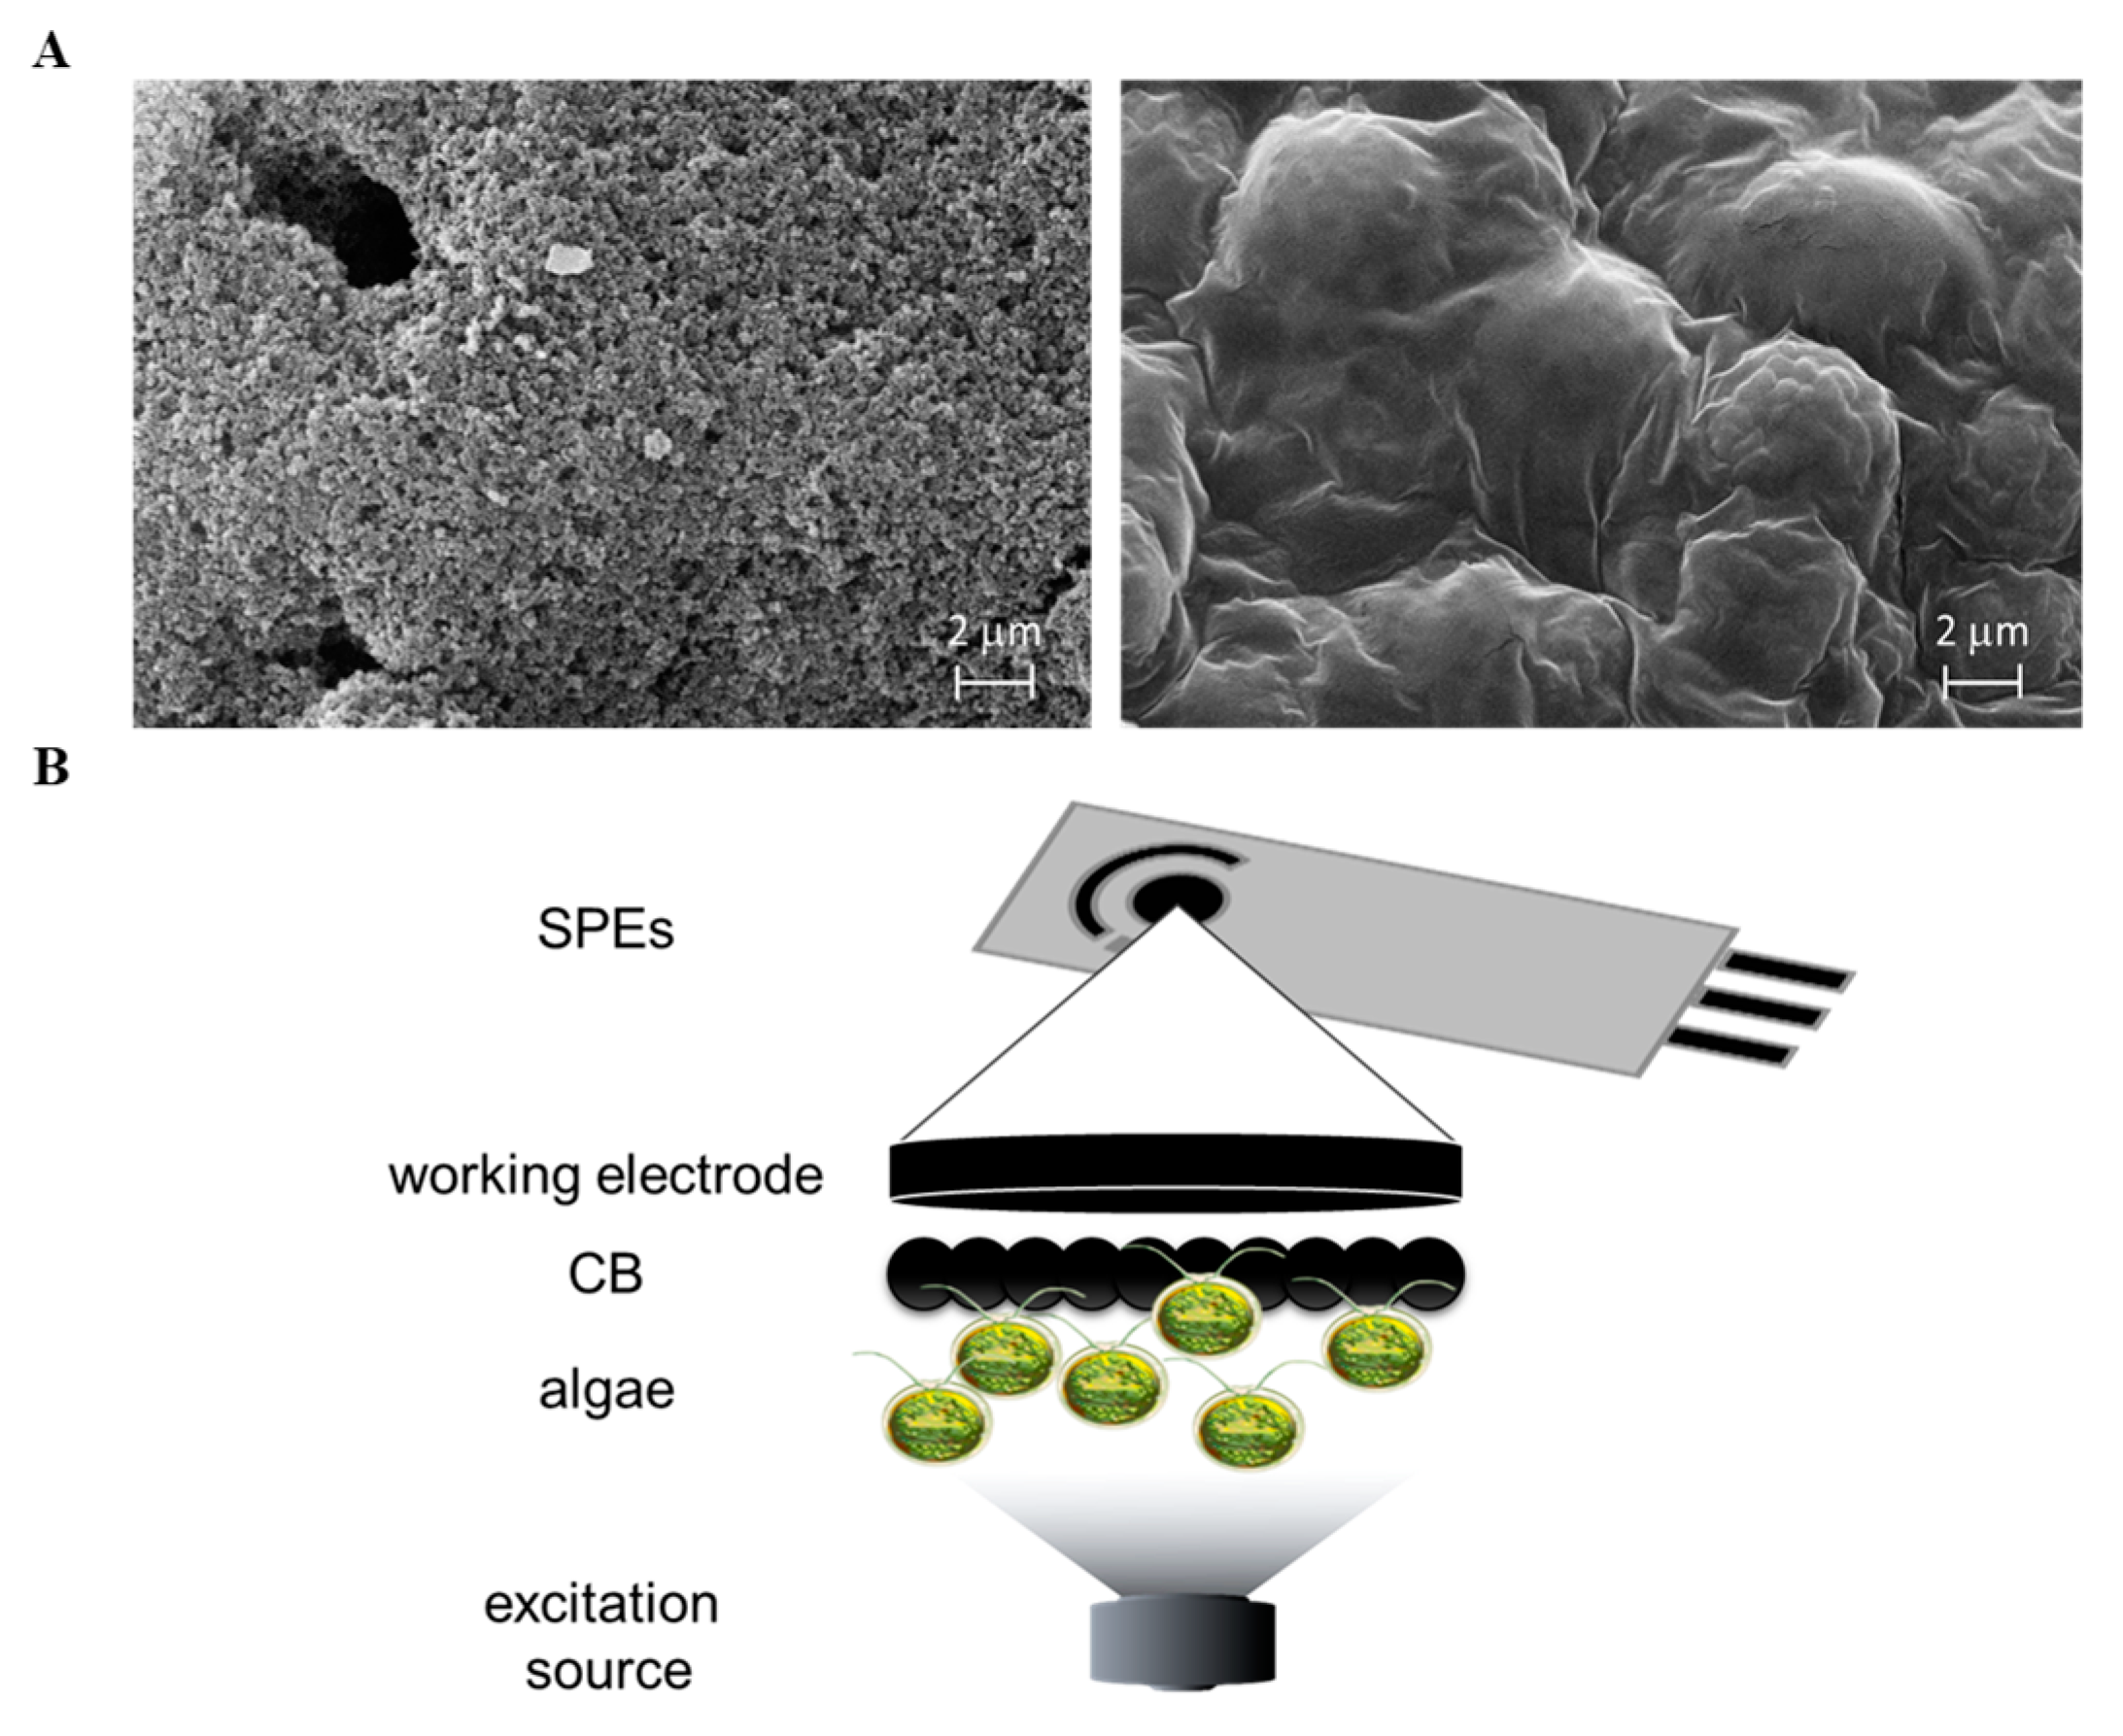
2.3. Algae Immobilization Protocol

Algae immobilization was accomplished according to the protocols described in Ref. [14] with a final cell concentration of 0.08 × 10⁶ cells/µL for each SPE. C. reinhardtii F255N cell cultures in an early mid-exponential growth phase, with Abs750 0.7 O.D., 107 cells/mL, and 10 µg/mL chlorophyll content, were exploited for the immobilization on carbon black modified screen-printed electrodes (CB-SPEs) purchased from SENS4MED (Rome, Italy). Algae/CB-SPEs were stored in 50 mM Tricine, 20 mM CaCl2, 5 mM MgCl2, 50 mM NaCl, and 70 mM sucrose pH 7.2 and incubated for 2 h under continuous light (50 µL photons m−2 s−1) and 25 °C. SEM analysis was conducted on a ZEISS EVO MA10 scanning electron microscope. Algae were subjected to gold metallization and then dehydration under vacuum before SEM analysis. Microphotographs were provided at a magnification of 2 µm.

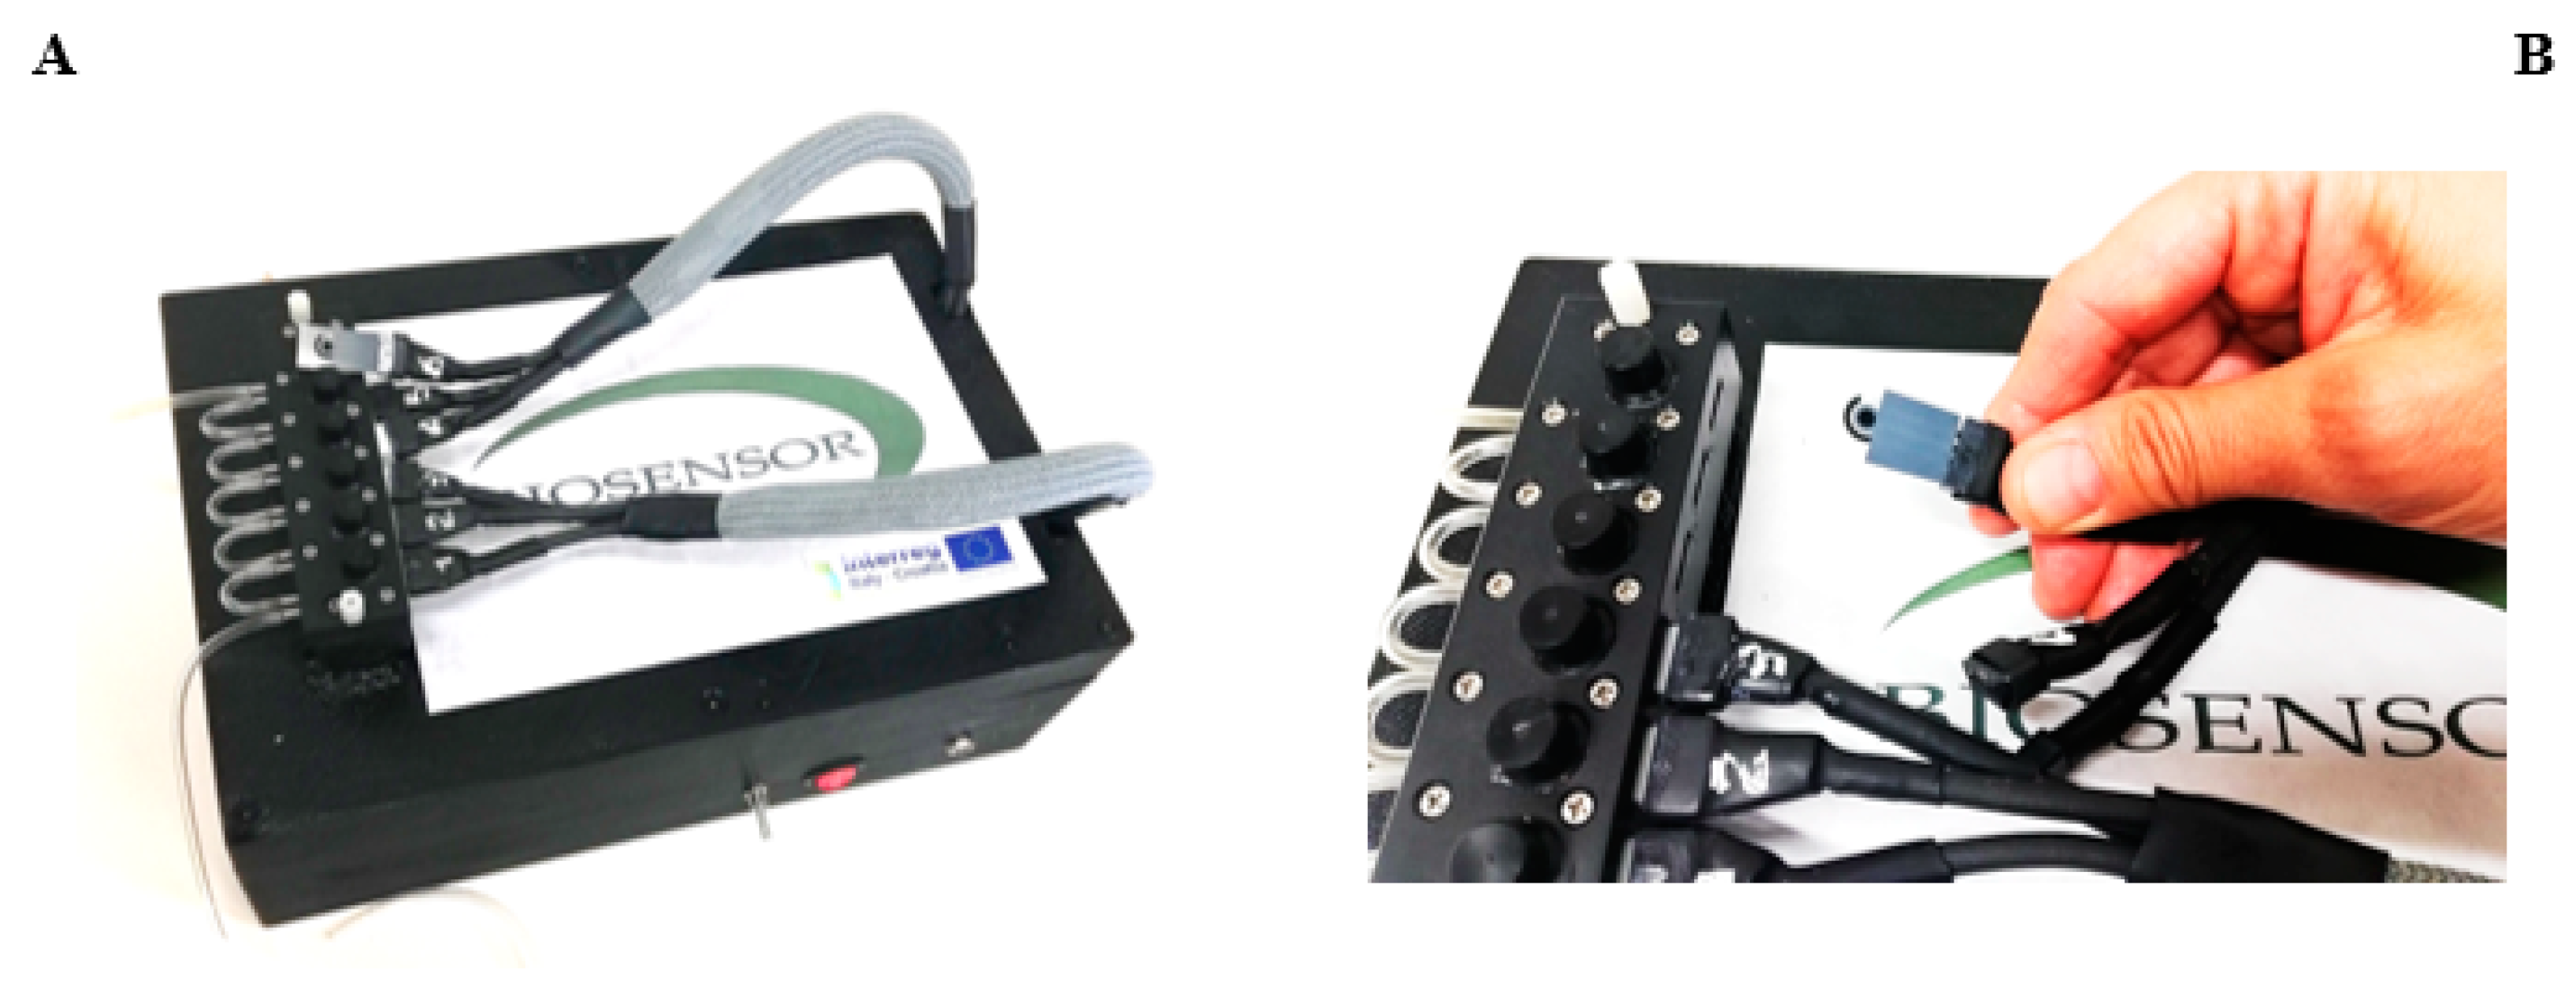
2.4. Biosensor Prototype

A dual electro-optical transduction prototype was projected and realized to furnish both optical and electrochemical analysis by the company Biosensor Srl (Figure 1A). The instrument is a portable prototype consisting of 6 module chambers for the insertion of the algal CB-SPEs (Figure 1B). The chamber is equipped with a LED system (of 350 μL photons m−2 s−1 of red light at a 650 nm wavelength) that provides the algae illumination. The electrochemical set-up is constituted of a DC voltage supply, which provides a bias potential in the range of ±0.800 V between the working and the reference electrodes, and an amperometer to detect the current intensity variation deriving from the algae oxygen evolution process. The biological module, perfectly sealed, hosts the samples under test. Both static and dynamic operations are allowed thanks to an automatically controlled fluidic system equipped with inlet/outlet connections for the electrolytic/washing solution and sample flow. Fifty mM Tricine, 20 mM CaCl2, 5 mM MgCl2, 50 mM NaCl, 70 mM sucrose, and pH 7.2 was used as the measuring buffer for the electrochemical analysis.

2.5. Pathogen Detection

The electrochemical detection of Escherichia coli (E. coli BL21), exploited as a case study pathogen, was provided by following algae oxygen evolution capacity at an applied potential of −0.6 V, using a dual electro-optical transducer prototype (Biosensor Srl, Via degli Olmetti, Rome, Italy). Algae were illuminated by a 350 µL photons m−2 s−1 light with repeated cycles of 30 s light excitation and 10 min dark. An applied potential of −0.6 V was used with an acquirement interval of 0.5 s. Pathogens were added into the electrochemical chamber (200 µL volume containing 50 mM Tricine, 20 mM CaCl2, 5 mM MgCl2, 50 mM NaCl, 70 mM sucrose pH 7.2) in a concentration range from 100 to 2000 CFU/100 mL and the current signals, due to oxygen production on the CB-SPE working electrode, were recorded in dependence to the target analyte concentrations.

3. Results

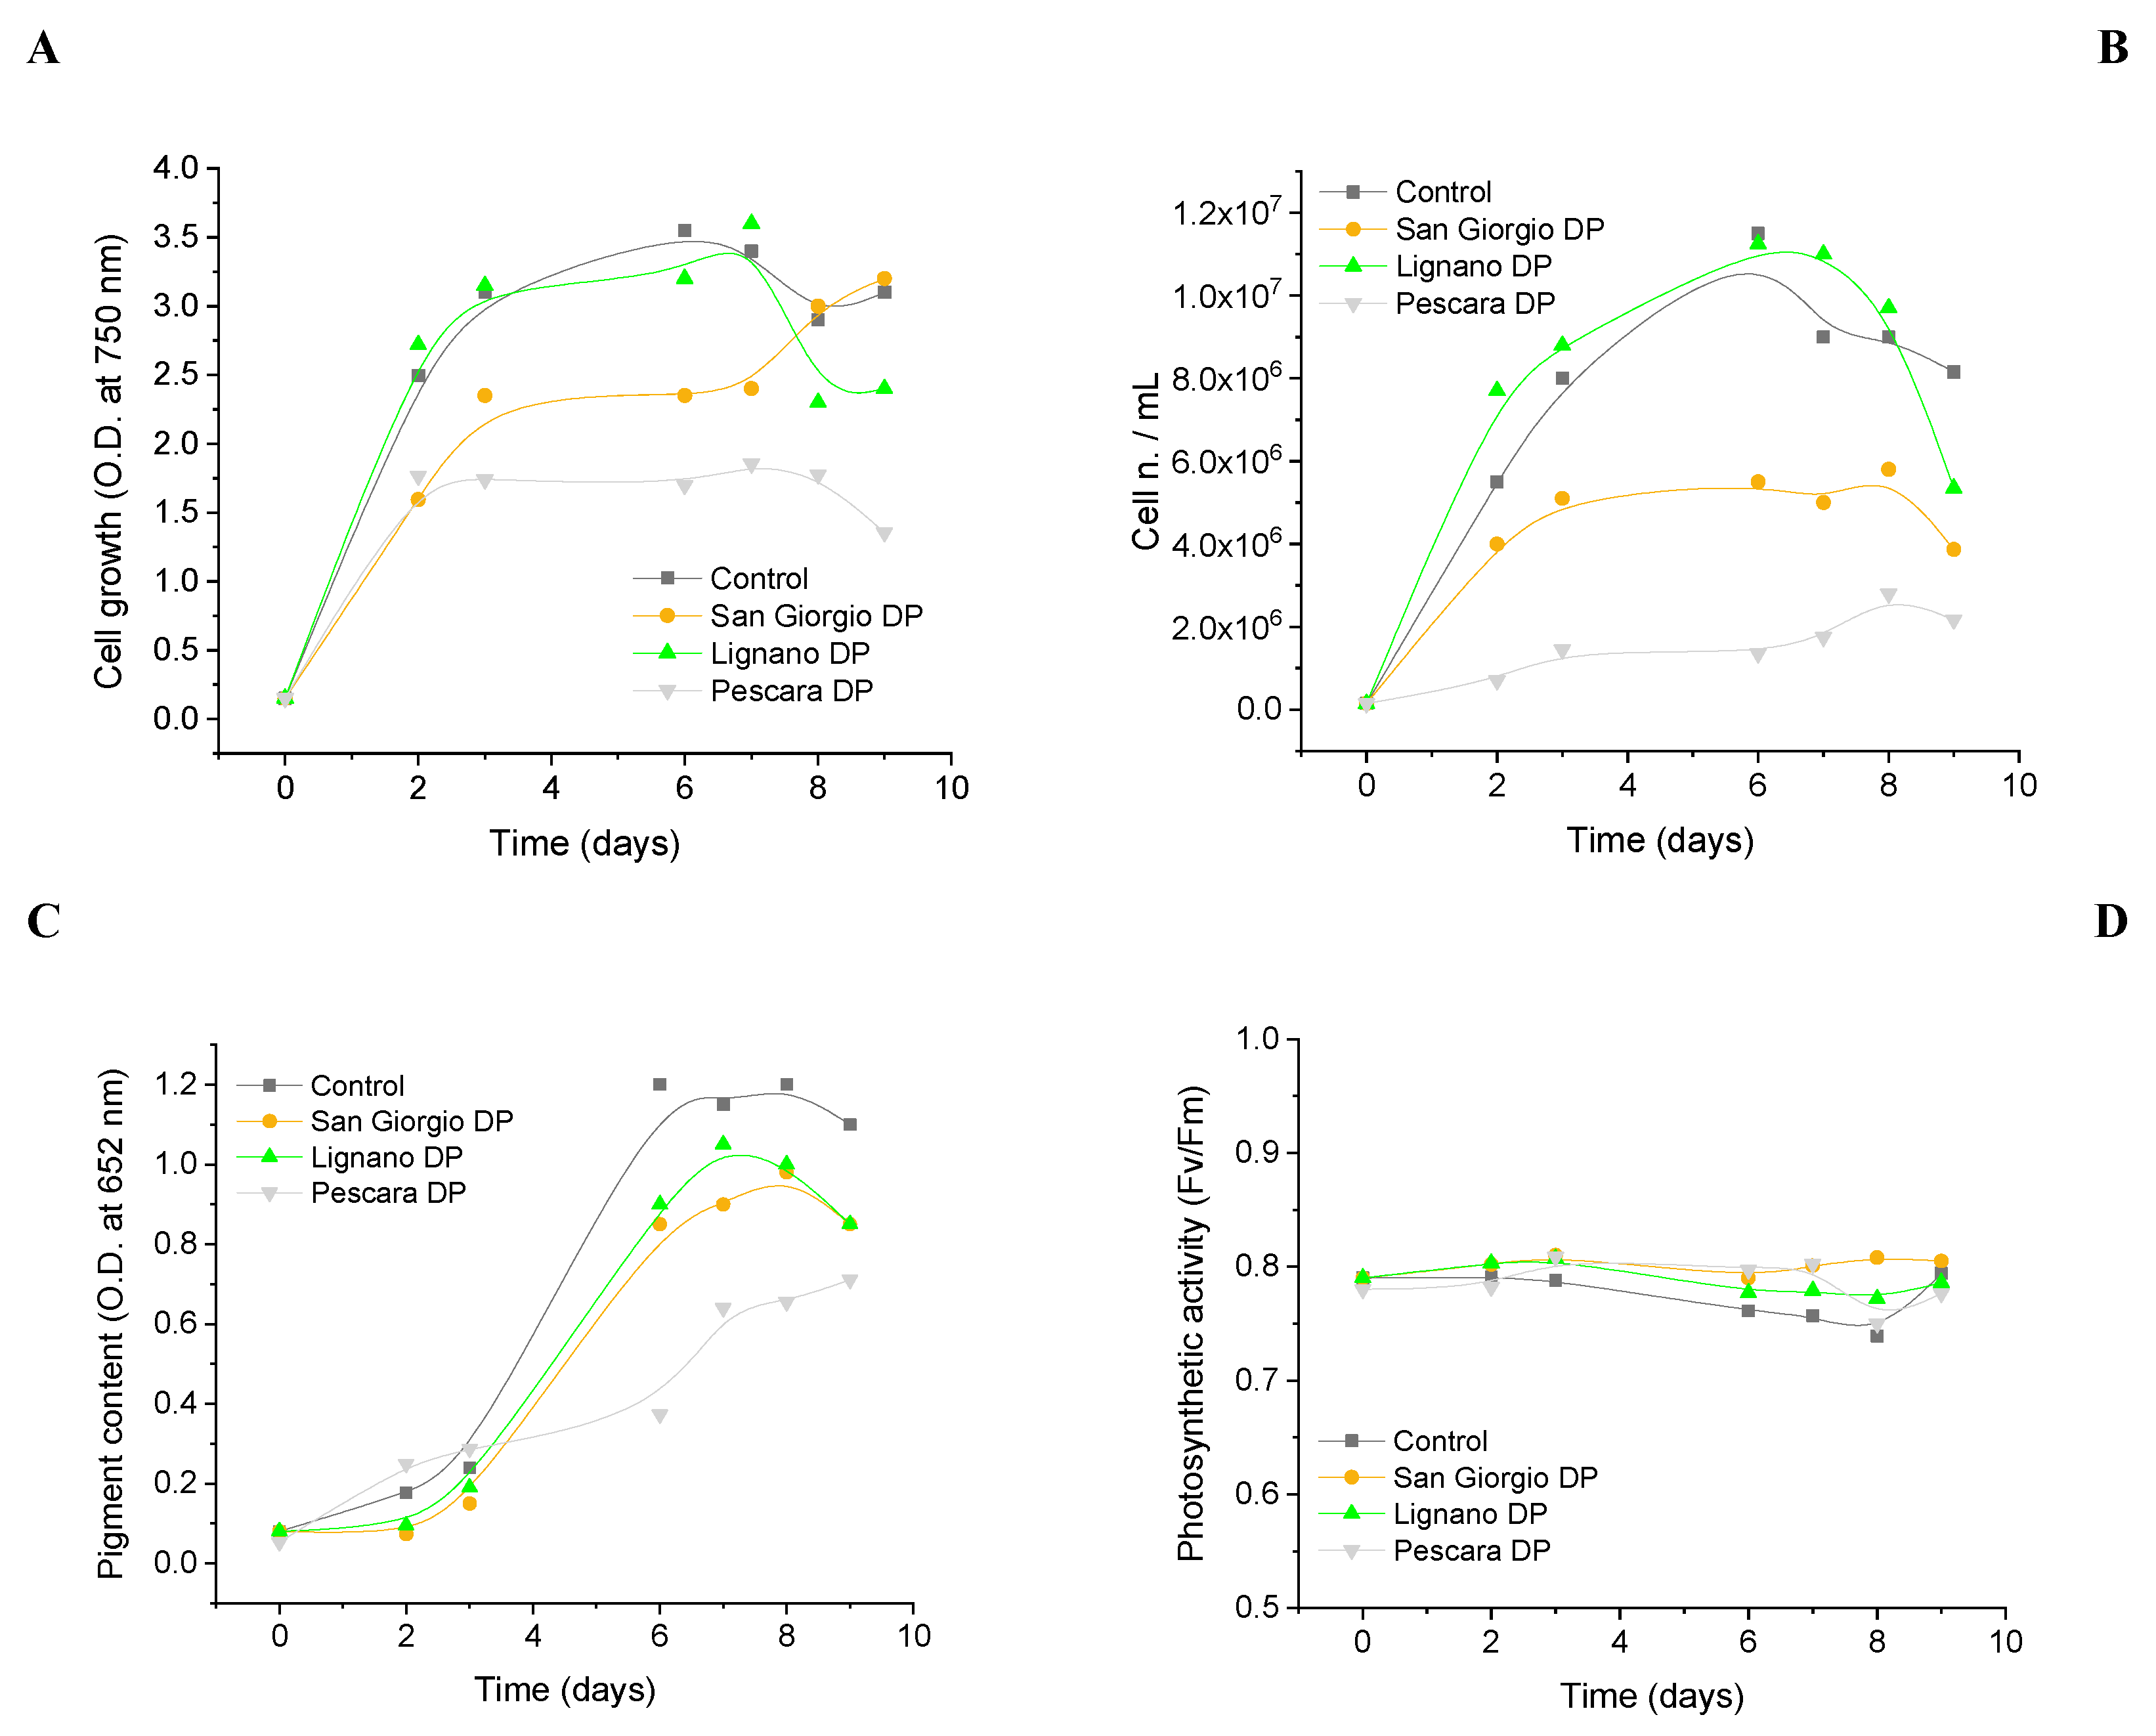
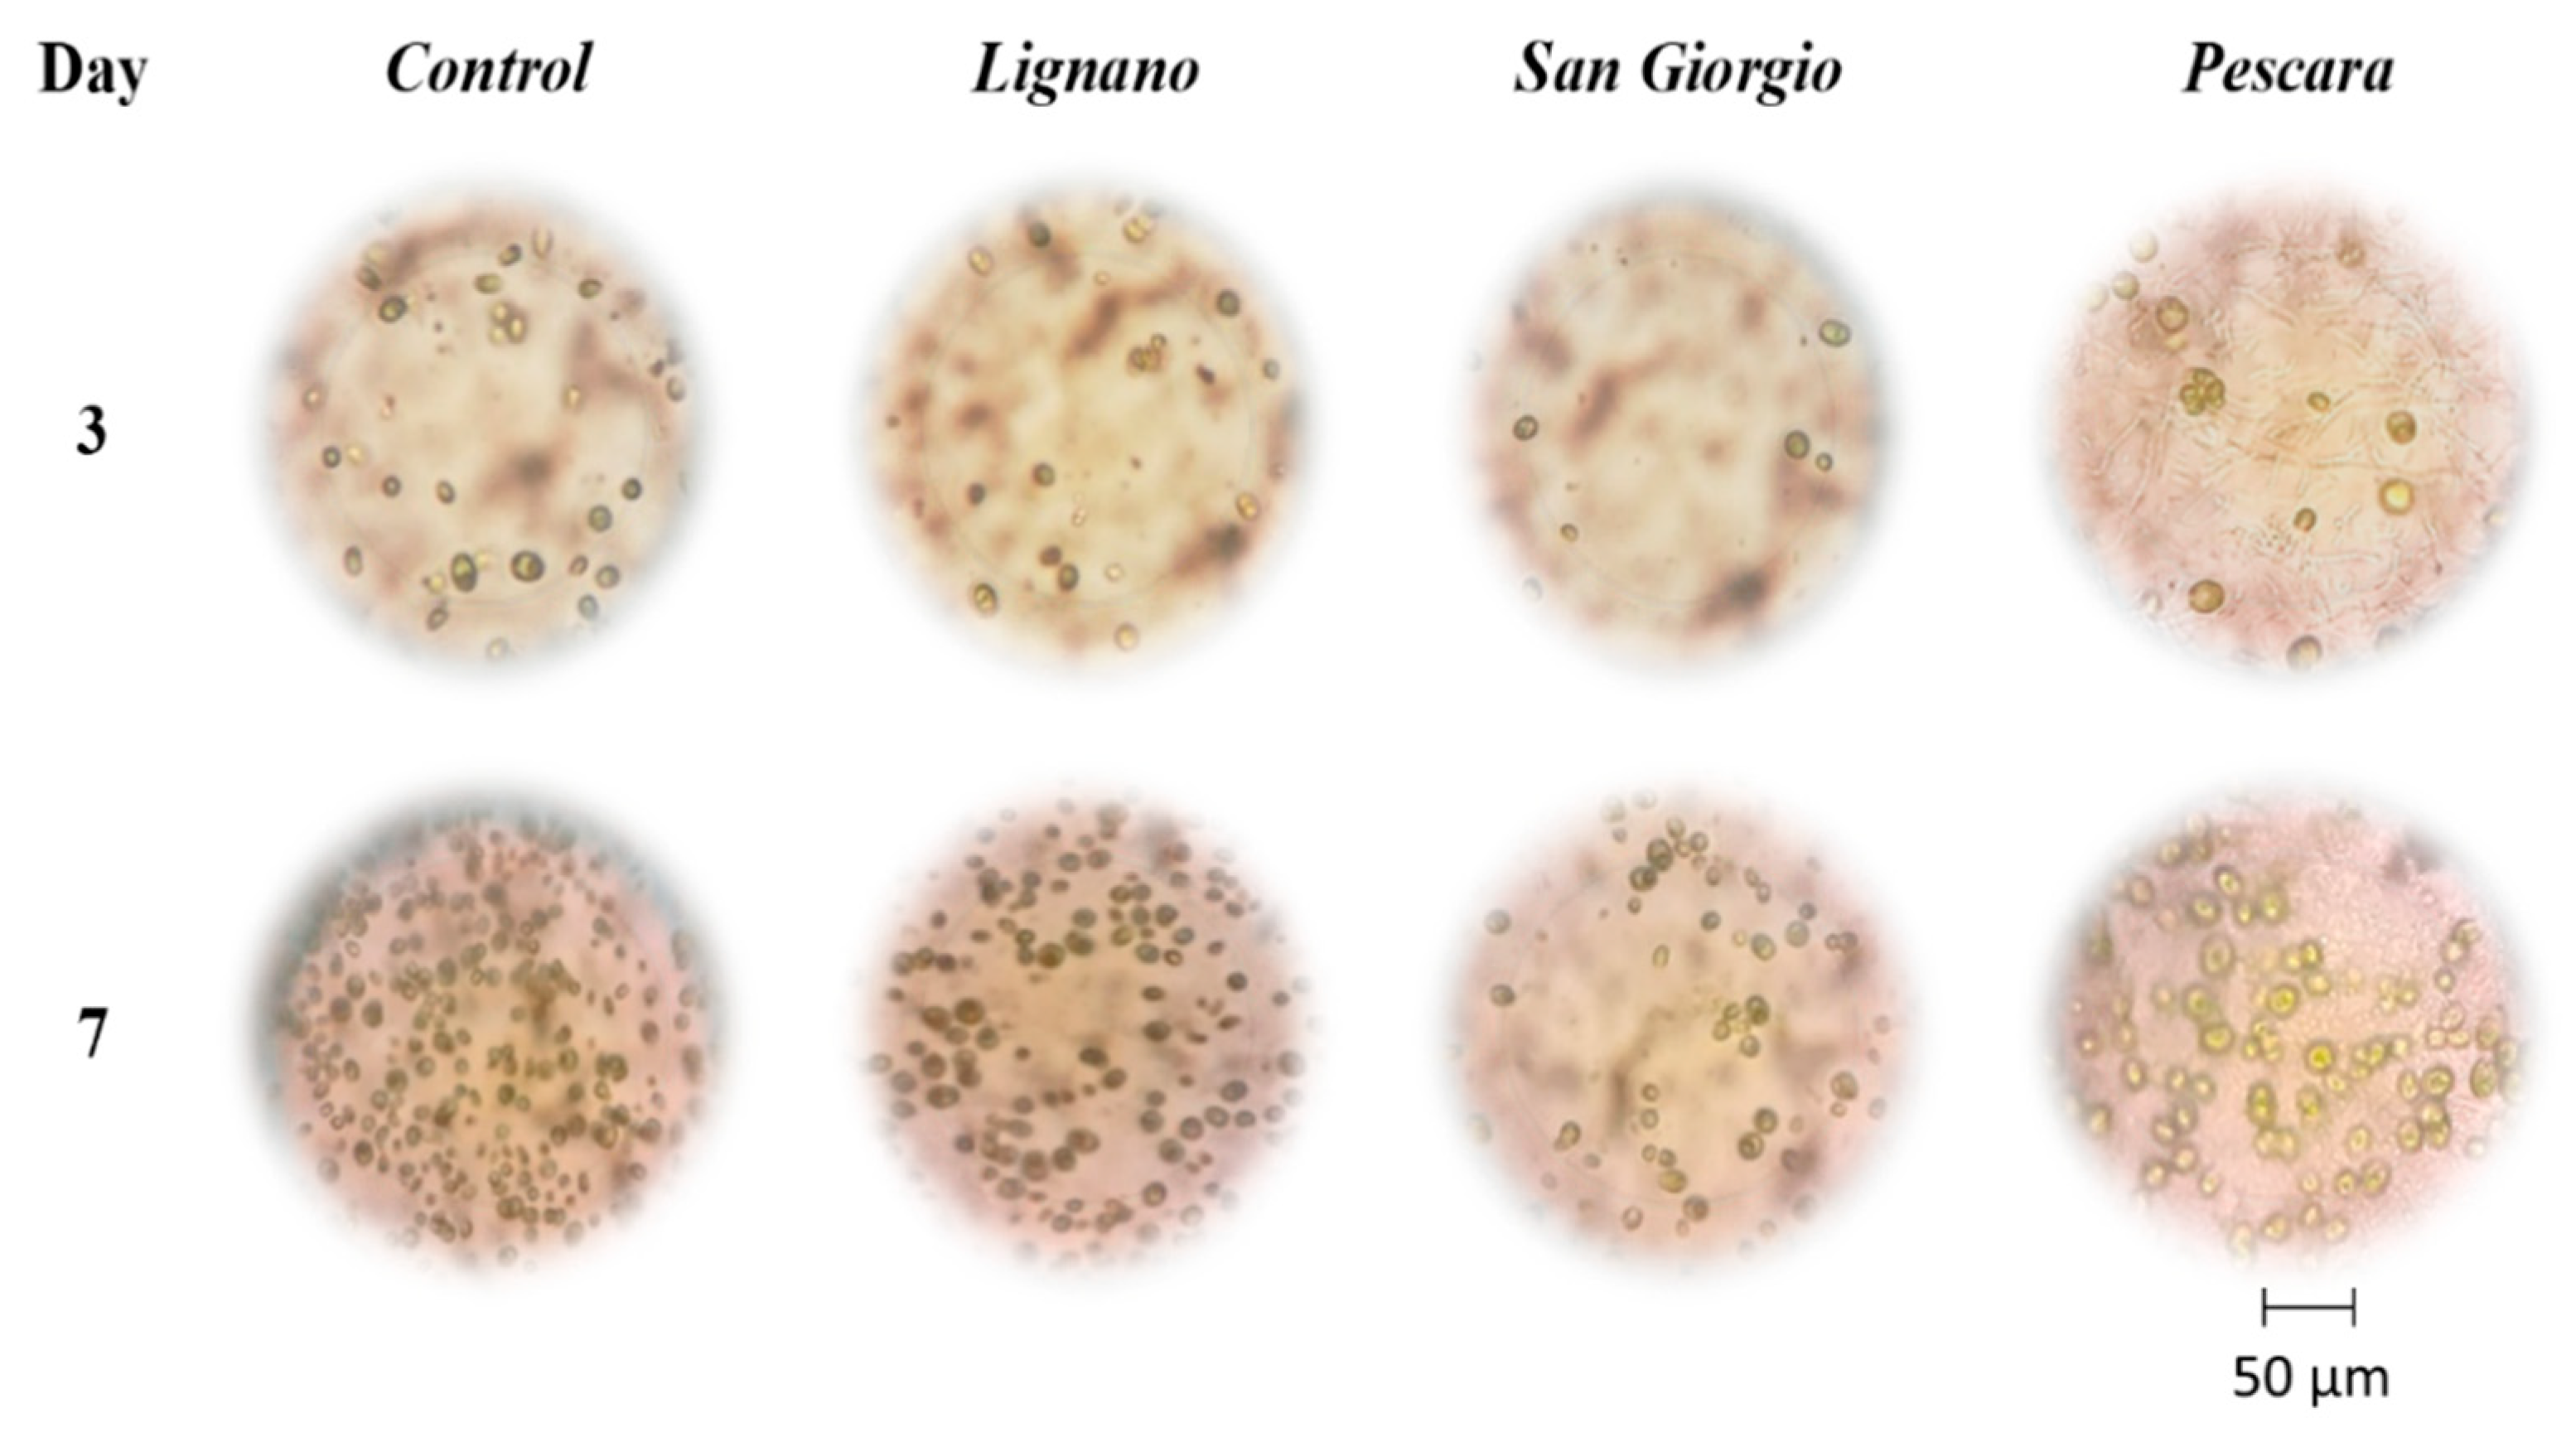
3.1. Effect of Wastewater Samples on the Alga C. Reinhardtii

With the aim to design an algal cytosensor for pathogen detection, the first step entailed the study of the effect of wastewater samples on the algal physiological parameters including the photosynthetic activity, the growth rate, and the pigment content. The green photosynthetic alga C. reinhardtii was thus grown in different water samples from 3 selected sites in the Adriatic region, i.e., Lignano, San Giorgio, and Pescara depuration plants (DPs).
In detail, optical density, cell number, chlorophyll a fluorescence, and the total chlorophyll content were measured. Results on growth (absorption at 750 nm and cell number/mL, Figure 2A,B) and pigment content (Figure 2C) evidenced a slight influence of the Lignano water sample on algae cell grow in terms of altered vital processes and variations in the physiological parameters (e.g., cell duplication). On the contrary, a toxic effect from San Giorgio and Pescara water samples was evidenced on both algae growth (Figure 2A,B) and pigment content production (i.e., chlorophylls) (Figure 2C). The photochemical efficiency of PSII was also evaluated through Kautsky curves as described in Section 2.3 “Algae physiological characterization”, following the maximum fluorescence yield of Photosystem II FV/FM during the analyzed period of 9 days (Figure 2D). In this case, no effect was registered regarding the maximum fluorescence yield, which remains constant during the time.
Optical microscopy images also evidenced a slowdown of the cell growth in the time for algae incubated in San Giorgio and Pescara water samples, in comparison with the control, while any effect was observed in the presence of Lignano water (Figure 3).

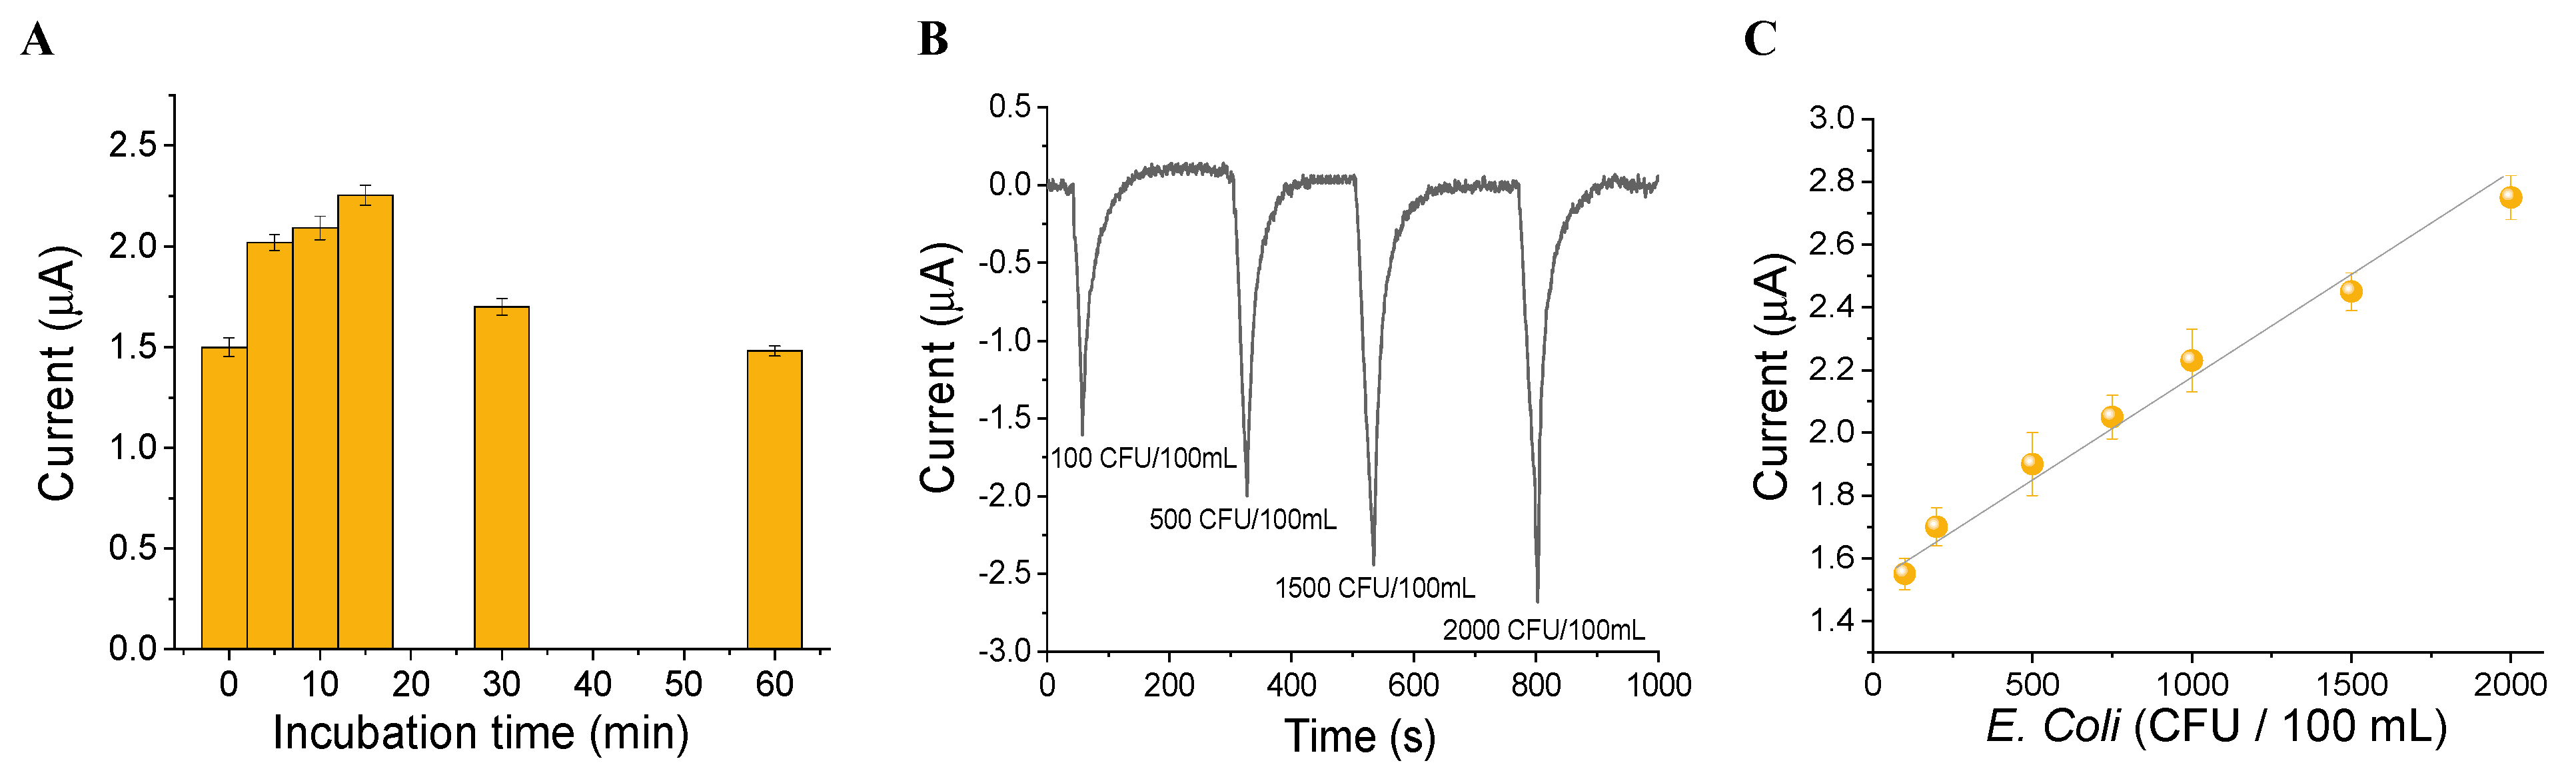
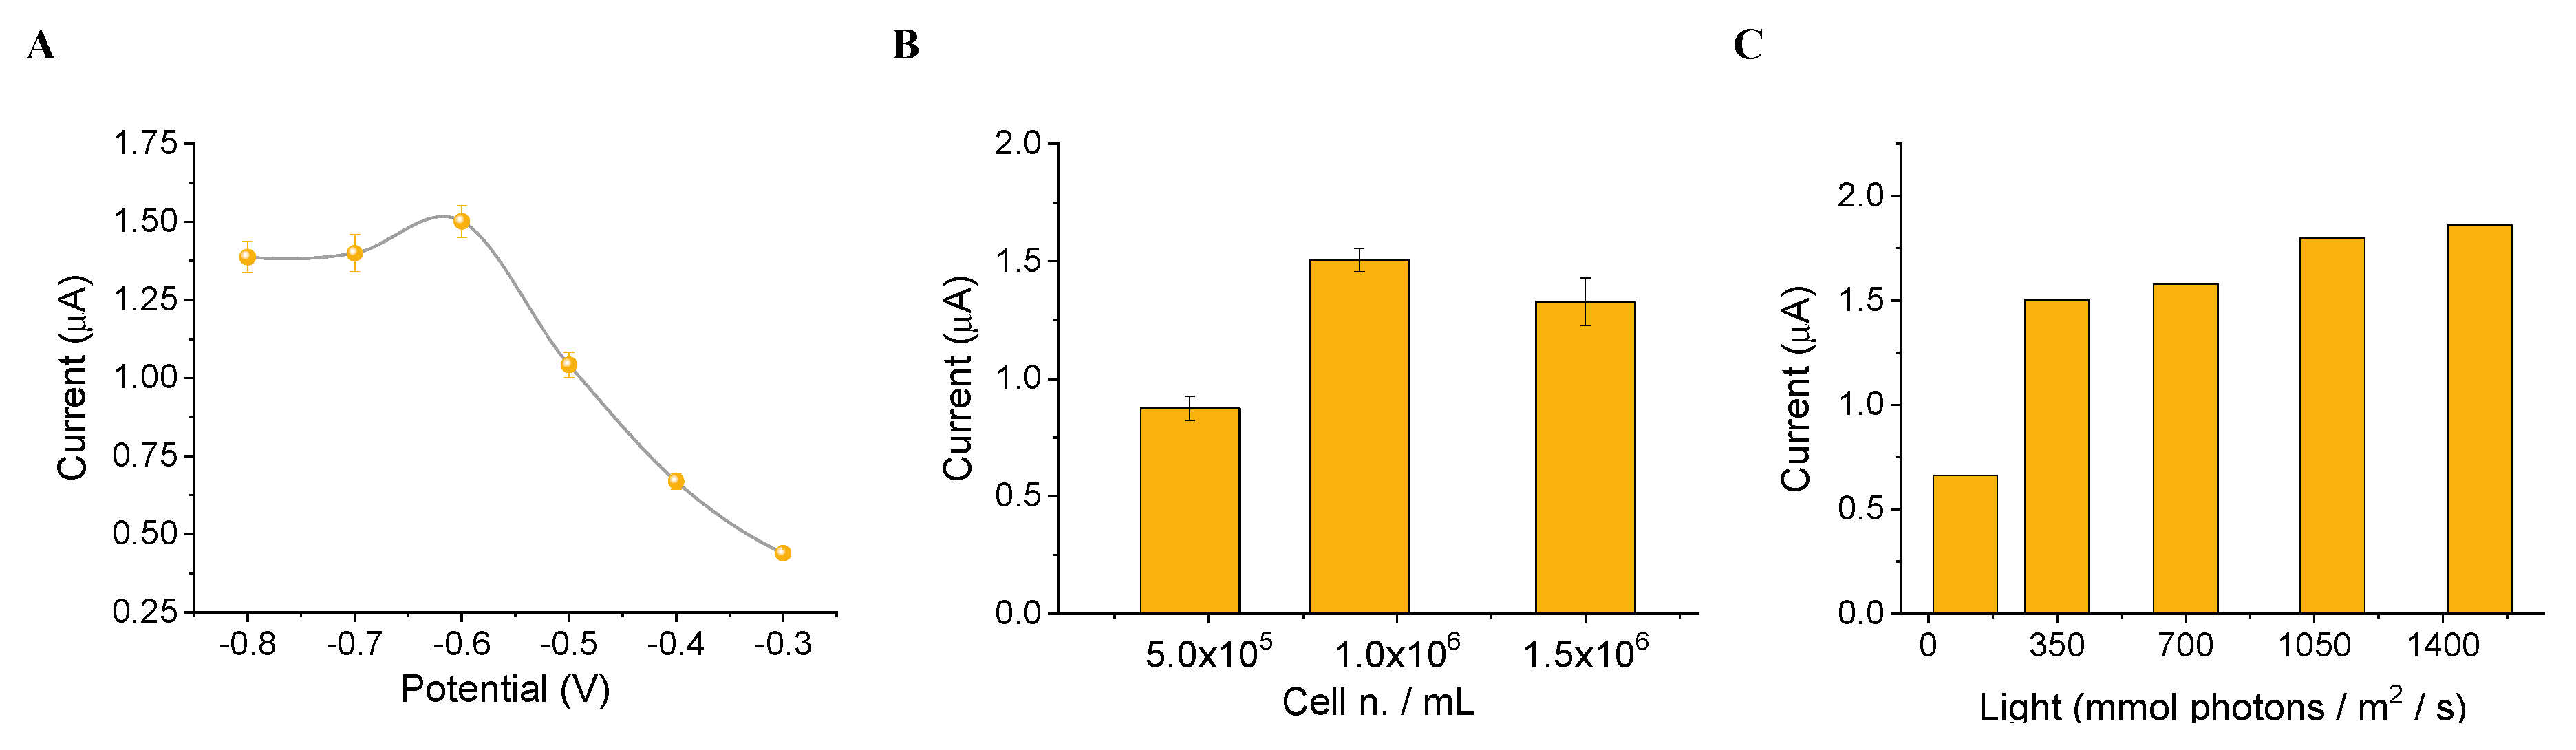
3.2. Set-Up of the Algal Cytosensor and Assessment of the Analytical Parameters

The algal CB-SPEs and CB-SPEs immobilized with algae (using the protocol described in Section 2.3) were observed at Scanning Electron Microscopy (SEM) as reported in Figure 4A, which show microphotographs of CB (left) and algae whole cells entrapped into the calcium/alginate matrix (right) at a magnification of 2 μm. The algal/CB-SPEs were thus inserted into the measurement chamber of the biosensor prototype (Figure 1) and amperometric measurements were accomplished for the detection of E. coli, a case study pathogen that can be found in wastewater. A scheme of the obtained algal/CB-SPE cytosensor was reported in Figure 4B.
Once we have obtained the algal/CB-SPE cytosensor, all the analytical parameters were optimized. The best applied potential was set for monitoring the oxygen reduction signal generated by the algal activity both in the absence and in the presence of the target, in response to light exposure (λ = 650 nm, 350 μL m−2 s−1 intensity). The algal/CB-SPE was incubated for 10 min in the dark in a reaction volume of 200 mL of measuring buffer, and then stimulated by a light flash of 30 s of red LEDs, optically filtered to a peak wavelength of 650 nm. In this condition, the algal/CB-SPE generated peak current signals from 0.3 to 1.5 µA depending on the potential applied in the range from –0.8 to –0.3 V. As highlighted in Figure 5A, the ad hoc applied potential for the measurements light-induced oxygen evolution was equal to −0.6 V, which resulted in peak currents of 1.5 µA. This value was optimized using the best conditions obtained also for the light intensity and immobilized cell number, which were set to obtain the higher current signals at 350 μL photons m−2 s−1 intensity (Figure 5B) and 0.8 × 10⁶ immobilized cell number (Figure 5C), respectively.

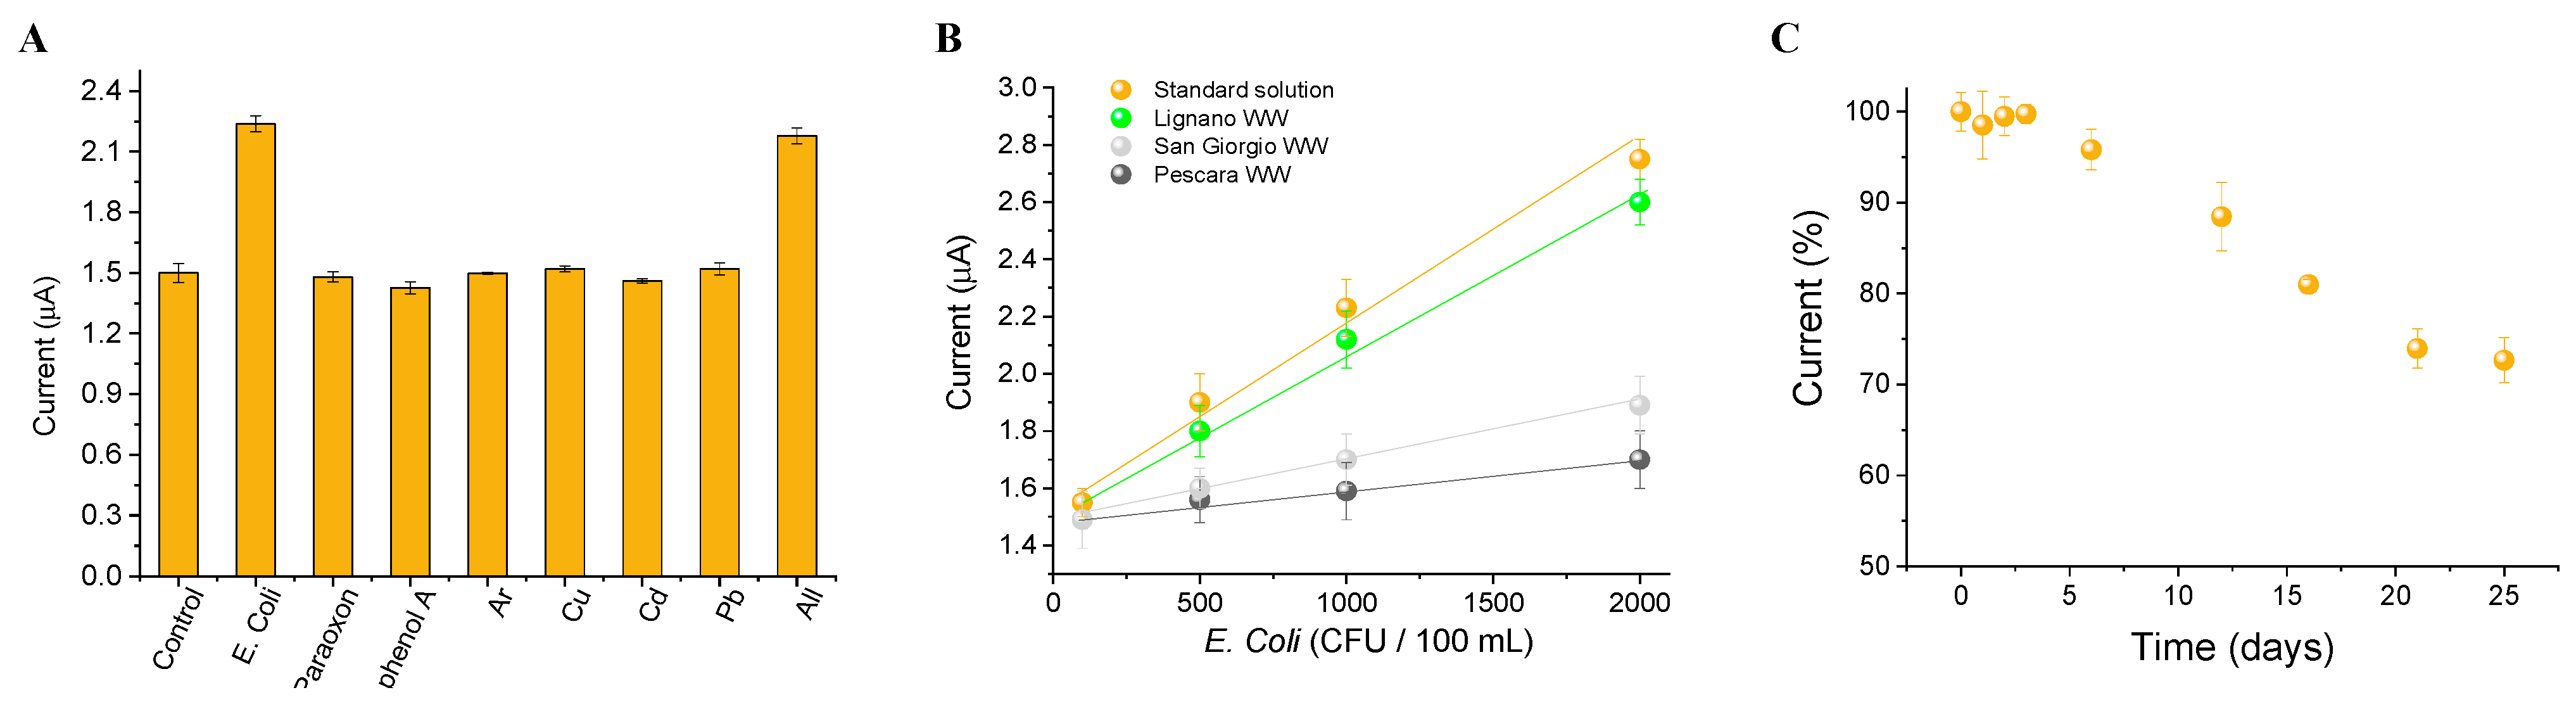
3.3. Algal Cytosensor Analytical Response to Pathogens

Algal/CB-SPEs were incubated in the dark with E. coli at a concentration of 1000 CFU/100 mL from 5 to 60 min, to evaluate the incubation time at which a higher algae oxygen production occurs due to the presence of bacteria, which reduce the photosynthetic oxygen tension within the microenvironment of the algal cells. Indeed, within a short incubation time from 5 and 15 min, an increase of the current signals was observed (Figure 6A), while at higher incubation time a balance of algal oxygen evolution and oxygen sequestration by bacteria was observed, thus providing current signals comparable to algae oxygen production in the absence of bacteria. Considering the results reported in Figure 6A, an incubation time of 15 min was selected.
To obtain a calibration curve for the detection of the target bacterium, algal/CB-SPEs were incubated for 15 min in the dark with E. coli in a concentration range from 100 to 2000 CFU/100 mL. Then, a light flash of 30 s of red LEDs (optically filtered to a peak wavelength of 650 nm at an intensity of 350 μL photons m−2 s−1) was applied to stimulate the algal photosynthetic light-induced oxygen evolution. An increase of the oxygen evolution and thus of the current signals was registered in the presence of the increasing pathogen concentration (Figure 6B), obtaining a linear response and allowing for the construction of a calibration curve described by the equation y = 1.530 (±0.059) − 0.00060 (±0.00005) x, with an R2 = 0.985 (Figure 6C). A detection limit of 92 CFU/100 mL was achieved (LOD = 3 × sd/slope). The linear range and the LOD found can be considered coherent with the maximum E. coli concentration suggested by Italian law for wastewater (less than 5000 CFU/100 mL) [25].
To test the algal cytosensor in wastewater samples, its selectivity was evaluated analyzing metals (10 ppb arsenic, 1.3 ppb copper, 5 ppb cadmium, 10 ppb lead), pesticides (1 ppb paraoxon), and phenolic compounds (10 ppb bisphenol A) at legal limits established by the European legislations for surface water (where present) as interferents that should be present in wastewater from depuration plants [26]. The results reported in Figure 7A highlighted that the interfering species did not affect the analysis of E. coli at the tested concentrations, unless atrazine, which is, as a photosynthetic herbicide, the specific target of the alga. However, the presence of such a herbicide can also be analyzed by chlorophyll fluorescence simultaneously to the amperometric measurements, exploiting the optical module of the biosensor prototype (Figure 1), thus supporting the amperometric analysis of bacteria.
To investigate the suitability of the proposed cytosensor in real samples, the matrix effect was studied. Algal/CB-SPEs were incubated in 200 µL of 2X measuring buffer diluted 1:2 (v:v) in wastewater fortified with E. coli in a concentration range from 100 to 2000 CFU/100 mL. A calibration curve was obtained for each wastewater sample analyzed, described by the equations y = 1.49 (±0.05) − 0.0005 (±0.00004) × (R2 = 0. 989), y = 1.49 (±0.01) − 0.0001 (±0.00001) × (R2 = 0. 975), y = 1.48 (±0.01) − 0.0002 (±0.00001) × (R2 = 0.992) for Lignano, San Giorgio, and Pescara, respectively (Figure 7B). The ratio between the slopes of the calibration curves obtained in standard solutions and real samples was equal to 0.83, 0.16, 0.33, indicating a ~17, 84, and 67% dependence from Lignano, San Giorgio, and Pescara wastewater matrices, respectively. This is due to the presence of high concentration of ammoniacal nitrogen (N-NH3), nitrous nitrogen (N-NO2), nitric nitrogen (N-NO3), and dissolved inorganic nitrogen (DIN) found in the analyzed wastewater samples (i.e., 81.2 µg/L N-NH3, 831.1 µg/L N-NO2, 5212.3 µg/L N-NO3, and 6124.6 µg/L DIN in wastewater from Lignano depuration plant and 491.2 µg/L N-NH3, 56.1 µg/L N-NO2, 414.3 µg/L N-NO3, and 961.6 µg/L DIN in wastewater from San Giorgio depuration plant). The calibration curve obtained for the algal cytosensor in real samples was further used to calculate the recovery values of the surface water samples. Recovery values of 105 ± 8, 83 ± 7, and 88 ± 7% were obtained for 1000 CFU/100 mL of E. coli for Lignano, San Giorgio, and Pescara wastewater samples, respectively.
The storage stability of the algal cytosensor was evaluated by storing the algal/CB-SPEs in the measuring buffer at room temperature under continuous light at 50 μL photons m−2 s−1 for 21 days. Amperometric analysis at the defined time intervals of each SPE recorded in a 200 µL volume of measuring buffer showed that detectable loss of the photosynthetic activity occurred after 21 days (Figure 7C). Working stability was assessed by amperometric measurements run on the algal/CB-SPEs up to 12 h at room temperature, under repeated cycles of 10 min dark and 30 s light of red LEDs, showing 100% intra-electrode repeatability of light-induced oxygen evolution activity. Moreover, the preparation of the algal/CB-SPEs showed a high inter-electrode repeatability with RSD of 1.1% (n = 12) (data not shown).

4. Discussion and Conclusions

In this work, a cytosensor based on microalgae has been developed for the detection of E. coli presence in water outputs from wastewater treatment plants. The system, constituted of C. reinhardtii whole cells immobilized on the carbon black-modified working electrode of SPEs, detects the oxygen produced by the microalgae during the photosynthetic cycle when a potential of −0.6 V is applied in a chronoamperometry measurement. It has been demonstrated [24] that the presence of bacteria strains in growing microalgae solutions promote oxygen production, with the promotion effect not dependent by the specific bacteria strain. This phenomenon has been used in this case to develop a biosensor capable of quickly determining the presence of bacteria in water downstream from wastewater treatment plants. In particular, the assembled system can detect the presence of E. coli down to a LOD of 92 CFU/100 mL in real wastewater, with a linear response obtained in the range 100 to 2000 CFU/100 mL, after only 15 min of incubation time. The values found are in line with those obtained in similar works in the literature [27,28,29,30,31,32]. It should be underlined that this bacterium was exploited as a case study target of the algal cytosensor to demonstrate its ability as an early warning analytical system to signal heavy loads of pathogens in waters leaving the wastewater treatment plants. Indeed, the cytosensor is not selective towards E. coli but it is capable to sense all the bacteria that induce the algae oxygen evolution by exploiting the effect of their interaction. On the contrary, the cytosensor shows the advantages of not being affected from other pollutants commonly present in wastewaters and, in addition, any pretreatment of the sample is required before the analysis, resulting in an easy integration for on-line microorganism monitoring.

Author Contributions

Conceptualization, V.S. and F.A.; methodology, V.S., A.A. (Amina Antonacci) and R.A.; prototyping, M.T.G.; writing—original draft preparation, V.S., A.A. (Amina Antonacci) and M.T.G.; writing—review and editing, A.A. (Aziz Amine) and F.A.; funding acquisition, V.S. All authors have read and agreed to the published version of the manuscript.

Funding

This research was funded by the Interreg Italy-Croatia Project AdSWiM and the EraNetMed-RQ3-2016 Project NanoSWS.

Institutional Review Board Statement

Not applicable.

Informed Consent Statement

Not applicable.

Data Availability Statement

Not applicable.

Acknowledgments

This work was supported by the Interreg Italy-Croatia Project AdSWiM and by the EraNetMed-RQ3-2016 Project NanoSWS.

Conflicts of Interest

The authors declare no conflict of interest.

References

  1. Inyinbor Adejumoke, A.; Adebesin Babatunde, O.; Oluyori Abimbola, P.; Adelani Akande Tabitha, A.; Dada Adewumi, O.; Oreofe Toyin, A. Water pollution: Effects, prevention, and climatic impact. Water Chall. Urban. World 2018, 33, 33–47. [Google Scholar]
  2. Directive 2006/118/EC of the European Parliament and of the Council of 12 December 2006 on the Protection of Groundwater Against Pollution and Deterioration. 2006. Available online: http://data.europa.eu/eli/dir/2006/118/oj/eng (accessed on 7 November 2021).
  3. Umar, M.F.; Nasar, A. Reduced graphene oxide/polypyrrole/nitrate reductase deposited glassy carbon electrode (GCE/RGO/PPy/NR): Biosensor for the detection of nitrate in wastewater. Appl. Water Sci. 2018, 8, 211. [Google Scholar] [CrossRef] [Green Version]
  4. Campaña, A.L.; Florez, S.L.; Noguera, M.J.; Fuentes, O.P.; Puentes, P.R.; Cruz, J.C.; Osma, J.F. Enzyme-Based Electrochemical Biosensors for Microfluidic Platforms to Detect Pharmaceutical Residues in Wastewater. Biosensors 2019, 9, 41. [Google Scholar] [CrossRef] [PubMed] [Green Version]
  5. Guo, F.; Liu, H. Impact of heterotrophic denitrification on BOD detection of the nitrate-containing wastewater using microbial fuel cell-based biosensors. Chem. Eng. J. 2020, 394, 125042. [Google Scholar] [CrossRef]
  6. Schirmer, C.; Posseckardt, J.; Schröder, M.; Gläser, M.; Howitz, S.; Scharff, W.; Mertig, M. Portable and low-cost biosensor towards on-site detection of diclofenac in wastewater. Talanta 2019, 203, 242–247. [Google Scholar] [CrossRef] [PubMed]
  7. Yashas, S.R.; Sandeep, S.; Shivakumar, B.P.; Swamy, N.K. A matrix of perovskite micro-seeds and polypyrrole nanotubes tethered laccase/graphite biosensor for sensitive quantification of 2,4-dichlorophenol in wastewater. Anal. Methods 2019, 11, 4511–4519. [Google Scholar] [CrossRef]
  8. Cui, L.; Li, H.-Z.; Yang, K.; Zhu, L.-J.; Xu, F.; Zhu, Y.-G. Raman biosensor and molecular tools for integrated monitoring of pathogens and antimicrobial resistance in wastewater. TrAC Trends Anal. Chem. 2021, 143, 116415. [Google Scholar] [CrossRef]
  9. Mao, K.; Zhang, H.; Yang, Z. An integrated biosensor system with mobile health and wastewater-based epidemiology (iBMW) for COVID-19 pandemic. Biosens. Bioelectron. 2020, 169, 112617. [Google Scholar] [CrossRef]
  10. Gao, G.; Fang, D.; Yu, Y.; Wu, L.; Wang, Y.; Zhi, J. A double-mediator based whole cell electrochemical biosensor for acute biotoxicity assessment of wastewater. Talanta 2017, 167, 208–216. [Google Scholar] [CrossRef] [PubMed]
  11. Antonacci, A.; Scognamiglio, V. Biotechnological Advances in the Design of Algae-Based Biosensors. Trends Biotechnol. 2020, 38, 334–347. [Google Scholar] [CrossRef] [PubMed]
  12. Antonacci, A.; Attaallah, R.; Arduini, F.; Amine, A.; Giardi, M.T.; Scognamiglio, V. A dual electro-optical biosensor based on Chlamydomonas reinhardtii immobilised on paper-based nanomodified screen-printed electrodes for herbicide monitoring. J. Nanobiotechnol. 2021, 19, 145. [Google Scholar] [CrossRef] [PubMed]
  13. Scognamiglio, V.; Antonacci, A.; Arduini, F.; Moscone, D.; Campos, E.V.; Fraceto, L.F.; Palleschi, G. An eco-designed paper-based algal biosensor for nanoformulated herbicide optical detection. J. Hazard. Mater. 2019, 373, 483–492. [Google Scholar] [CrossRef] [PubMed]
  14. Attaallah, R.; Antonacci, A.; Mazzaracchio, V.; Moscone, D.; Palleschi, G.; Arduini, F.; Amine, A.; Scognamiglio, V. Carbon black nanoparticles to sense algae oxygen evolution for herbicides detection: Atrazine as a case study. Biosens. Bioelectron. 2020, 159, 112203. [Google Scholar] [CrossRef] [PubMed]
  15. Scognamiglio, V.; Pezzotti, I.; Pezzotti, G.; Cano, J.; Manfredonia, I.; Buonasera, K.; Rodio, G.; Giardi, M.T. A new embedded biosensor platform based on micro-electrodes array (MEA) technology. Sensors Actuators B Chem. 2013, 176, 275–283. [Google Scholar] [CrossRef]
  16. Scognamiglio, V.; Pezzotti, I.; Pezzotti, G.; Cano, J.; Manfredonia, I.; Buonasera, K.; Arduini, F.; Moscone, D.; Palleschi, G.; Giardi, M.T. Towards an integrated biosensor array for simultaneous and rapid multi-analysis of endocrine disrupting chemicals. Anal. Chim. Acta 2012, 751, 161–170. [Google Scholar] [CrossRef]
  17. Antonacci, A.; Lambreva, M.D.; Arduini, F.; Moscone, D.; Palleschi, G.; Scognamiglio, V. A whole cell optical bioassay for the detection of chemical warfare mustard agent simulants. Sens. Actuators B Chem. 2018, 257, 658–665. [Google Scholar] [CrossRef]
  18. Regulation (EC) No 470/2009 of the European Parliament and of the Council of 6 May 2009 Laying Down Community Procedures for the Establishment of Residue Limits of Pharmacologically Active Substances in Foodstuffs of Animal Origin, Repealing Council Regulation (EEC) No 2377/90 and Amending Directive 2001/82/EC of the European Parliament and of the Council and Regulation (EC) No 726/2004 of the European Parliament and of the Council (Text with EEA Relevance). 2009. Available online: http://data.europa.eu/eli/reg/2009/470/oj/eng (accessed on 7 November 2021).
  19. Commission Decision (EU) 2018/229 of 12 February 2018 Establishing, Pursuant to Directive 2000/60/EC of the European Parliament and of the Council, the Values of the Member State Monitoring System Classifications as a Result of the Intercalibration Exercise and Repealing Commission Decision 2013/480/EU (Notified under Document C(2018) 696)Text with EEA Relevance. 2018. Available online: http://data.europa.eu/eli/dec/2018/229/oj/eng (accessed on 7 November 2021).
  20. Commission Directive 2009/90/EC of 31 July 2009 Laying Down, Pursuant to Directive 2000/60/EC of the European Parliament and of the Council, Technical Specifications for Chemical Analysis and Monitoring of Water Status (Text with EEA Relevance). 2009. Available online: http://data.europa.eu/eli/dir/2009/90/oj/eng (accessed on 7 November 2021).
  21. Council Directive 91/271/EEC of 21 May 1991 Concerning Urban Waste-Water Treatment. 1991. Available online: https://eur-lex.europa.eu/legal-content/EN/TXT/?uri=CELEX:31991L0271 (accessed on 3 December 2019).
  22. Chirac, C.; Casadevall, E.; Largeau, C.; Metzger, P. Bacterial Influence upon Growth and Hydrocarbon Production of the Green Alga Botryococcus Braunii 1. J. Phycol. 1985, 21, 380–387. [Google Scholar] [CrossRef]
  23. Jones, J.G. Studies on Freshwater Bacteria: Association with Algae and Alkaline Phosphatase Activity. J. Ecol. 1972, 60, 59. [Google Scholar] [CrossRef]
  24. Mouget, J.-L.; Dakhama, A.; Lavoie, M.C.; De La Noüe, J. Algal growth enhancement by bacteria: Is consumption of photosynthetic oxygen involved? FEMS Microbiol. Ecol. 1995, 18, 35–43. [Google Scholar] [CrossRef]
  25. DECRETO LEGISLATIVO 3 Aprile 2006, n. 152. 2006. Available online: https://www.gazzettaufficiale.it/dettaglio/codici/materiaAmbientale (accessed on 9 November 2021).
  26. Directive 2013/39/EU of the European Parliament and of the Council of 12 August 2013 Amending Directives 2000/60/EC and 2008/105/EC as Regards Priority Substances in the Field of Water Policy. 2013. Available online: https://eur-lex.europa.eu/LexUriServ/LexUriServ.do?uri=OJ:L:2013:226:0001:0017:EN:PDF (accessed on 9 June 2022).
  27. Hassan, A.-R.H.A.-A.; de la Escosura-Muñiz, A.; Merkoçi, A. Highly sensitive and rapid determination of Escherichia coli O157:H7 in minced beef and water using electrocatalytic gold nanoparticle tags. Biosens. Bioelectron. 2015, 67, 511–515. [Google Scholar] [CrossRef]
  28. Radke, S.M.; Alocilja, E.C. A high density microelectrode array biosensor for detection of E. coli O157:H7. Biosens. Bioelectron. 2005, 20, 1662–1667. [Google Scholar] [CrossRef] [PubMed]
  29. Zheng, L.; Cai, G.; Wang, S.; Liao, M.; Li, Y.; Lin, J. A microfluidic colorimetric biosensor for rapid detection of Escherichia coli O157:H7 using gold nanoparticle aggregation and smart phone imaging. Biosens. Bioelectron. 2019, 124–125, 143–149. [Google Scholar] [CrossRef]
  30. Lamanna, L.; Rizzi, F.; Bhethanabotla, V.R.; De Vittorio, M. Conformable surface acoustic wave biosensor for E-coli fabricated on PEN plastic film. Biosens. Bioelectron. 2020, 163, 112164. [Google Scholar] [CrossRef] [PubMed]
  31. Lin, D.; Pillai, R.G.; Lee, W.E.; Jemere, A.B. An impedimetric biosensor for E. coli O157:H7 based on the use of self-assembled gold nanoparticles and protein G. Mikrochim. Acta 2019, 186, 169. [Google Scholar] [CrossRef] [PubMed]
  32. Díaz-Amaya, S.; Lin, L.-K.; Deering, A.J.; Stanciu, L.A. Aptamer-based SERS biosensor for whole cell analytical detection of E. coli O157:H7. Anal. Chim. Acta 2019, 1081, 146–156. [Google Scholar] [CrossRef] [PubMed]
Figure 1. (A) Algal cytosensor prototype equipped with six measurement cells, fluidics, and the opto-electrochemical set-up, (B) Screen-printed electrode ready for the insertion into the measurement cell. Dimensions of the instrument: L28.5 × I19 × H10 cm.
Biosensors 12 00401 g001
Figure 2. C. reinhardtii physiological characterization. Cell culture growth reported as absorbance at 750 nm (A) and cell number/mL (B). (C) Chlorophyll content. (D) Maximum fluorescence yield FV/FM calculated on each Kautsky curve. Incubation time: 9 days under continuous light (50 µL photons m−2 s−1). Average values ± SE (n = 3).
Biosensors 12 00401 g002
Figure 3. Optical microscopy images of algae cells grown in control medium and wastewater samples from depuration plants in Lignano, San Giorgio, and Pescara (Italy).
Biosensors 12 00401 g003
Figure 4. (A) SEM microphotographs of CB modified SPEs (left) and CB modified SPEs functionalized with algae whole cells entrapped into the calcium/alginate matrix (right). (B) Scheme of the obtained cytosensor for pathogen detection in wastewater. (B) Scheme of the proposed algal/CB-SPE cytosensor.
Biosensors 12 00401 g004
Figure 5. (A) Current intensity vs. applied potential. (B) Current intensity vs. immobilized cell number. (C) Current intensity vs. light intensity.
Biosensors 12 00401 g005
Figure 6. (A) Incubation time, (B) algal CB-SPEs amperogram after the addition of an increasing amount of E. coli, and (C) the corresponding calibration plot.
Biosensors 12 00401 g006
Figure 7. (A) Interference analysis using 10 ppb arsenic, 1.3 ppb copper, 5 ppb cadmium, 10 ppb lead, 10 ppb bisphenol A, and 1 ppb paraoxon, and a solution spiked with all the compounds. (B) Matrix effect using Lignano, San Giorgio, and Pescara wastewater samples. (C) Storage stability expressed as light-induced oxygen evolution.
Biosensors 12 00401 g007
Publisher’s Note: MDPI stays neutral with regard to jurisdictional claims in published maps and institutional affiliations.

