A Single Wavelength Mid-Infrared Photoacoustic Spectroscopy for Noninvasive Glucose Detection Using Machine Learning


Abstract
:1. Introduction
2. Materials and Methods
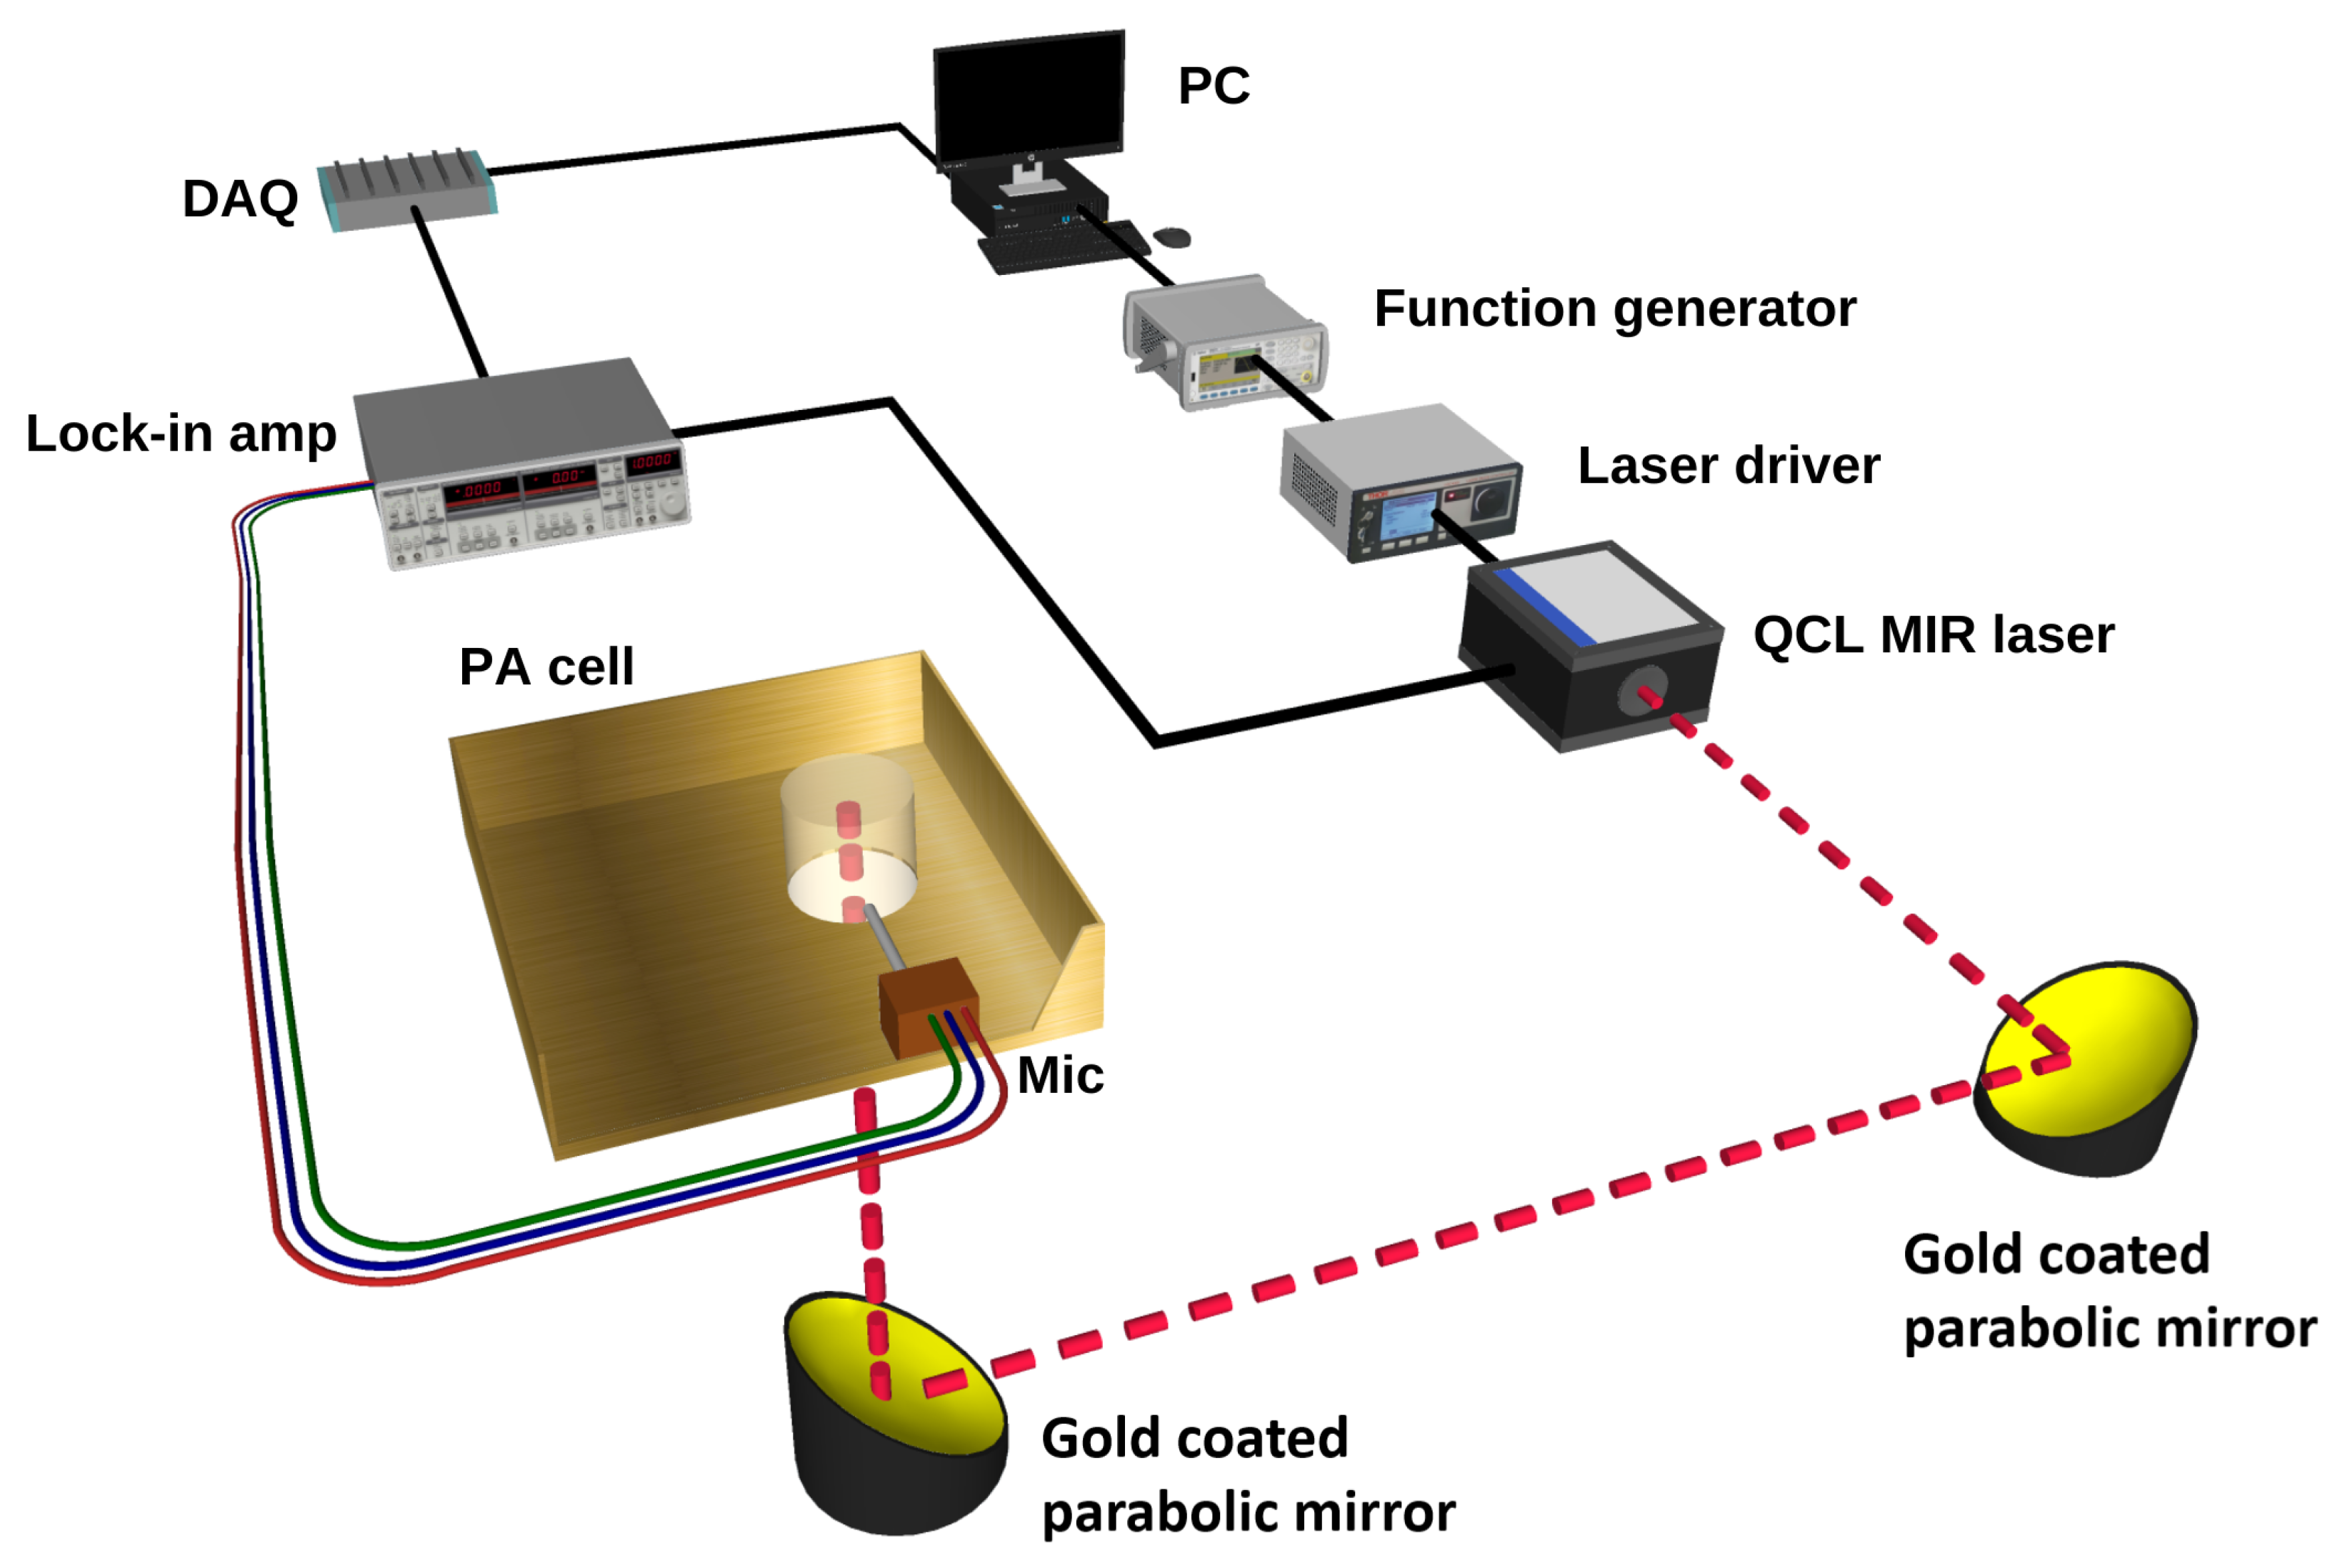
2.1. Experimental Setup
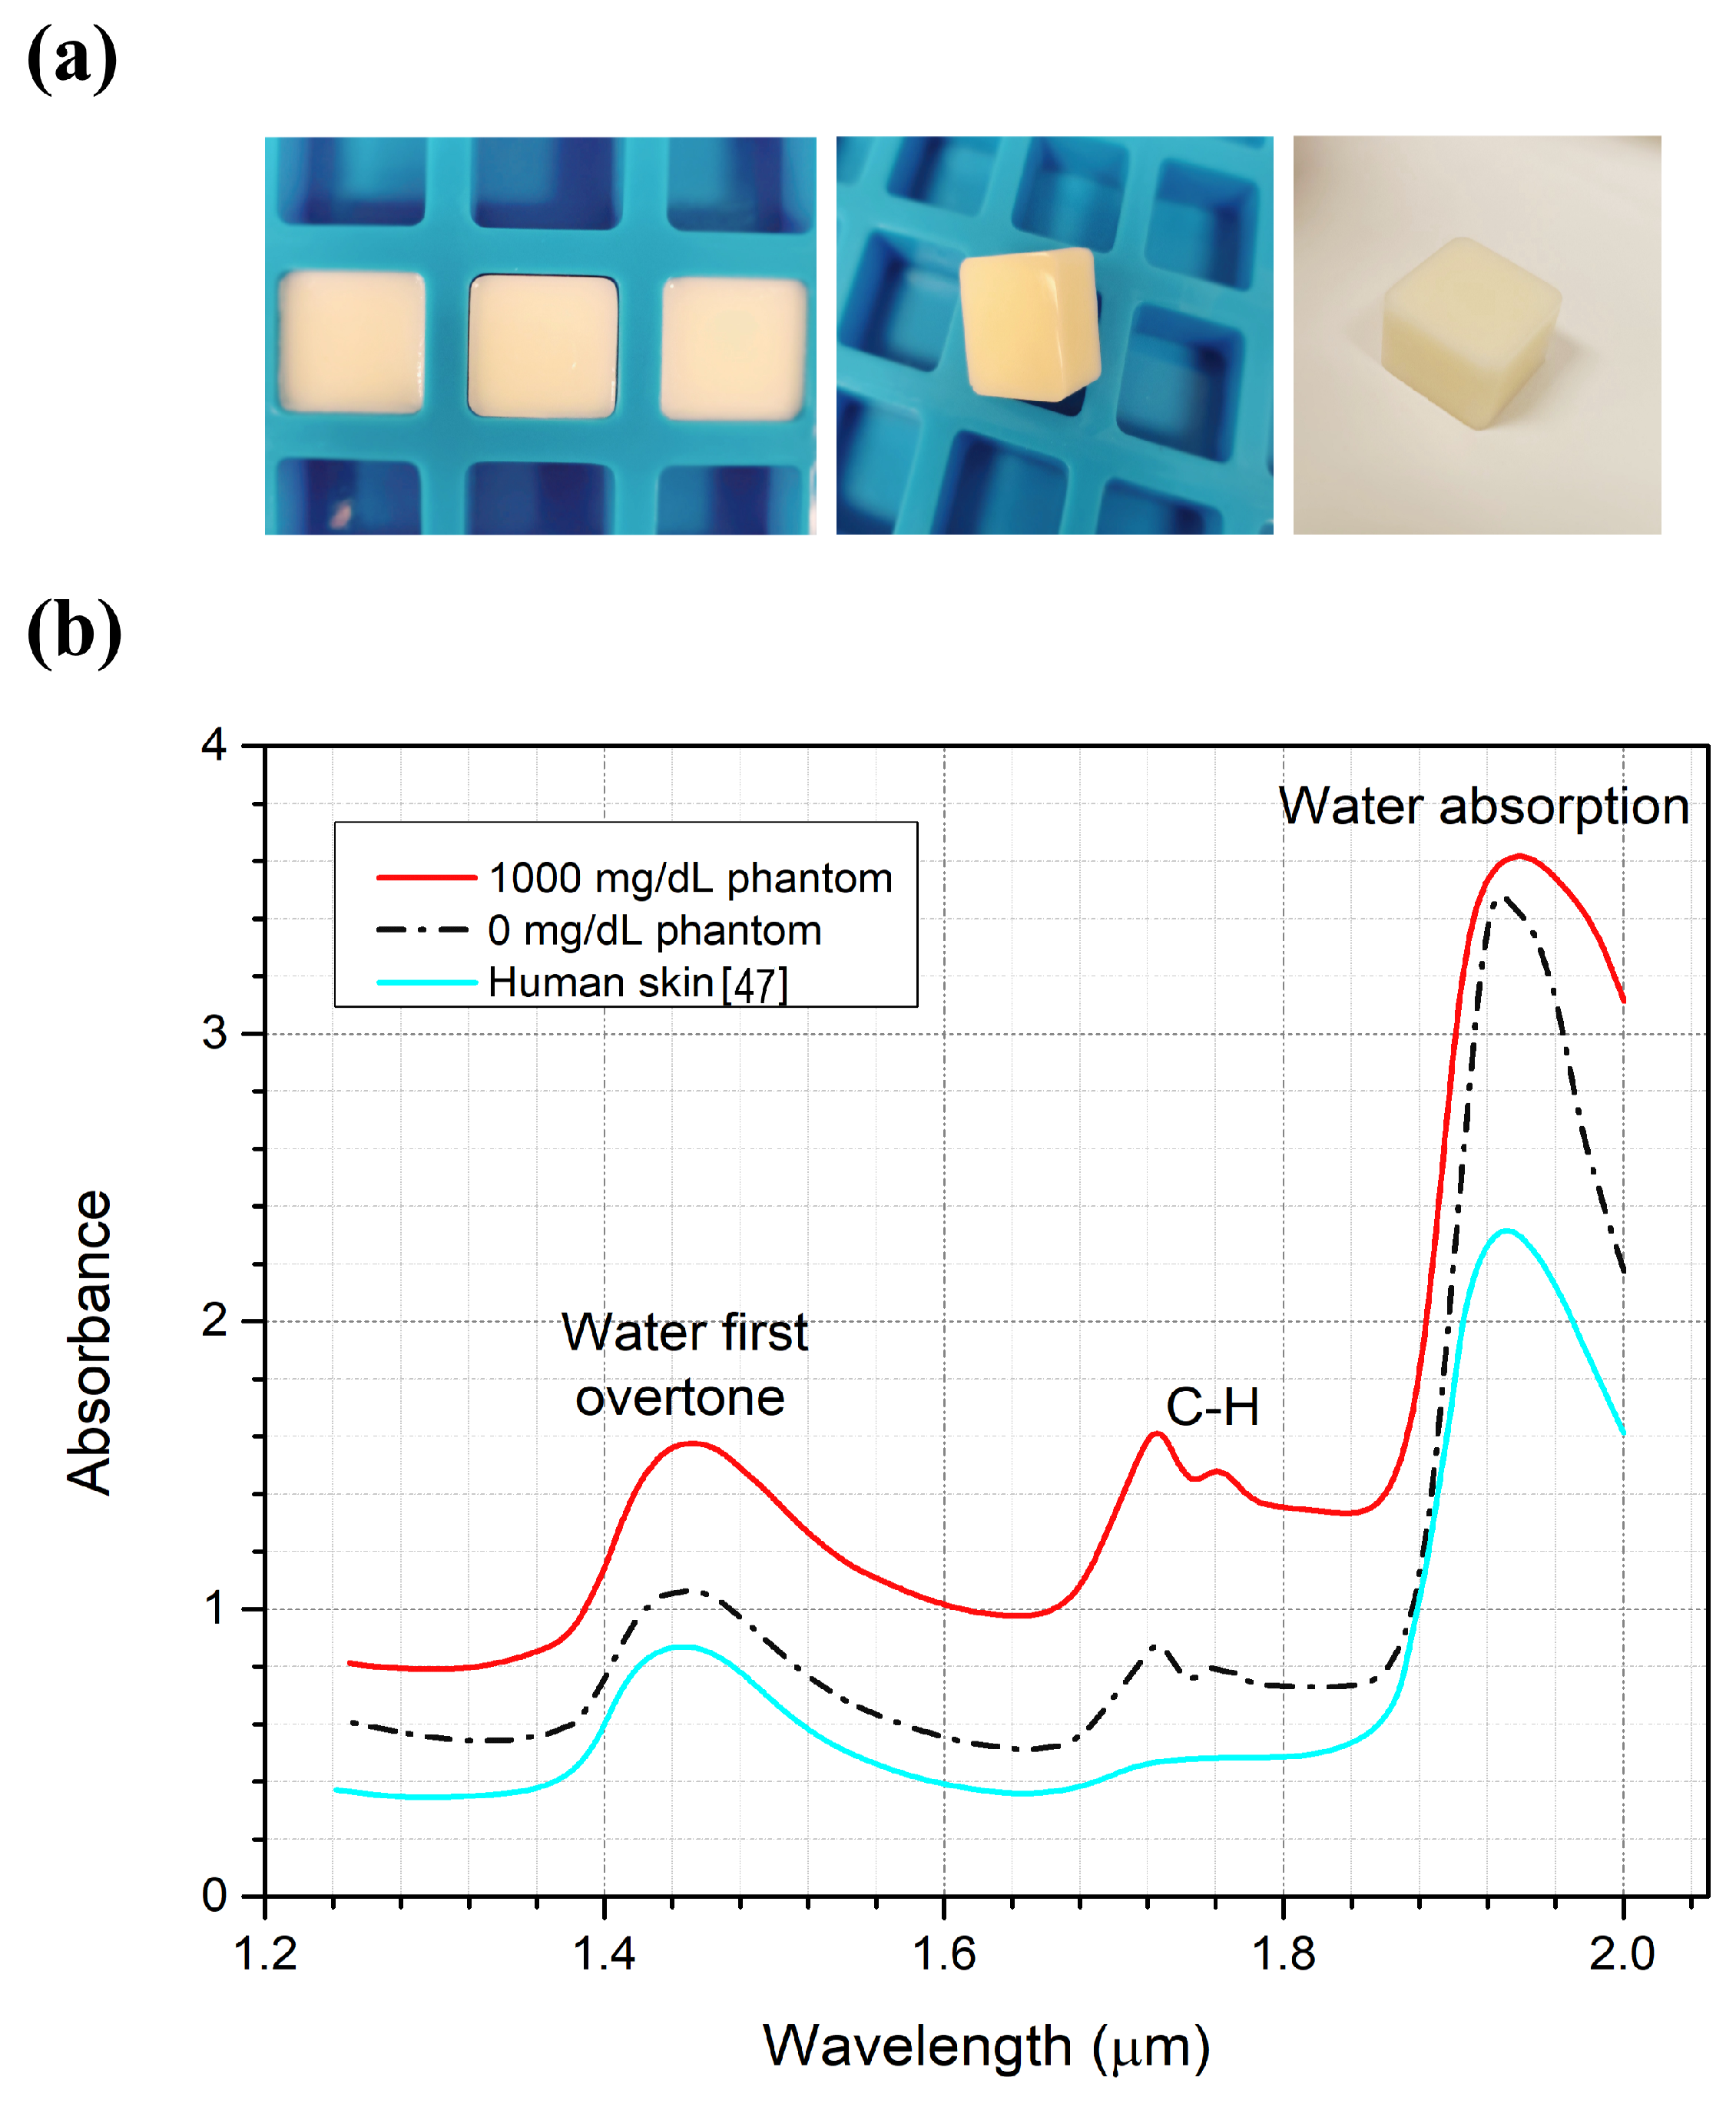
2.2. Skin Sample Preparation
2.3. Glucose Measurements
2.4. Machine Learning Techniques for Glucose Detection
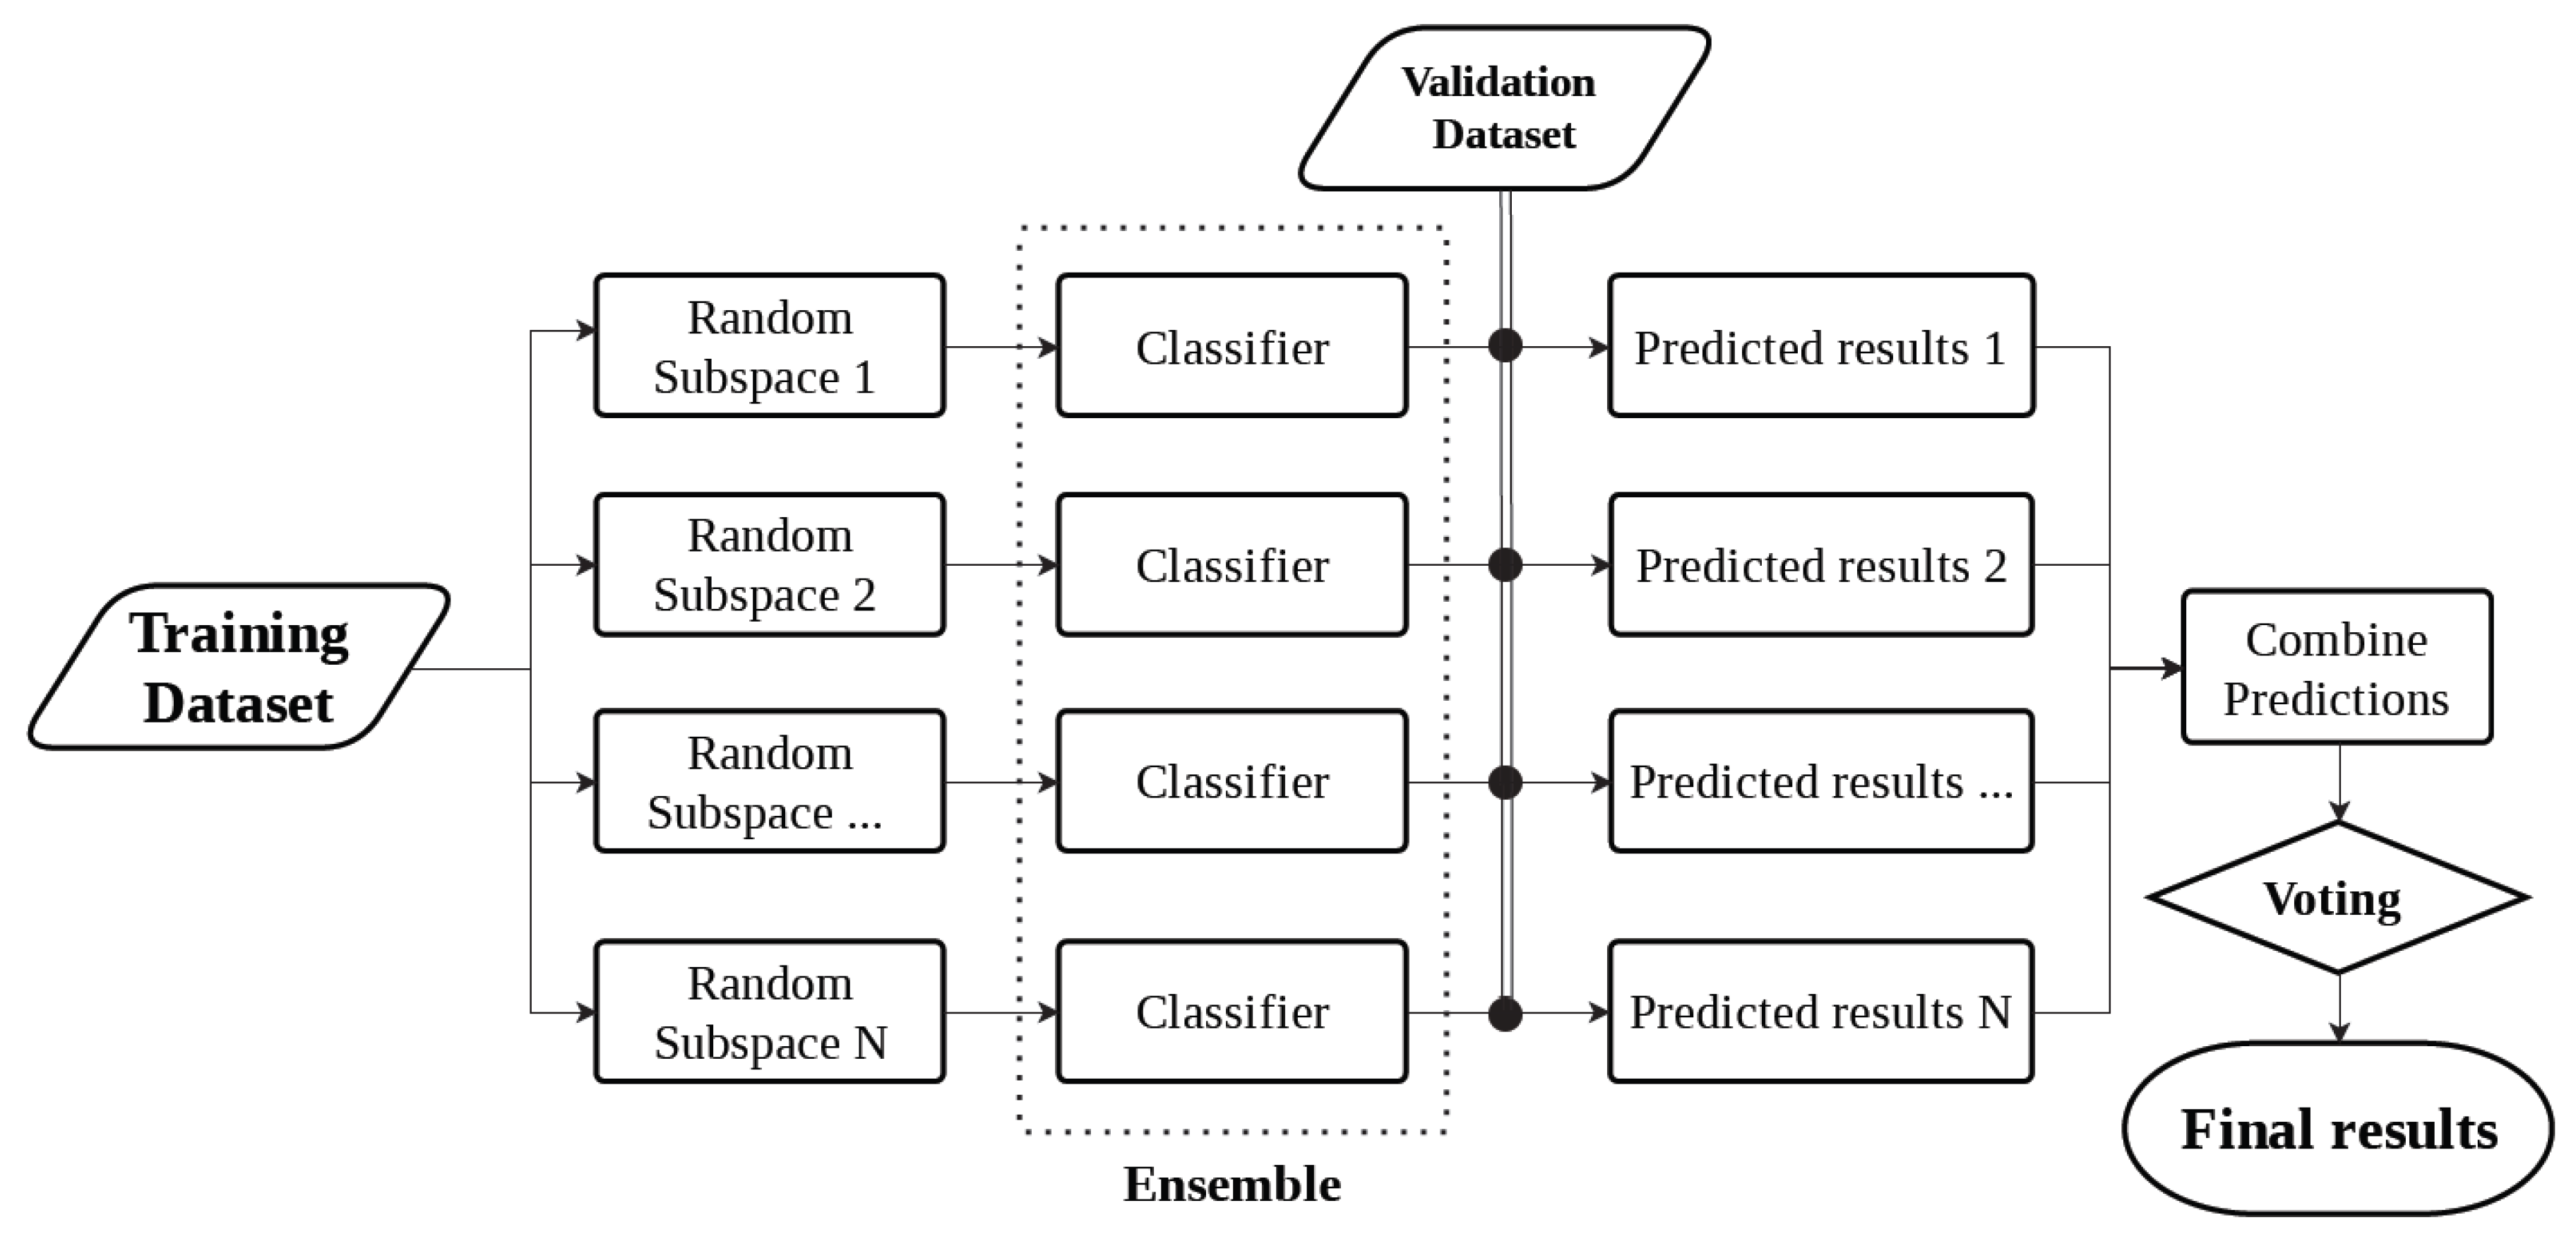
Ensemble Classification Model
3. Results and Discussion
3.1. Optical Properties for the Artificial Skin Phantoms
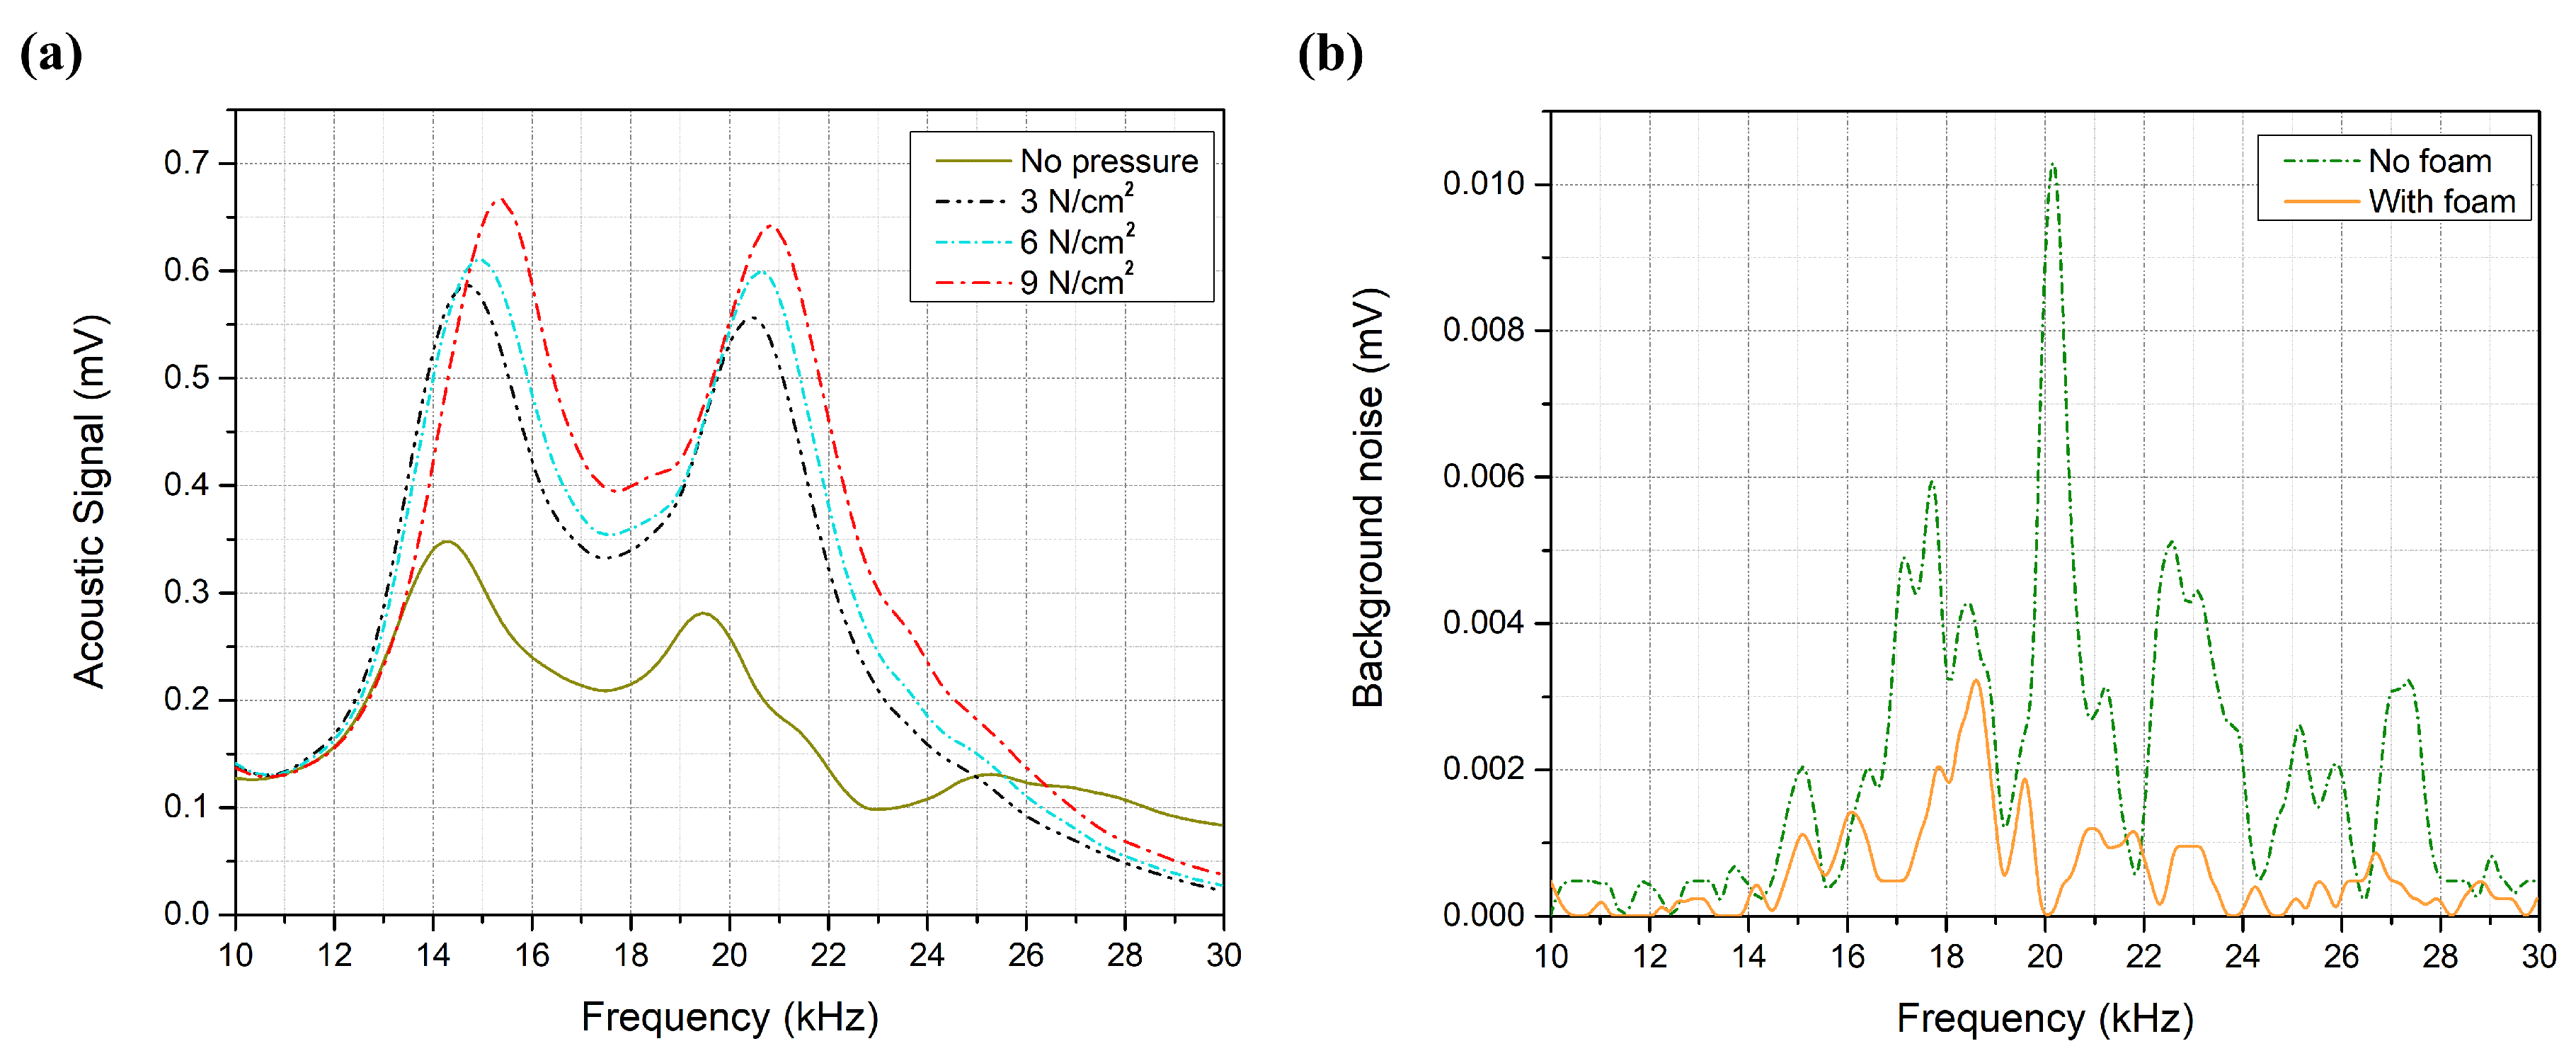
3.2. System Optimization
3.3. Glucose Detection
3.4. Glucose Detection Using Machine Learning
Dataset Preprocessing for ML
4. Conclusions
Author Contributions
Funding
Acknowledgments
Conflicts of Interest
References
- International Diabetes Federation. Available online: https://www.idf.org/ (accessed on 10 December 2021).
- Walker, H.K.; Hall, W.D.; Hurst, J.W. Peripheral Blood Smear—Clinical Methods: The History, Physical, and Laboratory Examinations; Butterworths: Boston, MA, USA, 1990. [Google Scholar]
- Park, J.; Kim, J.; Kim, S.Y.; Cheong, W.H.; Jang, J.; Park, Y.G.; Na, K.; Kim, Y.T.; Heo, J.H.; Lee, C.Y.; et al. Soft, smart contact lenses with integrations of wireless circuits, glucose sensors, and displays. Sci. Adv. 2018, 4, eaap9841. [Google Scholar] [CrossRef] [Green Version]
- La Belle, J.T.; Adams, A.; Lin, C.E.; Engelschall, E.; Pratt, B.; Cook, C.B. Self-monitoring of tear glucose: The development of a tear based glucose sensor as an alternative to self-monitoring of blood glucose. Chem. Commun. 2016, 52, 9197–9204. [Google Scholar] [CrossRef] [PubMed]
- Shanbhag, V.K.L.; Prasad, K. Graphene based sensors in the detection of glucose in saliva—A promising emerging modality to diagnose diabetes mellitus. Anal. Methods 2016, 8, 6255–6259. [Google Scholar] [CrossRef]
- Srinivasan, V.; Pamula, V.K.; Fair, R.B. An integrated digital microfluidic lab-on-a-chip for clinical diagnostics on human physiological fluids. Lab Chip 2004, 4, 310–315. [Google Scholar] [CrossRef] [PubMed]
- Steil, G.; Rebrin, K.; Hariri, F.; Jinagonda, S.; Tadros, S.; Darwin, C.; Saad, M. Interstitial fluid glucose dynamics during insulin-induced hypoglycaemia. Diabetologia 2005, 48, 1833–1840. [Google Scholar] [CrossRef] [Green Version]
- Tortora, G.J.; Derrickson, B.H. Principles of Anatomy and Physiology; John Wiley & Sons: Hoboken, NJ, USA, 2018. [Google Scholar]
- Thennadil, S.N.; Rennert, J.L.; Wenzel, B.J.; Hazen, K.H.; Ruchti, T.L.; Block, M.B. Comparison of glucose concentration in interstitial fluid, and capillary and venous blood during rapid changes in blood glucose levels. Diabetes Technol. Ther. 2001, 3, 357–365. [Google Scholar] [CrossRef] [Green Version]
- Pandey, R.; Paidi, S.K.; Valdez, T.A.; Zhang, C.; Spegazzini, N.; Dasari, R.R.; Barman, I. Noninvasive monitoring of blood glucose with raman spectroscopy. Acc Chem. Res. 2017, 50, 264–272. [Google Scholar] [CrossRef] [Green Version]
- Rachim, V.P.; Chung, W.Y. Wearable-band type visible-near infrared optical biosensor for non-invasive blood glucose monitoring. Sensors Actuators Chem. 2019, 286, 173–180. [Google Scholar] [CrossRef]
- Maruo, K.; Tsurugi, M.; Chin, J.; Ota, T.; Arimoto, H.; Yamada, Y.; Tamura, M.; Ishii, M.; Ozaki, Y. Noninvasive blood glucose assay using a newly developed near-infrared system. IEEE J. Sel. Top. Quantum Electron. 2003, 9, 322–330. [Google Scholar] [CrossRef]
- Esenaliev, R.O.; Larin, K.V.; Larina, I.V.; Motamedi, M. Noninvasive monitoring of glucose concentration with optical coherence tomography. Opt. Lett. 2001, 26, 992–994. [Google Scholar] [CrossRef]
- Kuranov, R.V.; Sapozhnikova, V.V.; Prough, D.S.; Cicenaite, I.; Esenaliev, R.O. Prediction Capability of Optical Coherence Tomography for Blood Glucose Concentration Monitoring; SAGE Publications: Thousand Oaks, CA, USA, 2007; pp. 470–477. [Google Scholar]
- Amaral, C.; Wolf, B. Effects of glucose in blood and skin impedance spectroscopy. In Proceedings of the AFRICON 2007, Windhoek, South Africa, 26–28 September 2007; pp. 1–7. [Google Scholar]
- Ollmar, S.; Nicander, I.; Åberg, P.; Bolinder, J. Facts and artefacts regarding correlation between skin electrical impedance spectroscopy (EIS) and blood glucose. J. Phys. 2013, 434, 012071. [Google Scholar] [CrossRef] [Green Version]
- Rassel, S.; Xu, C.; Zhang, S.; Ban, D. Noninvasive blood glucose detection using a quantum cascade laser. Analyst 2020, 145, 2441–2456. [Google Scholar] [CrossRef] [PubMed]
- Sanchez, P.; Ghosh-Dastidar, S.; Tweden, K.S.; Kaufman, F.R. Real-world data from the first US commercial Users of an implantable continuous glucose sensor. Diabetes Technol. Ther. 2019, 21, 677–681. [Google Scholar] [CrossRef] [PubMed]
- Rosencwaig, A.; Gersho, A. Theory of the photoacoustic effect with solids. J. Appl. Phys. 1976, 47, 64–69. [Google Scholar] [CrossRef]
- Von Lilienfeld-Toal, H.; Weidenmüller, M.; Xhelaj, A.; Mäntele, W. A novel approach to non-invasive glucose measurement by mid-infrared spectroscopy: The combination of quantum cascade lasers (QCL) and photoacoustic detection. Vib. Spectrosc. 2005, 38, 209–215. [Google Scholar] [CrossRef]
- Kottmann, J.; Rey, J.M.; Luginbühl, J.; Reichmann, E.; Sigrist, M.W. Glucose sensing in human epidermis using mid-infrared photoacoustic detection. Biomed. Opt. Express 2012, 3, 667–680. [Google Scholar] [CrossRef] [Green Version]
- Spegazzini, N.; Barman, I.; Dingari, N.C.; Pandey, R.; Soares, J.S.; Ozaki, Y.; Dasari, R.R. Spectroscopic approach for dynamic bioanalyte tracking with minimal concentration information. Sci. Rep. 2014, 4, 7013. [Google Scholar] [CrossRef]
- Pratywi, C.; Marantika, S.; Dwijananti, P. Characterization of starch degradation during simple heating for bioethanol production from the avocado seed. Mater. Sci. Eng. Conf. Ser. 2018, 432, 012042. [Google Scholar] [CrossRef] [Green Version]
- Kottmann, J.; Grob, U.; Rey, J.M.; Sigrist, M.W. Mid-infrared fiber-coupled photoacoustic sensor for biomedical applications. Sensors 2013, 13, 535–549. [Google Scholar] [CrossRef]
- Pleitez, M.; Von Lilienfeld-Toal, H.; Mäntele, W. Infrared spectroscopic analysis of human interstitial fluid in vitro and in vivo using FT-IR spectroscopy and pulsed quantum cascade lasers (QCL): Establishing a new approach to non invasive glucose measurement. Spectrochim. Acta Part A Mol. Biomol. Spectrosc. 2012, 85, 61–65. [Google Scholar] [CrossRef]
- Kottmann, J.; Rey, J.M.; Sigrist, M.W. Mid-Infrared photoacoustic detection of glucose in human skin: Towards non-invasive diagnostics. Sensors 2016, 16, 1663. [Google Scholar] [CrossRef] [PubMed] [Green Version]
- Pleitez, M.A.; Lieblein, T.; Bauer, A.; Hertzberg, O.; Von Lilienfeld-Toal, H.; Mantele, W. In vivo noninvasive monitoring of glucose concentration in human epidermis by mid-infrared pulsed photoacoustic spectroscopy. Anal. Chem. 2013, 85, 1013–1020. [Google Scholar] [CrossRef] [PubMed]
- Sim, J.Y.; Ahn, C.G.; Jeong, E.J.; Kim, B.K. In vivo microscopic photoacoustic spectroscopy for non-invasive glucose monitoring invulnerable to skin secretion products. Sci. Rep. 2018, 8, 1059. [Google Scholar] [CrossRef] [Green Version]
- Holthoff, E.L.; Heaps, D.A.; Pellegrino, P.M. Development of a MEMS-scale photoacoustic chemical sensor using a quantum cascade laser. IEEE Sens. J. 2010, 10, 572–577. [Google Scholar] [CrossRef]
- Beard, P. Biomedical photoacoustic imaging. Interface Focus 2011, 1, 602–631. [Google Scholar] [CrossRef] [PubMed]
- Repenko, T.; Fokong, S.; De Laporte, L.; Go, D.; Kiessling, F.; Lammers, T.; Kuehne, A.J. Water-soluble dopamine-based polymers for photoacoustic imaging. Chem. Commun. 2015, 51, 6084–6087. [Google Scholar] [CrossRef] [PubMed] [Green Version]
- Xu, C.; Rassel, S.; Zhang, S.; Aloraynan, A.; Ban, D. Single-wavelength water muted photoacoustic system for detecting physiological concentrations of endogenous molecules. Biomed. Opt. Express 2021, 12, 666–675. [Google Scholar] [CrossRef]
- COMSOL Multiphysics® Software; Version 5.3a; COMSOL AB: Stockholm, Sweden, 2018.
- Lazebnik, M.; Madsen, E.L.; Frank, G.R.; Hagness, S.C. Tissue-mimicking phantom materials for narrowband and ultrawideband microwave applications. Phys. Med. Biol. 2005, 50, 4245. [Google Scholar] [CrossRef]
- U.S. Food & Drug Administration (FDA). Blood Glucose Monitoring Devices; FDA: Washington, DC, USA, 2019.
- Bauer, A.; Hertzberg, O.; Küderle, A.; Strobel, D.; Pleitez, M.A.; Mäntele, W. IR-spectroscopy of skin in vivo: Optimal skin sites and properties for non-invasive glucose measurement by photoacoustic and photothermal spectroscopy. J. Biophotonics 2018, 11, e201600261. [Google Scholar] [CrossRef]
- Kasahara, R.; Kino, S.; Soyama, S.; Matsuura, Y. Noninvasive glucose monitoring using mid-infrared absorption spectroscopy based on a few wavenumbers. Biomed. Opt. Express 2018, 9, 289–302. [Google Scholar] [CrossRef] [Green Version]
- Yadav, J.; Rani, A.; Singh, V.; Mohan Murari, B. Investigations on multisensor-based noninvasive blood glucose measurement system. J. Med Devices 2017, 11, 031006. [Google Scholar] [CrossRef]
- Liu, T.; Ren, Z.; Zhang, C.; Liu, G. Combined effect of multiple factors on the photoacoustic detection of glucose solution based on neural networks. In Proceedings of the AOPC 2020: Optical Spectroscopy and Imaging; and Biomedical Optics, Beijing, China, 5 November 2020; Volume 11566, p. 115660. [Google Scholar]
- Zhu, Y. Automatic detection of anomalies in blood glucose using a machine learning approach. J. Commun. Netw. 2011, 13, 125–131. [Google Scholar] [CrossRef]
- Woldaregay, A.Z.; Årsand, E.; Botsis, T.; Albers, D.; Mamykina, L.; Hartvigsen, G. Data-driven blood glucose pattern classification and anomalies detection: Machine-learning applications in type 1 diabetes. J. Med. Internet Res. 2019, 21, e11030. [Google Scholar] [CrossRef] [PubMed] [Green Version]
- Carter, J.A.; Long, C.S.; Smith, B.P.; Smith, T.L.; Donati, G.L. Combining elemental analysis of toenails and machine learning techniques as a non-invasive diagnostic tool for the robust classification of type-2 diabetes. Expert Syst. Appl. 2019, 115, 245–255. [Google Scholar] [CrossRef]
- Jernelv, I.L.; Hjelme, D.R.; Matsuura, Y.; Aksnes, A. Convolutional neural networks for classification and regression analysis of one-dimensional spectral data. arXiv 2020, arXiv:2005.07530. [Google Scholar]
- Shokrekhodaei, M.; Cistola, D.P.; Roberts, R.C.; Quinones, S. Non-Invasive Glucose Monitoring Using Optical Sensor and Machine Learning Techniques for Diabetes Applications. IEEE Access 2021, 9, 73029–73045. [Google Scholar] [CrossRef]
- Ho, T.K. The random subspace method for constructing decision forests. IEEE Trans. Pattern Anal. Mach. Intell. 1998, 20, 832–844. [Google Scholar]
- Georga, E.I.; Fotiadis, D.I.; Tigas, S.K. Personalized Predictive Modeling in Type 1 Diabetes; Academic Press: Cambridge, MA, USA, 2017. [Google Scholar]
- Delbeck, S.; Vahlsing, T.; Leonhardt, S.; Steiner, G.; Heise, H.M. Non-invasive monitoring of blood glucose using optical methods for skin spectroscopy—Opportunities and recent advances. Anal. Bioanal. Chem. 2019, 411, 63–77. [Google Scholar] [CrossRef]


| Condition | Fasting mg/dL | Just Ate mg/dL | 3 h after Eating mg/dL |
|---|---|---|---|
| Normal | 80–100 | 170–200 | 120–140 |
| Pre-diabetic | 101–125 | 190–230 | 140–160 |
| Diabetic | 126 | 220–300 | >200 |
| Wavenumber | Component | Intensity |
|---|---|---|
| 1080 cm | D-glucose absorption | Medium |
| 1080 cm | v(PO2) symmetric | Medium |
| 1077 cm | v(CC) skeletal trans conformation | Medium |
| 1054 cm | D-glucose absorption | Very weak |
| 1052 cm | Albumin absorption | Weak |
| 1047 cm | v(C–OP) | Weak |
| 1035 cm | v(CC) skeletal cis conformation | Medium |
| 1034 cm | & D-glucose absorption | Medium |
| 1020 cm | Albumin absorption | Very weak |
| Date | Reference | Source | Wavenumber (cm) | Samples | G. conc. (mg/dL) | Correlation or Sensitivity | M.L. | Main Contributions |
|---|---|---|---|---|---|---|---|---|
| 2005 | Toal et al. [20] | QCL | P:1080 Bg:1066 | Forearm | 0–300 | R = 0.61 | No | The PA and MIR combination |
| 2012 | Kottmann et al. [21] | QCL | P:1034 | Epidermal samples | 0–2000 | mg/dL | No | Using tunable QCLs and N ventilation |
| 2012 | Pleitez et al. [25] | EC-QCL | P:1054&1084 Bg:1100 | Palm | 80–260 | R = 0.70 | R.O. | Selecting three wavelengths |
| 2013 | Kottmann et al. [24] | EC-QCL | P:1034 | Glucose solution | 0–5000 | mg/dL | No | Fiber optics for light delivering |
| 2013 | Pleitez et al. [27] | EC-QCL | 1000–1220 | Hypothenar | 40–240 | - | R.O. | Removing noise by multivariate models |
| 2016 | Kottmann et al. [26] | EC-QCL | P:1080 Bg:1180 | Fingertip & forearm | 90–170 | mg/dL | R.O. | Stability improved by increasing pulse rate |
| 2017 | Sim et al. [28] | EC-QCL | 950–1245 | Fingertip & palm | 100–250 | 30% | R.O. | Studying skin effect on measurement |
| Index | Sample No. | Glucose Level | Round 1 | Round 2 | … | Round 10 | Class Label |
|---|---|---|---|---|---|---|---|
| Day 1 | 1st sample | 75 mg/dL | 10–30 kHz | 10–30 kHz | … | 10–30 kHz | 75 |
| Day 2 | 2nd sample | 75 mg/dL | 10–30 kHz | 10–30 kHz | … | 10–30 kHz | 75 |
| Day 3 | 3rd sample | 75 mg/dL | 10–30 kHz | 10–30 kHz | … | 10–30 kHz | 75 |
| Day 1 | 1st sample | 100 mg/dL | 10–30 kHz | 10–30 kHz | … | 10–30 kHz | 100 |
| . | . | . | . | . | … | . | . |
| . | . | . | . | . | … | . | . |
| . | . | . | . | . | … | . | . |
| Day 3 | 3rd sample | 275 mg/dL | 10–30 kHz | 10–30 kHz | … | 10–30 kHz | 275 |
| Day 1 | 1st sample | 300 mg/dL | 10–30 kHz | 10–30 kHz | … | 10–30 kHz | 300 |
| Day 2 | 2nd sample | 300 mg/dL | 10–30 kHz | 10–30 kHz | … | 10–30 kHz | 300 |
| Day 3 | 3rd sample | 300 mg/dL | 10–30 kHz | 10–30 kHz | … | 10–30 kHz | 300 |
| Index | 10 kHz | 10.15 kHz | 10.30 kHz | … | 20.05 kHz | 2.20 kHz | … | 30 kHz | Class Label |
|---|---|---|---|---|---|---|---|---|---|
| Day 1 | round 1 | round 1 | round 1 | … | round 1 | round 1 | … | round 1 | 75 mg/dL |
| . | . | . | … | . | . | … | . | . | |
| . | . | . | … | . | . | … | . | . | |
| round 10 | round 10 | round 10 | … | round 10 | round 10 | … | round 10 | 75 mg/dL | |
| Day 1 | round 1 | round 1 | round 1 | … | round 1 | round 1 | … | round 1 | 100 mg/dL |
| . | . | . | … | . | . | … | . | . | |
| . | . | . | … | . | . | … | . | . | |
| round 10 | round 10 | round 10 | … | round 10 | round 10 | … | round 10 | 100 mg/dL | |
| . | . | . | . | … | . | . | … | . | . |
| . | . | . | . | … | . | . | … | . | . |
| . | . | . | . | … | . | . | … | . | . |
| Day 2 | round 1 | round 1 | round 1 | … | round 1 | round 1 | … | round 1 | 75 mg/dL |
| . | . | . | … | . | . | … | . | . | |
| . | . | . | … | . | . | … | . | . | |
| round 10 | round 10 | round 10 | … | round 10 | round 10 | … | round 10 | 75 mg/dL | |
| . | . | . | . | … | . | . | … | . | . |
| . | . | . | . | … | . | . | … | . | . |
| . | . | . | . | … | . | . | … | . | . |
| Day 3 | round 1 | round 1 | round 1 | … | round 1 | round 1 | … | round 1 | 300 mg/dL |
| . | . | . | … | . | . | … | . | . | |
| . | . | . | … | . | . | … | . | . | |
| round 10 | round 10 | round 10 | … | round 10 | round 10 | … | round 10 | 300 mg/dL |
| Glucose Concentration (mg/dL) | 75 | 100 | 125 | 150 | 175 | 200 | 225 | 250 | 275 | 300 |
|---|---|---|---|---|---|---|---|---|---|---|
| Standard Deviation |
Publisher’s Note: MDPI stays neutral with regard to jurisdictional claims in published maps and institutional affiliations. |
© 2022 by the authors. Licensee MDPI, Basel, Switzerland. This article is an open access article distributed under the terms and conditions of the Creative Commons Attribution (CC BY) license (https://creativecommons.org/licenses/by/4.0/).
Share and Cite
Aloraynan, A.; Rassel, S.; Xu, C.; Ban, D. A Single Wavelength Mid-Infrared Photoacoustic Spectroscopy for Noninvasive Glucose Detection Using Machine Learning. Biosensors 2022, 12, 166. https://doi.org/10.3390/bios12030166
Aloraynan A, Rassel S, Xu C, Ban D. A Single Wavelength Mid-Infrared Photoacoustic Spectroscopy for Noninvasive Glucose Detection Using Machine Learning. Biosensors. 2022; 12(3):166. https://doi.org/10.3390/bios12030166
Chicago/Turabian StyleAloraynan, Abdulrahman, Shazzad Rassel, Chao Xu, and Dayan Ban. 2022. "A Single Wavelength Mid-Infrared Photoacoustic Spectroscopy for Noninvasive Glucose Detection Using Machine Learning" Biosensors 12, no. 3: 166. https://doi.org/10.3390/bios12030166
APA StyleAloraynan, A., Rassel, S., Xu, C., & Ban, D. (2022). A Single Wavelength Mid-Infrared Photoacoustic Spectroscopy for Noninvasive Glucose Detection Using Machine Learning. Biosensors, 12(3), 166. https://doi.org/10.3390/bios12030166