Article

Motion Compensation for 3D Multispectral Handheld Photoacoustic Imaging

1
Department of Electrical Engineering, Pohang University of Science and Technology (POSTECH), Pohang 37673, Republic of Korea
2
Department of Mechanical Engineering, Pohang University of Science and Technology (POSTECH), Pohang 37673, Republic of Korea
3
LIG Nex1, Yongin-si 13488, Republic of Korea
4
Departments of Electrical Engineering, Convergence IT Engineering, and Mechanical Engineering, Medical Science and Engineering, Pohang University of Science and Technology (POSTECH), Pohang 37673, Republic of Korea
*
Author to whom correspondence should be addressed.
Biosensors 2022, 12(12), 1092; https://doi.org/10.3390/bios12121092
Submission received: 4 November 2022 / Revised: 26 November 2022 / Accepted: 28 November 2022 / Published: 29 November 2022

Abstract

:
Three-dimensional (3D) handheld photoacoustic (PA) and ultrasound (US) imaging performed using mechanical scanning are more useful than conventional 2D PA/US imaging for obtaining local volumetric information and reducing operator dependence. In particular, 3D multispectral PA imaging can capture vital functional information, such as hemoglobin concentrations and hemoglobin oxygen saturation (sO2), of epidermal, hemorrhagic, ischemic, and cancerous diseases. However, the accuracy of PA morphology and physiological parameters is hampered by motion artifacts during image acquisition. The aim of this paper is to apply appropriate correction to remove the effect of such motion artifacts. We propose a new motion compensation method that corrects PA images in both axial and lateral directions based on structural US information. 3D PA/US imaging experiments are performed on a tissue-mimicking phantom and a human wrist to verify the effects of the proposed motion compensation mechanism and the consequent spectral unmixing results. The structural motions and sO2 values are confirmed to be successfully corrected by comparing the motion-compensated images with the original images. The proposed method is expected to be useful in various clinical PA imaging applications (e.g., breast cancer, thyroid cancer, and carotid artery disease) that are susceptible to motion contamination during multispectral PA image analysis.

1. Introduction

Photoacoustic (PA) images are reconstructed using ultrasound (US) signals generated by localized thermal expansion and contraction induced by the irradiation of light-absorbing imaging targets using a pulsed laser. As intrinsic optical absorbers present in human tissues, such as oxy-hemoglobin (HbO2), deoxy-hemoglobin (Hb), lipids, melanin, and water, exhibit unique light absorption coefficients depending on the laser wavelength, PA imaging can emphasize the spectroscopic analysis of biological tissues [1,2,3,4,5,6,7,8,9,10,11,12,13,14,15]. In addition, a spectral unmixing process using multi-wavelength PA images enables the extraction of concentrations of specific light absorbers and captures consequent functional information, such as total hemoglobin concentration, hemoglobin oxygen saturation (sO2), and lipid concentration [16,17,18,19,20,21,22,23,24,25,26,27,28]. Thus, multispectral PA imaging can aid the diagnosis of various clinical conditions, such as epidermal, hemorrhagic, ischemic, cancerous, and peripheral diseases [29,30,31,32,33,34,35]. Multi-wavelength PA imaging can be implemented by combining a pulsed laser system with a commercial US imaging machine and is usually operated in 2D space. However, 3D PA/US imaging systems are preferred because 2D PA/US imaging systems exhibit poor repeatability due to operator dependence. Therefore, in this paper, we present a 3D clinical handheld PA/US imaging scanner managed using a mechanical scanning method. The proposed system is used to acquire 3D PA/US images of various human body parts successfully [36,37]. Several studies have been conducted on quality improvement of PA/US images [38,39,40,41,42,43,44], but the motion artifact problem is a major factor affecting this quality. As 3D images are reconstructed by stacking the beamformed 2D images in the mechanical scan direction, the reconstructed 3D images suffer from motion artifacts owing to the breathing and shaking of the image object. Motion artifacts contaminate not only the structural PA image, but also the functional information. Errors induced in physiological information, such as sO2, are more severe because the current spectral unmixing process is based on a per-pixel approach, based on the following equation:
P = p λ 1 p λ 2 p λ N = ϵ ab 1 λ 1 ϵ ab 2 λ 1 ϵ ab 1 λ 2 ϵ ab 2 λ 2 ϵ ab 1 λ N ϵ ab 2 λ N ϵ abQ λ 1 ϵ abQ λ 2 ϵ abQ λ N C ab 1 C ab 2 C ab Q = MC ,
where N denotes the number of wavelengths used, Q denotes the number of absorbers to be unmixed, p( λ i) denotes the PA amplitude at wavelength λ i, ϵ abj ( λ i ) denotes the molar extinction coefficient of absorber j at wavelength λ i , and C abj denotes the relative concentration of absorber j. The concentrations are estimated using the pseudo-inverse of M on both sides of the equation. By Equation (1), the concentrations of absorbers at a single pixel location are identical in the multi-wavelength image being scanned. Motion contamination degrades the accuracy of spectral unmixing by disturbing the constancy of concentrations of absorbers at a single pixel location in the scanned multi-wavelength image. To resolve this problem, various motion compensation methods have been proposed. Erlöv et al. performed in vivo PA/US imaging and compensated for motion contamination in PA images using a phase-tracking algorithm on interleaved 2D US images. However, the authors did not demonstrate a reliable reference in US images for motion compensation, and their performance evaluation was limited to single-wavelength PA analysis [45]. Mozaffarzadeh et al. conducted various single-wavelength PA/US imaging experiments on phantoms, both ex vivo and in vivo, and motion-corrected the PA/US images using the modality independent neighbourhood Descriptor (MIND) algorithm. However, as the MIND algorithm performs compensation based on self-similarity, the effect of motion compensation is significantly reduced when motion pollution is severe [46]. Lee et al. presented motion compensation using a low-pass filter to correct spike signals induced by respiration. They reported motion-compensated spectral unmixing results in vivo, but did not present quantified results, and the motion compensation was axially limited [47]. Kirchner et al. reported motion-compensated spectral unmixing in vivo using quantification. Compensation of the PA images was implemented using optical flow, and the flow information was obtained by measuring the brightness patterns in the US images. However, evaluation of spectral unmixing was limited to a 2D imaging system, and the authors compensated for the motion based solely on brightness values [48].
In this study, we present a novel motion compensation method for 3D scanned PA images in both axial and lateral directions. Motion compensation is applied sequentially to all B-mode US images to maximize the structural similarity between successive pairs of B-mode US scan images in terms of the structural similarity index measure (SSIM). SSIM measures and compares the luminance, contrast, and structure of images to quantify similarity [49,50]. Epidermal profiles acquired from US images are used as references for motion correction along the axial direction, whereas US images obtained using the MIND correction algorithm are used as references for lateral motion compensation. During each motion compensation step, the PA motion artifacts are corrected using US motion compensation information. The motion compensation performances in both phantom and in vivo human imaging experiments are evaluated. Comparing the original images with the motion-compensated ones confirms that the PA structure and sO2 images are successfully calibrated even in the presence of severe motion contamination. Based on these results, the proposed motion compensation method is expected to be useful for 3D multispectral PA/US imaging of various clinical diseases that are particularly vulnerable to motion contamination owing to tremors induced by breathing or unstable patient conditions.

2. Materials and Methods

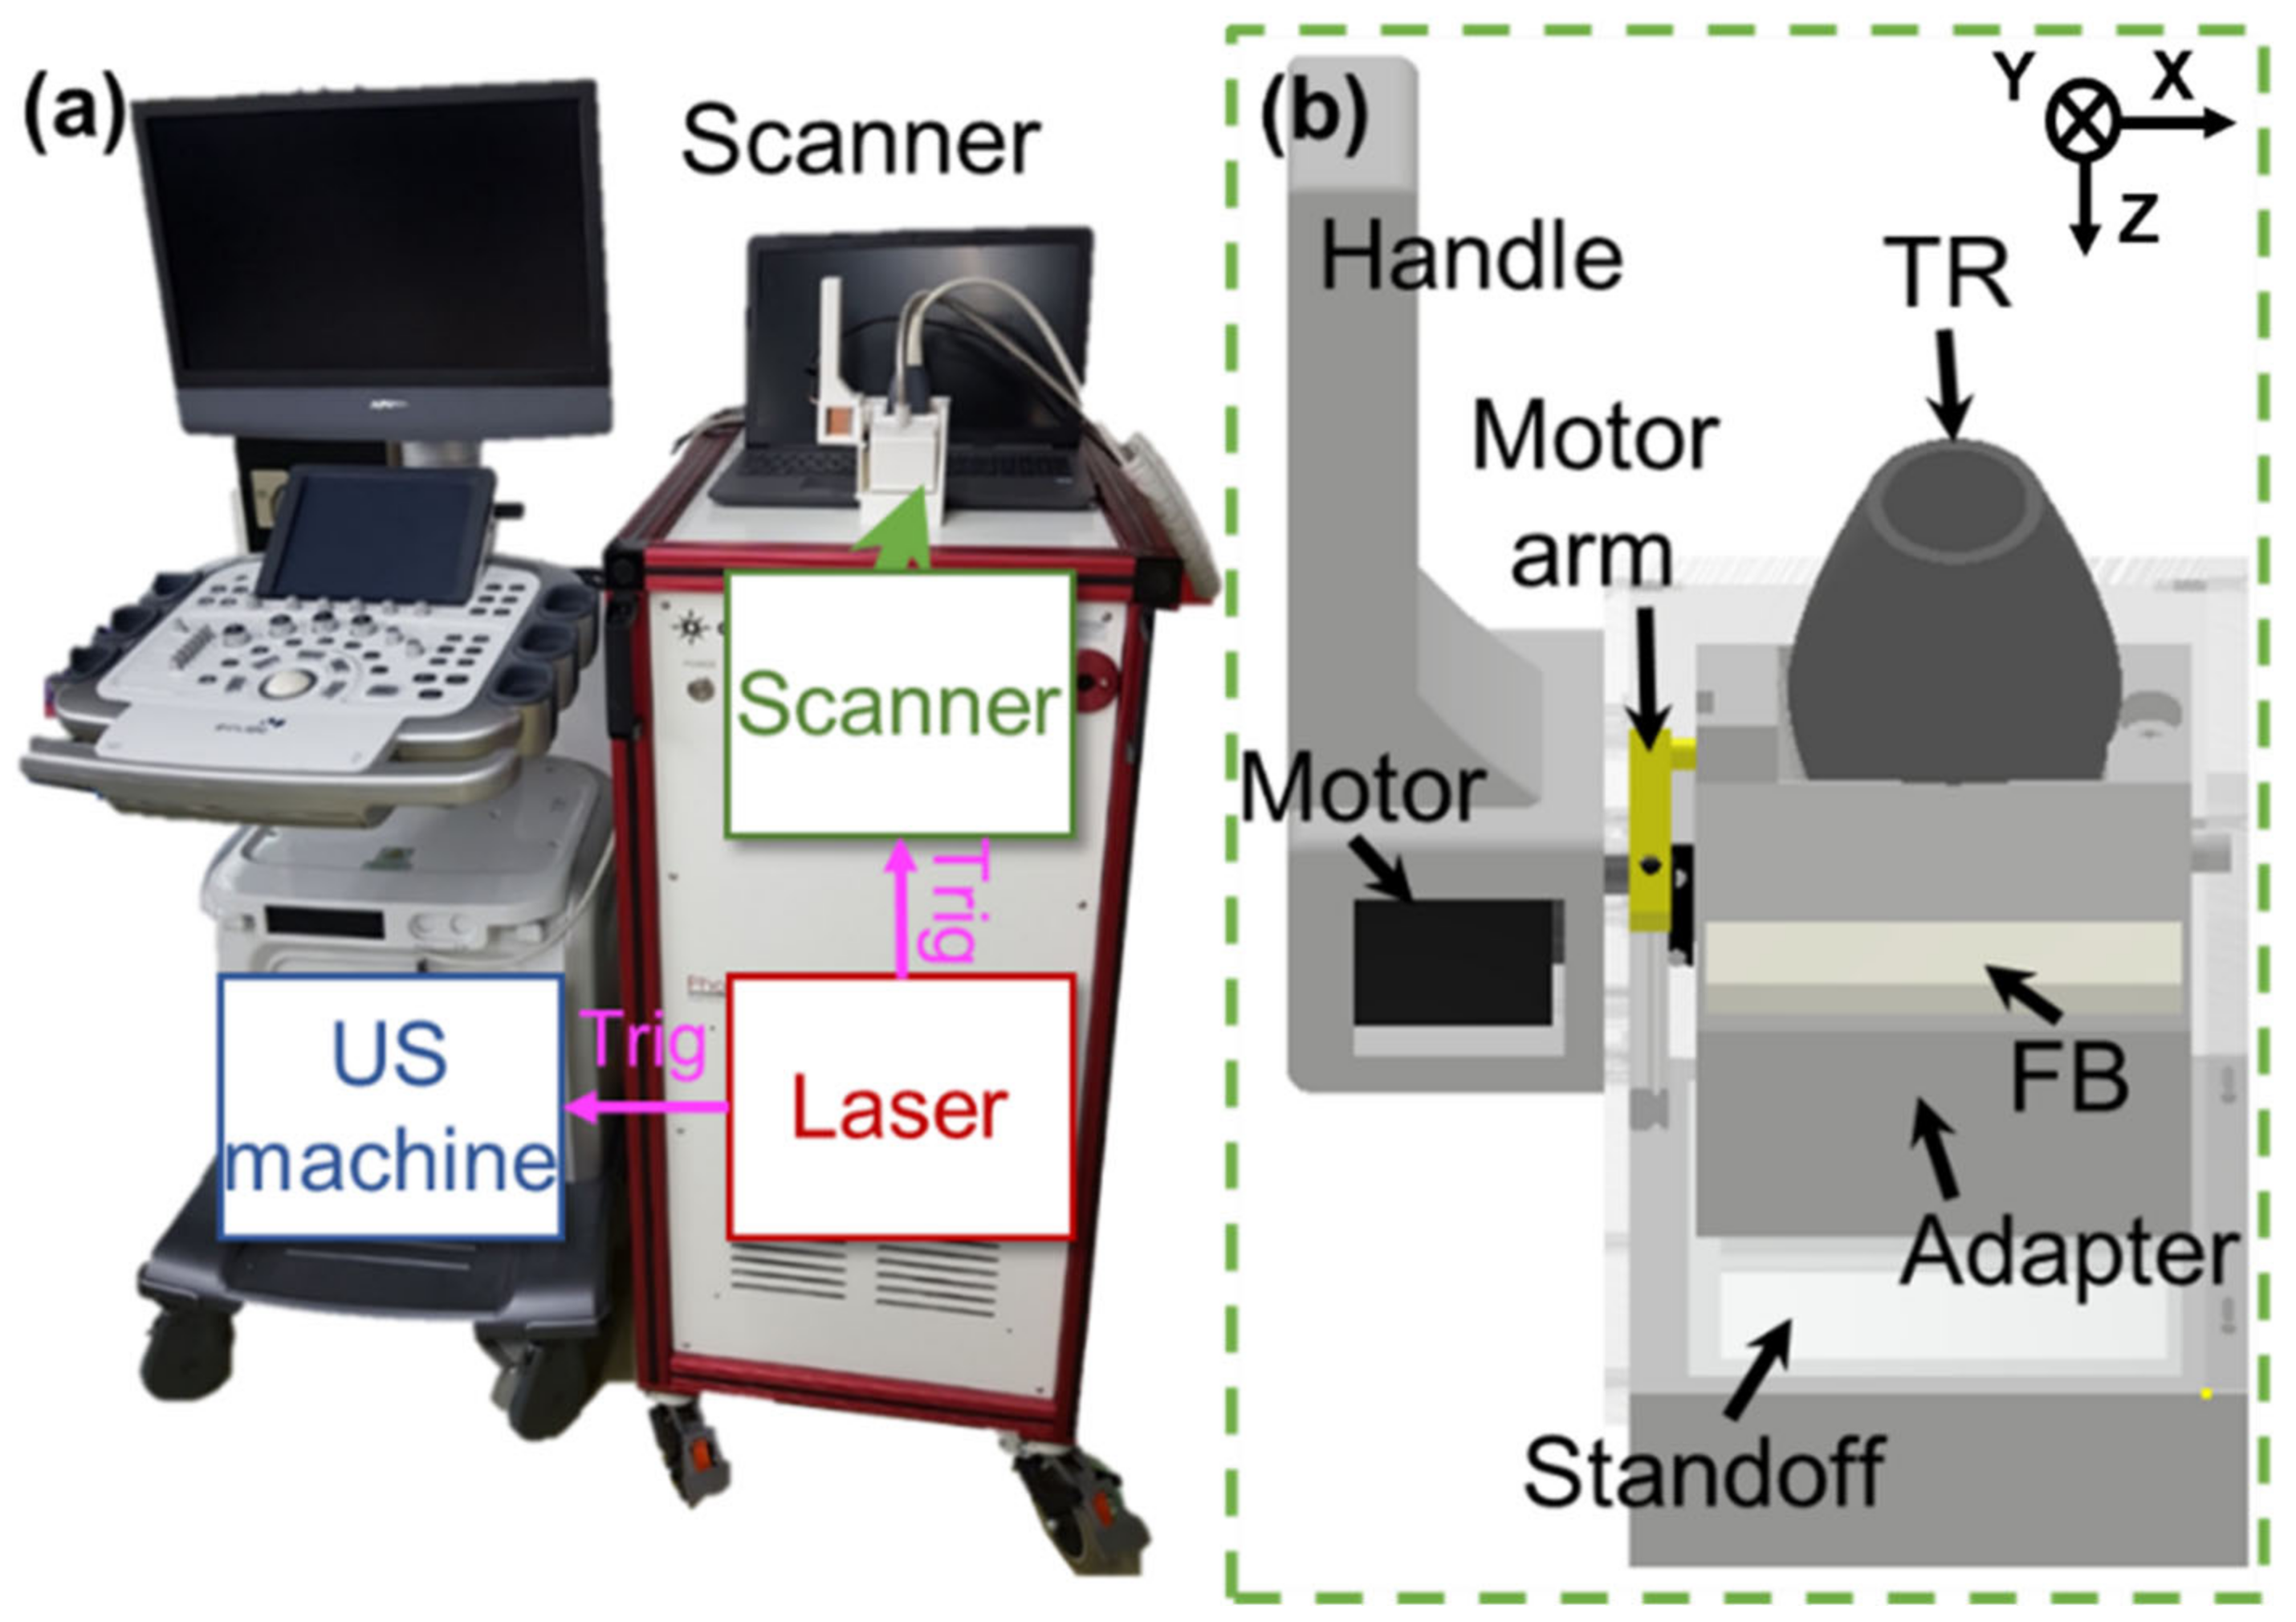
2.1. 3D Clinical Handheld PA/US Imaging System and Scanner

Figure 1a depicts a photograph of the clinical PA/US imaging system and a 3D handheld imaging scanner. The clinical imaging system consists of a US machine (EC-12R, Alpinion Medical Systems, Seoul, Republic of Korea) and a tunable pulsed laser system (Phocus Mobile, OPOTEK, Carlsbad, CA, USA). The schematic diagram of the 3D handheld scanner is depicted in Figure 1b. The scanner comprises the handle, motor arm, motor (PKP523N12A, Ina Oriental Motor, Tokyo, Japan), adapter, standoff, US transducer (TR) (L3-12, Alpinion Medical Systems, Gangseo-gu, Republic of Korea), and fiber bundles (TFO-VIS100SL46-2000-F, TAIHAN FIBEROPTICS, Gyeonggi-do, Republic of Korea). The US machine has 64 receiving channels and the US transducer has 128-element linear array. Because the number of receiving channels is one-half of the number of US transducer elements, one B-mode PA/US image is obtained with two laser shots. The tunable pulsed laser system uses a pulse repetition frequency (PRF) of 10 Hz, so the final image acquisition speed is 5 frames per second. The fast tuning function of the tunable pulse laser system can tune the wavelength every pulse, and 3 wavelengths are used for spectral unmixing of multi-wavelength PA images. In addition, to safely obtain a single PA image within the transducer’s elevational resolution, the scanning step size ranges between 0.06 mm and 0.11 mm, much smaller than the elevational beam-width of the linear array US transducer (approximately 1 mm at a depth of 30 mm). 3D PA/US imaging and scanning are performed simultaneously when the laser delivers simultaneous triggers to the US machine and scanning system. The US machine displays B-mode PA/PA maximum amplitude projection (MAP) images or B-mode US/US MAP images in real time and simultaneously saves PA radiofrequency (RF)/US image data during the implementation of 3D imaging. Detailed specifications of the equipment, scanning, and data acquisition procedures are presented in [36].

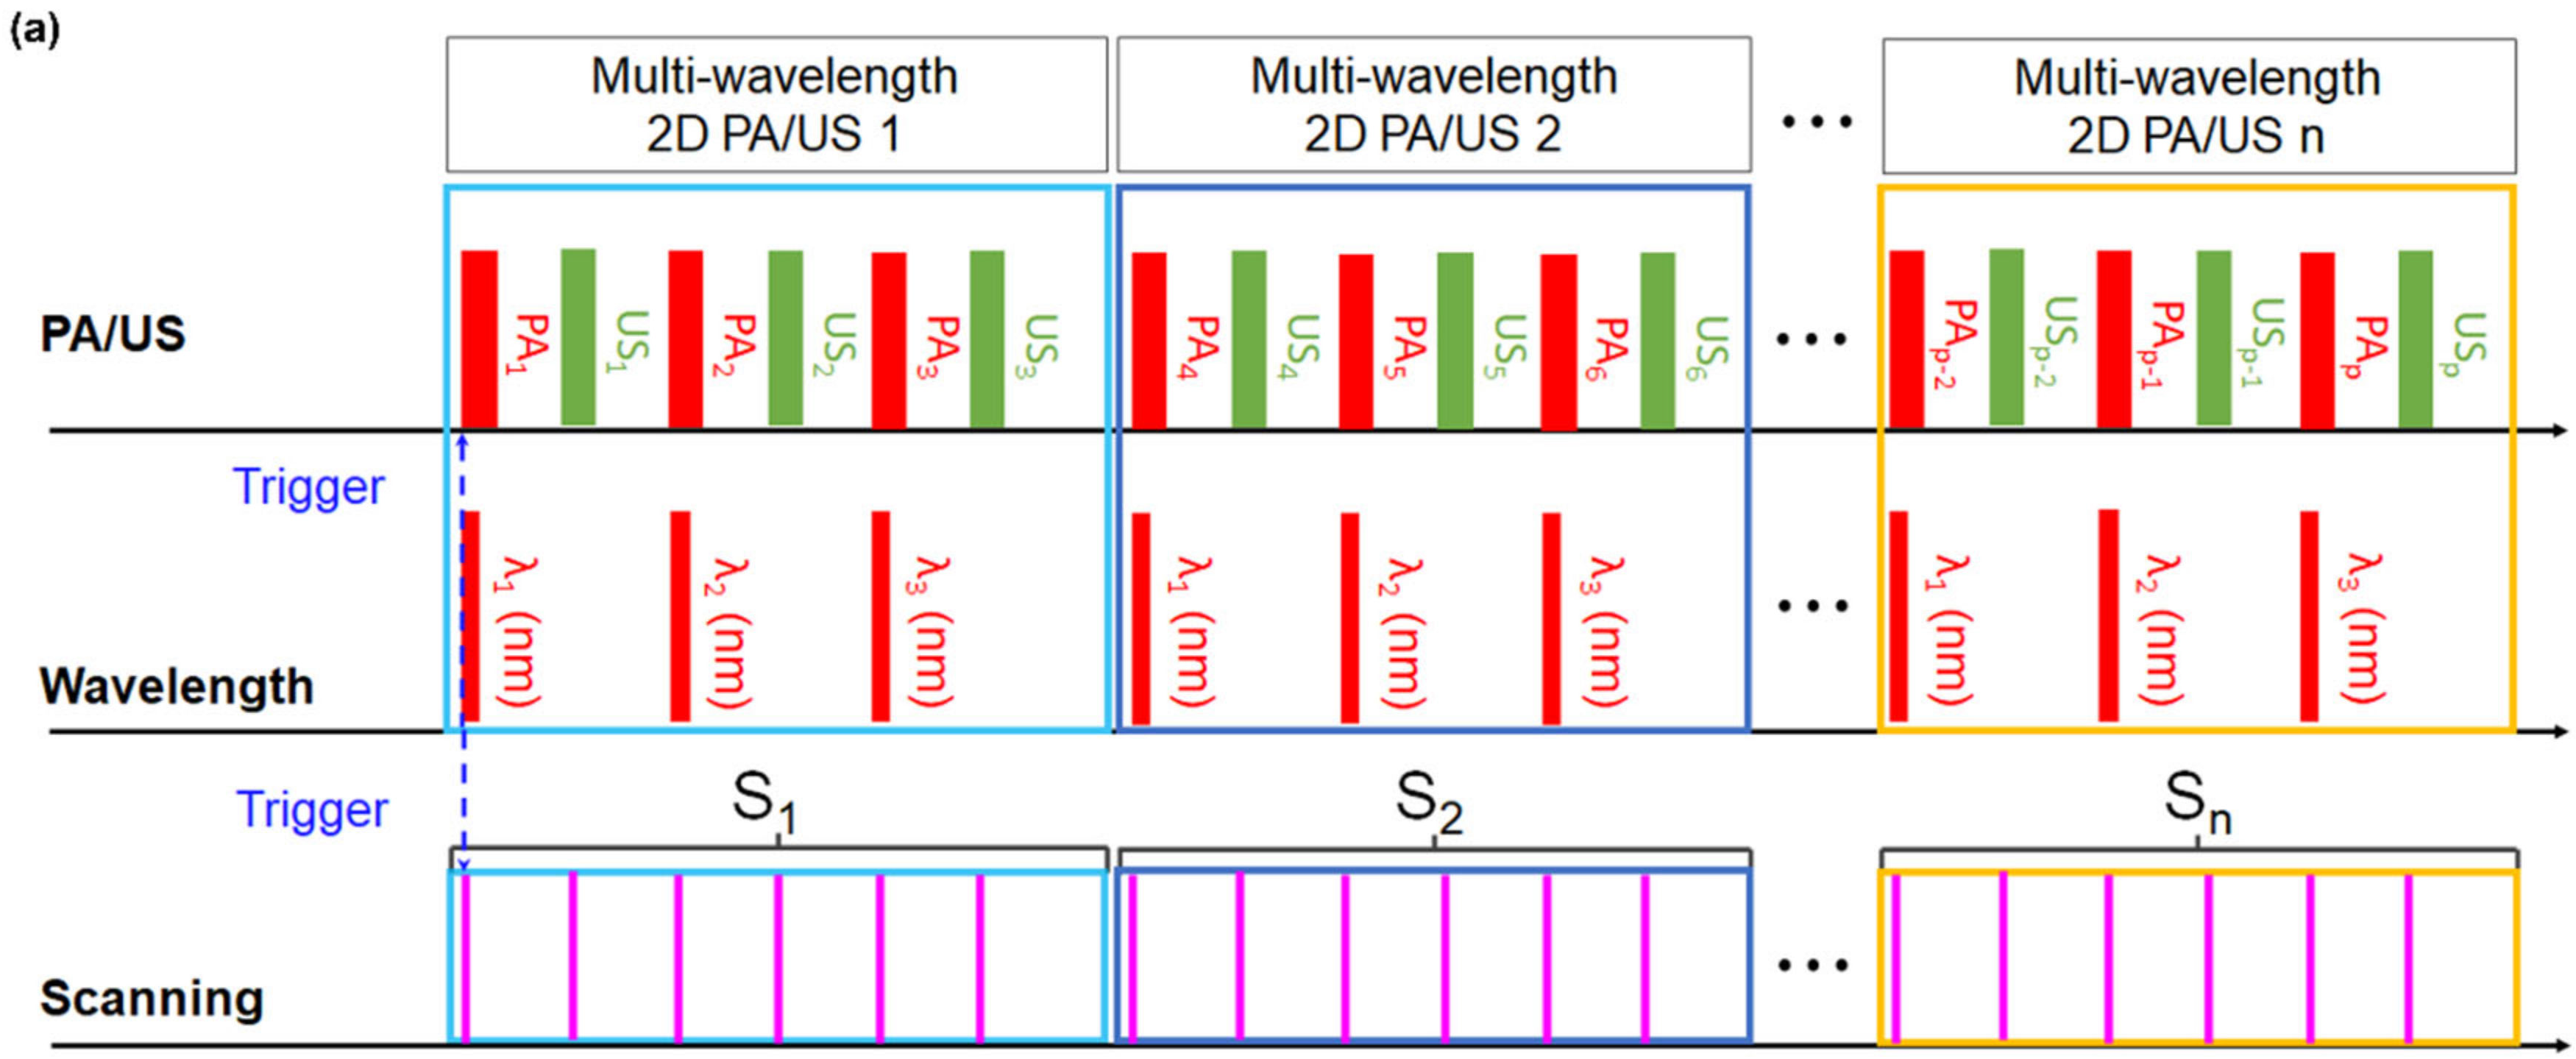
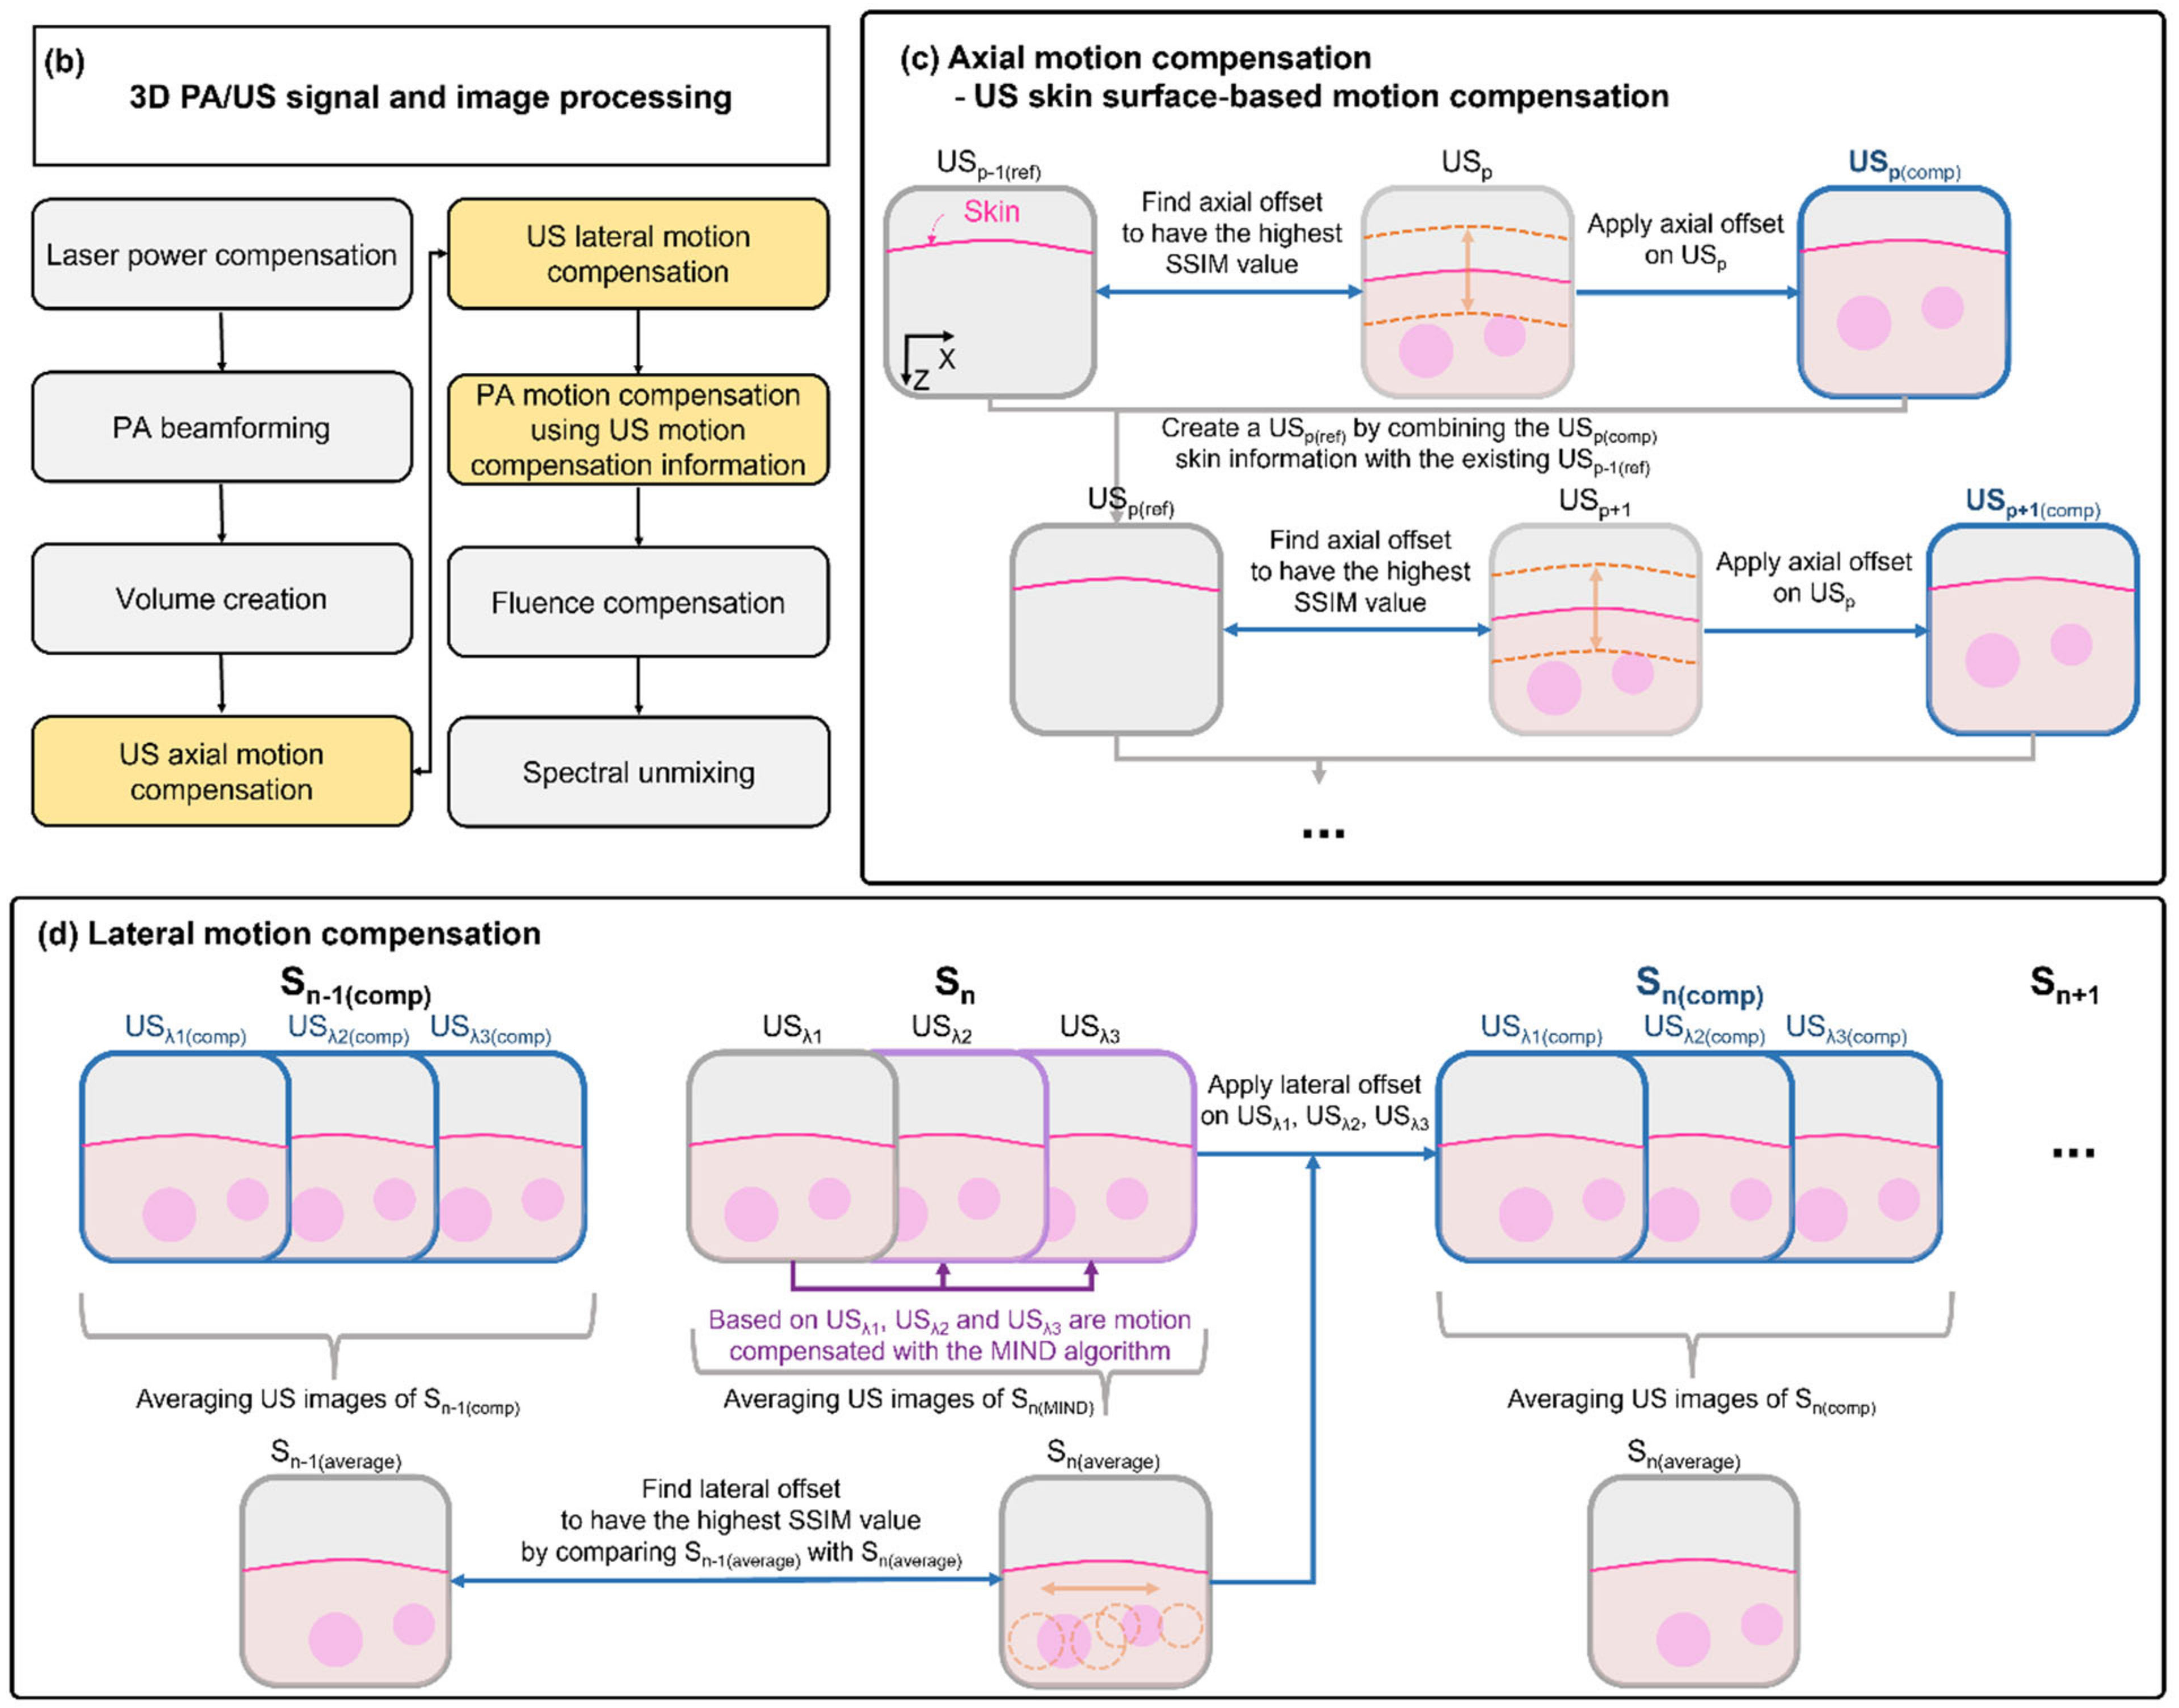
2.2. 3D Clinical Handheld PA/US Imaging System and Scanner

The acquisition of 3D multiwavelength PA/US images is illustrated in Figure 2a. When trigger signals are fired from the laser system to the mechanical scanning system and US imaging system simultaneously, 3D imaging and scanning are performed. During the 3D scanning process, three PA images corresponding to three optical wavelengths (756, 797, and 866 nm) are acquired corresponding to each multispectral data set. Each US image is acquired immediately after capturing the corresponding PA image. After acquiring the 3D PA RF/US image data, 3D signal and image processing are implemented offline, as illustrated in Figure 2b. The PA RF data are compensated based on the laser power measured using the energy meter of the laser system before implementing beamforming (BF). The calibrated PA RF data are reconstructed using a delay-and-sum (DAS) BF [51,52,53,54]. The beamformed B-mode PA and US images are stacked along the elevational direction (i.e., scanning direction) to construct the original PA and US volumes, respectively. During each scanning period (i.e., Sn in Figure 2a), three PA images with three optical wavelengths and three US images are acquired. The motion artifact of each US image is axially and laterally corrected, and then the position of the corresponding PA image is compensated based on the motion-corrected US image (Figure 2b). The axial motion is corrected first, followed by the lateral motion. For axial motion compensation, an epidermal surface is detected by using edge detection on the B-mode US image, and the skin surface image is used as the basis for axial motion compensation (Figure 2c). The B-mode US images used for axial motion compensation are individual stacked US images without considering the scanning period (i.e., USp in Figure 2a). As the handheld scanner is firmly pressed onto the skin surface, skin surfaces of all B-mode US images are assumed to be relatively maintained. Using the epidermal image of the previous B-mode US image (USp-1(ref)) as a reference image, the epidermal surface of the subsequent B-mode US image (USp) is moved axially to identify the axial offset corresponding to the maximum SSIM value between the two images. If the SSIM value is maximized, SSIM value is an indicator for determining the structural similarity of the two images, so it is considered the case with the best correction. Therefore, USp(comp) is acquired by shifting USp in the axial direction by the axial offset. For subsequent processing, USp(ref) is empirically updated as follows:
US p ref = US p 1 ref × 0.9 + US p comp skin × 0.1 .
For the updated USp(ref), only 10% of the total USp(comp)(skin) value is reflected in Equation (2). This is because if the newly corrected information, USp(comp)(skin), has a high reflection rate and unexpected errors, this error could lead a significant impact on the new reference, USp(ref). Further, this can also affect the subsequent motion correction. Thus, instead of being too sensitive to the new reference, USp(comp)(skin), the USp(ref) is generated mainly using the USp-1(ref), reliable data accumulated over multiple motion-corrected frames. This can also prevent continuous reflection of the unexpected errors in the following motion correction process. The updated USp(ref) is used as a new reference for the subsequent process, and this operation is repeated until all B-mode US images are compensated for. Once the axial motion correction is completed, lateral motion compensation is implemented using axially compensated US volume data (Figure 2d). Although the epidermal surface profile is used as a reference for axial motion compensation, no adequate reference is identified for lateral motion compensation. Therefore, an artificial reference is generated using the MIND correction algorithm. Recently, several motion-tracking algorithms for 3D clinical data using various video tracking methods have been proposed [55,56,57]. Among them, the MIND algorithm is the most effective for motion compensation in all directions of images acquired from similar locations [58]. While tuning the three optical wavelengths, three PA images and three US images (i.e., USλ1, USλ2, and USλ3) are acquired via simultaneous mechanical scanning. Note that the US images are not affected by optical tuning. Because the scanning step size between the US images ranges between 0.06 mm and 0.11 mm, which is significantly lower than the elevational beam-width of the US transducer (i.e., ~1 mm), all three US images within a single scanning period (Sn in Figure 2a) can be considered to be nearly identical. The MIND correction is one of the image registration methods, which allows both axial and lateral motion correction of images acquired at almost the same location. However, this method is not suitable for the images with large difference. In turns out that the axial motion artifacts are more significant compared to the lateral ones. Therefore, the axial motion is first corrected using the axial motion correction method. Then, the MIND correction is applied for the lateral motion correction to three optical wavelength PA images obtained at the almost same position. The MIND correction can be performed without any reference, such as the epidermal information used in the axial motion correction. Further, the MIND correction allows not only the lateral motion correction but also the additional axial motion correction that may not have been fully corrected in the previous axial motion correction. For the MIND correction, based on the USλ1, an offset corresponding to the minimal MIND difference with USλ2 is determined, and this offset is applied to obtain the MIND-corrected USλ2 (USλ2(MIND)). This process is repeated to acquire MIND-corrected USλ3 (USλ3(MIND)). Using this MIND correction, the images in one scanning period have completed the lateral motion correction, but the lateral motion between the scanning periods has not been corrected. Therefore, all MIND-corrected US images in one scanning period are averaged to generate an artificial reference for additional lateral motion compensation between scanning periods:
S n average = US λ 1 MIND + US λ 2 MIND + US λ 3 MIND / 3 ,
Based on the previous Sn-1(average), each subsequent Sn(average) is moved laterally to determine a lateral offset corresponding to the maximum SSIM value. This lateral offset is applied to each MIND-corrected USλ1(MIND), USλ2(MIND), and USλ3(MIND) to obtain laterally motion-corrected USλ1(comp), USλ2(comp), and USλ3(comp) images, respectively. This processing is repeated until all US images are laterally motion-compensated. The motion-compensated PA volume is obtained by applying the motion-compensated US volume. For fluence compensation, the signal and background regions of interest (ROIs) are manually segmented at equal depths. The segmented signal area of each B-mode PA is compensated using the average value of the segmented background area. To obtain PA sO2 in the signal area, nonnegative spectral unmixing is performed using fluence-compensated PA signals at each wavelength [41,59]. Oxy-hemoglobin (HbO) and deoxy-hemoglobin (Hb) can be obtained using spectral unmixing, and sO2 is the ratio of HbO to total hemoglobin, HbT (sum of HbO and Hb).

3. Results and Discussion

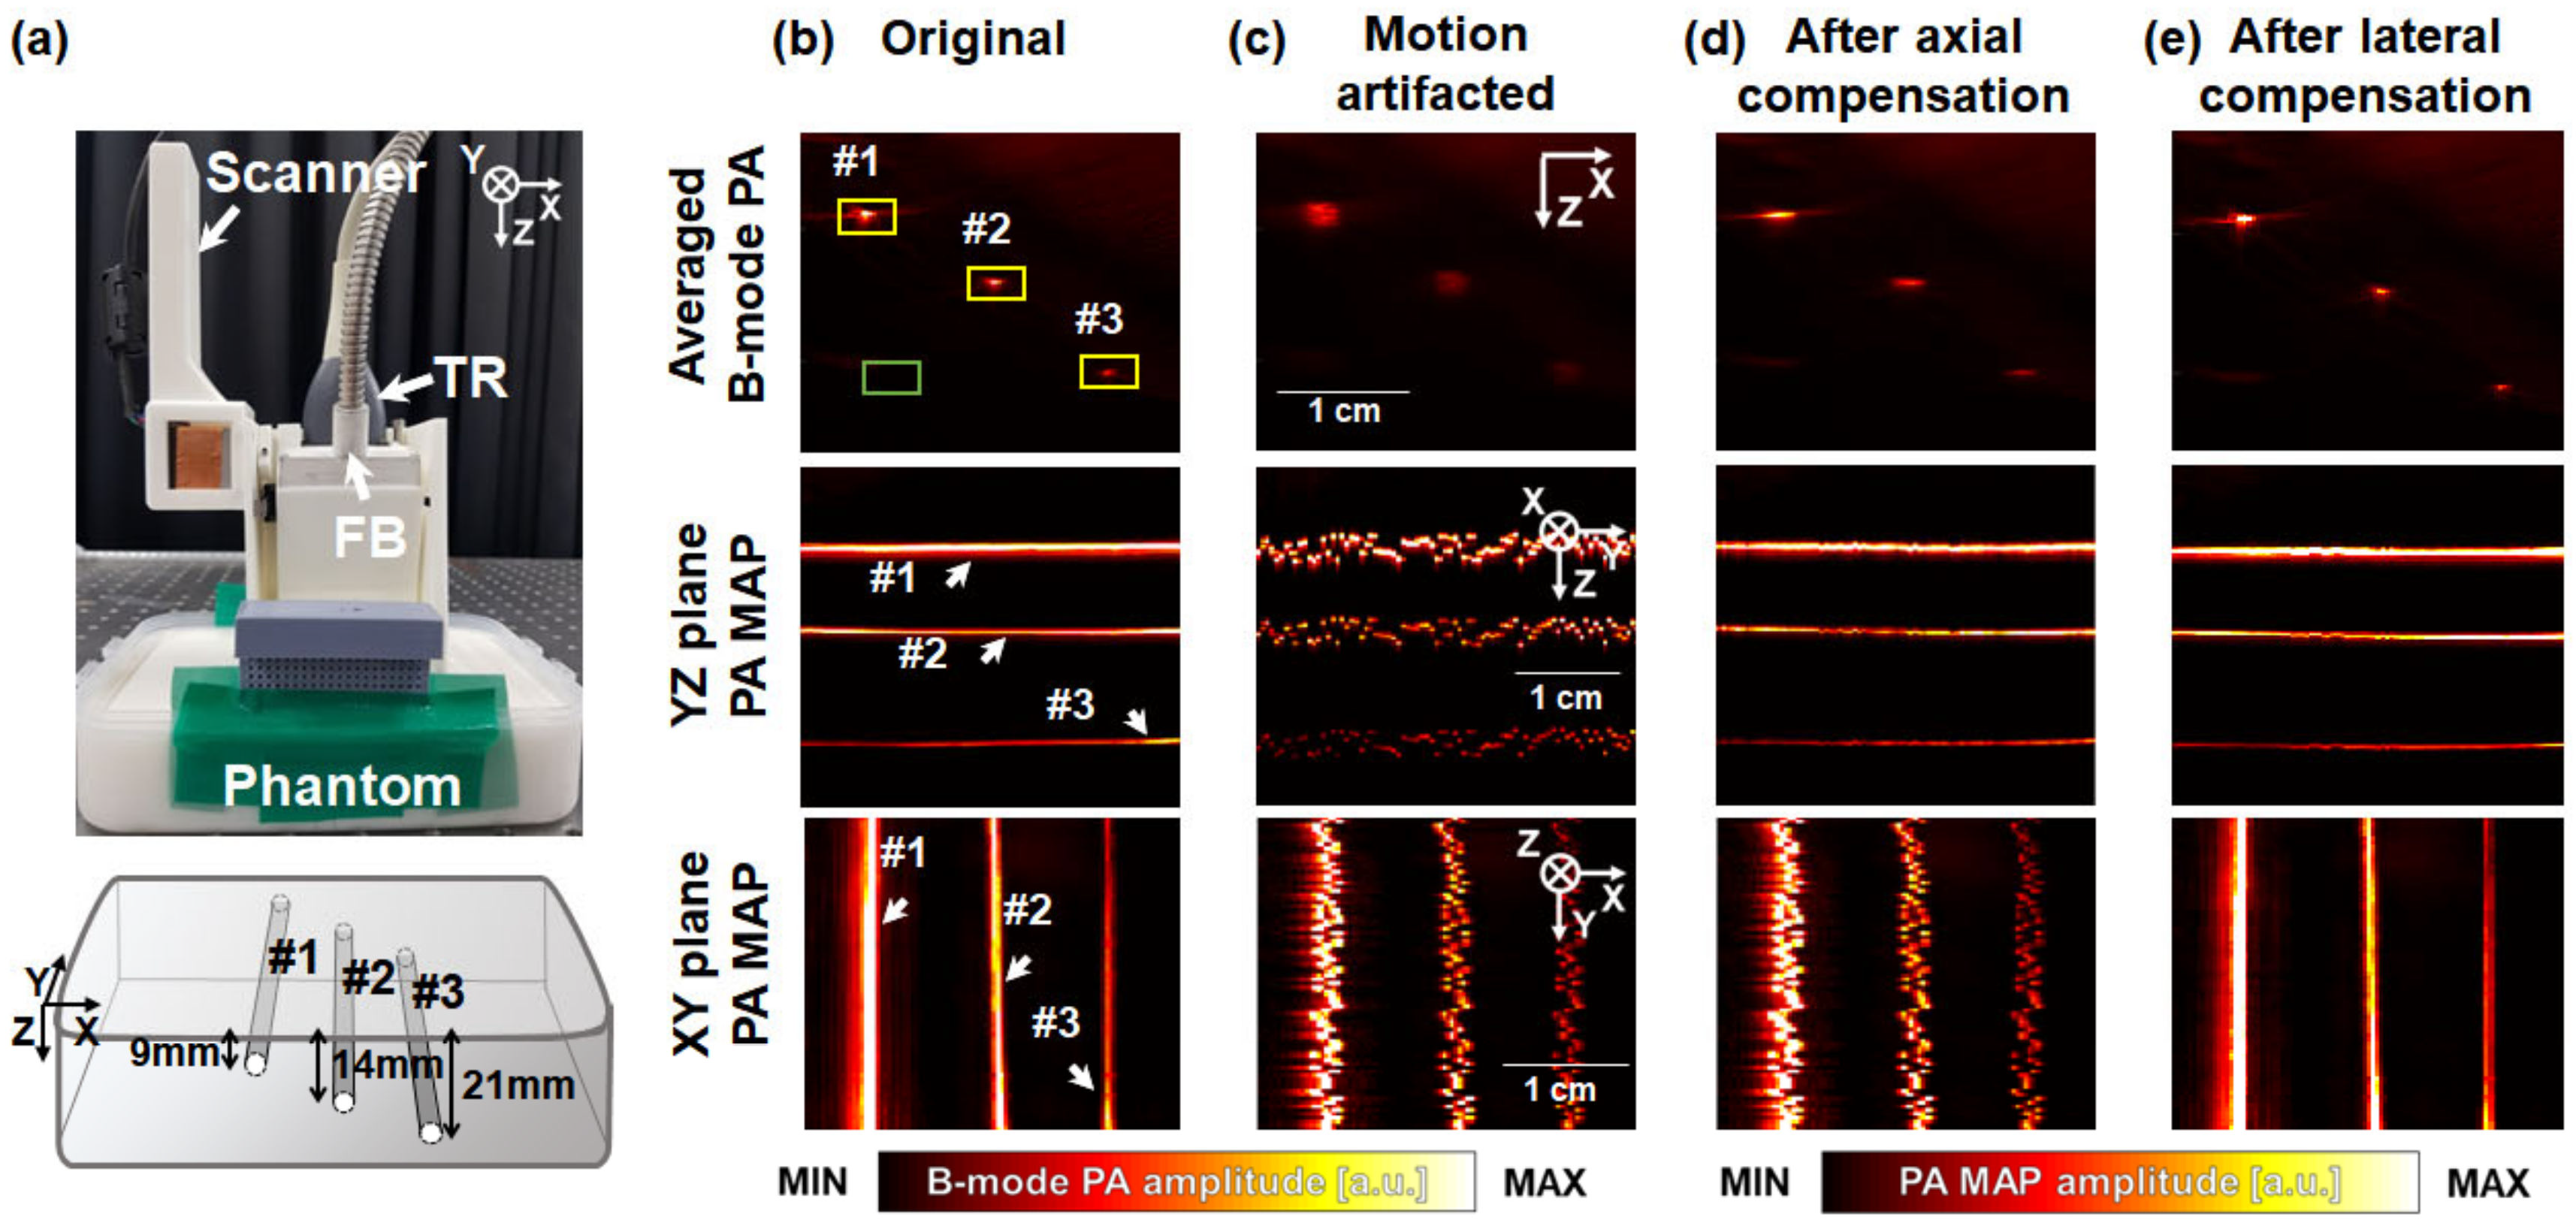
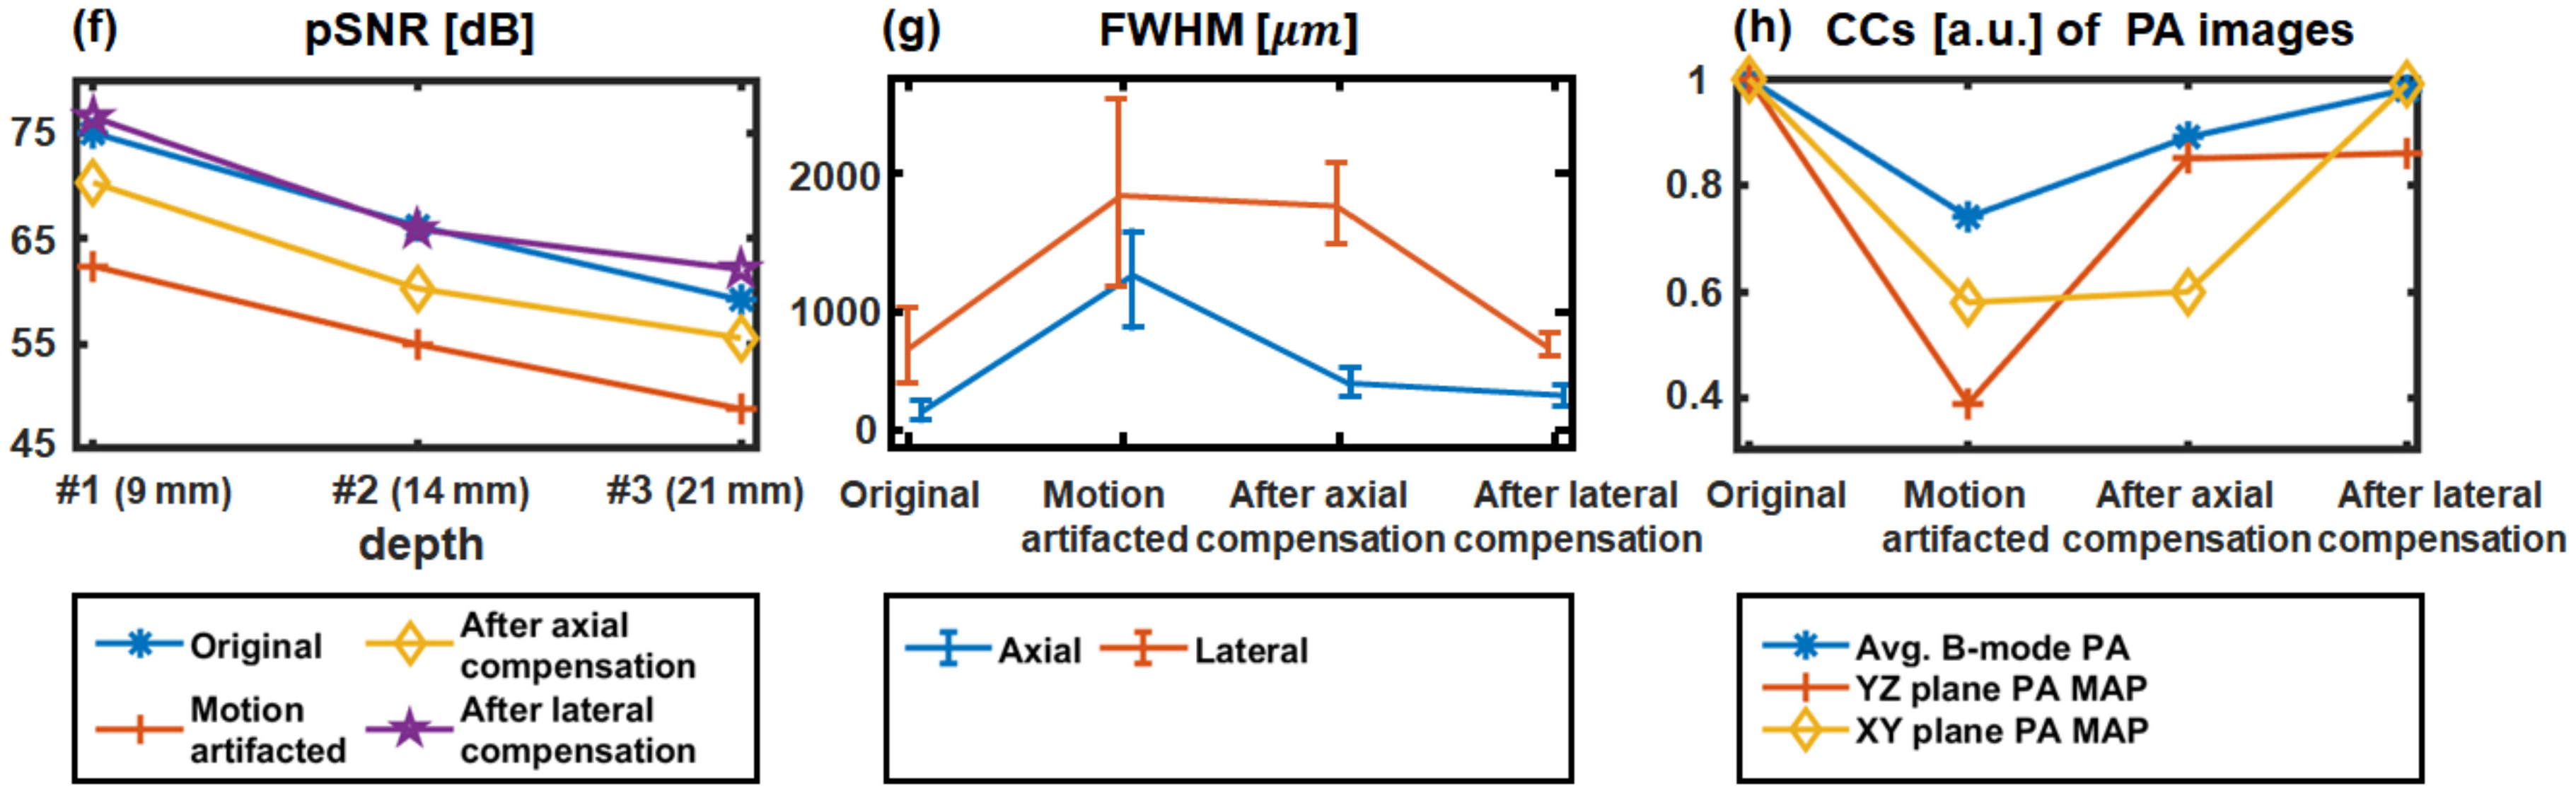
3.1. Performance Test in Phantoms

To evaluate the performance of the proposed motion-correction technique, we image a phantom containing three 90-μm black threads at different depths (Figure 3a). The details of the phantom components and the resultant effective attenuation coefficient are explained in [36]. The 3D handheld scanner is placed on the phantom and scanning is performed along the elevational direction (Y-direction). A single laser wavelength of 797 nm with a pulse energy of 8.8 mJ/cm2 is used, which does not exceed than the American National Standards Institute (ANSI) safety limit of 31.3 mJ/cm2 corresponding to the wavelength. The scanning range, field of view (FOV), and scanning time are taken to be 25.0 mm, 25.0 × 38.4 mm2, and 16.7 sec, respectively. Initially, the phantom is imaged statically to obtain the original 3D PA/US images (Figure 3b), and then the phantom is artificially disrupted during scanning to obtain the 3D PA/US images containing motion artifacts (Figure 3c). In the artificial motion disruption process, a motion was applied to the images of all frames in consideration of the actual scanning period during which the image is acquired. In addition, since the motion in the actual situation may have motion not only in the axial direction but also in the lateral direction, we give artificial motion in both axial and lateral directions. During image processing, the axial motion artifacts are corrected first (Figure 3d), followed by the lateral motion artifacts (Figure 3e). All motion correction algorithms are initially performed on US images (data not shown) and subsequently applied to PA images. The performances of the processes are quantitatively compared by quantifying the peak signal-to-noise ratio (pSNR) and full width at half maximum (FWHM) in the axial (i.e., the Z direction) and lateral (i.e., the X direction) directions. The yellow and green boxes in the figure represent the signal and noise regions, respectively, where the pSNRs are calculated. In addition, cross-correlations (CCs) are measured to evaluate the structural similarity between the original images and others. Three types of PA images are depicted in Figure 3b–e: the averaged B-mode PA images along the X-axis and PA maximum amplitude projection (MAP) images on the YZ and XY planes. The thread images are clearly visualized in the original images (Figure 3b), whereas the structures are disturbed in the images containing motion artifacts in all directions (Figure 3c). After axial motion correction, the thread structures are clearly axially, but not laterally, corrected (Figure 3d). After lateral motion correction, the remaining lateral artifacts are precisely corrected (Figure 3e).
The pSNRs quantified from the three black threads for each image-processing procedure are depicted in Figure 3f. The averaged pSNRs of the image processing methods are 66.8 ± 7.9, 55.4 ± 6.7, 62.1 ± 7.5, and 68.2 ± 7.4 dB, respectively. As the threads are originally arranged as straight lines along the scanning direction, their positions in each image along the scanning direction coincide progressively with motion compensation, resulting in a progressive improvement in pSNR. The axial and lateral FWHMs of the thread at 9mm depth are depicted in Figure 3g. To quantify the motion correction in the scanning direction with FWHM, all frames are cut into nine intervals to obtain nine averaged B-mode PA images. Then, calculate the axial and lateral FWHMs of the nine averaged B-mode PA images. The FWHM results in Figure 3g are the mean and standard derivation of these FWHM values. The axial profiles are 241 ± 9, 1239 ± 380, 315 ± 31, and 258 ± 16 μm, respectively, in image processing order. The axial motion correction method maximally corrects artifacts along the axial direction. Interestingly, axial correction is further improved via the lateral correction process because the MIND correction during lateral correction additionally improves the axial profile. The lateral profiles are 790 ± 374, 1845 ± 689, 1811 ± 259, and 704 ± 64 μm, respectively, in image processing order, where the maximal improvement in the latter profile is observed after lateral motion correction. The CCs between the original and other PA images are presented in Figure 3h, revealing that the structural similarity gradually improves as motion compensation proceeds and becomes almost equal to 1 after the completion of motion correction.

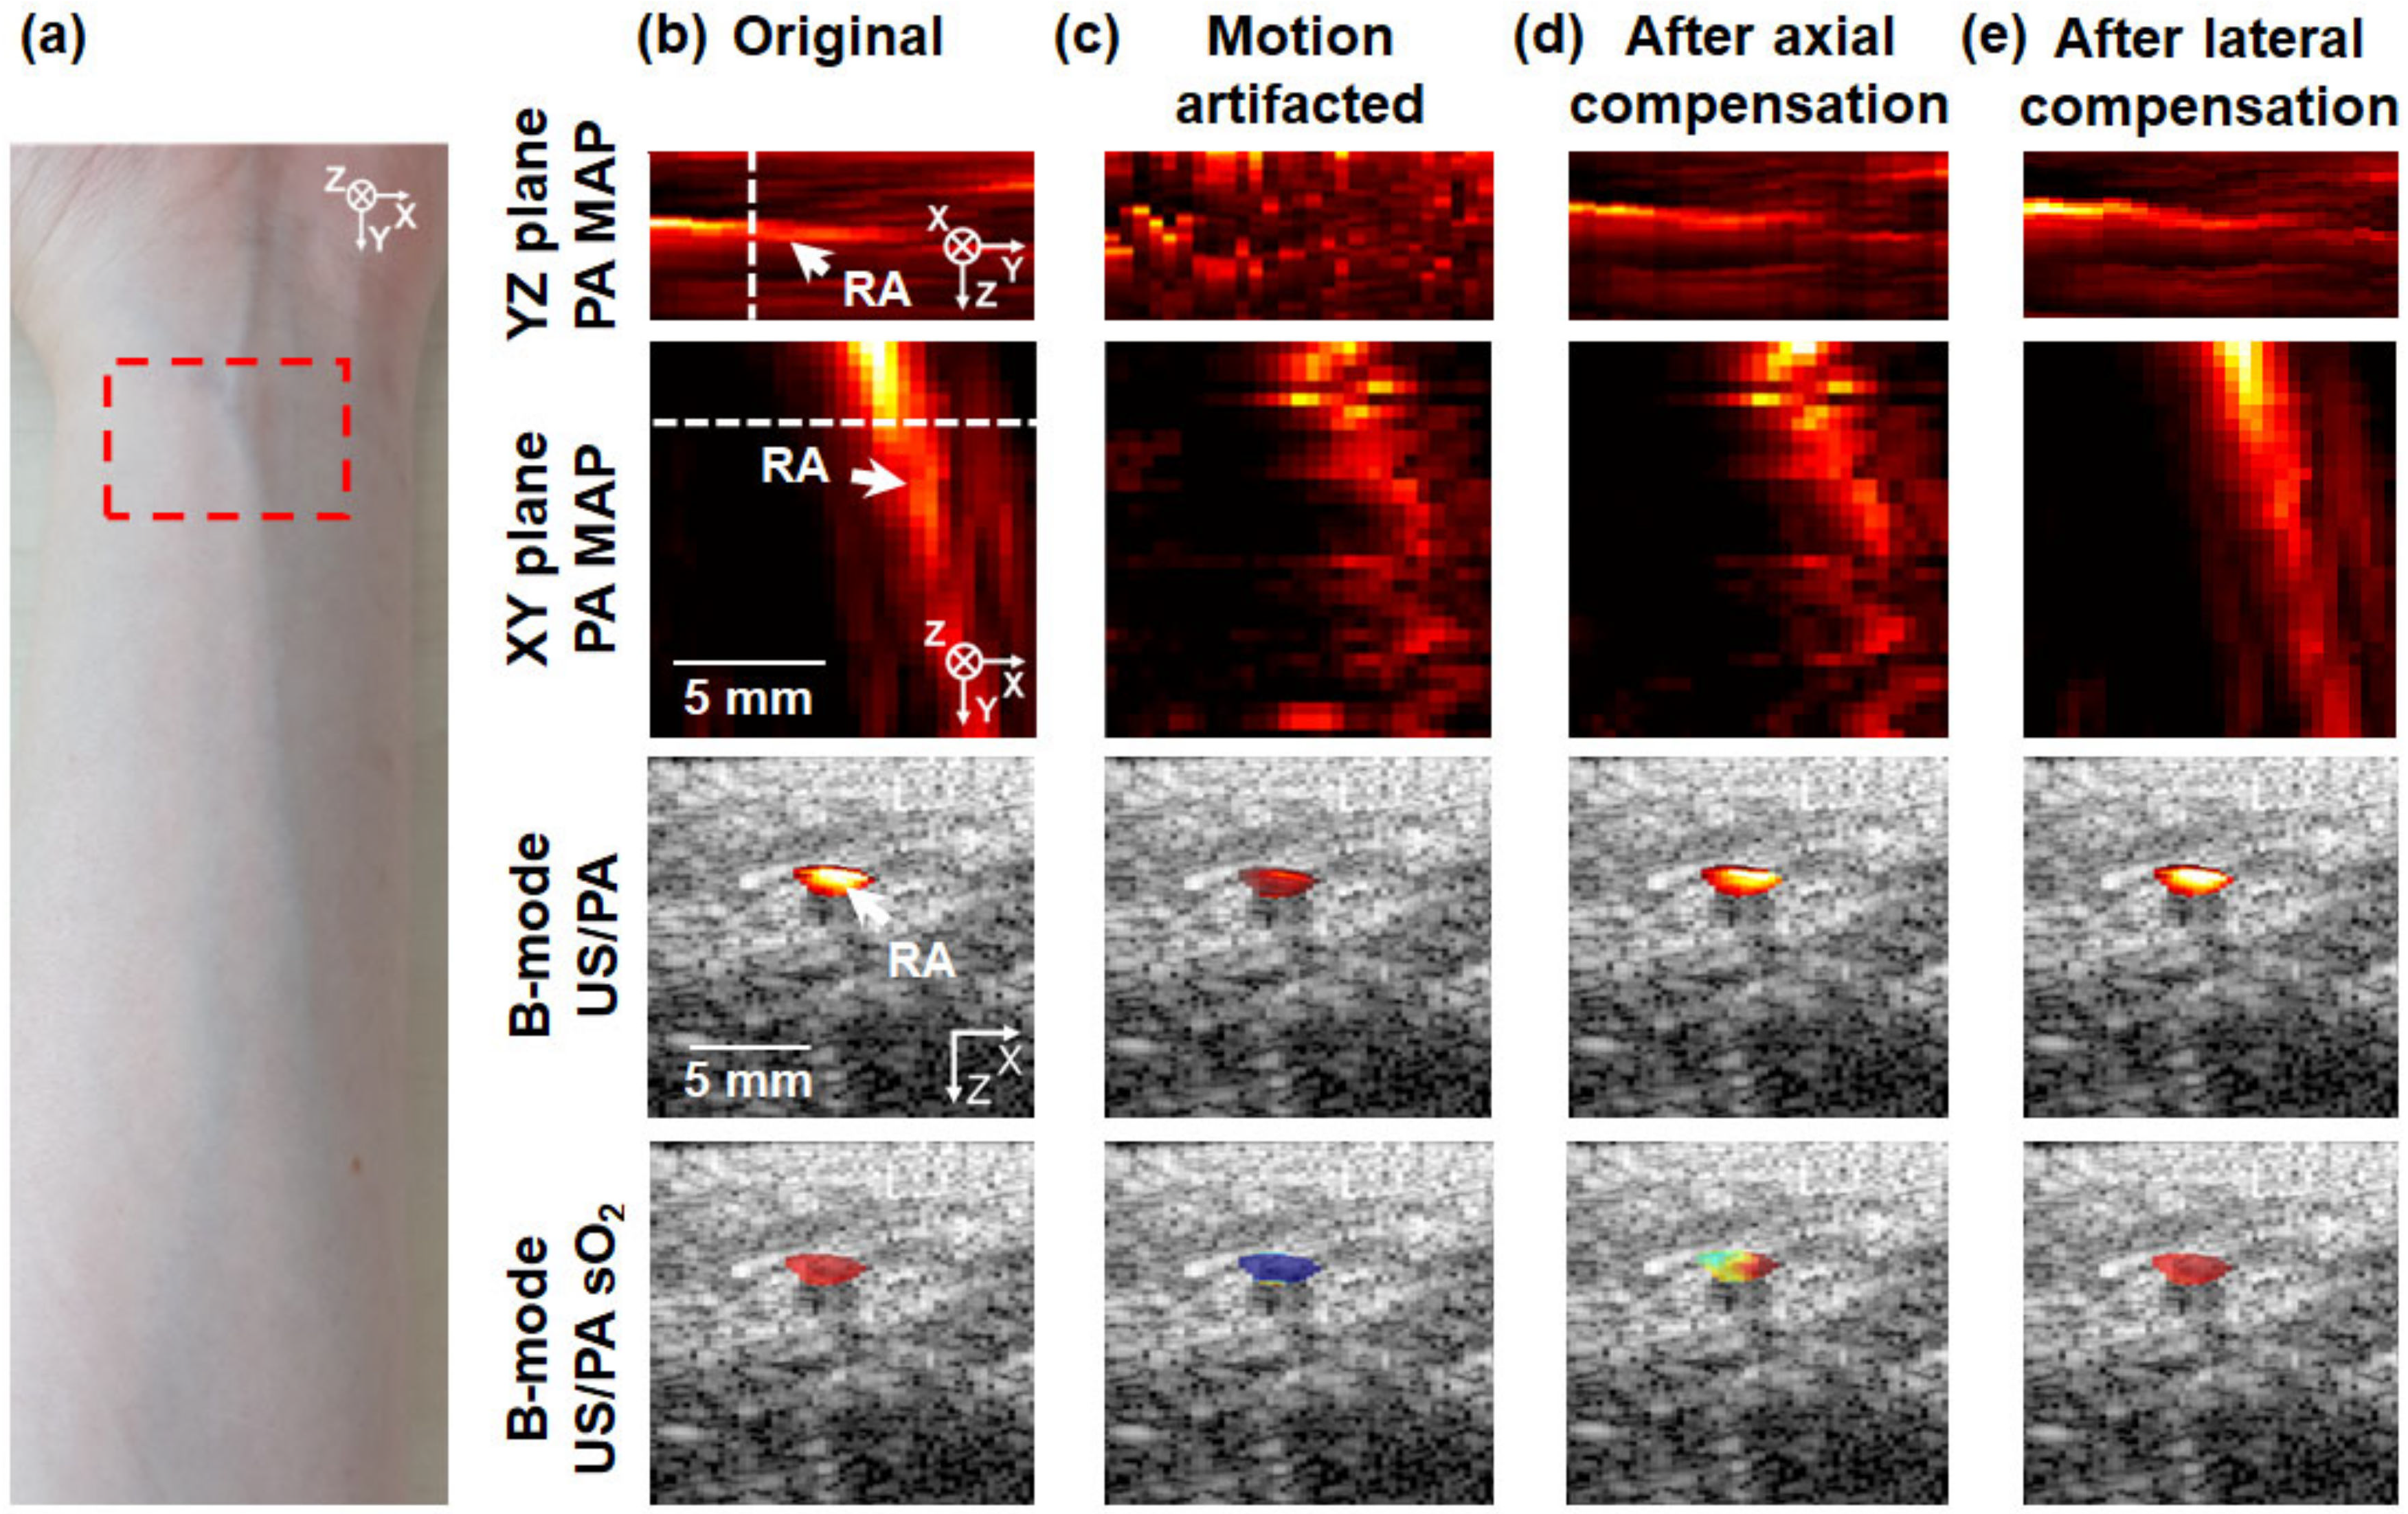
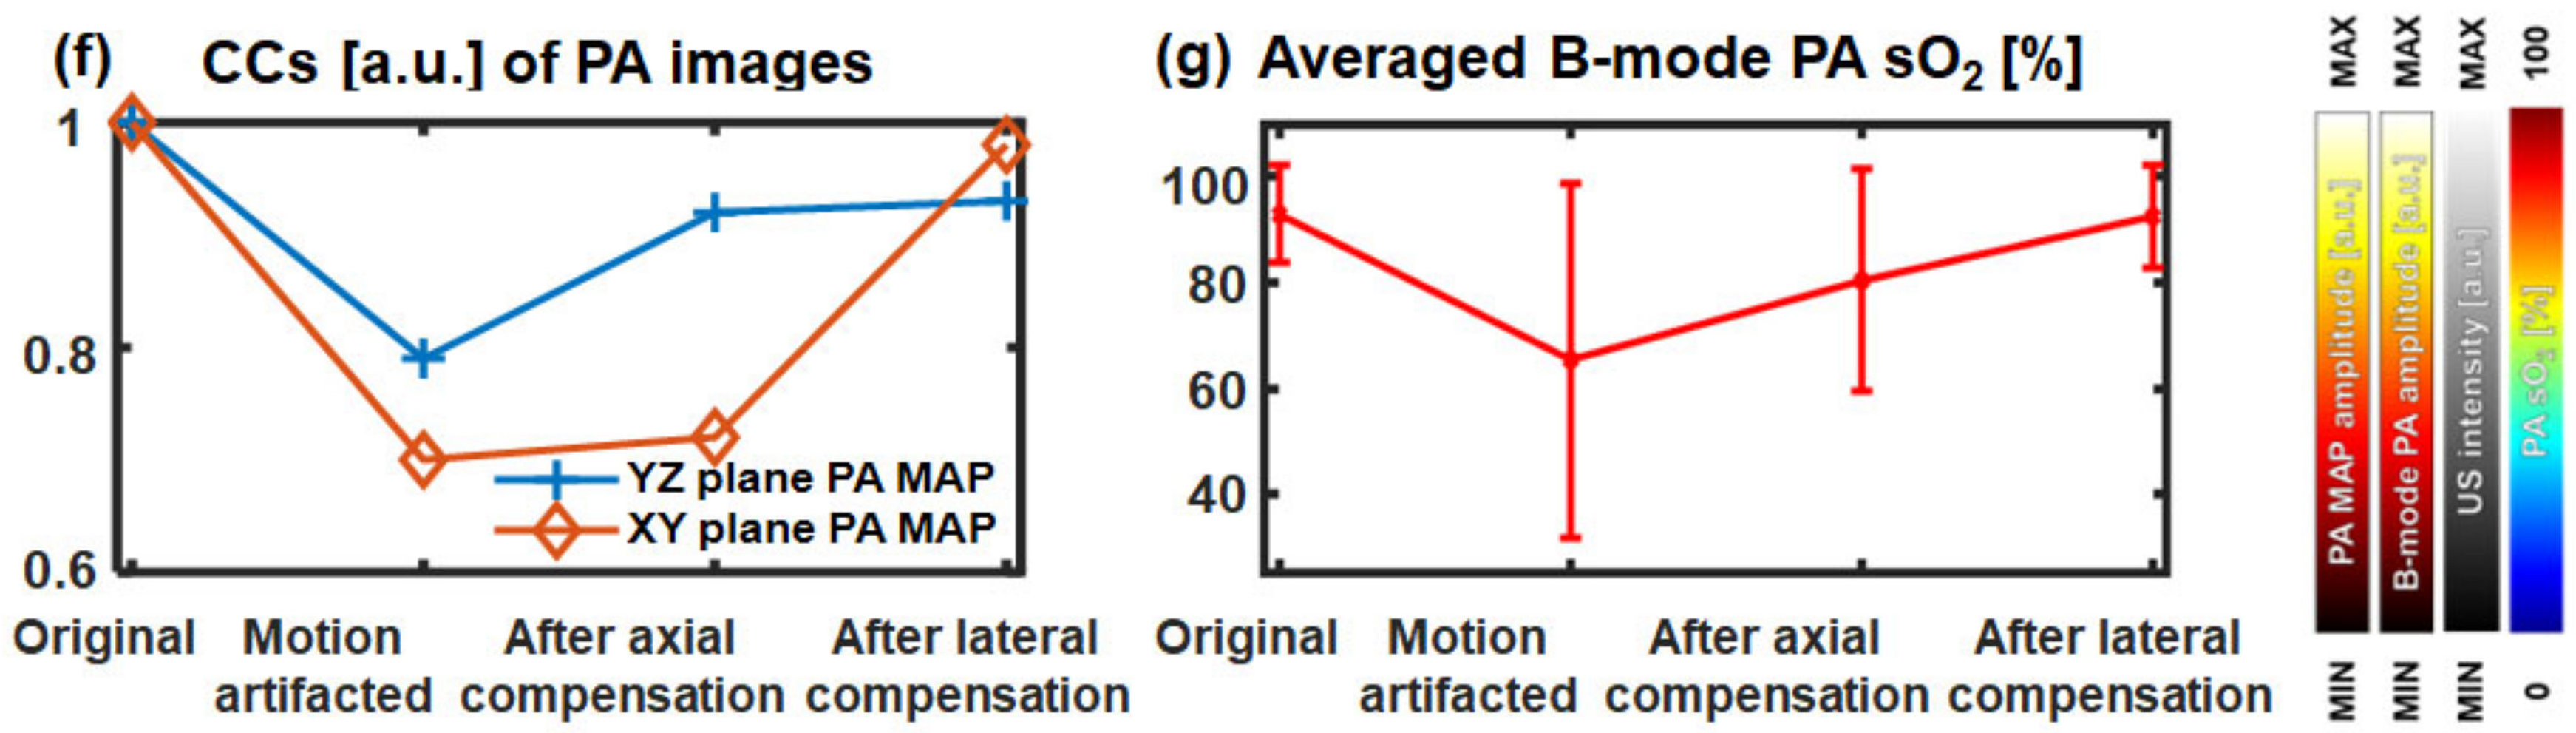
3.2. In Vivo 3D Multi-Wavelength PA/US Imaging of a Human Wrist

To investigate the practical applicability and performance of the proposed motion correction methodology, a human wrist is imaged (Figure 4). 3D PA/US data and spectral unmixing results of the radial vessels are obtained by performing 3D multispectral PA/US imaging using a 3D handheld scanner (Figure 4a). The experiments are performed following the protocols of the Institutional Review Board of the Pohang University of Science and Technology (POSTECH, PIRB-2020-E019). 756, 797, and 866 nm laser wavelengths are used for multiwavelength PA imaging—756 and 866 nm are selected based on 797 nm, the isosbestic points of oxy- and deoxy-hemoglobin, respectively. The pulse energy of the 756 nm wavelength providing maximum pulse energy, 10.7 mJ/cm2, which does not exceed the ANSI safety limit of 25.9 mJ/cm2 [37]. Safety goggles are worn by the volunteer and examiner to prevent exposure to the laser. The scanning range and FOV are identical to those in the phantom experiments, and the scanning time is three times greater than that in the phantom experiments. Radial arteries (RAs) and radial veins (RVs) are primarily used for sO2 quantification. The PA MAP images are segmented into 5.8–12.2 mm and 3.9–13.2 mm segments in the axial and lateral directions, respectively, at positions with clearly visible RAs in the PA MAP images. The segmented images are visualized in Figure 4. Previous studies have reported that arterial and venous sO2 values increase and decrease after motion compensation, respectively, compared to those prior to motion compensation [48]. To analyze the spectral unmixing effect on the ROI without confusion, the imaging sections where the RA and RV are not clearly distinguished are excluded. The upper boundaries of the RA in each B-mode PA image are manually segmented using MATLAB (MATLAB R2021b, MathWorks, Portola Valley, CA, USA), with reference to the corresponding B-mode US images. To implement fluence compensation, the normal tissue regions are manually segmented at the same depth as the RA of each B-mode PA image. For each B-mode image, the average normal tissue value is used to compensate for the PA signals in the RA [59]. The B-mode PA sO2 values in RA are calculated using spectral unmixing with fluence-compensated PA signals. The top 50% of sO2 values present in the PA RA signals are averaged to obtain a representative sO2 value. The PA images acquired at 866 nm are used as representative PA images.
First, the human wrist is statically imaged to obtain the original 3D PA/US images (Figure 4b), and then it is artificially dislocated during scanning to obtain the 3D PA/US images containing motion artifacts (Figure 4c). To achieve motion compensation, the axial motion artifacts are first corrected, followed by the lateral artifacts (Figure 4d,e). As in the case of the phantom, all motion corrections are initially performed on US images and then applied to PA images. Four types of images are identified in each image-processing step, as depicted in Figure 4b–e: the PA MAP images on the YZ and XY planes, the B-mode US/PA image, and the US/PA sO2 image. The PA MAP images of the YZ and XY planes reveal gradual improvements in structure in terms of the image quality over the image processing steps. The PA MAP image of the YZ plane reveals that the RA was well corrected in the axial direction after axial correction (Figure 4c), and the PA MAP image of the XY plane reveals that the RA was well corrected in the lateral direction after lateral correction (Figure 4d). In the PA MAP images of the YZ and XY planes, the white arrow represents the RA and the white dotted line corresponds to the B-mode US/PA and US/PA sO2 image positions (Figure 4b). The B-mode PA structural and PA sO2 images of the upper boundaries of the RA are superimposed on B-mode US images. For both the B-mode US/PA and US/PA sO2 images, the images are observed to improve gradually, similar to the original image, as the motion correction progresses. In particular, in the case of the US/PA sO2 image (Figure 4d) containing motion artifacts, the sO2 value is close to zero because of motion artifacts. However, following complete motion correction (Figure 4e), the sO2 value becomes nearly equal to the original value, confirming the success of motion correction.
The CCs quantified based on the PA MAP images on the YZ and XY planes obtained via the image-processing procedures are depicted in Figure 4f. The CCs of the PA MAP images on the YZ plane are 1, 0.79, 0.92, and 0.93, respectively, in the order of image processing methods, while those of the PA MAP images on the XY plane are 1, 0.70, 0.72, and 0.98, respectively. These values confirm that the structural similarity eventually improves with progressive motion compensation. The average PA sO2 values are 92.9 ± 9.2, 65.3 ± 33.4, 80.4 ± 21.0, and 92.5 ± 9.6%, respectively, in the image processing order (Figure 4g). The average PA sO2 values in the RAs also corroborate that the accuracy of spectral unmixing gradually improves with progressive motion compensation.

4. Conclusions

In this paper, we propose a new motion compensation method for 3D multispectral PA imaging. Motion compensation is implemented in systematic order using simultaneously acquired US images. The potential of the proposed motion compensation system is confirmed using a tissue-mimicking phantom and in vivo human experiments, both qualitatively and quantitatively. In particular, the accuracy of the spectral unmixing process is improved significantly using the proposed motion correction methodology.
During the acquisition of 3D US/PA images in practical environments, several motion contaminants can occur, induced by factors such as the operator’s breathing and hand tremors, as well as the patient’s breathing and body tremors. Moreover, imaging close to the heart or neck can suffer from motion contamination due to breathing and heartbeat, which can be prevented using an electrocardiogram (ECG) sensor [60]. However, the overall system using ECG becomes more complex, and the influence of other motion pollutants cannot be excluded. Our results indicate that motion compensation using US images can be used in actual clinical environments, where various motion contaminations occur. In future works, we intend to apply motion compensation to 3D multispectral PA images of various diseases such as carotid artery disease, thyroid cancer, and breast cancer in clinical practice.

Author Contributions

Data curation, C.Y., C.L., K.S. and C.K.; writing—original draft preparation, C.Y., C.L., K.S. and C.K.; writing—review and editing, C.Y., C.L., K.S. and C.K.; supervision, K.S. and C.K.; project administration, C.K.; funding acquisition, K.S. and C.K. All authors have read and agreed to the published version of the manuscript.

Funding

This research was performed in cooperation with the Pohang University of Science and Technology (POSTECH)-LIG Nex1 Cooperation (Y21-C012), the National Research Foundation of Korea (NRF) grant funded by the Korean government(MSIT) (NRF-2019R1A2C2006269), the Korea Medical Device Development Fund grant funded by the Korean government (the Ministry of Trade, Industry and Energy) (1711137875, RS-2020-KD000008), the Basic Science Research Program through the NRF funded by the Ministry of Education (2020R1A6A1A03047902), the National R&D Program through the NRF funded by the Ministry of Science and ICT(2021M3C1C3097624), and the BK21 FOUR program.

Institutional Review Board Statement

The experiments are performed following the protocols of the Institutional Review Board of the Pohang University of Science and Technology (POSTECH, PIRB-2020-E019).

Informed Consent Statement

Informed consent was obtained from all subjects involved in the study.

Data Availability Statement

The data presented in this study are available on request from the corresponding author.

Conflicts of Interest

Chulhong Kim has financial interests in OPTICHO, which, however, did not support this.

References

  1. Choi, W.; Park, E.-Y.; Jeon, S.; Kim, C. Clinical Photoacoustic Imaging Platforms. Biomed. Eng. Lett. 2018, 8, 139–155. [Google Scholar] [CrossRef] [PubMed]
  2. Wang, L.V.; Wu, H.-I. Biomedical Optics: Principles and Imaging; John Wiley & Sons: Hoboken, NJ, USA, 2012. [Google Scholar]
  3. Lutzweiler, C.; Razansky, D. Optoacoustic Imaging and Tomography: Reconstruction Approaches and Outstanding Challenges in Image Performance and Quantification. Sensors 2013, 13, 7345–7384. [Google Scholar] [CrossRef] [PubMed] [Green Version]
  4. Ntziachristos, V.; Razansky, D. Molecular Imaging by Means of Multispectral Optoacoustic Tomography (MSOT). Chem. Rev. 2010, 110, 2783–2794. [Google Scholar] [CrossRef] [PubMed]
  5. Kim, J.; Park, E.-Y.; Park, B.; Choi, W.; Lee, K.J.; Kim, C. Towards Clinical Photoacoustic and Ultrasound Imaging: Probe Improvement and Real-Time Graphical User Interface. Exp. Biol. Med. 2020, 245, 321–329. [Google Scholar] [CrossRef] [PubMed]
  6. Ahn, J.; Baik, J.W.; Kim, Y.; Choi, K.; Park, J.; Kim, H.; Kim, J.Y.; Kim, H.H.; Nam, S.H.; Kim, C. Fully Integrated Photoacoustic Microscopy and Photoplethysmography of Human in Vivo. Photoacoustics 2022, 27, 100374. [Google Scholar] [CrossRef]
  7. Park, B.; Park, S.; Kim, J.; Kim, C. Listening to Drug Delivery and Responses via Photoacoustic Imaging. Adv. Drug Deliv. Rev. 2022, 184, 114235. [Google Scholar] [CrossRef]
  8. Park, J.; Park, B.; Kim, T.Y.; Jung, S.; Choi, W.J.; Ahn, J.; Yoon, D.H.; Kim, J.; Jeon, S.; Lee, D.; et al. Quadruple Ultrasound, Photoacoustic, Optical Coherence, and Fluorescence Fusion Imaging with a Transparent Ultrasound Transducer. Proc. Natl. Acad. Sci. USA 2021, 118, e1920879118. [Google Scholar] [CrossRef]
  9. Baik, J.W.; Kim, H.; Son, M.; Choi, J.; Kim, K.G.; Baek, J.H.; Park, Y.H.; An, J.; Choi, H.Y.; Ryu, S.Y.; et al. Intraoperative Label-Free Photoacoustic Histopathology of Clinical Specimens. Laser Photon. Rev. 2021, 15, 2100124. [Google Scholar] [CrossRef]
  10. Hosseinaee, Z.; Le, M.; Bell, K.; Reza, P.H. Towards Non-Contact Photoacoustic Imaging [Review]. Photoacoustics 2020, 20, 100207. [Google Scholar] [CrossRef]
  11. Kim, M.; Lee, K.W.; Kim, K.; Gulenko, O.; Lee, C.; Keum, B.; Chun, H.J.; Choi, H.S.; Kim, C.U.; Yang, J.-M. Intra-Instrument Channel Workable, Optical-Resolution Photoacoustic and Ultrasonic Mini-Probe System for Gastrointestinal Endoscopy. Photoacoustics 2022, 26, 100346. [Google Scholar] [CrossRef]
  12. Huang, G.; Lv, J.; He, Y.; Yang, J.; Zeng, L.; Nie, L. In Vivo Quantitative Photoacoustic Evaluation of the Liver and Kidney Pathology in Tyrosinemia. Photoacoustics 2022, 28, 100410. [Google Scholar] [CrossRef]
  13. Lyu, T.; Yang, C.; Gao, F.; Gao, F. 3D Photoacoustic Simulation of Human Skin Vascular for Quantitative Image Analysis. In Proceedings of the 2021 IEEE International Ultrasonics Symposium (IUS), Xi’an, China, 11 September 2021; pp. 1–3. [Google Scholar]
  14. Liu, C.; Wang, L. Functional Photoacoustic Microscopy of Hemodynamics: A Review. Biomed. Eng. Lett. 2022, 12, 97–124. [Google Scholar] [CrossRef]
  15. Tang, Y.; Wu, H.; Klippel, P.; Zhang, B.; Huang, H.-Y.S.; Jing, Y.; Jiang, X.; Yao, J. Deep Thrombosis Characterization Using Photoacoustic Imaging with Intravascular Light Delivery. Biomed. Eng. Lett. 2022, 12, 135–145. [Google Scholar] [CrossRef]
  16. Allen, T.J.; Hall, A.; Dhillon, A.P.; Owen, J.S.; Beard, P.C. Spectroscopic Photoacoustic Imaging of Lipid-Rich Plaques in the Human Aorta in the 740 to 1400 Nm Wavelength Range. J. Biomed. Opt. 2012, 17, 061209. [Google Scholar] [CrossRef]
  17. Cox, B.T.; Arridge, S.R.; Beard, P.C. Estimating Chromophore Distributions from Multiwavelength Photoacoustic Images. J. Opt. Soc. Am. A 2009, 26, 443. [Google Scholar] [CrossRef] [Green Version]
  18. Kim, J.; Kim, Y.H.; Park, B.; Seo, H.-M.; Bang, C.H.; Park, G.S.; Park, Y.M.; Rhie, J.W.; Lee, J.H.; Kim, C. Multispectral Ex Vivo Photoacoustic Imaging of Cutaneous Melanoma for Better Selection of the Excision Margin. Br. J. Dermatol. 2018, 179, 780–782. [Google Scholar] [CrossRef]
  19. Han, S.; Lee, H.; Kim, C.; Kim, J. Review on Multispectral Photoacoustic Analysis of Cancer: Thyroid and Breast. Metabolites 2022, 12, 382. [Google Scholar] [CrossRef]
  20. Park, B.; Han, M.; Park, J.; Kim, T.; Ryu, H.; Seo, Y.; Kim, W.J.; Kim, H.H.; Kim, C. A Photoacoustic Finder Fully Integrated with a Solid-State Dye Laser and Transparent Ultrasound Transducer. Photoacoustics 2021, 23, 100290. [Google Scholar] [CrossRef]
  21. Choi, W.; Park, E.-Y.; Jeon, S.; Yang, Y.; Park, B.; Ahn, J.; Cho, S.; Lee, C.; Seo, D.-K.; Cho, J.-H.; et al. Three-Dimensional Multistructural Quantitative Photoacoustic and US Imaging of Human Feet in Vivo. Radiology 2022, 303, 467–473. [Google Scholar] [CrossRef]
  22. Attia, A.B.E.; Moothanchery, M.; Li, X.; Yew, Y.W.; Thng, S.T.G.; Dinish, U.S.; Olivo, M. Microvascular Imaging and Monitoring of Hemodynamic Changes in the Skin during Arterial-Venous Occlusion Using Multispectral Raster-Scanning Optoacoustic Mesoscopy. Photoacoustics 2021, 22, 100268. [Google Scholar] [CrossRef]
  23. Ahn, J.; Kim, J.Y.; Choi, W.; Kim, C. High-Resolution Functional Photoacoustic Monitoring of Vascular Dynamics in Human Fingers. Photoacoustics 2021, 23, 100282. [Google Scholar] [CrossRef] [PubMed]
  24. Dasa, M.K.; Nteroli, G.; Bowen, P.; Messa, G.; Feng, Y.; Petersen, C.R.; Koutsikou, S.; Bondu, M.; Moselund, P.M.; Podoleanu, A.; et al. All-Fibre Supercontinuum Laser for in Vivo Multispectral Photoacoustic Microscopy of Lipids in the Extended near-Infrared Region. Photoacoustics 2020, 18, 100163. [Google Scholar] [CrossRef] [PubMed]
  25. Lei, S.; Zhang, J.; Blum, N.T.; Li, M.; Zhang, D.-Y.; Yin, W.; Zhao, F.; Lin, J.; Huang, P. In Vivo Three-Dimensional Multispectral Photoacoustic Imaging of Dual Enzyme-Driven Cyclic Cascade Reaction for Tumor Catalytic Therapy. Nat. Commun. 2022, 13, 1298. [Google Scholar] [CrossRef] [PubMed]
  26. Menger, M.M.; Körbel, C.; Bauer, D.; Bleimehl, M.; Tobias, A.L.; Braun, B.J.; Herath, S.C.; Rollmann, M.F.; Laschke, M.W.; Menger, M.D.; et al. Photoacoustic Imaging for the Study of Oxygen Saturation and Total Hemoglobin in Bone Healing and Non-Union Formation. Photoacoustics 2022, 28, 100409. [Google Scholar] [CrossRef]
  27. Bhutiani, N.; Samykutty, A.; McMasters, K.M.; Egilmez, N.K.; McNally, L.R. In Vivo Tracking of Orally-Administered Particles within the Gastrointestinal Tract of Murine Models Using Multispectral Optoacoustic Tomography. Photoacoustics 2019, 13, 46–52. [Google Scholar] [CrossRef]
  28. Karlas, A.; Kallmayer, M.; Bariotakis, M.; Fasoula, N.-A.; Liapis, E.; Hyafil, F.; Pelisek, J.; Wildgruber, M.; Eckstein, H.-H.; Ntziachristos, V. Multispectral Optoacoustic Tomography of Lipid and Hemoglobin Contrast in Human Carotid Atherosclerosis. Photoacoustics 2021, 23, 100283. [Google Scholar] [CrossRef]
  29. Attia, A.B.E.; Balasundaram, G.; Moothanchery, M.; Dinish, U.S.; Bi, R.; Ntziachristos, V.; Olivo, M. A Review of Clinical Photoacoustic Imaging: Current and Future Trends. Photoacoustics 2019, 16, 100144. [Google Scholar] [CrossRef]
  30. Valluru, K.S.; Willmann, J.K. Clinical Photoacoustic Imaging of Cancer. Ultrasonography 2016, 35, 267–280. [Google Scholar] [CrossRef] [Green Version]
  31. Valluru, K.S.; Wilson, K.E.; Willmann, J.K. Photoacoustic Imaging in Oncology: Translational Preclinical and Early Clinical Experience. Radiology 2016, 280, 332–349. [Google Scholar] [CrossRef] [Green Version]
  32. Taruttis, A.; Ntziachristos, V. Advances in Real-Time Multispectral Optoacoustic Imaging and Its Applications. Nat. Photonics 2015, 9, 219–227. [Google Scholar] [CrossRef]
  33. Karlas, A.; Masthoff, M.; Kallmayer, M.; Helfen, A.; Bariotakis, M.; Fasoula, N.A.; Schäfers, M.; Seidensticker, M.; Eckstein, H.-H.; Ntziachristos, V.; et al. Multispectral Optoacoustic Tomography of Peripheral Arterial Disease Based on Muscle Hemoglobin Gradients—A Pilot Clinical Study. Ann. Transl. Med. 2021, 9, 36. [Google Scholar] [CrossRef]
  34. Karlas, A.; Kallmayer, M.; Fasoula, N.; Liapis, E.; Bariotakis, M.; Krönke, M.; Anastasopoulou, M.; Reber, J.; Eckstein, H.; Ntziachristos, V. Multispectral Optoacoustic Tomography of Muscle Perfusion and Oxygenation under Arterial and Venous Occlusion: A Human Pilot Study. J. Biophotonics 2020, 13, e201960169. [Google Scholar] [CrossRef]
  35. Lavaud, J.; Henry, M.; Gayet, P.; Fertin, A.; Vollaire, J.; Usson, Y.; Coll, J.-L.; Josserand, V. Noninvasive Monitoring of Liver Metastasis Development via Combined Multispectral Photoacoustic Imaging and Fluorescence Diffuse Optical Tomography. Int. J. Biol. Sci. 2020, 16, 1616–1628. [Google Scholar] [CrossRef] [Green Version]
  36. Lee, C.; Choi, W.; Kim, J.; Kim, C. Three-Dimensional Clinical Handheld Photoacoustic/Ultrasound Scanner. Photoacoustics 2020, 18, 100173. [Google Scholar] [CrossRef]
  37. Park, B.; Bang, C.H.; Lee, C.; Han, J.H.; Choi, W.; Kim, J.; Park, G.S.; Rhie, J.W.; Lee, J.H.; Kim, C. 3D Wide-field Multispectral Photoacoustic Imaging of Human Melanomas in Vivo: A Pilot Study. J. Eur. Acad. Dermatol. Venereol. 2021, 35, 669–676. [Google Scholar] [CrossRef]
  38. Yang, C.; Lan, H.; Gao, F.; Gao, F. Review of Deep Learning for Photoacoustic Imaging. Photoacoustics 2021, 21, 100215. [Google Scholar] [CrossRef]
  39. Rajendran, P.; Sharma, A.; Pramanik, M. Photoacoustic Imaging Aided with Deep Learning: A Review. Biomed. Eng. Lett. 2022, 12, 155–173. [Google Scholar] [CrossRef]
  40. Kim, J.; Kim, G.; Li, L.; Zhang, P.; Kim, J.Y.; Kim, Y.; Kim, H.H.; Wang, L.V.; Lee, S.; Kim, C. Deep Learning Acceleration of Multiscale Superresolution Localization Photoacoustic Imaging. Light Sci. Appl. 2022, 11, 131. [Google Scholar] [CrossRef]
  41. Choi, S.; Yang, J.; Lee, S.Y.; Kim, J.; Lee, J.; Kim, W.J.; Lee, S.; Kim, C. Deep Learning Enhances Multiparametric Dynamic Volumetric Photoacoustic Computed Tomography in Vivo (DL-PACT). Adv. Sci. 2022, 2202089. [Google Scholar] [CrossRef]
  42. Awasthi, N.; Jain, G.; Kalva, S.K.; Pramanik, M.; Yalavarthy, P.K. Deep Neural Network-Based Sinogram Super-Resolution and Bandwidth Enhancement for Limited-Data Photoacoustic Tomography. IEEE Trans. Ultrason. Ferroelectr. Freq. Control 2020, 67, 2660–2673. [Google Scholar] [CrossRef]
  43. Benyamin, M.; Genish, H.; Califa, R.; Wolbromsky, L.; Ganani, M.; Wang, Z.; Zhou, S.; Xie, Z.; Zalevsky, Z. Autoencoder Based Blind Source Separation for Photoacoustic Resolution Enhancement. Sci. Rep. 2020, 10, 21414. [Google Scholar] [CrossRef]
  44. Zheng, W.; Huang, C.; Zhang, H.; Xia, J. Slit-Based Photoacoustic Tomography with Co-Planar Light Illumination and Acoustic Detection for High-Resolution Vascular Imaging in Human Using a Linear Transducer Array. Biomed. Eng. Lett. 2022, 12, 125–133. [Google Scholar] [CrossRef]
  45. Erlöv, T.; Sheikh, R.; Dahlstrand, U.; Albinsson, J.; Malmsjö, M.; Cinthio, M. Regional Motion Correction for in Vivo Photoacoustic Imaging in Humans Using Interleaved Ultrasound Images. Biomed. Opt. Express 2021, 12, 3312. [Google Scholar] [CrossRef]
  46. Mozaffarzadeh, M.; Moore, C.; Golmoghani, E.B.; Mantri, Y.; Hariri, A.; Jorns, A.; Fu, L.; Verweij, M.D.; Orooji, M.; de Jong, N.; et al. Motion-Compensated Noninvasive Periodontal Health Monitoring Using Handheld and Motor-Based Photoacoustic-Ultrasound Imaging Systems. Biomed. Opt. Express 2021, 12, 1543. [Google Scholar] [CrossRef]
  47. Lee, H.; Han, S.; Park, S.; Cho, S.; Yoo, J.; Kim, C.; Kim, J. Ultrasound-Guided Breath-Compensation in Single-Element Photoacoustic Imaging for Three-Dimensional Whole-Body Images of Mice. Front. Phys. 2022, 10, 894837. [Google Scholar] [CrossRef]
  48. Kirchner, T.; Gröhl, J.; Sattler, F.; Bischoff, M.S.; Laha, A.; Nolden, M.; Maier-Hein, L. An Open-Source Software Platform for Translational Photoacoustic Research and Its Application to Motion-Corrected Blood Oxygenation Estimation. arXiv 2019, arXiv:1901.09781. [Google Scholar]
  49. Choi, W.; Oh, D.; Kim, C. Practical Photoacoustic Tomography: Realistic Limitations and Technical Solutions. J. Appl. Phys. 2020, 127, 230903. [Google Scholar] [CrossRef]
  50. Wang, Z.; Bovik, A.C.; Sheikh, H.R.; Simoncelli, E.P. Image Quality Assessment: From Error Visibility to Structural Similarity. IEEE Trans. Image Process. 2004, 13, 600–612. [Google Scholar] [CrossRef] [Green Version]
  51. Jeon, S.; Park, E.-Y.; Choi, W.; Managuli, R.; Lee, K.; Kim, C. Real-Time Delay-Multiply-and-Sum Beamforming with Coherence Factor for in Vivo Clinical Photoacoustic Imaging of Humans. Photoacoustics 2019, 15, 100136. [Google Scholar] [CrossRef] [PubMed]
  52. Cho, S.; Jeon, S.; Choi, W.; Managuli, R.; Kim, C. Nonlinear Pth Root Spectral Magnitude Scaling Beamforming for Clinical Photoacoustic and Ultrasound Imaging. Opt. Lett. 2020, 45, 4575. [Google Scholar] [CrossRef]
  53. Park, J.; Jeon, S.; Meng, J.; Song, L.; Lee, J.S.; Kim, C. Delay-Multiply-and-Sum-Based Synthetic Aperture Focusing in Photoacoustic Microscopy. J. Biomed. Opt. 2016, 21, 036010. [Google Scholar] [CrossRef]
  54. Jeon, S.; Choi, W.; Park, B.; Kim, C. A Deep Learning-Based Model That Reduces Speed of Sound Aberrations for Improved In Vivo Photoacoustic Imaging. IEEE Trans. Image Process. 2021, 30, 8773–8784. [Google Scholar] [CrossRef]
  55. De Luca, V.; Banerjee, J.; Hallack, A.; Kondo, S.; Makhinya, M.; Nouri, D.; Royer, L.; Cifor, A.; Dardenne, G.; Goksel, O.; et al. Evaluation of 2D and 3D Ultrasound Tracking Algorithms and Impact on Ultrasound-guided Liver Radiotherapy Margins. Med. Phys. 2018, 45, 4986–5003. [Google Scholar] [CrossRef]
  56. Liu, X.; Su, H.; Kang, S.; Kane, T.D.; Shekhar, R. Application of Single-Image Camera Calibration for Ultrasound Augmented Laparoscopic Visualization. In Medical Imaging 2015: Image-Guided Procedures, Robotic Interventions, and Modeling, Proceedings of the SPIE Medical Imaging, Orlando, FL, USA, 21–26 February 2015; Webster, R.J., Yaniv, Z.R., Eds.; SPIE: Bellingham, WA, USA, 2015; Volume 9415, p. 94151T. [Google Scholar]
  57. Sirbu, C.L.; Seiculescu, C.; Adrian Burdan, G.; Moga, T.; Daniel Caleanu, C. Evaluation of Tracking Algorithms for Contrast Enhanced Ultrasound Imaging Exploration. In Proceedings of the Australasian Computer Science Week 2022, Online, 14–18 February 2022; ACM: New York, NY, USA, 2022; pp. 161–167. [Google Scholar]
  58. Heinrich, M.P.; Jenkinson, M.; Bhushan, M.; Matin, T.; Gleeson, F.V.; Brady, S.M.; Schnabel, J.A. MIND: Modality Independent Neighbourhood Descriptor for Multi-Modal Deformable Registration. Med. Image Anal. 2012, 16, 1423–1435. [Google Scholar] [CrossRef]
  59. Kim, J.; Park, B.; Ha, J.; Steinberg, I.; Hooper, S.M.; Jeong, C.; Park, E.-Y.; Choi, W.; Liang, T.; Bae, J.S.; et al. Multiparametric Photoacoustic Analysis of Human Thyroid Cancers In Vivo. Cancer Res. 2021, 81, 4849–4860. [Google Scholar] [CrossRef]
  60. Vinegoni, C.; Lee, S.; Aguirre, A.D.; Weissleder, R. New Techniques for Motion-Artifact-Free in Vivo Cardiac Microscopy. Front. Physiol. 2015, 6, 147. [Google Scholar] [CrossRef]
Figure 1. (a) Photograph of a clinical handheld PA/US imaging system and a 3D handheld imaging scanner. (b) Schematics of the 3D handheld scanner. PA: photoacoustic; US: ultrasound; TR: ultrasound transducer; and FB: fiber bundles.
Biosensors 12 01092 g001
Figure 2. Schematics of (a) acquisition of 3D multi-wavelength PA/US images, (b) 3D PA/US signal and image processing, (c) axial motion compensation, and (d) lateral motion compensation. USp, USp(ref), and USp(comp) represent the pth acquired US image, the reference image for the following axial motion compensation of US image, and the axial-motion-compensated US image, respectively. Sn, Sn(MIND), Sn(average), and Sn(comp) represent the US images included in the nth scanning period, the MIND-corrected US images of the nth scanning period, the average US image of the nth scanning period, and the lateral-motion-compensated US images of the nth scanning period, respectively. USλ1, USλ2, and USλ3 represent the US images obtained at three optical wavelengths (756, 797, and 866 nm, respectively). Note that the US images are not affected by the optical wavelengths. PA: photoacoustic; US: ultrasound; ROI: region of interest; SSIM: the structural similarity index measure; and MIND: modality independent neighbourhood descriptor.
Biosensors 12 01092 g002aBiosensors 12 01092 g002b
Figure 3. (a) Photograph of the 3D handheld scanner placed on the phantom and the phantom schematics. #1-#3 represent three black threads at different depths of 9, 14, and 21 mm, respectively. Yellow and green boxes represent signal and noise areas, respectively. (b) Original and (c) artificially motion-disrupted photoacoustic (PA) images: the average B-mode PA images along the Y axis, and the PA maximum amplitude projection (MAP) images along the YZ and XY planes, respectively. The average B-mode PA images and PA MAP images along the YZ and XY planes after (d) axial and (e) lateral motion correction. The X, Y, and Z directions represent lateral, elevational, and axial directions, respectively. The boxes are selected to calculate peak signal-to-noise ratios (pSNRs). (f) The pSNRs of the black threads at the different depths calculated at each step of process. (g) The FWHMs of the black thread at 9 mm depth calculated at each step of process. (h) The cross-correlations (CCs) between the original PA images and others. The original images are used as references to calculate CCs. TR: ultrasound transducer; FB: fiber bundles.
Biosensors 12 01092 g003aBiosensors 12 01092 g003b
Figure 4. In vivo 3D multispectral PA/US imaging of a human wrist. (a) Photograph of the human wrist. The red dashed boxes represent the imaged regions. (b) Original and (c) artificially motion-disrupted photoacoustic (PA) maximum amplitude projection (MAP) images on the YZ and XY planes of the human wrist. The PA MAP images on the YZ and XY planes after (d) axial and (e) lateral motion correction. The X, Y, and Z directions represent lateral, elevational, and axial directions, respectively. B-mode US/PA and B-mode US/PA sO2 images of the human wrist are presented. The PA and PA sO2 images of the upper boundaries of radial arteries (RAs) are overlaid on the corresponding US images. White dashed lines in the MAP images correspond to B-mode US/PA and B-mode US/PA sO2 image positions. (f) The cross-correlations (CCs) between the original PA images and others. (g) The average PA sO2 values in the RAs. sO2: haemoglobin oxygen saturation.
Biosensors 12 01092 g004aBiosensors 12 01092 g004b
Publisher’s Note: MDPI stays neutral with regard to jurisdictional claims in published maps and institutional affiliations.

