Review

Fiber Optic Sensors: A Review for Glucose Measurement

by
José Luis Cano Perez
1,*,
Jaime Gutiérrez-Gutiérrez
2,*,
Christian Perezcampos Mayoral
1,
Eduardo L. Pérez-Campos
3,
Maria del Socorro Pina Canseco
3,
Lorenzo Tepech Carrillo
2,
Laura Pérez-Campos Mayoral
3,
Marciano Vargas Treviño
2,
Edmundo López Apreza
2 and
Roberto Rojas Laguna
4
1
Doctorado in Biociencias, Facultad de Medicina y Cirugia, Universidad Autónoma “Benito Juárez” de Oaxaca. Ex Hacienda de Aguilera S/N, Calz. San Felipe del Agua, Oaxaca de Juárez 68120, Mexico
2
Escuela de Sistemas Biologicos e Innovacion Tecnologica, Universidad Autónoma “Benito Juárez” de Oaxaca (ESBIT-UABJO), Av. Universidad S/N, Ex-Hacienda 5 Señores, Oaxaca de Juárez 68120, Mexico
3
Facultad de Medicina y Cirugia, Universidad Autónoma “Benito Juárez” de Oaxaca. Ex Hacienda de Aguilera S/N, Calz. San Felipe del Agua, Oaxaca de Juárez 68120, Mexico
4
Division de Ingenierias, Campus Irapuato-Salamanca, Universidad de Guanajuato, Carretera Salamanca-Valle de Santiago km 3.5 + 1.8, Comunidad de Palo Blanco, Salamanca 36885, Mexico
*
Authors to whom correspondence should be addressed.
Biosensors 2021, 11(3), 61; https://doi.org/10.3390/bios11030061
Submission received: 9 January 2021 / Revised: 20 February 2021 / Accepted: 22 February 2021 / Published: 25 February 2021
(This article belongs to the Special Issue Sensors for the Detection of Biomarkers)

Abstract

:
Diabetes mellitus is a chronic metabolic disorder, being globally one of the most deadly diseases. This disease requires continually monitoring of the body’s glucose levels. There are different types of sensors for measuring glucose, most of them invasive to the patient. Fiber optic sensors have been proven to have advantages compared to conventional sensors and they have great potential for various applications, especially in the biomedical area. Compared to other sensors, they are smaller, easy to handle, mostly non-invasive, thus leading to a lower risk of infection, high precision, well correlated and inexpensive. The objective of this review article is to compare different types of fiber optic sensors made with different experimental techniques applied to biomedicine, especially for glucose sensing. Observations are made on the way of elaboration, as well as the advantages and disadvantages that each one could have in real applications.

1. Introduction

Today, the measurement of glucose levels, whether in humans, animals or plants, is an activity that is carried out all the time with the aim of improving patterns, quality levels, and even leading to a better standard of living. Blood studies in medicine are commonly used for all human beings, and these results are compared and analyzed to validate the health status of each individual [1].
Diabetes is a disease that is growing at an accelerated rate throughout the world, which makes it a major health problem. The annual cost associated with managing diabetes will reach $490 billion in 2030 [2]. In 2004, the WHO estimated that the number of human beings with diabetes would increase, reaching a figure of 171 million in 2000 to 366 million in 2030 [3], while estimates from the International Diabetes Federation report 372 million diabetics in 2012 and forecast 552 million by 2030 [4,5]. It is suggested that it is necessary for people with type 1 diabetes to control their glucose two hours before and after each meal, before sleeping and at 3:00 in the morning, that is, 7 times a day: This is according to the Official Mexican Standard for the Prevention, Treatment and Control of Diabetes (NOM-015-SSA2-2010).
Commercial glucose sensors are based on puncture tests, which should be performed, as mentioned, up to 7 times a day [6]. Unfortunately, the pain, risk of infections and discomfort caused by punctures in each glucose measurement cause patients to only measure their glucose level a few times or as needed [7]. A normal person’s blood glucose concentration range is between 80 to 120 mg/dL (4.4 to 6.6 mM). A person who has more than 126 mg/dL fasting and 200 mg/dL after 2 h of eating food is considered to have hyperglycemia, and everyone who has below 54 mg/dL is considered hypoglycemic [8].
The most widely used conventional sensors for glucose control are glucometers [9], which represent a proven and mature technology that offers good sensitivity and accurate measurements in a short time. However, their follow-up method has certain disadvantages, since they require a lancet to puncture the skin and obtain a blood sample, which is then deposited on a test strip to give the result. This method makes said lancet and strip reactive once used and they must be discarded, which makes it have a substantial market for a value of $6.1 billion [10]. It is also necessary to check the expiration dates of these test strips, since after this date they may give incorrect measurement results.
Technology today can make non-invasive (NI) glucose monitoring systems [11]. Fiber optic sensors have been developed for numerous physical variables, these include thermal, mechanical and electrical magnitudes, such as temperature [12], strain [13], pressure [14], vibration [15], glucose [16], current [17] and voltage [18,19]. Fiber optic sensors can be characterized in various ways to obtain higher sensitivity, such as photonic crystal fibers [20], fiber ball [21], S-shaped fibers [22], U-shaped fibers [23], with physical modifications [24], chemical attacks [25] to the same optical fiber, so that these sensors are not disposable every time monitoring is required. Additionally one of the characteristics of these sensors is that they can be developed with the different types of fiber optics that exist.
Detecting glucose without invading or doing so by a painful means, causing some discomfort or risk to a patient is a challenge for technology, making it an important research point today. That is why Smith classified the means of detection into two groups: the minimally invasive (MI) [26,27] and the non-invasive (NI) [28,29]. Devices that use MI technology are those that need to obtain some kind of fluid or fluid from the body (blood [30,31], tears [32,33], sweat [34,35], urine [36,37,38], saliva [39,40,41], among others) in order to obtain glucose concentration, while devices using NI technology only depend on radiation without the need for a body fluid or liquid.
Within glucose detection technologies we can find electrical methods, which take advantage of the dielectric properties of glucose at low frequencies and thus use electromagnetic radiation together with the current [42,43]. In this review, however, the objective is to discuss the work carried out for glucose measurement by means of sensors using fiber optics, a field that has made use of nanotechnology and currently the techniques of SPR and fluorescence have begun to be investigated, in combination with optical techniques.
These and many other devices have often failed to give the desired results, so they are many unmet expectations of whether it is possible to measure glucose in a NI way, since devices that use MI techniques have been used for continuous monitoring [44,45,46,47], those in the market have some disadvantages such as the need to continuously calibrate them or time of use, but with the advantage that these are not as sensitive to the need for controlled environment conditions as NI devices can be.

2. Sensor Principles

2.1. Fiber Optic Taper Working Principle

In an optical fiber, a light wave propagates not only in the core but also in the cladding. The latter component is called an evanescent wave, which decays rapidly with increasing distance from the fiber axis, so a fraction of the incident light reflected and refracted is given by Fresnel’s coefficients and depends on the angle of incidence and refractive indices of the core and cladding [48]. Therefore, when an optical fiber is tapered both the cladding and core diameter are reduced in size, and this increases the intensity output of light waves. When the light passes through the tapers lower and higher order modes are generated due to the core and cladding size [16]. The higher order modes are generated easily formed in tapers in form of evanescent waves (EW) due to the fact the core and cladding medium are smaller, see Figure 1 [21,49]. The EWs attenuate to 1/e during propagation distance into taper, which is known as the penetration depth [16,50]:
d p = λ 2 π n c o 2   sin θ t 2   n c l 2
where λ is the wavelength of the light, θ is the angle of incidence at the interface between the core and the cladding, and n c o and n c l are the refractive indices of the core and cladding, respectively.
The number of modes that can propagate into fiber is related to the normalized frequency V value [16]:
V = 2 π α λ n c o 2 n c l 2
where α is the radius of the core. The condition for the single-mode fiber is V < 2.405 for only the fundamental mode. However, in the tapered fiber transition region various modes can exist at the same time, because the value of V depends on the excitation of the modes, due to the difference in the refractive indices, therefore, the V value of the cladding increases beyond the cutoff value as [16]:
V c l ( z ) = 2 π α ( z ) λ n c l 2 n e x 2
where n e x represents the refractive index of the external medium.
The tapers allow the coupling between the cores and cladding modes when a broad light source propagates into the tapered region zone. There are adiabatic and non-adiabatic taper structures: A tapered fiber will be adiabatic when the transmission loss is almost negligible due to the fact that the energy maximum remains in the fundamental mode H E 11 (it can go up to 99.5%) and on little energy goes into the excited high-order modes [51]. However, when the taper angle is large enough, the coupling length between the fundamental and higher order cladding mode is said to be non-adiabatically tapered. Therefore, the total transmission is due to the fundamental mode H E 11 and the high order modes H E 12 are stronger [52,53].
Now, the depth of penetration at the interface of the lining and the surrounding medium can be calculated as follows [54]:
d p l = λ 2 π n c l 2 sin   θ i   n e x 2

2.2. U-Shaped Fiber Optic Working Principle

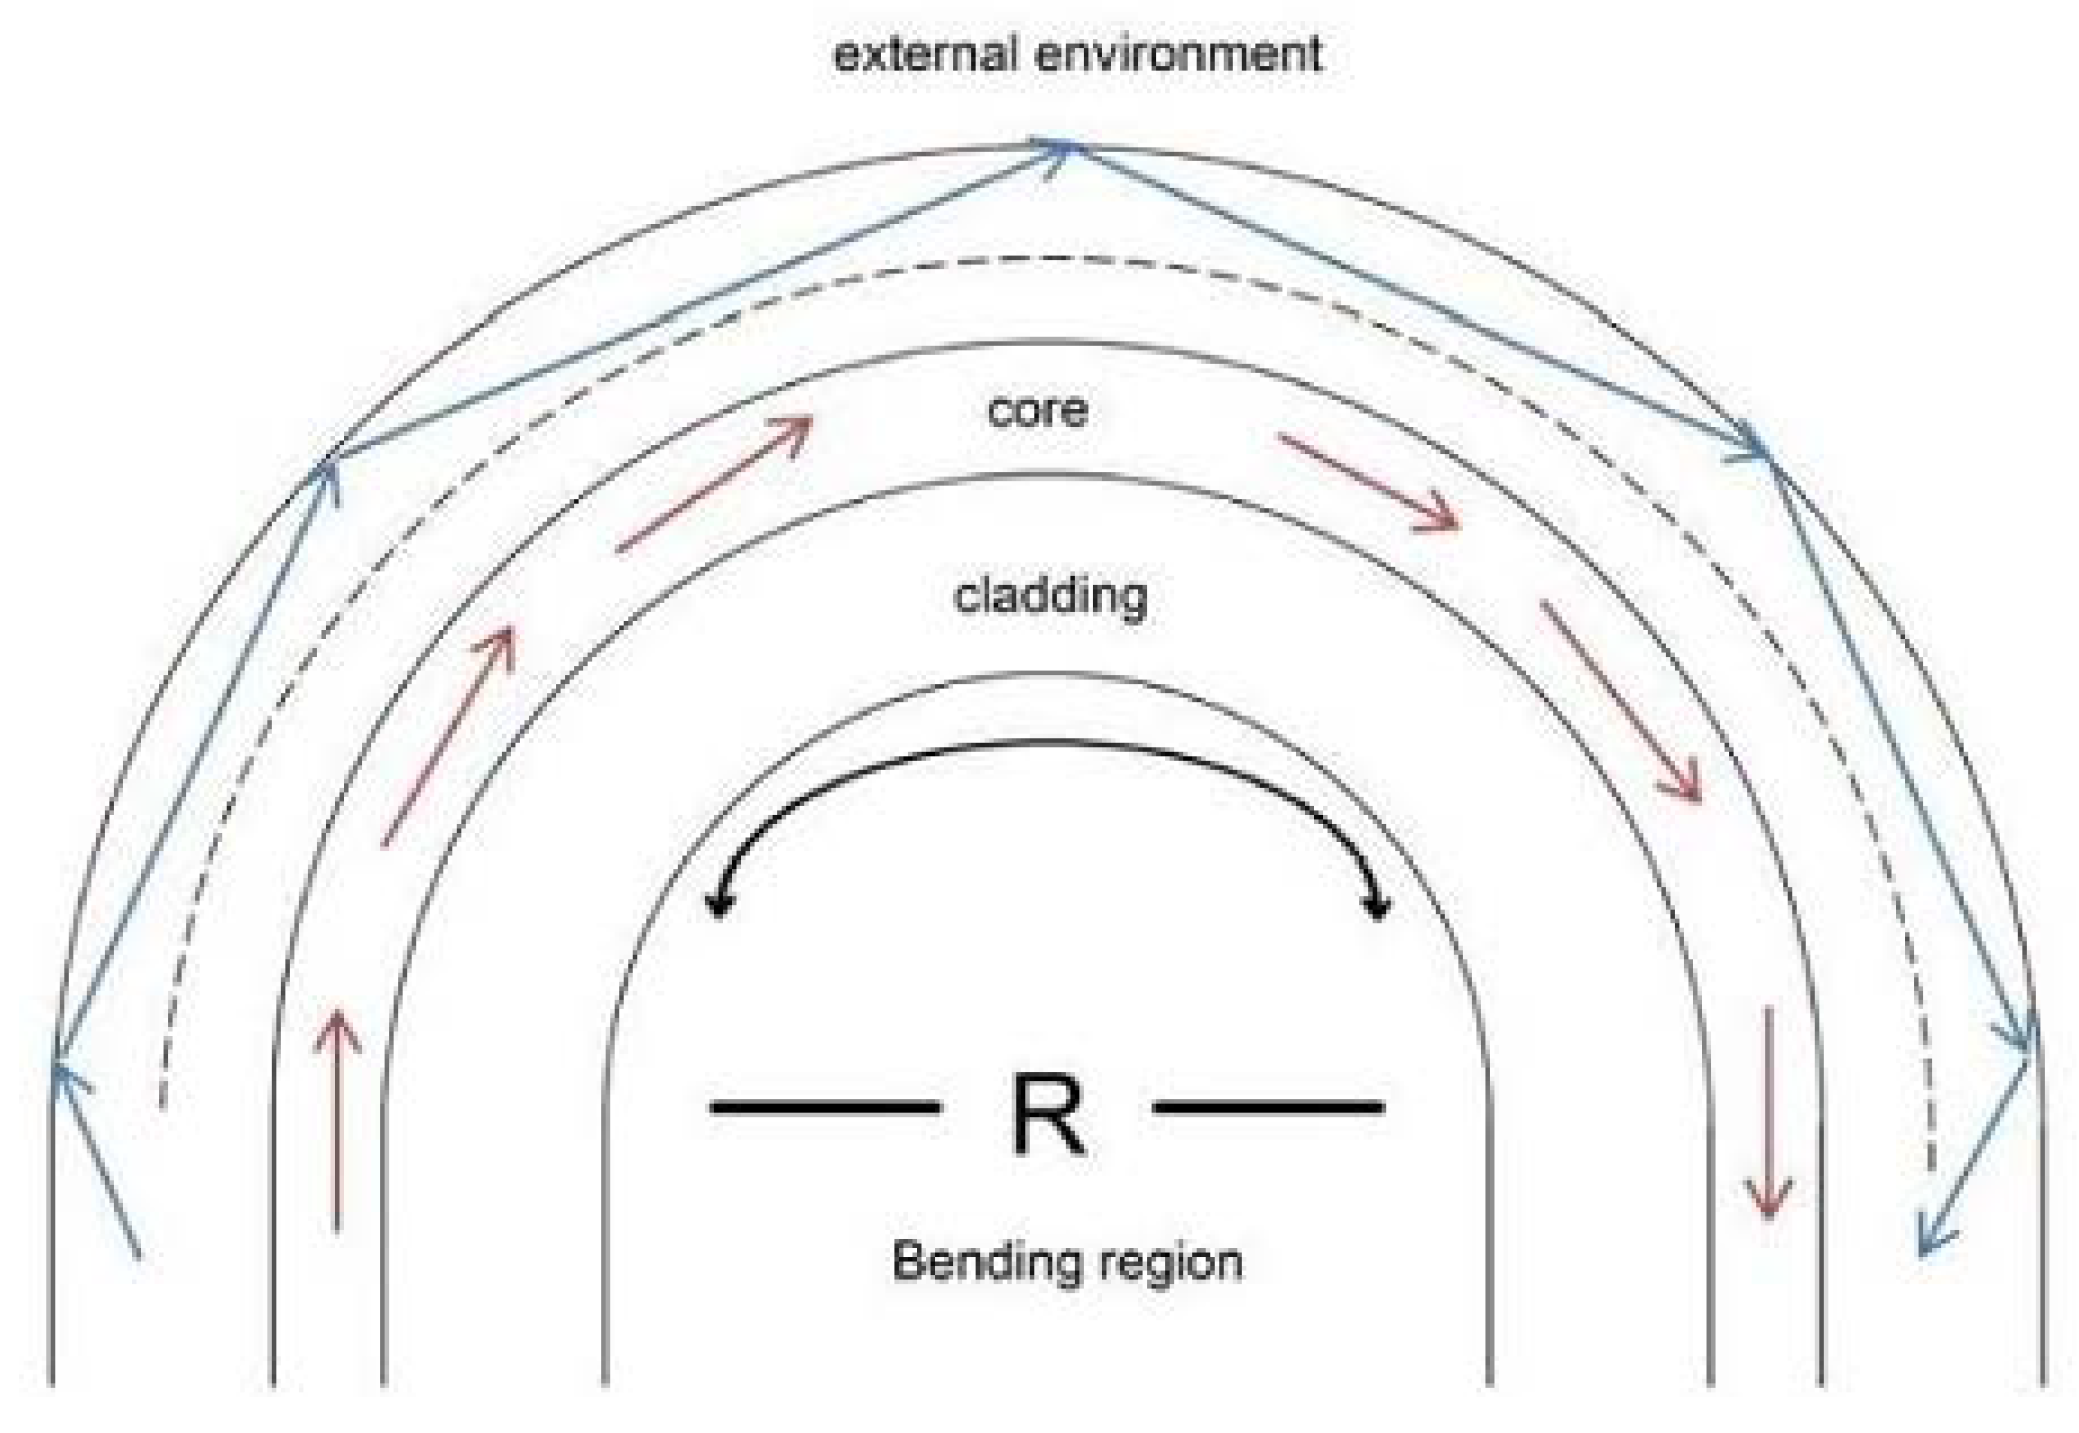
As well known, optical fibers have several distinct advantages such as low cost, small size, flexibility and remote sensing opportunities. When there is at least one degree in the radius of curvature in an optical fiber it is possible to observe interference phenomena in the spectrum. When the light source hits the part of the curve in the optical fiber, a light leakage is generated because the core layer of the fiber and the interface of the cladding layer of the curved part already do not maintain total reflection, as shown in Figure 2 [23].
U-shape bending is generally done on uniform fibers so that core radius decreases, which results in the propagation of high order modes. The light is launched from one end of the fiber and is detected at the other end. The transmitted power depends of the loss of the evanescent field penetration in the bending region. However, there is some lights are reflected on the cladding-air interface, giving rise to the radiation. The reflected light in the cladding is known as the whispering gallery mode (WGM) [55]. The Mach-Zehnder interferometer model can be used to calculate the output interference pattern due to the coupling of the WGM and core mode [56]. Therefore, the interference spectrum in a U-shaped fiber optic light intensity sensor is [57]:
I = I c o + I w i s + 2 I c o +   I w i s   cos   ( ϕ )  
where I c o and I w i s are the light energy intensity of the core mode and the WGM, respectively, and ϕ is the phase difference between the cladding mode and WGM. The expression is given [53,56,57]:
ϕ = N [ 2 π λ ( n c l 2 L   n e f f , c o Z ) + ϕ r ]   = ( 2 k + 1 ) π
where N is the number of reflections of the WGM on the cladding-air interface at the bending region, L is half of the path length between two reflection points, and n e f f , c o is the effective refractive indices of the core mode, Z is the arc length of the core, n c l are the refractive index core base mode and m level cladding mode, ϕ r is the change in phase at the cladding-air interface and k is an integer [58].
The transmission wavelength dip at which destructive interference occurs at kth order of the resonance WGM, and can be expressed as [15,59,60]:
λ r e s , W G M =   2 Δ n e f f R 2 k + 1
where Δ n e f f is the difference of the effective refractive indices between the core mode and kth order cladding mode. Therefore, the transmission spectrum produces multiple resonance WGM wavelengths [61].

2.3. Surface Plasmon Resonance (SPR)

Surface plasmon resonance happens when the interface of a highly conductive metal and dielectric material are excited by an electromagnetic field, and this resulting field decays exponentially, making it is very sensitive to changes in the refractive index of the surrounding environment [62].
The propagation constant field of a surface plasmon β s p propagating along a planar boundary between a semi-infinite metal with a complex permittivity ε m = ε m + i ε m and a semi-infinite dielectric with a refractive index n is expressed by [63]:
β s p = ω c n 2 ε m n 2 + ε m
where ω is the angular frequency and c is the speed of light in the vacuum.
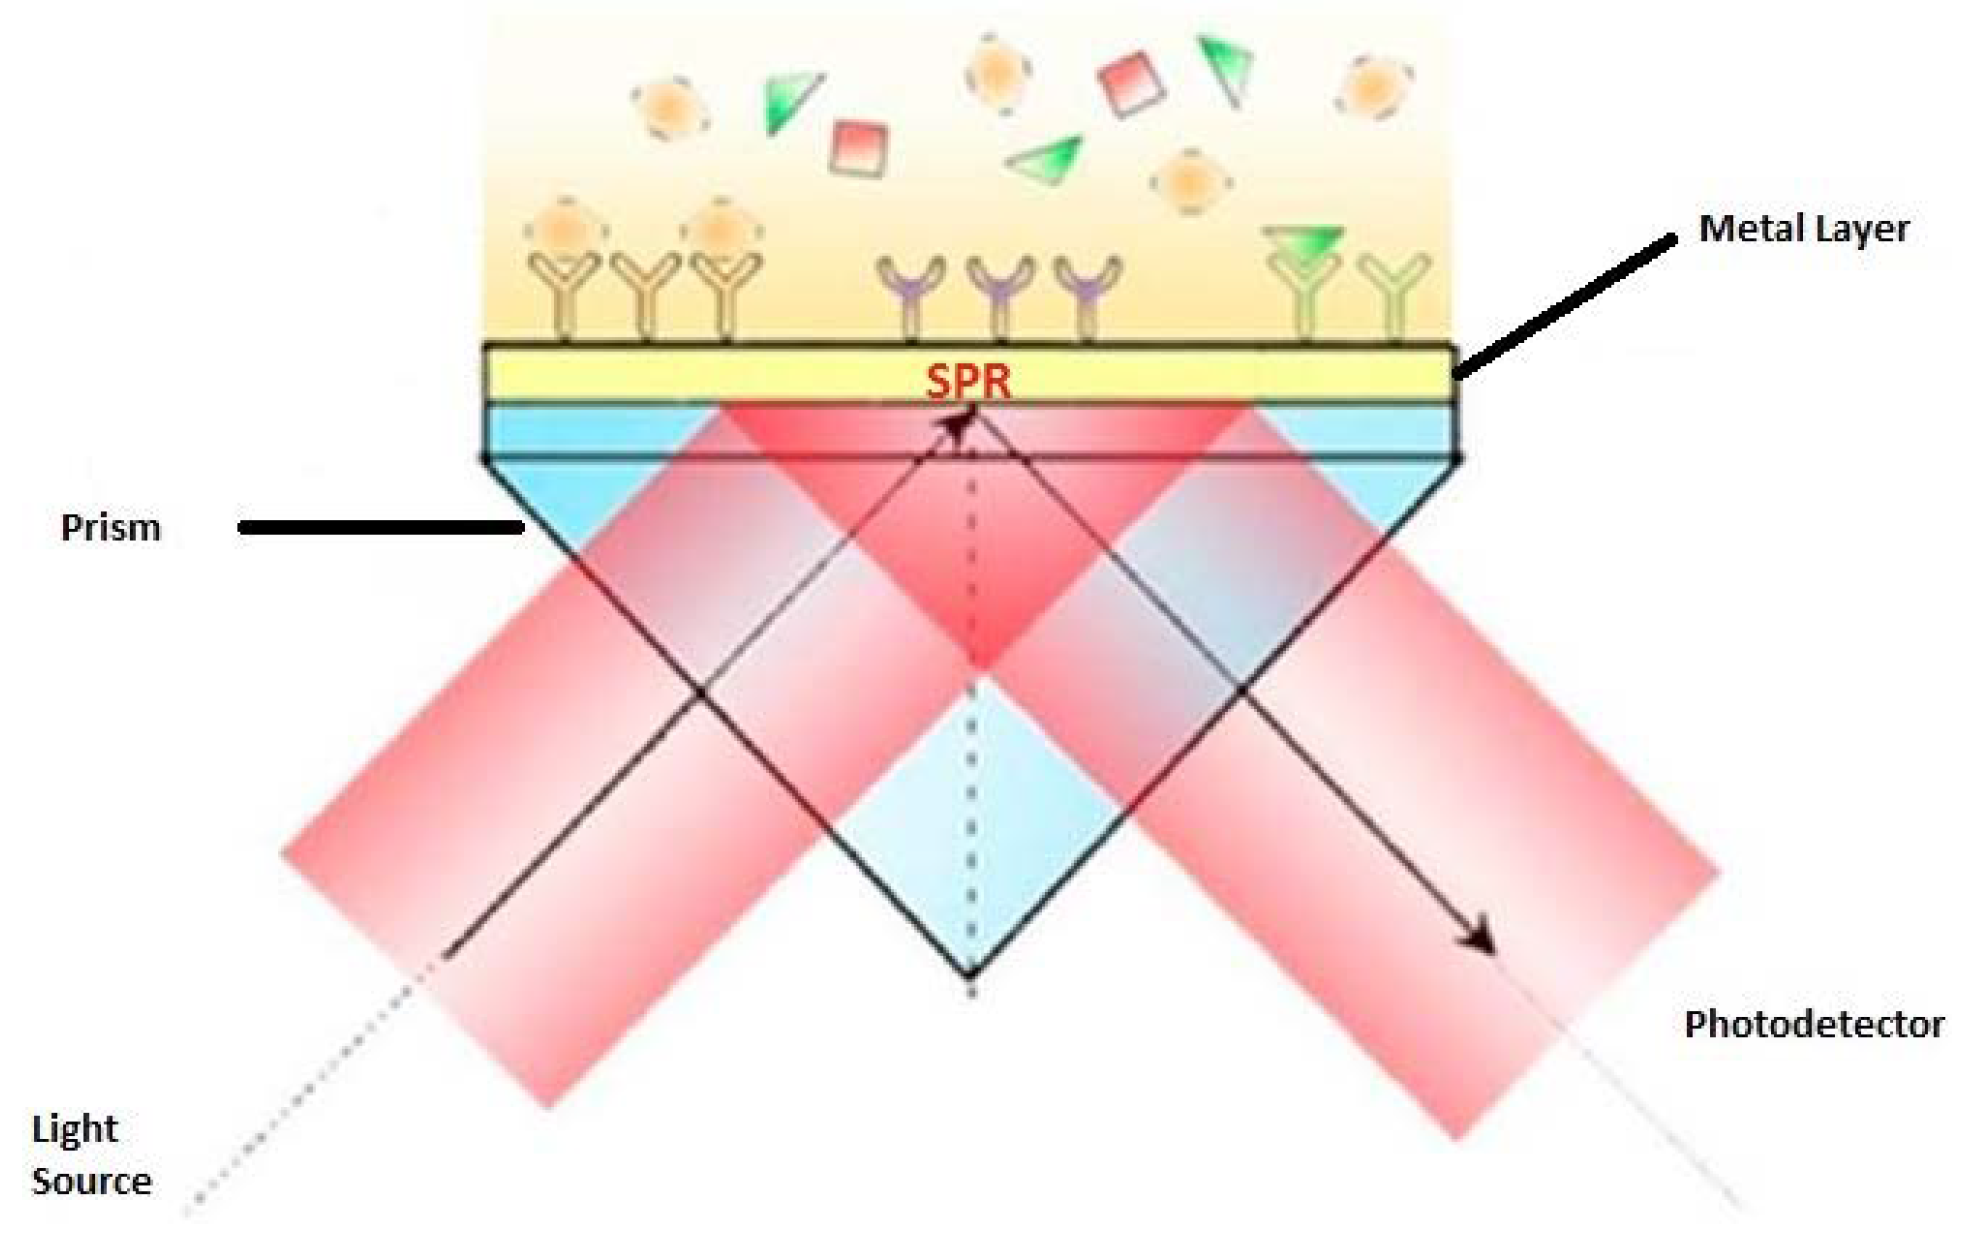
The schematics of an SPR optical sensor are shown in Figure 3. The experimental setup consists of a light source, an SPR coupler and a detector. The lightbeam is introduced to the SPR coupler to excite a surface plasmon, and then, the diffracted or reflected light is detected by the detector. As a change in the refractive index at the metal-dielectric interface results in a change in the effective index of the surface plasmon, therefore any change in the refractive index can be measured when changes the intensity, angular or wavelength of emission spectrum of surface plasmon occur [64].
In a taper fiber sensor, the refractive index of the core and the cladding are modified. This helps the variations that can be obtained in glucose levels be characterized as changes in the refractive index corresponding to the change in resonant frequency. Thischange is the so-called SPR [66], and is how a displacement in the loss of reflection intensity is obtained. SPR can be combined with some other techniques as shown in Figure 4 applied on a tapered optical fiber and gold film.

2.4. Fiber Bragg Grating (FBG)

An optical fiber Bragg grating (FBG) is a one-dimensional periodic modulation of the refractive index which is normally formed based on the fiber photosensitivity. The Bragg grating are made by illuminating the core of a suitable optical fiber a spatially varying pattern of intense ultraviolet (UV) laser light. A periodic spatial variation in the intensity of UV light, caused by the interference of two beams placed over the fiber, gives rise to a corresponding periodic variation in the refractive index of the fiber [67].
Figure 5 shows a schematic diagram of a FBG, and its effect on the incident light. When the reflected light has a wavelength equal to the Bragg wavelength it is reflected back to the input while other wavelengths are transmitted [67,68]:
λ B = 2 n e f f Λ ,
where λ B is the Bragg wavelength, n e f f is the effective index and Λ is the grating period. The Λ is constant over the length of the grating, therefore, a grating is a device that periodically modifies the phase or intensity of wave reflected or transmitted through it.
There are reported works on fiber optic sensors for glucose detection developed using the Fiber Bragg Gratings (FBG) technique. Examples of these sensors are those that are placed in the radial artery to measure the voltage (pulse 302 wave) [68], here, to detect concentrations of 0 to 60% they used doping in the gratings of various substances including nitric acid [70,71] and aminophenylboronic with a detection range of 1 mM to 10 mM [72]. In another work a Tilted Fiber Bragg Grating (TFBG) was used in a glucose sensor. In [73] a silver-plated TFBG sensor was used to detect blood glucose at concentrations of 0 mM to 12 mM, while in [74], the authors doped a sensor with polydopamine with a detection limit of 10−7 M, or with graphene oxide and glucose oxidase in glucose ranges from 0 to 8 mM which achieves a response coefficient of 0.24 nm/mM, see Figure 6 [75].

3. Sensors

3.1. Multimode Fiber Optic Sensors

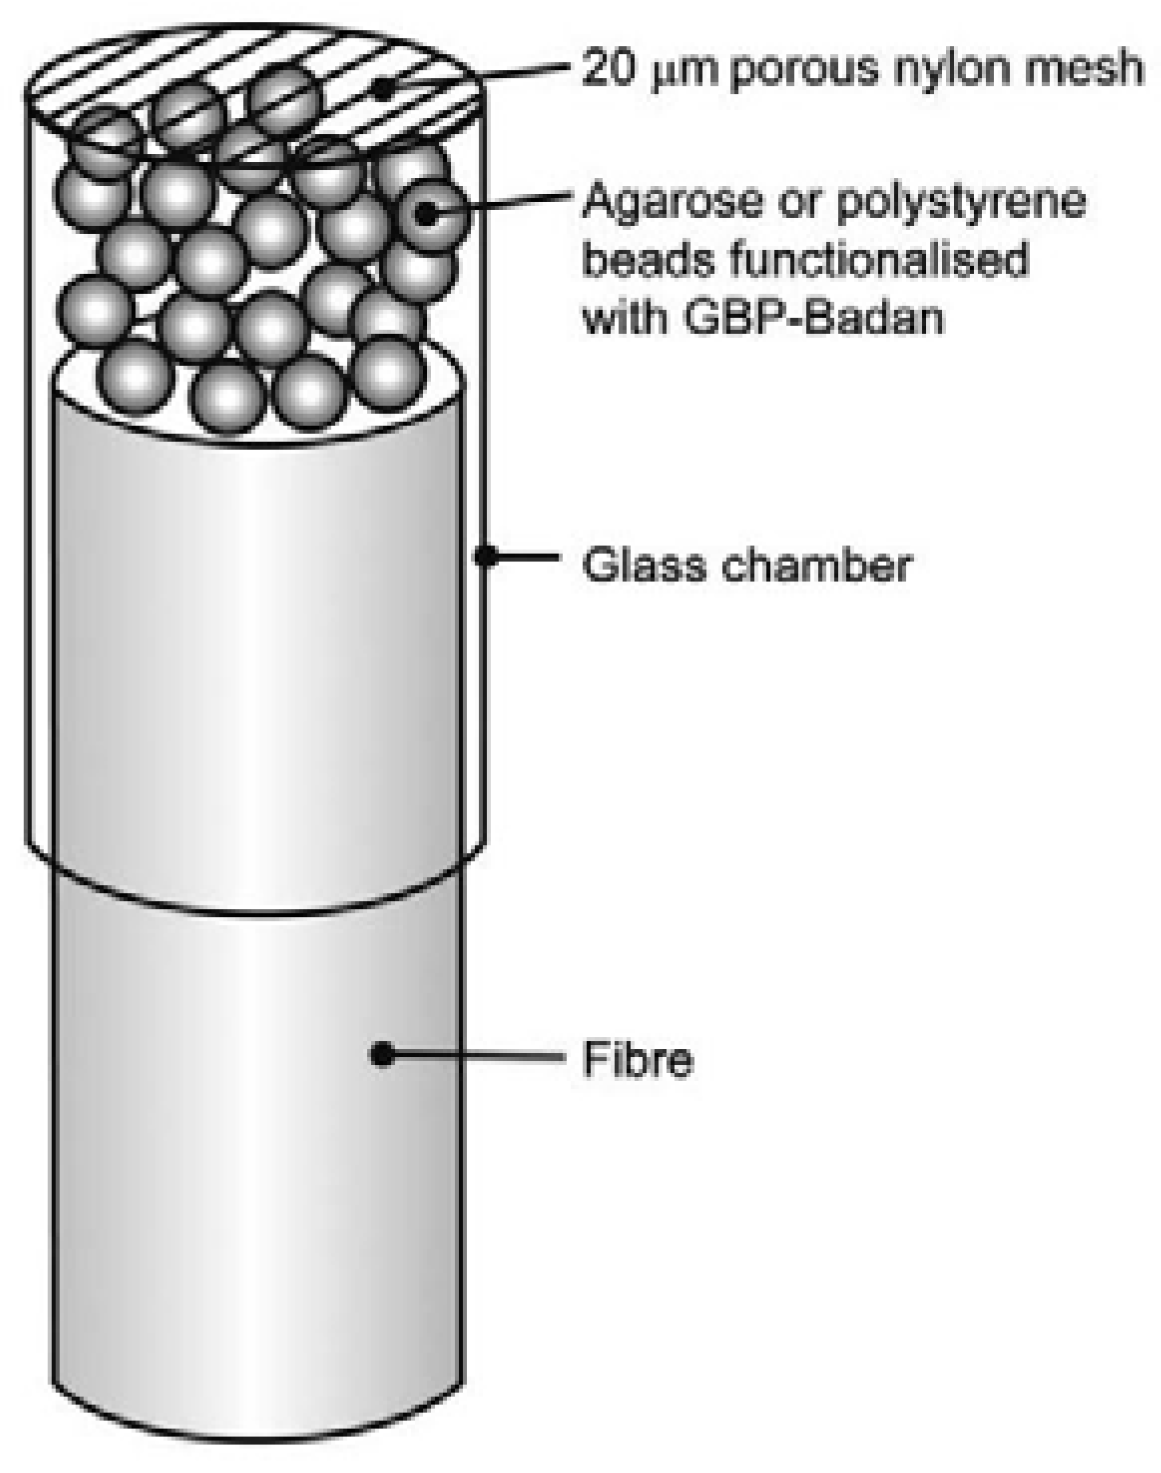
In 2010 Saxl used a multimode fiber with a 1000 µm core (Thorlabs, Ely, UK), with which he formed a 2 mm long chamber glucose sensitive using agarose or polystyrene beads with a section of a glass tube of 1.5 mm in diameter and secured it with epoxy resin on the tip of the optical fiber as shown in Figure 7. The sensor uses a 417 nm laser and obtainsg results at 542 nm, with this they obtained a response time of 1 h [76], while two years later Singh obtained results in 60 s, in a range of 600 nm to 750 nm, varying these results based on the sensed glucose concentration (Figure 8) with a sensor design elaborated on the basis of a multimode optical fiber with a diameter of 600 mm at the core and 0.4 apertures, with a 20 cm fiber length [77].
In 2015 Li used a multimode fiber with 600 µm core, where said fiber is doped with a 5 nm chromium layer and a 50 nm gold film to obtain greater sensitivity, which was used with glucose samples ranging from 1 mg/dL to 300 mg/dL, with results detected from 625 nm up to 668 nm, according to the samples [78].
Milenko in 2018 used a multimode fiber optic with a 105 mm core and 125 mm cladding diameter. Light coupling and Raman signal collection were carried out through one end of the fiber, while the other end was immersed in water-glucose solutions with a concentration range between 0–1110 mM. Measurements were taken with a scan time of 10 s and 20 s acquisitions using an laser excitation wavelength of 785 nm [79].

3.2. Plastic Fiber Optic Sensors

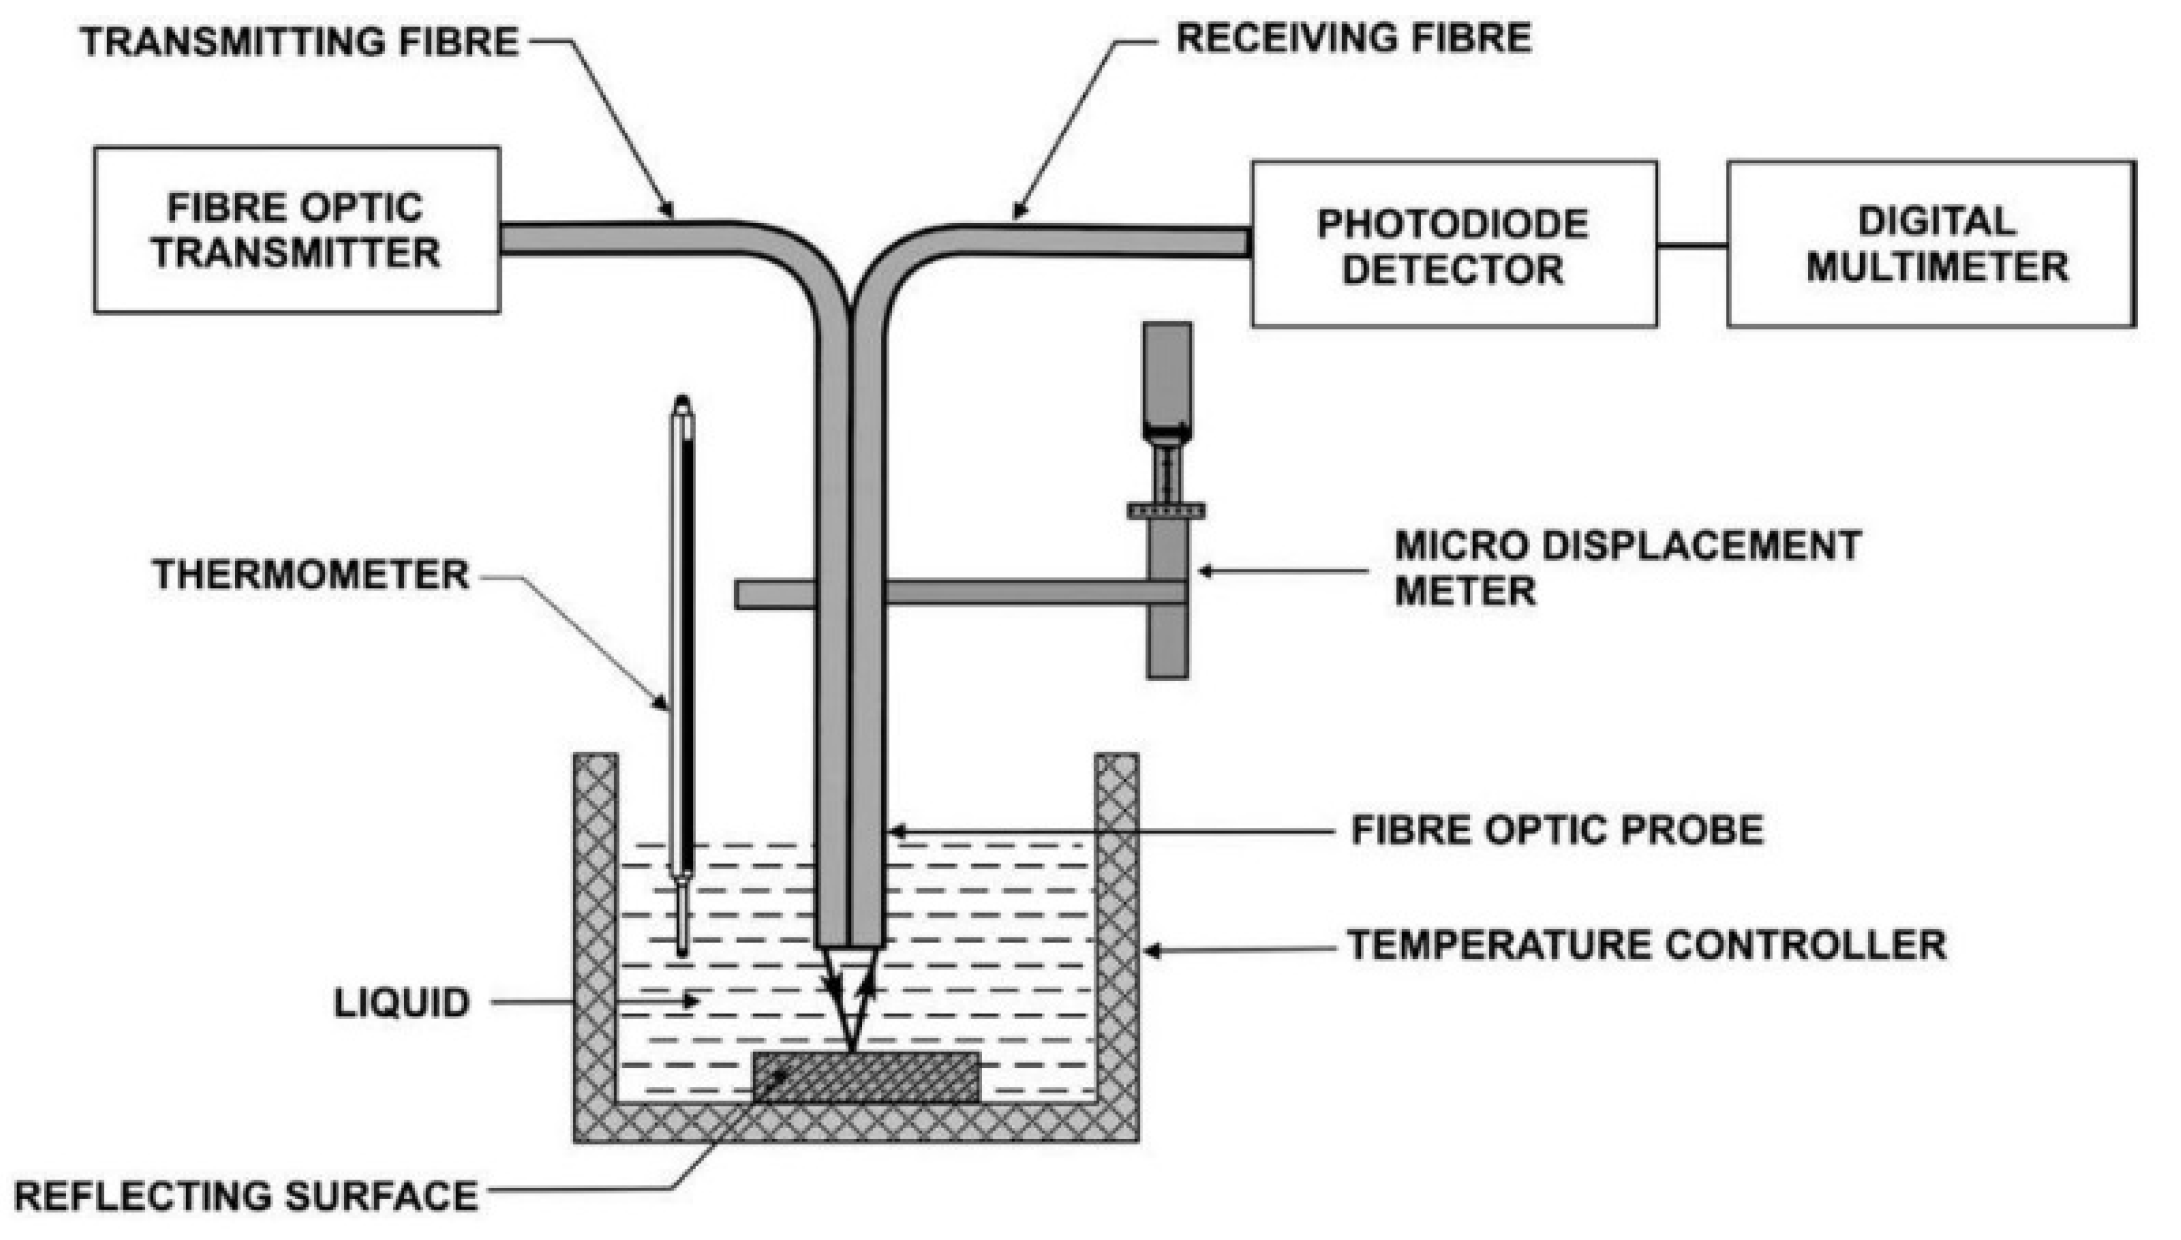
In 1989, Trenttnak developed a glucose biosensor based on intrinsic green fluorescence, working at the 450 nm range in which plastic optical fibers work, and where glucose fluorescence is excited [80]. Later, in 2008 Binu performed experiments to detect refractive indices while varying the concentration of glucose in distilled water. This sensor consists of a plastic fiber optic probe, a reflecting mirror, a temperature controller, a photodiode detector and a digital multimeter. This sensor is shown in Figure 9 [81].
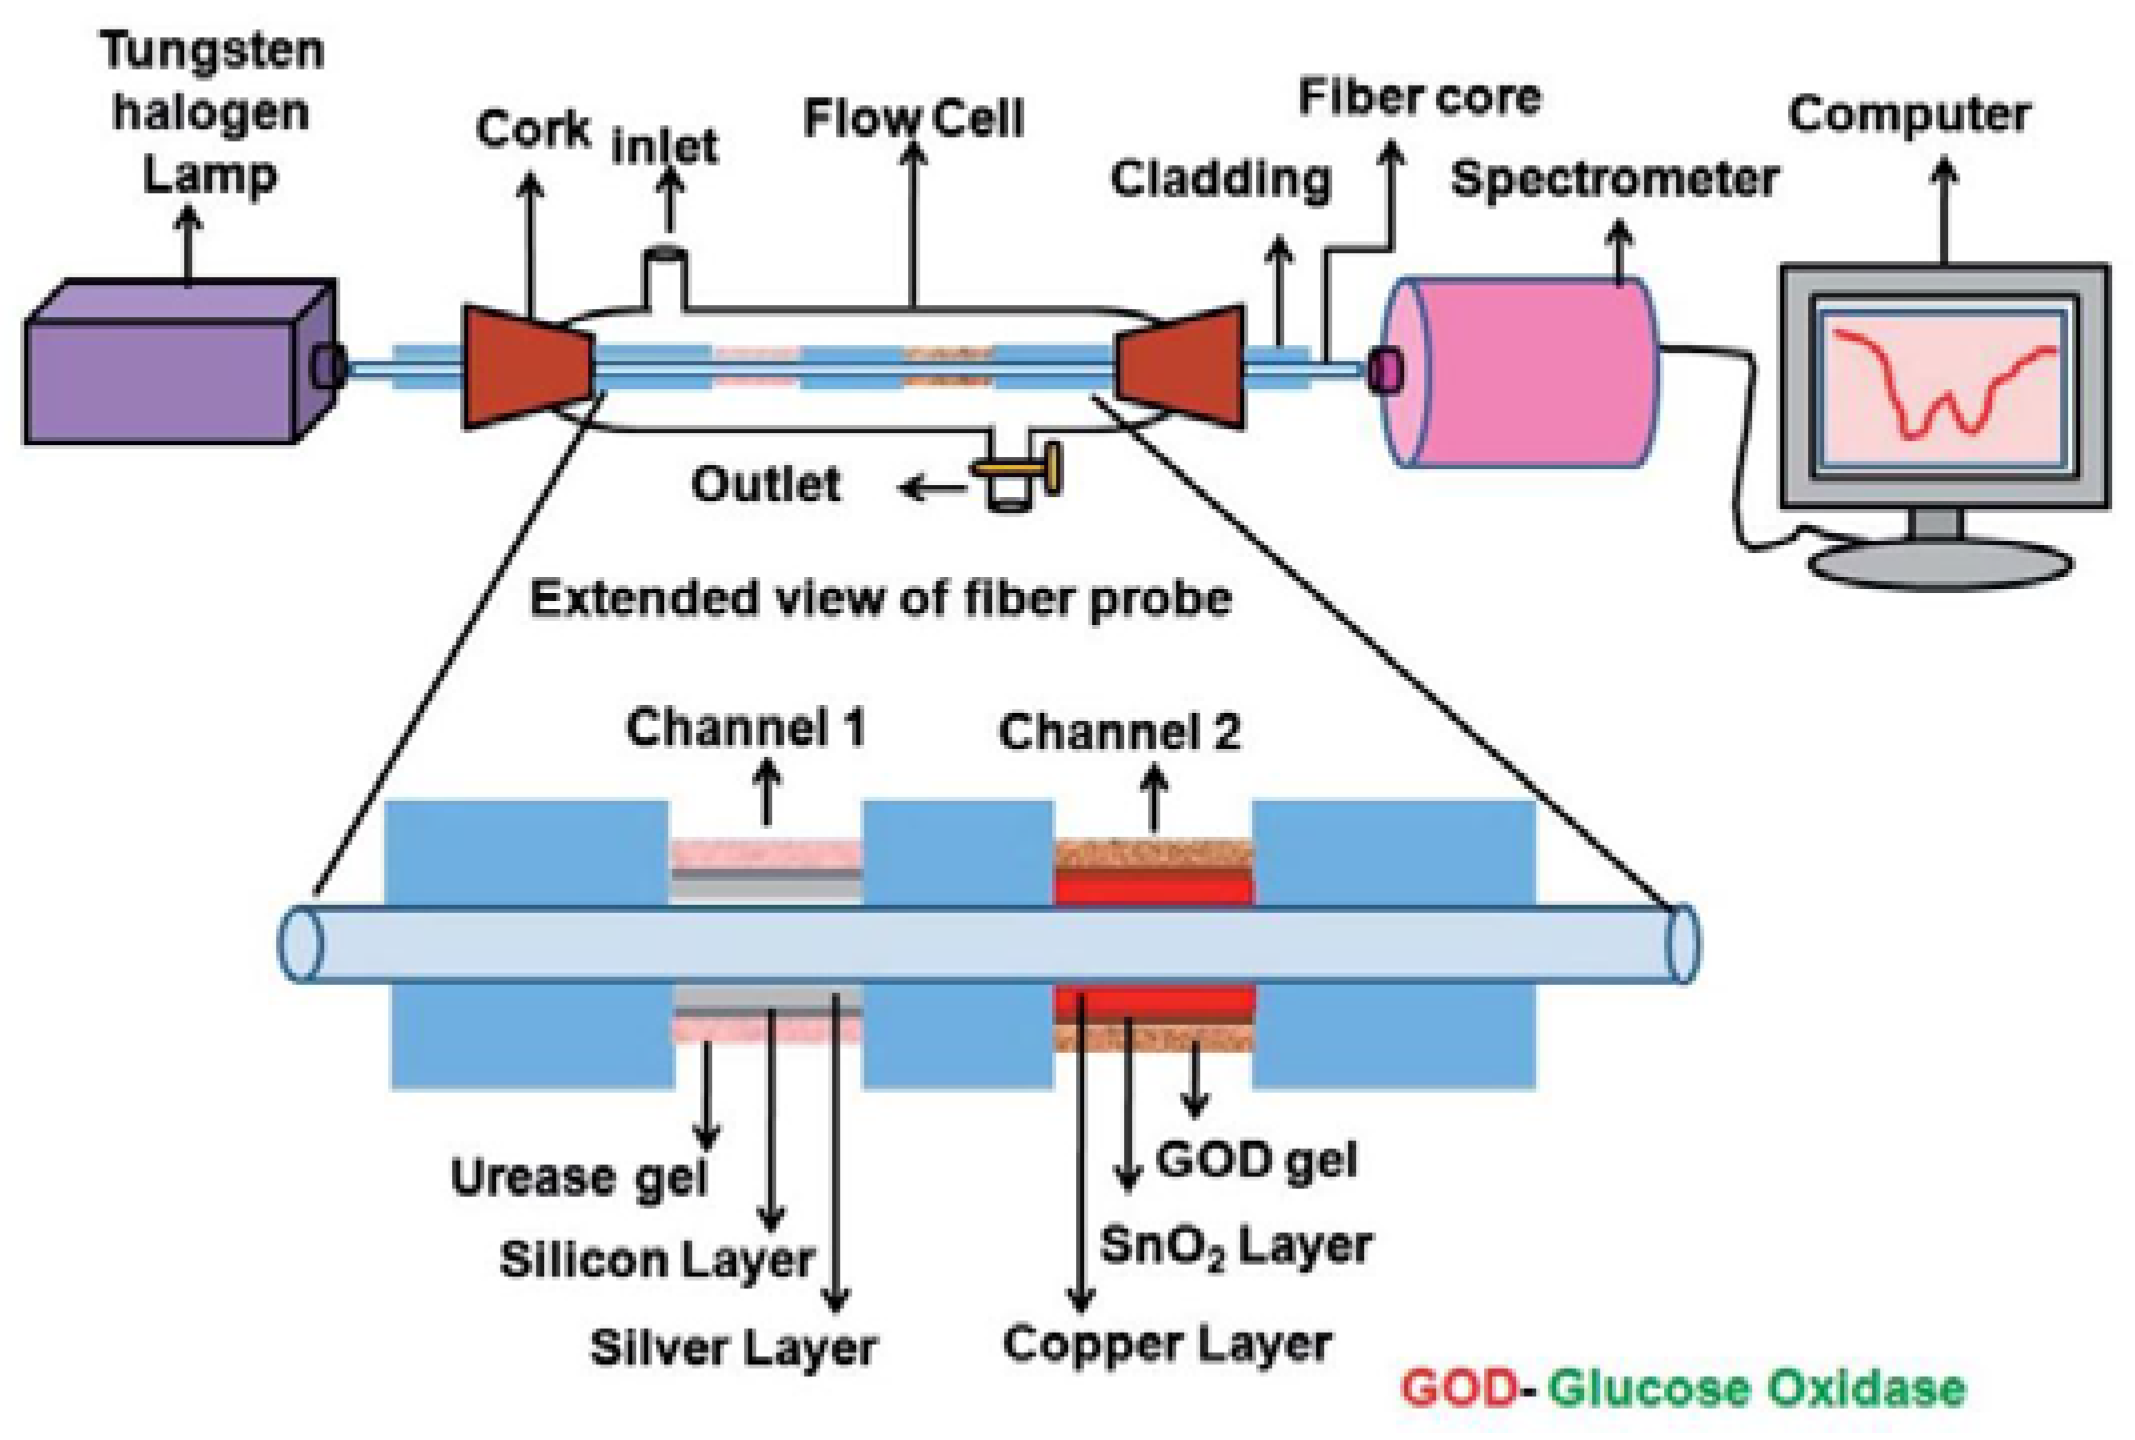
In 2015 Qiu designed a plastic fiber optic sensor, with a light source, polarization device, reaction zone, spectrometer (USB2000+ miniature fiber optic spectrometer) and a PC. Qui used a LED light source to generate red light of 628 nm wavelength, making measurements on samples of 1–40% glucose concentration [82]. This same year, Verma developed an experimental setup for the characterization of urea and glucose levels (channel 1 and channel 2) shown in Figure 10, having a detection range between 500 to 800 nm with glucose samples on concentrations from 0 to 260 mg/dL. In this sensor, which has two narrowings (one in each channel), he used copper and tin oxide as dopants, respectively, to improve the sensitivity [83].
Tiangco in 2016 used a system consisting of 15 inches of single core plastic fiber optic with a diameter of 2 mm, a core of 1.96 mm and an outer diameter of 3 mm (Edmund Optics, Barrington, NJ, USA), working in a visible light range from 366 to 540 nm, with glucose samples of 4–20 mM and using a NI-NTA agarose beads structure dopant to have a sensitivity of 2.888 ± 0.08085 [84]. The same year Yunianto created a sensor to detect the content of glucose in blood through a plastic optical fiber, based on a green LED. The test is carried out in a UV-VIS spectrometer which gives a result in 581 nm with samples of 81.2–235.1 mg/dL [85]. Zhao manufactured a sensor which uses acetic acid under an ultrasonic power of 130 W and a temperature of 25 °C, presenting a high sensitivity of 9.10 RIU g/L−1 for glucose solutions between 10% and 80% concentration, obtaining results in the range of 500 to 750 nm [86].
Azkune in 2018 recorded and compared different glucose absorption spectra in plastic optical fibers doped with methyl methacrylate. These tests are performed by immersing the sensor for 10 min in different glucose concentrations ranging from 0 to 25 mM [87]. In 2019, normalized gamma spectra in a visible range of 450 to 500 nm for different glucose concentrations were located, showing a change in intensity and a shift to the right [88].

3.3. Photonic Fiber Optic Sensors

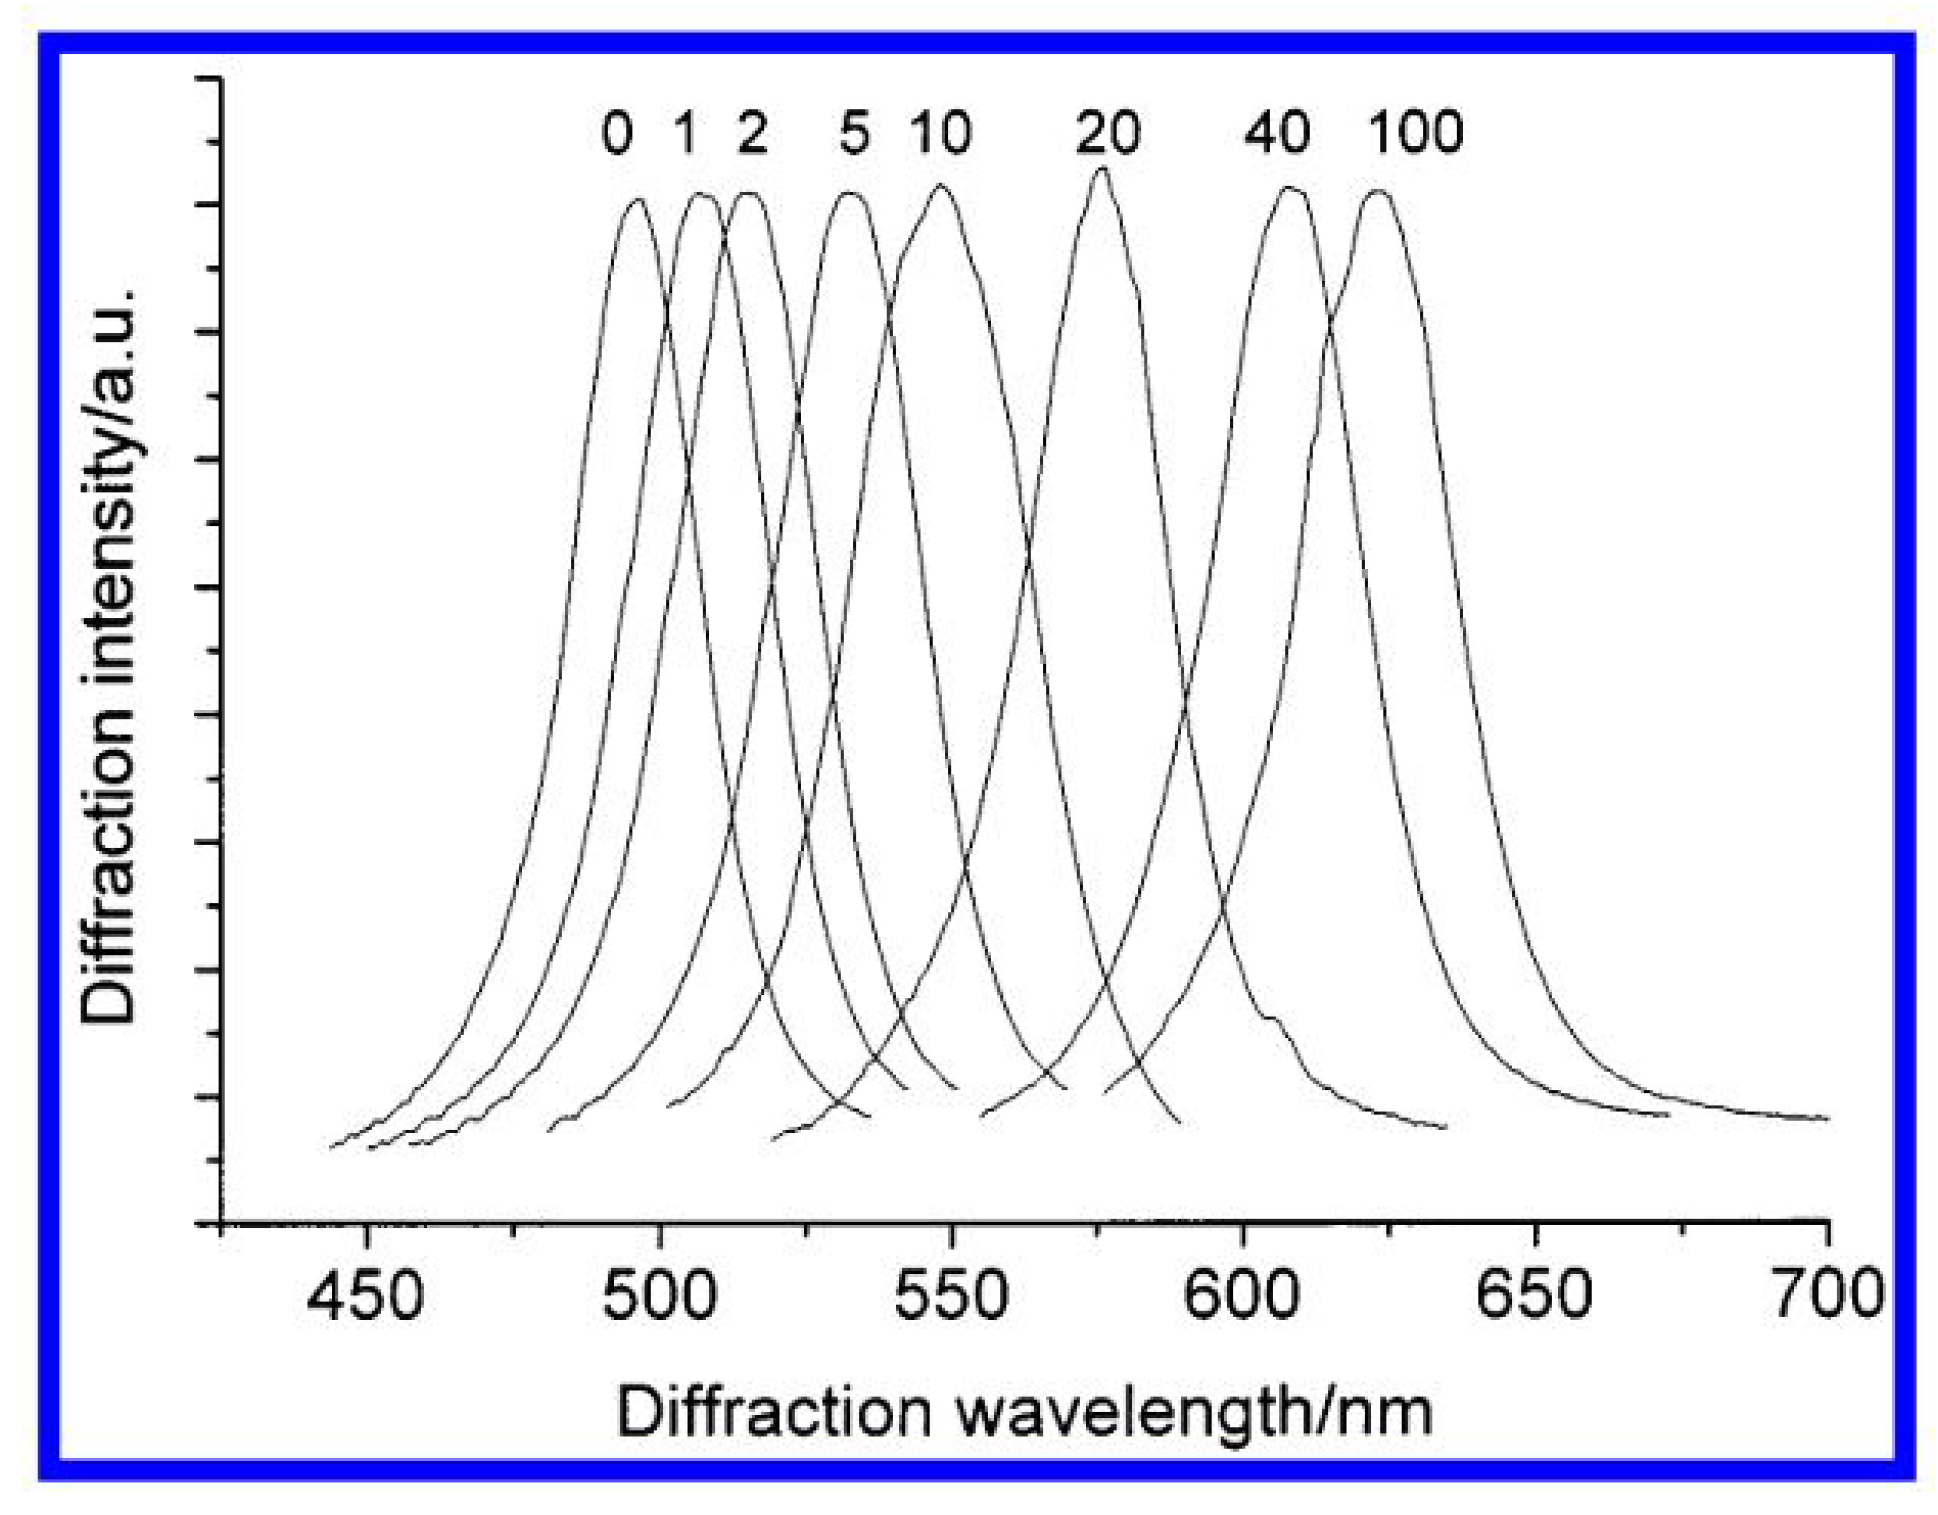
Asher in 2003 developed a sensor that shows a symmetric diffraction peak at 496 nm, which indicates that it diffracts blue-green light. This diffraction peak shifts towards the red as the glucose concentration increases; the sensor diffracts green light at 506 nm for 1 mM glucose, orange light at 576 nm for 20 mM glucose, and red light at 624 nm for glucose, as shown in Figure 11 [89].
In 2016, Mohamed suggested a sensor that offers a high sensitivity at 422 nm/RIU with high linearity, obtaining results on glucose concentrations of 1400 to 1420 g/L [90]. Mohammad presented and discussed the design of a surface plasmon photonic glass fiber (PCF) biosensor for glucose monitoring. The numerical results show that the D-shaped plasmonic PCF after etching three rows of air holes and using gold as a doping structure can reach a sensitivity of 200 nm/RIU [91].
In 2018 Natesan proposed a blood glucose sensor using a trinuclear photonic glass fiber, where a hollow channel filled by analyte acts as a liquid core and two nuclei remain considering the silicon substrate having a sensitivity of 23267.33 nm/RIU. The transmission spectrum shows a maximum wavelength shift for polarization at 470 nm [92]. This same year, Hossain presented an optimized hexagonal photonic glass fiber (PCF) geometry for the detection of glucose concentrations of 20%, 30%, 40%, 50% and 60% in water at wavelengths ranging from 1200 nm to 1600 nm [93].

3.4. Single-Mode Fiber Optic Sensors

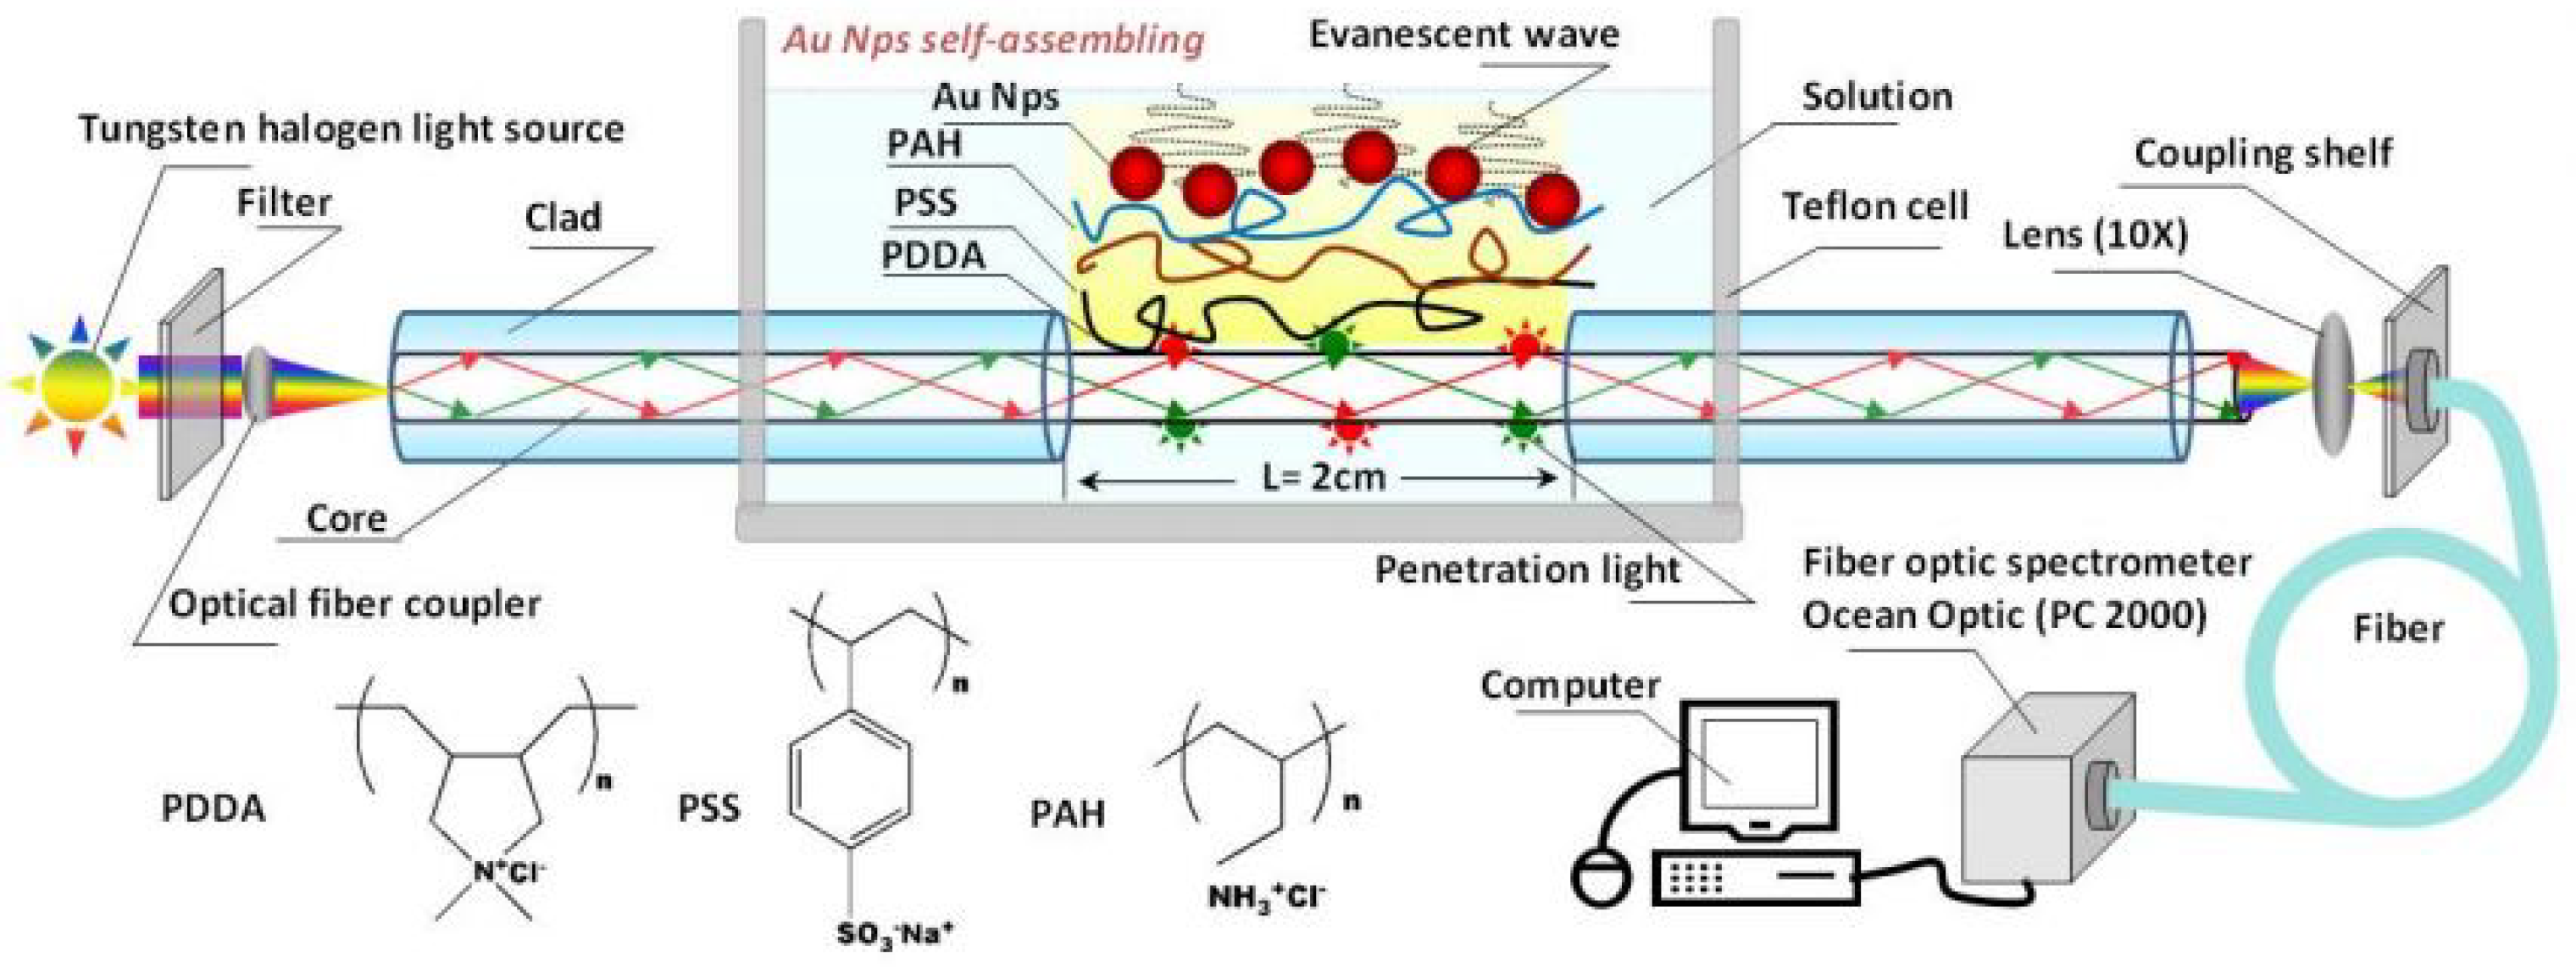
In 1996 Rosenzweig tested a single-mode fiber with a few micrometer cores, placing said fibers in chloride for 10 s, removing about 3 to 5 cm of the coating, leaving a tip heated at a power of 10 mW with a laser beam, to form a glucose sensor with a reaction time of 1.5 s [94]. Later, in 2010, Shao developed a configuration for a quartz-coated silicon single-mode fiber optic LSRP sensor (P600-4 UV-VIS, Ocean Optics Co.). Shao removed a 2 cm length of the coating layer iusing a solution of HF as shown in Figure 12, and usedgold as a doping agent to obtain a sensitivity of 13.09 nm/RIU [25].
In 2016 Yin manufactured a sensor using a single mode fiber (RC1550 8021/165 Yangtze Optical Fiber and Cable Joint Stock Company Limited, Wuhan, China) with a diameter of 80 µm. Initially the fiber was charged with hydrogen at a pressure of 1500 psi for a week, and after doping said fiber with glucose oxidase, it achieves a sensitivity of 205 nm/RIU for glucose concentrations of 2 µM to 10 µM [95]. This same year, Fang removed 60 mm of protective layer from a single-mode optical fiber inside a 300 mm long fiber, fixed the ends to a mobile platform to create an angle in said fiber, and tested of 6 to 30% glucose concentrations achieving a maximal sensitivity of 0.85 dB/% and linear dependence coefficient was 0.925 [96].
Sun in 2017 used a single-mode fiber optics sensor and experimental setup of a light source, a spectrum analyzer (OSA, AQ6370B) (Yokogawa Electric, Tokyo, Japan), a circulator and a test zone, and a superluminiscent LED with a length of 1310 nm wave in samples from 0 to 60 mM of glucose. Figure 13 shows the results obtained with the spectrum analyzer and graphed using the Origin software [97]. The same year, Gandhi created a single-mode fiber optic biosensor, which reaches 12820 nm/RIU with a resolution of 7.8 × 10⁻³ RIU, demonstrating that this is a highly sensitive refractive index sensor for glucose detection applications [98].
In 2018 Novais proposed a sensor consisting of a single-mode fiber section spliced to a short section of coreless silicon optical fiber. By doping with hydrofluoric acid, he obtained a sensitivity of 1467.59 nm/RIU for the shifts in the refraction of different percentages of glucose concentration ranging from 0 to 60% [99].
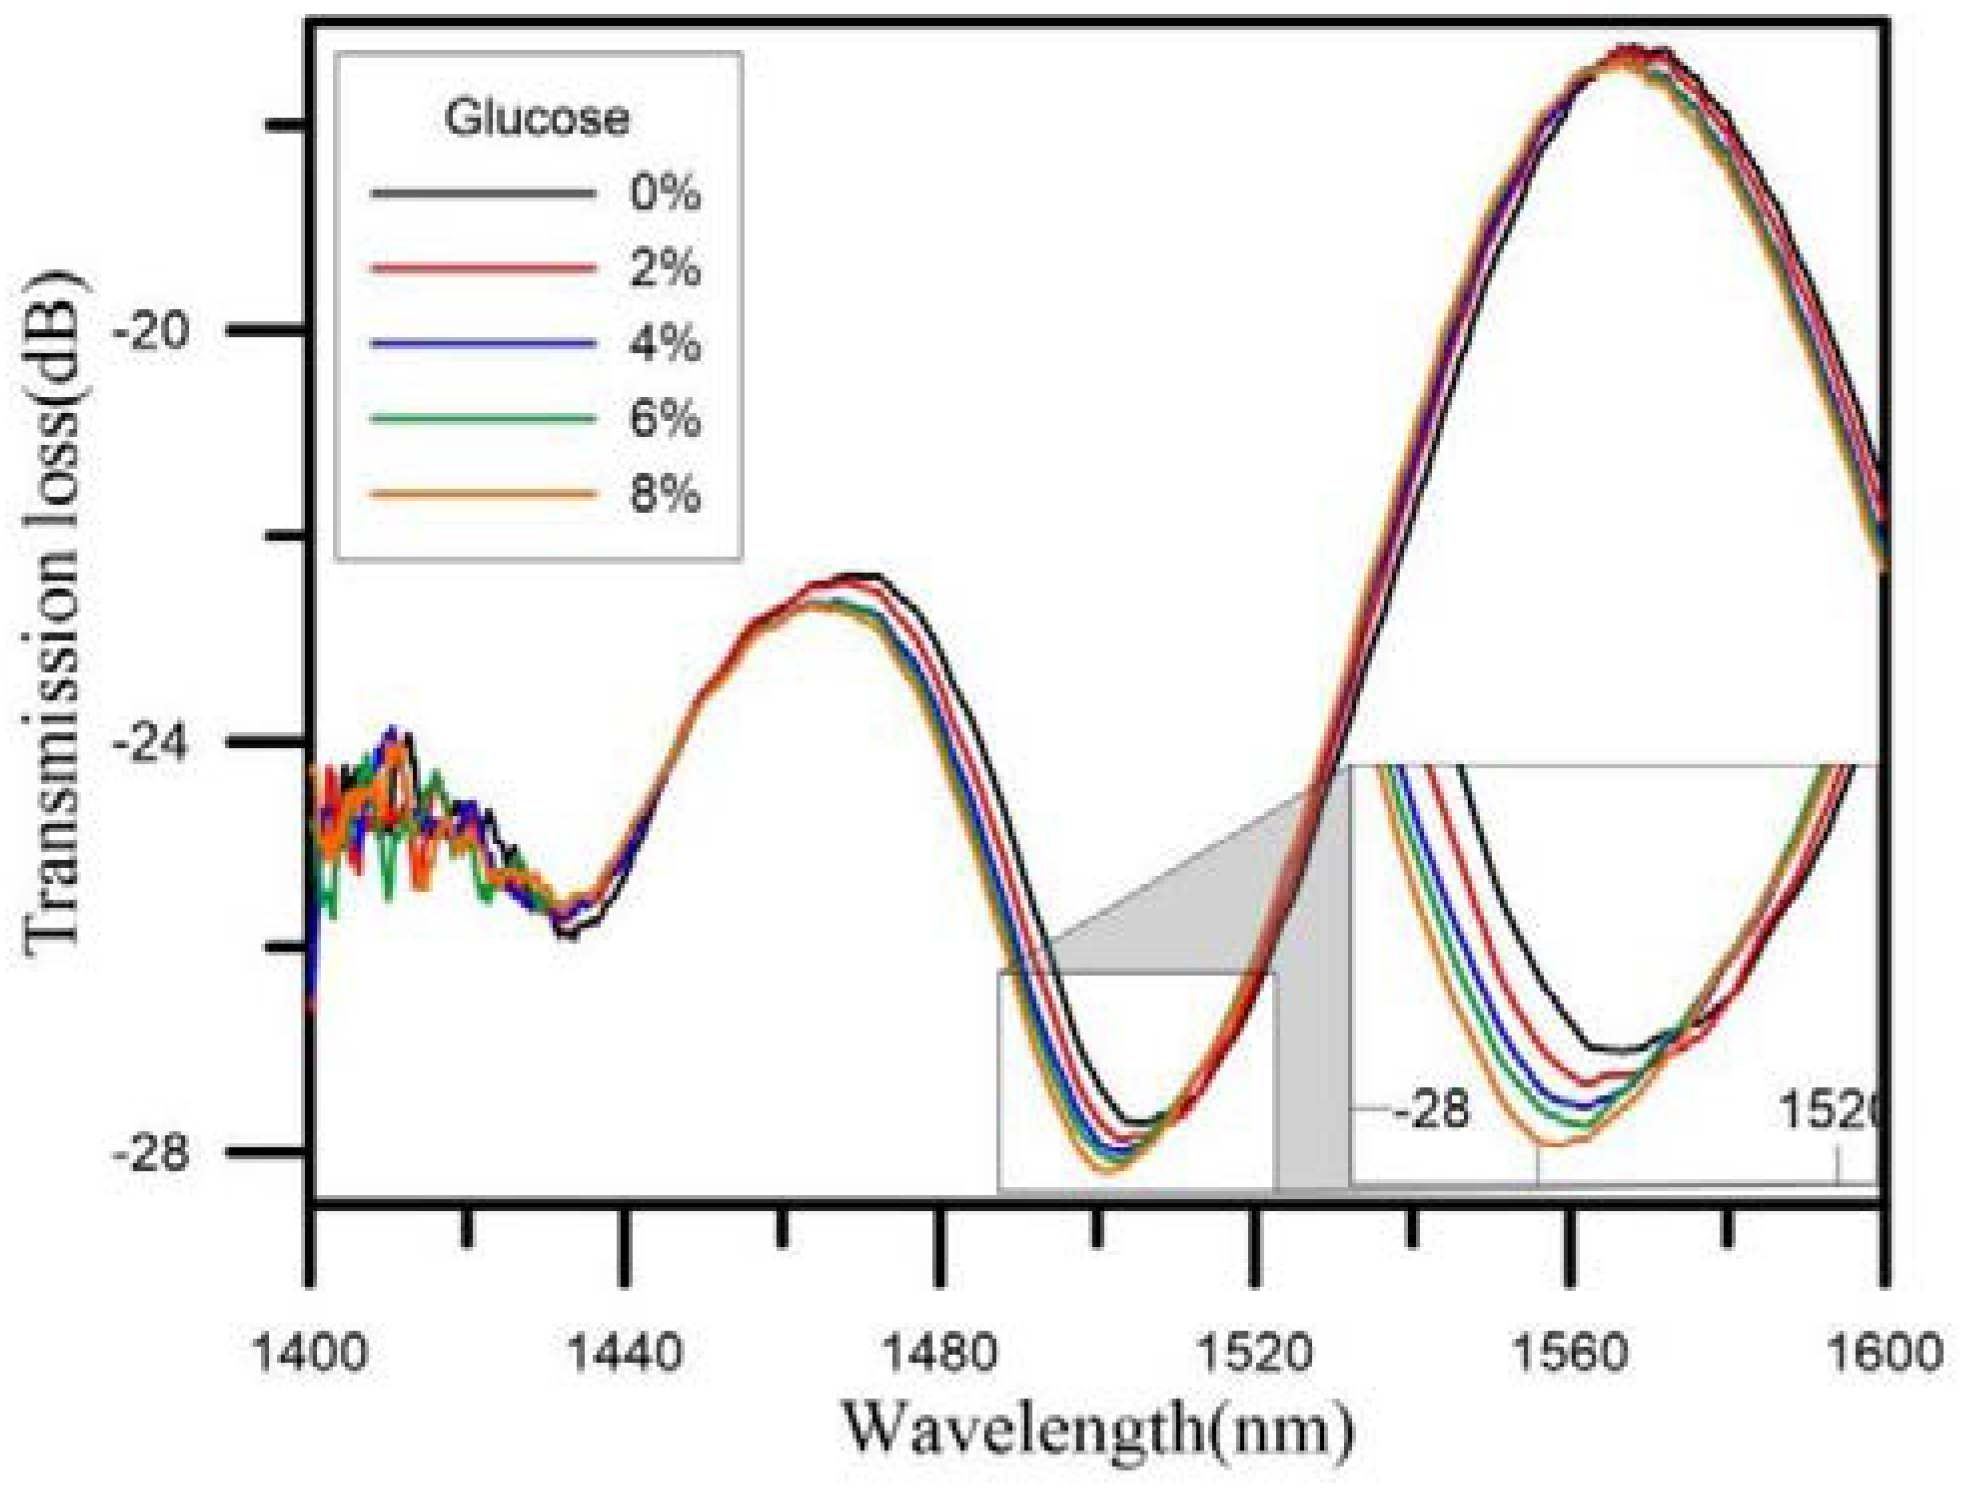
Khan manufactured an optical fiber coated with gold nanoparticles; he selected a single mode fiber 70 mm long, with core and cladding diameters of approximately 3 µm and 125 µm, respectively. Later 10 mm of cladding was removed from one end, thereby creating a tip, which is cleaned with ethanol, methanol and deionized water and then dried with N2 gas, obtaining results at 820 to 920 nm and having a response time of 8 to 9 s in each measurement, with a sensitivity of 3.25 nm/mM [100]. Chen proposed a U-shaped fiber optic sensor made using a flame heating method. This was packaged in a glass tube to reduce signal loss during tests as a glucose sensor demonstrating that when one immerses the sensor in different concentrations of glucose ranging from 0 to 8%, the wavelength or transmission changes as shown in Figure 14 [23].
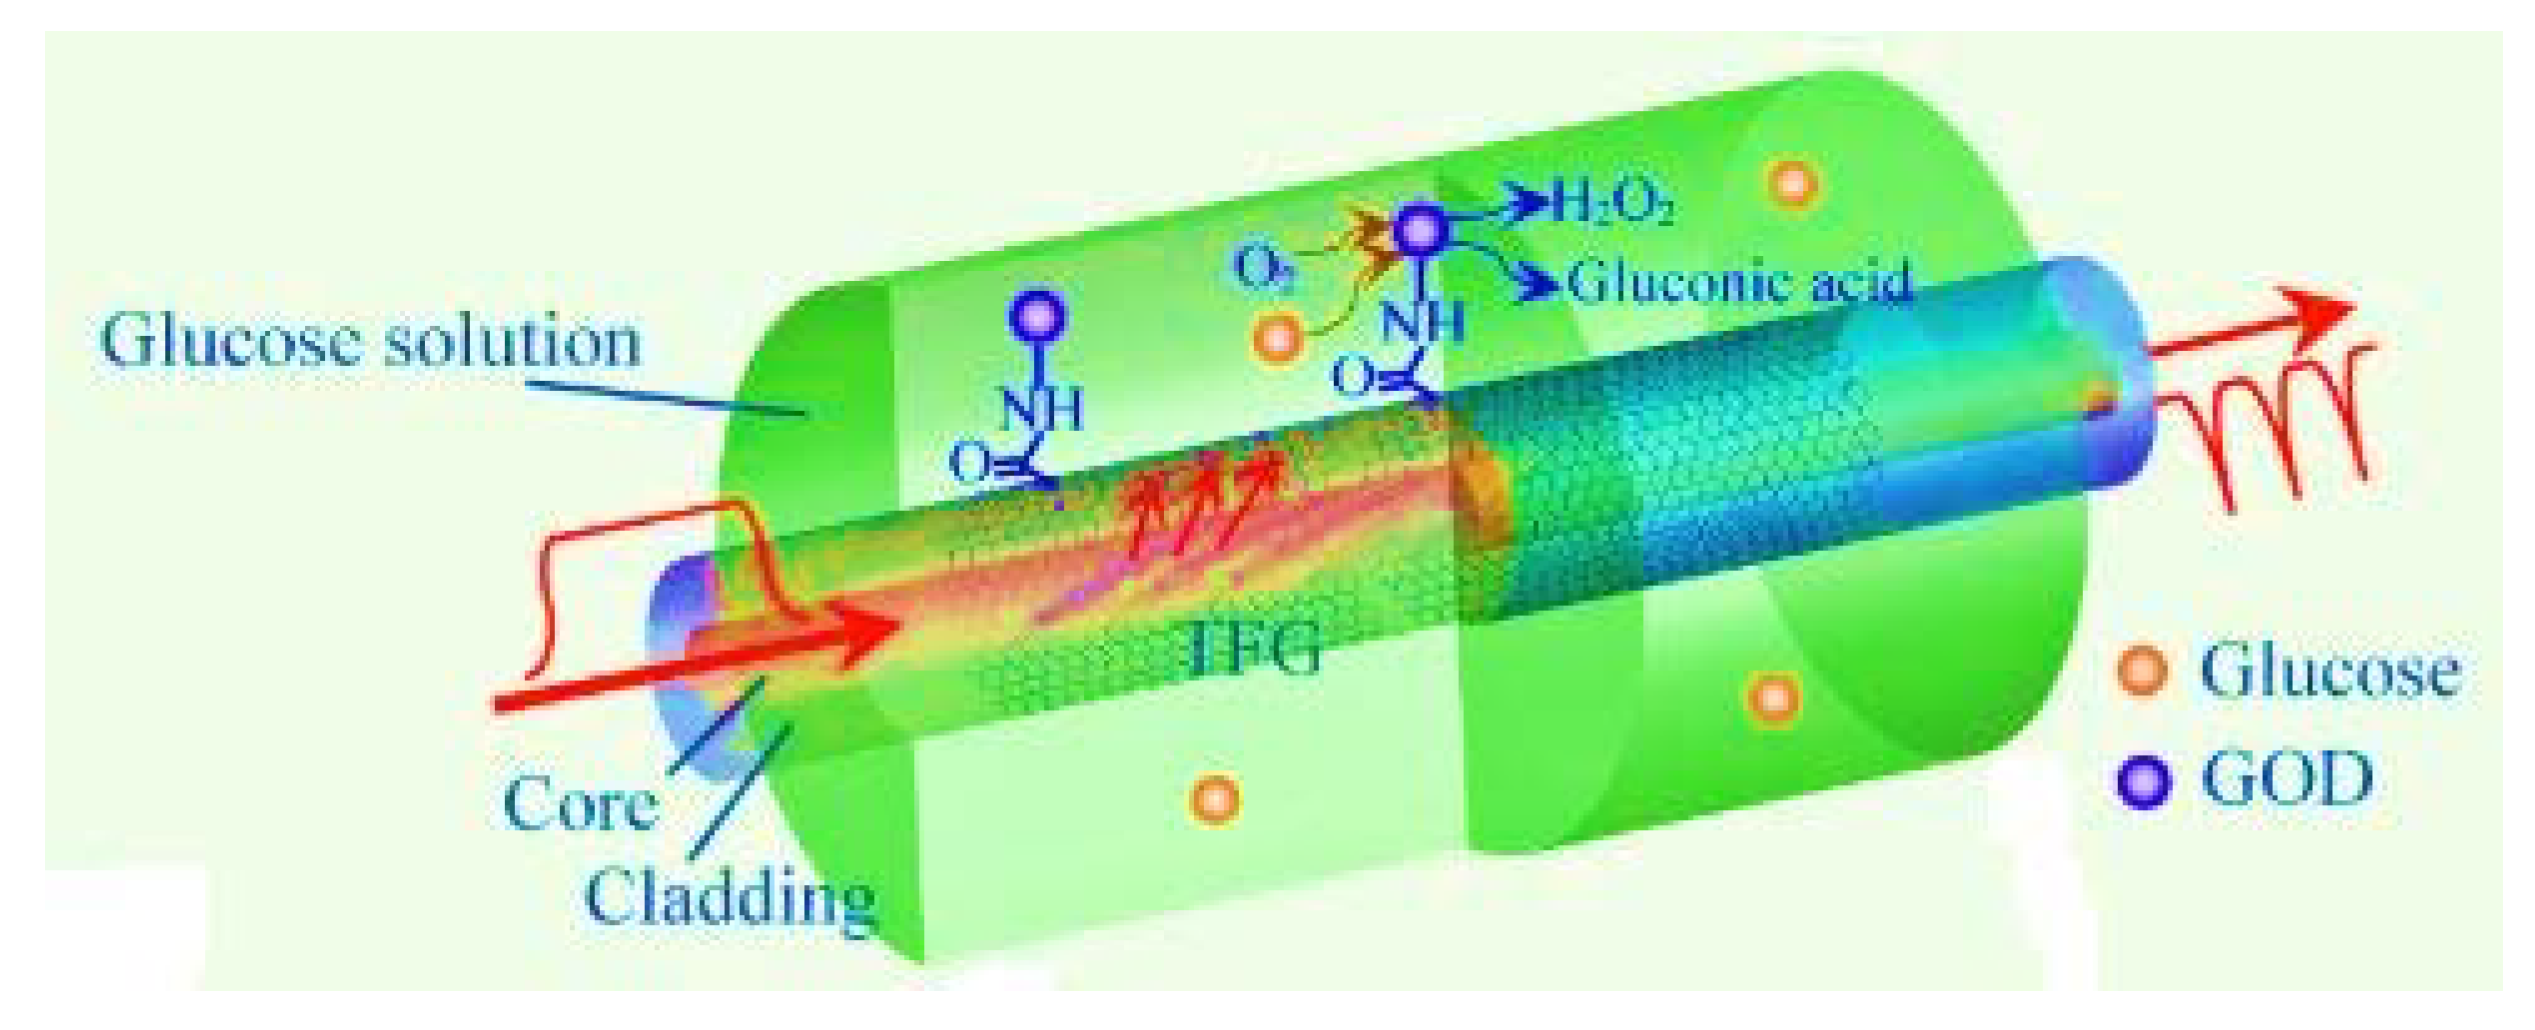
In 2020, Yang presented a study of a glucose sensor based on a single-mode fiber optic structure using graphene oxide and gold nanoparticles. The optical fiber is tapered with a 25 µm waist and a 6 mm tapered region. This conical region is covered with graphene and gold nanostructures to increase biocompatibility. It shows that good absorbance properties at wavelengths of 230 nm and 519 nm with a sensitivity of 1.06 nm/mM Figure 15 [16].

4. Discussion

Diabetes continues to be a global health problem, and at least for the moment, without a cure, so it is important for every patient with this disease to keep their glucose level monitored within a healthy range to continue enjoying a relatively healthy life. Glucometers today are the most reliable devices for taking daily glucose measurements, but technology advances day by day and that has led us to create glucose sensors through fiber optics. This will avoid punctures and pain for the patient to obtain a blood sample and it will also help to avoid having to continuously calibrate the sensor or consume lancets that are only for a single use.
For glucose measurement, there have also been many technological advancesSmith in his book [101] thoroughly summarizes past and current instruments used in non-invasive glucose (NI) and minimally invasive (MI) monitoring. Some devices after going on sale were withdrawn (GlucoWatch, Pendra, among others), due to their problems of accuracy in results and time of use, and other projects such as Google and Novartis lenses were also ruled out by the difficulty of accurately obtaining glucose in tears due to the small amount of glucose in them and sample collection, and along with this technology other devices based on other techniques have been developed, including optical polarimetry [102,103], electrode detection [104], by fluorescence with devices developed for the control of glucose under the skin such as the Senseonics Eversense®® (with 180 days of service life) or the new device developed by Profusa, as well as the Dermal Abyss tattoo of, which considers the surface of the body as an interactive display, producing color changes in response to glucose concentration [105], however, the fact remains that this is still invasive, at least for the first time.
In fluorescence glucose measurements the intensity or time of signal drop can be detected. The lifespan of fluorescence is unique for each analyte which can be measured in dispersion media [106], this helps for the difference between each substance [107]. In spectroscopy water does not absorb much radiation, so light can pass through the stratum corneum of the epidermis to achieve a higher blood concentration, regardless of skin color [108], making it the first choice to develop technology for NI glucose sensors. As shown in Table 1, it also has disadvantages and interference from proteins and acids, which make the glucose-like absorption decrease affecting the reliability and sensitivity to glucose [109]. In contrast, the technology developed based on electromagnetism measures glucose by current or voltage according to magnetic coupling [110]. This operation depends on the relationship between the input and output voltage or amperage, which is proportional to the glucose concentration.
Glucometers today have many advantages, as the results are delivered in seconds, but it cannot be considered to be the best way to monitor glucose, this because it is painful for patients to be pricking the tip of the finger each time for each sample [111], to this one must add the fact that the test strips used by glucometers that are currently on the market are single use and susceptible to electromagnetic interference. Proposals to monitor glucose using elaborate fiber optic sensors can be used as many times as necessary, but with the disadvantage that after a certain period calibration is needed, and they are sensitive to the ambient temperature where glucose monitoring is being done [112].
In Table 2, we list see some characteristics of sensors currently in their prototype stage. All these optical methods share some characteristics, but all use a different technique or type of sensor. They work in different detection ranges, even when using the same doping structure, in this case gold, and it is possible to see that photonic fibers work between 1663–1665 nm [90] and single mode fibers from 500 to 550 nm [25]. In this case the photonic fiber uses a laser as a source, while single-mode fibers work with a visible light source. A plastic fiber optic sensor which is doped with methyl methacrylate was also designed to operate at 450–500 nm [88] as well as a single-mode fiber optic working at 488 nm [94] but it is doped with methylene chloride, both being able to work in visible light.
Response times are becoming important for glucose measurements. Since some patients take samples up to 7 times a day in it is necessary that the sensor does not take long between each measurement. There are biosensors that deliver results in only a few seconds [77,82,85,97] but the sensitivity of fiber-optic-based sensors may have a margin of error [88,90]. With these two parameters, we can say that they can surpass the glucometers that we commonly use. Fiber optic sensors for glucose measurement can not only improve the measurement parameters of conventional glucometers, they can also measure other parameters [83].
Based on Table 2 some parameters and characteristics of each developed sensor are shown, where each sensor was characterized according to the instruments used, from the optical fiber used, the type of source, light color, technique used, in reflection or transmission, if the technique was used in the extreme or medium area and type of spectrometer. All these characteristics are important to be able to achieve the result obtained both in sensitivity and in detection range. There are also many other parameters, which are part of this characterization, but not all were included since not all the articles consulted contain all the complete data and to maintain the uniformity of the parameters in Table 2 we decided to omit them for the comparison.

5. Conclusions

The technological advances achieved in glucose monitoring through fiber optics have continued to advance and improve, although all these optical technologies have advantages and disadvantages. Optical fibers have many properties which can be modified to obtain better results in both detection and sensitivity. The fibers can be narrowed, doped, bent or some physical change made, both in their core and in their cladding.
Technology in recent years has seen surprising growth, and carrying devices as a garment is common today, with devices in the form of bracelets, earrings, watches, rings, necklaces, among others. Thanks to this “wearable” technology it is possible to record many physiological parameters, which previously could only be obtained with larger devices or going to doctor. Some examples are technologies used to measure blood pressure, control heart rate, count steps, and oxygenation in the blood, among others. With all these advances, it is possible to collect data to control and monitor a disease until one can notify a doctor of any symptoms that you may present immediately.
Table 2 shows the comparison of some characteristics of the sensors made with four different types of optical fibers, all showing results positive, some with higher sensitivity at different response times. This leads us to believe in the possibility of seeing these new types of glucometers within the reach of every patient in a short time, with the advantage of not needing punctures or causing any pain to the patient, while being economically more accessible and less harmful to the environment.

Funding

This research received no external funding.

Institutional Review Board Statement

Not applicable.

Informed Consent Statement

Not applicable.

Acknowledgments

The Consejo Nacional de Ciencia y Tecnologia (CONACYT) is acknowledged for the support with the necessary resources to develop this project (number 745469). The authors to thank the PRODEP by financial support for the publication of this article. The following scientific journal publishers are thanked for their permission to use the figures reproduced from [76,83] (Analyst, The Royal Society of Chemistry), [16,75,77,81,97] (Optik, Sensors and Actuators B: Chemical, Journal Materials Science and Engineering C and Optics Communications, Elsevier), [89] (JACS, ACS Publications) and [23,25,65,69] (Sensors, MDPI).

Conflicts of Interest

The authors declare no conflict of interest.

Abbreviations

The following abbreviations are used in this manuscript:
WHOWorld Health Organization
NINon-invasive
FOSFiber Optic Sensors
MIMinimally Invasive
SPRSurface Plasmon Resonance
EWEvanescent Waves
SMFSingle Mode Fiber
WGMWhispering Gallery Mode
FBGFiber Bragg Grating
UVUltra Violet
TFBGTilted Fiber Bragg Gratting Sensor
MMFMulti-mode Fiber
POFPlastic Optical Fiber
PCFPhotonic Crystal Fiber
LSPRLocalized Surface Plasmon Resonance

References

  1. Ekor, M. The growing use of herbal medicines: Issues relating to adverse reactions and challenges in monitoring safety. Front. Pharmacol. 2014, 4, 177. [Google Scholar] [CrossRef] [PubMed] [Green Version]
  2. Zhang, P.; Zhang, X.; Brown, J.; Vistisen, D.; Sicree, R.; Shaw, J.; Nichols, G. Global healthcare expenditure on diabetes for 2010 and 2030. Diabetes Res. Clin. Pract. 2010, 87, 293–301. [Google Scholar] [CrossRef]
  3. Wild, S.; Sicree, R.; Roglic, G.; King, H.; Green, A. Estimates for the year 2000 and projections for 2030. World Health 2004, 27, 1047–1053. [Google Scholar]
  4. Whiting, D.R.; Guariguata, L.; Weil, C.; Shaw, J. IDF Diabetes Atlas: Global estimates of the prevalence of diabetes for 2011 and 2030. Diabetes Res. Clin. Pract. 2011, 94, 311–321. [Google Scholar] [CrossRef]
  5. Guariguata, L.; Whiting, D.; Weil, C.; Unwin, N. The International Diabetes Federation diabetes atlas methodology for estimating global and national prevalence of diabetes in adults. Diabetes Res. Clin. Pract. 2011, 94, 322–332. [Google Scholar] [CrossRef]
  6. Risk, C.C.; Follow-on, A. Nine-Year Effects of 3.7 Years of Intensive Glycemic Control on Cardiovascular Outcomes. Diabetes Care 2016, 39, 701–708. [Google Scholar] [CrossRef] [Green Version]
  7. Ward, J.E.F.; Stetson, B.A.; Mokshagundam, S.P.L. Patient perspectives on self-monitoring of blood glucose: Perceived recommendations, behaviors and barriers in a clinic sample of adults with type 2 diabetes. J. Diabetes Metab. Disord. 2015, 1–7. [Google Scholar] [CrossRef] [Green Version]
  8. Wang, J. Electrochemical Glucose Biosensors. Chem. Rev. 2008, 108, 814–825. [Google Scholar] [CrossRef]
  9. Vashist, S.K.; Zheng, D.; Al-Rubeaan, K.; Luong, J.H.T.; Sheu, F.S. Technology behind commercial devices for blood glucose monitoring in diabetes management: A review. Anal. Chim. Acta 2011, 703, 124–136. [Google Scholar] [CrossRef] [PubMed]
  10. Mascini, M.; Tombelli, S. Biosensors for biomarkers in medical diagnostics. Biomarkers 2008, 13, 637–657. [Google Scholar] [CrossRef]
  11. Vashist, S.K. Non-invasive glucose monitoring technology in diabetes management: A review. Anal. Chim. Acta 2012, 750, 16–27. [Google Scholar] [CrossRef]
  12. Schena, E.; Tosi, D.; Saccomandi, P.; Lewis, E.; Kim, T. Fiber optic sensors for temperature monitoring during thermal treatments: An overview. Sensors 2016, 16, 1144. [Google Scholar] [CrossRef]
  13. Inaudi, D.; Vurpilot, S.; Casanova, N.; Kronenberg, P. Structural monitoring by curvature analysis using interferometric fiber optic sensors. Smart Mater. Struct. 1998, 7, 199–208. [Google Scholar] [CrossRef]
  14. Poeggel, S.; Tosi, D.; Duraibabu, D.; Leen, G.; McGrath, D.; Lewis, E. Optical fibre pressure sensors in medical applications. Sensors 2015, 15, 17115–17148. [Google Scholar] [CrossRef]
  15. Liu, X.; Jin, B.; Bai, Q.; Wang, Y.; Wang, D.; Wang, Y. Distributed fiber-optic sensors for vibration detection. Sensors 2016, 16, 1164. [Google Scholar] [CrossRef] [Green Version]
  16. Yang, Q.; Zhu, G.; Singh, L.; Wang, Y.; Singh, R.; Zhang, B.; Zhang, X.; Kumar, S. Highly sensitive and selective sensor probe using glucose oxidase/gold nanoparticles/graphene oxide functionalized tapered optical fiber structure for detection of glucose. Optik 2020, 208, 164536. [Google Scholar] [CrossRef]
  17. Przhiyalkovsky, Y.V.; Gubin, V.P.; Starostin, N.I.; Morshnev, S.K.; Sazonov, A.I. Detection of electric current pulses by a fibre-optic sensor using spun fibre. Quantum Electron. 2018, 48, 62–69. [Google Scholar] [CrossRef]
  18. Bogue, R. Fibre optic sensors: A review of today’s applications. Sens. Rev. 2011, 31, 304–309. [Google Scholar] [CrossRef]
  19. Zhang, T.; Pang, F.; Liu, H.; Cheng, J.; Lv, L.; Zhang, X.; Chen, N.; Wang, T. A fiber-optic sensor for acoustic emission detection in a high voltage cable system. Sensors 2016, 16, 2026. [Google Scholar] [CrossRef] [PubMed] [Green Version]
  20. Ayyanar, N.; Raja, G.T. Design of Glucose Sensor Using Tri-Core Modified Photonic Crystal Fiber. Proc. IEEE Sens. 2018, 2018, 1–4. [Google Scholar] [CrossRef]
  21. Harun, S.W.; Jasim, A.A.; Rahman, H.A.; Muhammad, M.Z.; Ahmad, H. Micro-ball lensed fiber-based glucose sensor. IEEE Sens. J. 2013, 13, 348–350. [Google Scholar] [CrossRef]
  22. Chauhan, S.; Punjabi, N.; Sharma, D.; Mukherji, S. Evanescent Wave Absorption Based S-shaped Fiber-optic Biosensor for Immunosensing Applications. Procedia Eng. 2016, 168, 117–120. [Google Scholar] [CrossRef]
  23. Chen, K.C.; Li, Y.L.; Wu, C.W.; Chiang, C.C. Glucose sensor using U-shaped optical fiber probe with gold nanoparticles and glucose oxidase. Sensors 2018, 18, 1217. [Google Scholar] [CrossRef] [PubMed] [Green Version]
  24. Mas, S.; Martí, J.; Palací, J. Biconical tapered fibers manipulation for refractive index and strain sensing applications. IEEE Sens. J. 2015, 15, 1331–1335. [Google Scholar] [CrossRef]
  25. Shao, Y.; Xu, S.; Zheng, X.; Wang, Y.; Xu, W. Optical fiber LSPR biosensor prepared by gold nanoparticle assembly on polyelectrolyte multilayer. Sensors 2010, 10, 3585–3596. [Google Scholar] [CrossRef] [PubMed] [Green Version]
  26. Yang, X.C.; Lu, Y.; Wang, M.T.; Yao, J.Q. A photonic crystal fiber glucose sensor filled with silver nanowires. Opt. Commun. 2016, 359, 279–284. [Google Scholar] [CrossRef]
  27. Acciaroli, G.; Vettoretti, M.; Facchinetti, A.; Sparacino, G. Calibration of minimally invasive continuous glucose monitoring sensors: State-of-the-art and current perspectives. Biosensors 2018, 8, 24. [Google Scholar] [CrossRef] [Green Version]
  28. Saur, N.M.; England, M.R.; Menzie, W.; Melanson, A.M.; Trieu, M.Q.; Berlin, J.; Hurley, J.; Krystyniak, K.; Kongable, G.L.; Nasraway, S.A. Accuracy of a novel noninvasive transdermal continuous glucose monitor in critically ill patients. J. Diabetes Sci. Technol. 2014, 8, 945–950. [Google Scholar] [CrossRef] [Green Version]
  29. Lipani, L.; Dupont, B.G.R.; Doungmene, F.; Marken, F.; Tyrrell, R.M.; Guy, R.H.; Ilie, A. Non-invasive, transdermal, path-selective and specific glucose monitoring via a graphene-based platform. Nat. Nanotechnol. 2018, 13, 504–511. [Google Scholar] [CrossRef]
  30. Worsley, G.J.; Tourniaire, G.A.; Medlock, K.E.S.; Sartain, F.K.; Harmer, H.E.; Thatcher, M.; Horgan, A.M.; Pritchard, J. Measurement of glucose in blood with a phenylboronic acid optical sensor. J. Diabetes Sci. Technol. 2008, 2, 213–220. [Google Scholar] [CrossRef] [PubMed]
  31. Srivastava, S.K.; Abdulhalim, I. Spectral Interrogation based SPR Sensor for Blood Glucose Detection with Improved Sensitivity and Stability. J. Biosens. Bioelectron. 2015, 06, 10–12. [Google Scholar] [CrossRef]
  32. Badugu, R.; Reece, E.A.; Lakowicz, J.R. Glucose-sensitive silicone hydrogel contact lens toward tear glucose monitoring. J. Biomed. Opt. 2018, 23, 1. [Google Scholar] [CrossRef] [PubMed] [Green Version]
  33. Park, J.; Kim, J.; Kim, S.Y.; Cheong, W.H.; Jang, J.; Park, Y.G.; Na, K.; Kim, Y.T.; Heo, J.H.; Lee, C.Y.; et al. Soft, smart contact lenses with integrations of wireless circuits, glucose sensors, and displays. Sci. Adv. 2018, 4, 1–12. [Google Scholar] [CrossRef] [PubMed] [Green Version]
  34. Oh, S.Y.; Hong, S.Y.; Jeong, Y.R.; Yun, J.; Park, H.; Jin, S.W.; Lee, G.; Oh, J.H.; Lee, H.; Lee, S.S.; et al. Skin-Attachable, Stretchable Electrochemical Sweat Sensor for Glucose and pH Detection. ACS Appl. Mater. Interfaces 2018, 10, 13729–13740. [Google Scholar] [CrossRef]
  35. Wang, Y.; Wang, X.; Lu, W.; Yuan, Q.; Zheng, Y.; Yao, B. A thin film polyethylene terephthalate (PET) electrochemical sensor for detection of glucose in sweat. Talanta 2019, 198, 86–92. [Google Scholar] [CrossRef] [PubMed]
  36. Gu, X.; Wang, H.; Schultz, Z.D.; Camden, J.P. Sensing Glucose in Urine and Serum and Hydrogen Peroxide in Living Cells by Use of a Novel Boronate Nanoprobe Based on Surface-Enhanced Raman Spectroscopy. Anal. Chem. 2016, 88, 7191–7197. [Google Scholar] [CrossRef] [Green Version]
  37. Radhakumary, C.; Sreenivasan, K. Naked eye detection of glucose in urine using glucose oxidase immobilized gold nanoparticles. Anal. Chem. 2011, 83, 2829–2833. [Google Scholar] [CrossRef]
  38. Mudgal, N.; Saharia, A.; Agarwal, A.; Ali, J.; Yupapin, P.; Singh, G. Modeling of highly sensitive surface plasmon resonance (SPR) sensor for urine glucose detection. Opt. Quantum Electron. 2020, 52, 1–14. [Google Scholar] [CrossRef]
  39. Zhang, W; Wang, M.L. Saliva Glucose Monitoring System. U.S. patent 9244035B2, 26 January 2016.
  40. Lerner, M.B.; Kybert, N.; Mendoza, R.; Villechenon, R.; Bonilla Lopez, M.A.; Charlie Johnson, A.T. Scalable, non-invasive glucose sensor based on boronic acid functionalized carbon nanotube transistors. Appl. Phys. Lett. 2013, 102. [Google Scholar] [CrossRef] [Green Version]
  41. Jia, J.; Guan, W.; Sim, M.; Li, Y.; Li, H. Carbon nanotubes based glucose needle-type biosensor. Sensors 2008, 8, 1712–1718. [Google Scholar] [CrossRef] [Green Version]
  42. Chen, X.; Pan, H.; Liu, H.; Du, M. Nonenzymatic glucose sensor based on flower-shaped Au@Pd core-shell nanoparticles-ionic liquids composite film modified glassy carbon electrodes. Electrochim. Acta 2010, 56, 636–643. [Google Scholar] [CrossRef]
  43. Ni, P.; Sun, Y.; Shi, Y.; Dai, H.; Hu, J.; Wang, Y.; Li, Z. Facile fabrication of CuO nanowire modified Cu electrode for non-enzymatic glucose detection with enhanced sensitivity. RSC Adv. 2014, 4, 28842–28847. [Google Scholar] [CrossRef]
  44. Rossetti, P.; Bondia, J.; Vehí, J.; Fanelli, C.G. Estimating plasma glucose from interstitial glucose: The issue of calibration algorithms in commercial continuous glucose monitoring devices. Sensors 2010, 10, 10936–10952. [Google Scholar] [CrossRef] [PubMed]
  45. Rodbard, D. Continuous Glucose Monitoring: A Review of Successes, Challenges, and Opportunities. Diabetes Technol. Ther. 2016, 18, S23–S213. [Google Scholar] [CrossRef] [Green Version]
  46. Al Hayek, A.A.; Al Dawish, M.A. The Potential Impact of the FreeStyle Libre Flash Glucose Monitoring System on Mental Well-Being and Treatment Satisfaction in Patients with Type 1 Diabetes: A Prospective Study. Diabetes Ther. 2019, 10, 1239–1248. [Google Scholar] [CrossRef] [Green Version]
  47. Al Hayek, A.A.; Robert, A.A.; Al Dawish, M.A. Differences of FreeStyle Libre Flash Glucose Monitoring System and Finger Pricks on Clinical Characteristics and Glucose Monitoring Satisfactions in Type 1 Diabetes Using Insulin Pump. Clin. Med. Insights Endocrinol. Diabetes 2019, 12. [Google Scholar] [CrossRef] [PubMed] [Green Version]
  48. Mohammed, Z.H. The Fresnel Coefficient of Thin Film Multilayer Using Transfer Matrix Method TMM. IOP Conf. Ser. Mater. Sci. Eng. 2019, 518. [Google Scholar] [CrossRef]
  49. Zibaii, M.I.; Kazemi, A.; Latifi, H.; Azar, M.K.; Hosseini, S.M.; Ghezelaiagh, M.H. Measuring bacterial growth by refractive index tapered fiber optic biosensor. J. Photochem. Photobiol. B Biol. 2010, 101, 313–320. [Google Scholar] [CrossRef] [PubMed]
  50. Correia, R.; James, S.; Lee, S.W.; Morgan, S.P.; Korposh, S. Biomedical application of optical fibre sensors. J. Opt. 2018, 20. [Google Scholar] [CrossRef]
  51. Villatoro, J.; Monzón-Hernández, D.; Mejía, E. Fabrication and modeling of uniform-waist single-mode tapered optical fiber sensors. Appl. Opt. 2003, 42, 2278. [Google Scholar] [CrossRef]
  52. Tian, Y.; Wang, W.; Wu, N.; Zou, X.; Wang, X. Tapered optical fiber sensor for label-free detection of biomolecules. Sensors 2011, 11, 3780–3790. [Google Scholar] [CrossRef] [Green Version]
  53. Kieu, K.Q.; Mansuripur, M. Biconical fiber taper sensors. IEEE Photonics Technol. Lett. 2006, 18, 2239–2241. [Google Scholar] [CrossRef]
  54. Gravina, R.; Testa, G.; Bernini, R. Perfluorinated plastic optical fiber tapers for evanescent wave sensing. Sensors 2009, 9, 10423–10433. [Google Scholar] [CrossRef] [PubMed] [Green Version]
  55. Castle, P.F. Bend Loss Measurements on High Numerical Wavelength and Bend Radius. J. Light. Technol. 1986, LT-4, 34–40. [Google Scholar]
  56. Zhao, Y.; Zhao, H.; Lv, R.Q.; Zhao, J. Review of optical fiber Mach–Zehnder interferometers with micro-cavity fabricated by femtosecond laser and sensing applications. Opt. Lasers Eng. 2019, 117, 7–20. [Google Scholar] [CrossRef]
  57. Liu, T.; Chen, Y.; Han, Q.; Lu, X. Magnetic field sensor based on U-bent single-mode fiber and magnetic fluid. IEEE Photonics J. 2014, 6. [Google Scholar] [CrossRef]
  58. Nam, S.H.; Yin, S. High-temperature sensing using whispering gallery mode resonance in bent optical fibers. IEEE Photonics Technol. Lett. 2005, 17, 2391–2393. [Google Scholar] [CrossRef]
  59. Hassan, H.U.; Janting, J.; Aasmul, S.; Bang, O. Polymer Optical Fiber Compound Parabolic Concentrator Fiber Tip-Based Glucose Sensor: In Vitro Testing. IEEE Sens. J. 2016, 16, 8483–8488. [Google Scholar] [CrossRef]
  60. Hou, C.H.; Chiang, C.C.; Hsieh, T.S.; Li, Y.L.; Tsai, L.; Hsu, C.Y. Double-knotted U-shaped spiral optical fiber probe for measuring glucose solutions. Optik 2020, 207. [Google Scholar] [CrossRef]
  61. Teng, C.; Yu, F.; Deng, S.; Liu, H.; Yuan, L.; Zheng, J.; Deng, H. Displacement sensor based on a small U-shaped single-mode fiber. Sensors 2019, 19, 2531. [Google Scholar] [CrossRef] [Green Version]
  62. Yang, X.; Yuan, Y.; Dai, Z.; Liu, F.; Huang, J. Sensors and Actuators B: Chemical Optical property and adsorption isotherm models of glucose sensitive membrane based on prism SPR sensor. Sens. Actuators B. Chem. 2016, 237, 150–158. [Google Scholar] [CrossRef]
  63. Raether, H. Surface-Plasmons on Smooth and Rough Surfaces and on Gratings. Springer Tracts Mod. Phys. 1988, 111, 1–133. [Google Scholar]
  64. Monzon-Hernandez, D.; Velazquez-Gonzalez, J.S.; Luna-Moreno, D.; Torres-Cisneros, M.; Hernandez-Romano, I. Prism-based Surface Plasmon Resonance for Dual-Parameter Sensing. IEEE Sens. J. 2018, 1748, 1–8. [Google Scholar] [CrossRef]
  65. Deng, S.; Wang, P.; Yu, X. Phase-sensitive surface plasmon resonance sensors: Recent progress and future prospects. Sensors 2017, 17, 2819. [Google Scholar] [CrossRef] [Green Version]
  66. Li, D.C.; Wu, J.W.; Wu, P.; Lin, Y.; Sun, Y.J.; Zhu, R.; Yang, J.; Xu, K.X. Glucose measurement using surface plasmon resonance sensor with affinity based surface modification by borate polymer. In Proceedings of the 2015 Transducers–2015 18th International Conference on Solid-State Sensors, Actuators and Microsystems (TRANSDUCERS), Anchorage, AK, USA, 21–25 June 2015. [Google Scholar]
  67. Zhang, A.P.; Gao, S.; Yan, G.; Bai, Y. Photonic Sensors Advances in Optical Fiber Bragg Grating Sensor Technologies. Photon-Sensors 2012, 2, 1–13. [Google Scholar] [CrossRef] [Green Version]
  68. Kurasawa, S.; Koyama, S. Verification of Non-Invasive Blood Glucose Measurement Method Based on Pulse Wave Signal Detected by FBG Sensor System. Sensors 2017, 17, 2702. [Google Scholar] [CrossRef] [Green Version]
  69. Lamberti, A.; Luyckx, G.; Van Paepegem, W.; Rezayat, A.; Vanlanduit, S. Detection, Localization and Quantification of Impact Events on a Stiffened Composite Panel with Embedded Fiber Bragg Grating Sensor Networks. Sensors 2017, 17, 743. [Google Scholar] [CrossRef] [Green Version]
  70. Series, C. Simple Glucose Measurement System Based on Uncladded Fiber Bragg Grating Etched with Nitric Acid Simple Glucose Measurement System Based on Uncladded Fiber Bragg Grating Etched with Nitric Acid. J. Phys. Conf. Ser. 2019. [Google Scholar] [CrossRef]
  71. Siddiq, N.A.; Asnawi, A.; Goshals, S.K.; Pramono, Y.H. Optical Spectrum of Uncladded Fiber Bragg Grating for Glucose Concentration Measurement Optical Spectrum of Uncladded Fiber Bragg Grating for Glucose Concentration Measurement. J. Phys. Conf. Ser. 2020. [Google Scholar] [CrossRef]
  72. Sridevi, S.; Vasu, K.S.; Sampath, S.; Asokan, S.; Sood, A.K. Optical detection of glucose and glycated hemoglobin using etched fiber Bragg gratings coated with functionalized reduced graphene oxide. J. Biophotonics 2015, 10, 1–10. [Google Scholar] [CrossRef] [PubMed]
  73. Hang, X.U.Z.; Iu, F.U.L.; Iangqiang, Q.F.U.; Hen, X.I.C.; Ian, J.X.U.; Hang, Z.H.Z.; Uang, Y.U.H.; Ang, Y.O.N.G.T.; Uan, T.; Uo, G.; et al. Hydrogen peroxide and glucose concentration measurement using optical fiber grating sensors with corrodible plasmonic nanocoatings. Biomed. Opt. Express 2018, 9, 225–231. [Google Scholar]
  74. Lobry, M.; Lahem, D.; Loyez, M.; Debliquy, M.; Chah, K.; David, M.; Caucheteur, C. Non-enzymatic D-glucose plasmonic optical fi ber grating biosensor. Biosens. Bioelectron. 2019, 142, 111506. [Google Scholar] [CrossRef] [Green Version]
  75. Jiang, B.; Zhou, K.; Wang, C.; Sun, Q.; Yin, G. Label-free glucose biosensor based on enzymatic graphene oxide-functionalized tilted fiber grating. Sens. Actuators B Chem. 2018, 254, 1033–1039. [Google Scholar] [CrossRef]
  76. Saxl, T.; Khan, F.; Ferla, M.; Birch, D.; Pickup, J. A fluorescence lifetime-based fibre-optic glucose sensor using glucose/galactose-binding protein. Analyst 2011, 136, 968–972. [Google Scholar] [CrossRef] [Green Version]
  77. Singh, S.; Gupta, B.D. Fabrication and characterization of a surface plasmon resonance based fiber optic sensor using gel entrapment technique for the detection of low glucose concentration. Sens. Actuators B Chem. 2013, 177, 589–595. [Google Scholar] [CrossRef]
  78. Li, D.; Wu, J.; Wu, P.; Lin, Y.; Sun, Y.; Zhu, R.; Yang, J.; Xu, K. Affinity based glucose measurement using fiber optic surface plasmon resonance sensor with surface modification by borate polymer. Sens. Actuators B Chem. 2015, 213, 295–304. [Google Scholar] [CrossRef]
  79. Milenko, K.; Fuglerud, S.S.; Jernelv, I.L.; Aksnes, A.; Ellingsen, R.; Hjelme, D.R. Towards fiber-optic Raman spectroscopy for glucose sensing. Opt. InfoBase Conf. Pap. 2018, Part F98-B, 1–2. [Google Scholar] [CrossRef]
  80. Trettnak, W.; Wolfbeis, O.S. A fully reversible fiber optic glucose biosensor based on the intrisic fluorescense of glucose oxidase. Fresenius’ Z. für Anal. Chem. 1989, 334, 427–430. [Google Scholar] [CrossRef]
  81. Binu, S.; Mahadevan Pillai, V.P.; Pradeepkumar, V.; Padhy, B.B.; Joseph, C.S.; Chandrasekaran, N. Fibre optic glucose sensor. Mater. Sci. Eng. C 2009, 29, 183–186. [Google Scholar] [CrossRef]
  82. Qiu, H.W.; Xu, S.C.; Jiang, S.Z.; Li, Z.; Chen, P.X.; Gao, S.S.; Zhang, C.; Feng, D.J. A novel graphene-based tapered optical fiber sensor for glucose detection. Appl. Surf. Sci. 2015, 329, 390–395. [Google Scholar] [CrossRef]
  83. Verma, R.; Gupta, B.D. A novel approach for simultaneous sensing of urea and glucose by SPR based optical fiber multianalyte sensor. Analyst 2014, 139, 1449–1455. [Google Scholar] [CrossRef] [PubMed]
  84. Tiangco, C.; Fon, D.; Sardesai, N.; Kostov, Y.; Sevilla, F.; Rao, G.; Tolosa, L. Fiber optic biosensor for transdermal glucose based on the glucose binding protein. Sens. Actuators B Chem. 2017, 242, 569–576. [Google Scholar] [CrossRef]
  85. Yunianto, M.; Eka, D.; Permata, A.N.; Ariningrum, D.; Wahyuningsih, S.; Marzuki, A. Development and testing of a plastic optical fiber grating biosensor for detection of glucose in the blood. J. Phys. Conf. Ser. 2016, 755. [Google Scholar] [CrossRef]
  86. Zhao, M.; Dai, L.; Zhong, N.; Wang, Z.; Chen, M.; Li, B.; Luo, B.; Tang, B.; Shi, S.; Song, T.; et al. Wet etching technique for fabrication of a high-quality plastic optical fiber sensor. Appl. Opt. 2017, 56, 8845. [Google Scholar] [CrossRef] [PubMed]
  87. Azkune, M.; Ruiz-Rubio, L.; Aldabaldetreku, G.; Arrospide, E.; Pérez-Álvarez, L.; Bikandi, I.; Zubia, J.; Vilas-Vilela, J.L. U-shaped and surface functionalized polymer optical fiber probe for glucose detection. Sensors 2018, 18, 34. [Google Scholar] [CrossRef] [PubMed] [Green Version]
  88. Azkune, M.; Frosch, T.; Arrospide, E.; Aldabaldetreku, G.; Bikandi, I.; Zubia, J.; Popp, J.; Frosch, T. Liquid-Core Microstructured Polymer Optical Fiber as Fiber-Enhanced Raman Spectroscopy Probe for Glucose Sensing. J. Light. Technol. 2019, 37, 2981–2988. [Google Scholar] [CrossRef]
  89. Asher, S.A.; Alexeev, V.L.; Goponenko, A.V.; Sharma, A.C.; Lednev, I.K.; Wilcox, C.S.; Finegold, D.N. Photonic crystal carbohydrate sensors: Low ionic strength sugar sensing. J. Am. Chem. Soc. 2003, 125, 3322–3329. [Google Scholar] [CrossRef]
  90. Mohamed, M.S.; Hameed, M.F.O.; Areed, N.F.F.; El-Okr, M.M.; Obayya, S.S.A. Analysis of highly sensitive photonic crystal biosensor for glucose monitoring. Appl. Comput. Electromagn. Soc. J. 2016, 31, 836–842. [Google Scholar]
  91. Azab, M.Y.; Hameed, M.F.; Heikal, A.M.; Obayya, S.S.; Swillam, M.A. Surface Plasmon Photonic Crystal Fiber Biosensor for Glucose Monitoring. Opt. Quantum Electron. 2017, 49, 5. [Google Scholar] [CrossRef]
  92. Natesan, A.; Kuppusamy, P.G.; Gopal, T.R.; Dhasarathan, V.; Aly, A.H. Tricore photonic crystal fibre based refractive index sensor for glucose detection. IET Optoelectron. 2019, 13, 118–123. [Google Scholar] [CrossRef]
  93. Hossain, M.; Podder, E.; Adhikary, A.; Al-Mamun, A. Optimized Hexagonal Photonic Crystal Fibre Sensor for Glucose Sensing. Adv. Res. 2018, 13, 1–7. [Google Scholar] [CrossRef]
  94. Rosenzweig, Z.; Kopelman, R. Analytical properties of miniaturized oxygen and glucose fiber optic sensors. Sens. Actuators B Chem. 1996, 36, 475–483. [Google Scholar] [CrossRef]
  95. Yin, M.; Huang, B.; Gao, S.; Zhang, A.P.; Ye, X. Optical fiber LPG biosensor integrated microfluidic chip for ultrasensitive glucose detection. Biomed. Opt. Express 2016, 7, 2067. [Google Scholar] [CrossRef] [Green Version]
  96. Fang, Y.L.; Wang, C.T.; Chiang, C.C. A small U-Shaped bending-induced interference optical fiber sensor the measurement of glucose solutions. Sensors 2016, 16, 1460. [Google Scholar] [CrossRef] [PubMed] [Green Version]
  97. Sun, X.; Li, N.; Zhou, B.; Zhao, W.; Liu, L.; Huang, C.; Ma, L.; Kost, A.R. Non-enzymatic glucose detection based on phenylboronic acid modified optical fibers. Opt. Commun. 2018, 416, 32–35. [Google Scholar] [CrossRef]
  98. Aruna Gandhi, M.S.; Liu, X.; Li, Q. D-glucose Sensing Fiber Optic D-type Microbiosensor. Asia Commun. Photonics Conf. ACP 2018, 2018, 1–3. [Google Scholar] [CrossRef]
  99. Novais, S.; Ferreira, C.I.A.; Ferreira, M.S.; Pinto, J.L. Optical Fiber Tip Sensor for the Measurement of Glucose Aqueous Solutions. IEEE Photonics J. 2018, 10. [Google Scholar] [CrossRef]
  100. Khan, M.R.R.; Watekar, A.V.; Kang, S.W. Fiber-Optic Biosensor to Detect pH and Glucose. IEEE Sens. J. 2018, 18, 1528–1538. [Google Scholar] [CrossRef]
  101. Smith, J.L. The Pursuit of Noninvasive Glucose: Hunting the Deceitful Turkey. Available online: https://www.researchgate.net/publication/215519631_The_Pursuit_of_Noninvasive_Glucose_Hunting_the_Deceitful_Turkey (accessed on 15 January 2021).
  102. Purvinis, G.; Cameron, B.D.; Altrogge, D.M. Noninvasive polarimetric-based glucose monitoring: An in vivo study. J. Diabetes Sci. Technol. 2011, 5, 380–387. [Google Scholar] [CrossRef] [PubMed] [Green Version]
  103. Winkler, A.M.; Bonnema, G.T.; Barton, J.K. Optical polarimetry for noninvasive glucose sensing enabled by Sagnac interferometry. Appl. Opt. 2011, 50, 2719–2731. [Google Scholar] [CrossRef] [PubMed]
  104. Ahmad, R.; Tripathy, N.; Ahn, M.S.; Bhat, K.S.; Mahmoudi, T.; Wang, Y.; Yoo, J.Y.; Kwon, D.W.; Yang, H.Y.; Hahn, Y.B. Highly Efficient Non-Enzymatic Glucose Sensor Based on CuO Modified Vertically-Grown ZnO Nanorods on Electrode. Sci. Rep. 2017, 7, 1–10. [Google Scholar] [CrossRef] [PubMed] [Green Version]
  105. Vega, K.; Jiang, N.; Liu, X.; Kan, V.; Barry, N.; Maes, P.; Yetisen, A.; Paradiso, J. The dermal abyss: Interfacing with the skin by tattooing biosensors. Proc. Int. Symp. Wearable Comput. ISWC 2017, Part F1305, 138–145. [Google Scholar] [CrossRef]
  106. Szmacinski, H.; Lakowicz, J.R. Fluorescence lifetime-based sensing and imaging. Sens. Actuators B Chem. 1995, 29, 16–24. [Google Scholar] [CrossRef]
  107. Klonoff, D.C. Overview of Fluorescence Glucose Sensing. J. Diabetes Sci. Technol. 2012, 6, 1242–1250. [Google Scholar] [CrossRef] [Green Version]
  108. Oliver, N.S.; Toumazou, C.; Cass, A.E.G.; Johnston, D.G. Glucose sensors: A review of current and emerging technology. Diabetes Med. 2009, 197–210. [Google Scholar] [CrossRef]
  109. Maruo, K.; Oota, T.; Tsurugi, M.; Arimoto, H.; Tamura, M.; Ozaki, Y. New Methodology to Obtain a Calibration Model for Noninvasive Near-Infrared Blood Glucose Monitoring. Appl. Spectrosc. 2006, 60, 441–449. [Google Scholar] [CrossRef]
  110. Gourzi, M.; Rouane, A.; Guelaz, R.; Alavi, M.S.; Mchugh, M.B.; Nadi, M.; Roth, P. Non-invasive glycaemia blood measurements by electromagnetic sensor: Study in static and dynamic blood circulation. J. Med Eng. Technol. 2005, 29, 22–26. [Google Scholar] [CrossRef] [PubMed]
  111. Jahangiri, N. Non-invasive Optical Techniques for determination of blood Glucose levels: A Review Article. Iran. J. Med. Phys. 2014, 11, 224–232. [Google Scholar]
  112. Achao, D.L.I.; Ie, J.S.U.; Ang, J.I.A.Y.; Onglin, S.Y.U.; Hang, J.I.Z.; Exin, K.; Aixia, H.Y.U. Optical surface plasmon resonance sensor modified by mutant glucose/galactose-binding protein for affinity detection of glucose molecules. Biomed. Opt. Express 2017, 8, 51–57. [Google Scholar]
  113. Thoniyot, P.; Cappuccio, F.E.; Gamsey, S.; Cordes, D.B.; Wessling, R.A.; Singaram, B. Continuos glucose sensing with fluorescent thin-film hydrogels.2. fiber optic sensor fabrication and in vitro testing. Diabetes Technol. Ther. 2006, 8, 279–287. [Google Scholar] [CrossRef]
  114. Fallauto, C.; Perrone, G.; Vallan, A.; Member, S. Impact of Optical Fiber Characteristics in SPR Sensors for Continuous Glucose Monitoring. In Proceedings of the 2014 IEEE International Symposium on Medical Measurements and Applications (MeMeA), Lisbon, Portugal, 11–12 June 2014; pp. 5–9. [Google Scholar]
  115. Yuan, Y.I.Y.; Yang, X.I.Y.; Gong, D.E.G.; Liu, F.A.N.G.L.; Wenbin, W.H.U.; Cai, W.E.C.; Huang, J.U.N.H.; Ang, M. inghong Y. Investigation for terminal reflection optical fiber SPR glucose sensor and glucose sensitive membrane with immobilized GODs. Opt. Express 2017, 25, 512–518. [Google Scholar] [CrossRef] [PubMed]
Figure 1. Propagation of light through a narrowing [16].
Biosensors 11 00061 g001
Figure 2. U-shaped fiber optic schematic diagram [23].
Biosensors 11 00061 g002
Figure 3. Configuration of SPR excitation [65].
Biosensors 11 00061 g003
Figure 4. Tapered plasmonic fiber optic coated with gold film for increased sensitivity in the region tapered waist.
Biosensors 11 00061 g004
Figure 5. Diagram and working principle of fiber Bragg grating [69].
Biosensors 11 00061 g005
Figure 6. Schematic of the sensor for glucose detection in TFBG coated [75].
Biosensors 11 00061 g006
Figure 7. Multi-mode fiber optic sensor tip with beads [76].
Biosensors 11 00061 g007
Figure 8. Optical sensor spectrum with different glucose concentrations in a range of 0–260 mg/dL [77].
Biosensors 11 00061 g008
Figure 9. Schematic experimental setup to detect variation in the refractive index based on glucose concentration [81].
Biosensors 11 00061 g009
Figure 10. Experimental diagram of urea and glucose sensor [83].
Biosensors 11 00061 g010
Figure 11. Glucose concentrations from 0 to 10 mM [89].
Biosensors 11 00061 g011
Figure 12. Schematic drawing of the optical fiber in different stages [25].
Biosensors 11 00061 g012
Figure 13. Spectra of glucose concentrations from 0 to 60 mM [97].
Biosensors 11 00061 g013
Figure 14. Wavelength change at concentrations of 0–8% glucose in water [23].
Biosensors 11 00061 g014
Figure 15. Experimental arrangement of the glucose sensor described in [16].
Biosensors 11 00061 g015
Table 1. Advantages and disadvantages of the optical fiber sensor.
Sensor Fibers TechnologyAdvantagesDisadvantages
FluorescenceImmune to light spreading of tissueShort useful life
High specificityToxicity problems
Sensitive to very small concentrations of glucoseNoticeable to interference
SpectroscopyAbsorption band specifiesFake readings
High specificityStrong water absorption
Low level of penetration
Temperature-susceptible
ElectromagneticSingle-frequency useVery sensitive to temperature
No risk of ionizationSensitive to electromagnetic fields
SPRThey are not susceptible to electromagnetic interferenceCalibration process
They’re not disposable.Temperature sensitive
Very sensitive to small changes in glucoseSensitive to movement
Instant resultsBulky in size
Minimally invasive
Continuous monitoring
Table 2. Comparison of glucose sensors made with fiber optics.
Type of FiberParametersRef
Sensing SystemDetection RangeDynamic RangeImmobilization StructureResponse TimeSensitivity
MMFIn the extremeN/A45–360 mg/dLBoronic acid with fluorescent dye5 minN/A[113]
In the extreme542 nm0–100 mMAgarose or polystyrene1 hN/A[76]
Middle area600–750 nm0–260 mg/dLSilver and Sicilian60 sN/A[77]
Middle areaN/AN/AgoldN/A3632 nm/RIU[114]
Middle area625–668 nm1–300 mg/dLBorate chromium gold polymerN/AN/A[78]
N/A625–700 nm0–500 nm/dLGlucose oxidase and polyacrylamide22 s0.14 nm/(mg/dL)[115]
In the extremeN 785 nm0–1110 mMN/A10–20 sN/A[79]
PCFN/A496–624 nm0–100 mMBoronic acidN/AN/A[89]
N/A1400–1420 nm30–330 g/LN/AN/A422 nm/RIU[90]
In extreme600–750 nm40–400 mg/dLN/AN/AN/A[59]
N/A1663–1665 nmN/AgoldN/A200 nm/RIU[91]
N/A440–470 nm10–20 g/LSilicon substrateN/A23,267.33 nm/RIU[92]
N/A1200–1600 nm20–60 %N/AN/AN/A[93]
N/A4950–6930 nm10–40 g/LN/AN/A6930.6 nm/RIU[20]
POFIn extreme450–500 nm1.5–2 mMGlucose oxidase2–30 minN/A[80]
In extreme660 nm0–25 g/dLN/AN/A0.0072 V/wt[81]
Middle area620–635 nm1–40%GrapheneN/AN/A[82]
Middle area500–800 nm0–260 mg/dLcopper and tin oxideN/AN/A[83]
In extreme366–540 nm4–20 mMNI-NTA Agarose Beads50 s2.888 ± 0.08085[84]
Middle area581 nm81.2–235.1 mg/dLN/AN/AN/A[85]
Middle area500–750 nm10–80%Acetic acidN/A9.10 [(RIU)(g/L)]−1[86]
In extremeN/A0–25 mMmethyl methacrylate10 sN/A[87]
Middle area450–500 nmN/AMethyl methacrylateN/AN/A[88]
SMFIn extreme488 nm0.7–10 mMMethylene chloride1.5 sN/A[94]
Middle area500–550 nmN/AgoldN/A13.09 AU/RIU[25]
Middle area1510–1520 nm2–10 µMGlucose oxidase6 min–70 s205 nm/RIU[95]
Middle area1490–1532 nm6–30%N/AN/A0.85 dB[96]
In extreme1545–1560 nm0–60%Hydrofluoridric acidN/A1467.59 nm/RIU[99]
In extreme1280–1340 nm0–60 mMHydrofluoridric acidN/A0.1787%/nM[97]
Middle area880 nm10–50%GoldN/A12820 nm/RIU[98]
In extreme820–920 nm1 µM–1 MGold8–9 s3.25 nm/mM[100]
Middle area1480–1520 nm0–8%Gold and Glucose oxidaseN/A5.101 dB/%[23]
Middle area230–519 nm0–11 mMGraphene Oxide and GoldN/A1.06 nm/mM[16]
Publisher’s Note: MDPI stays neutral with regard to jurisdictional claims in published maps and institutional affiliations.