Pitch-Derived Activated Carbon Fibers for Emission Control of Low-Concentration Hydrocarbon


Abstract
:
1. Introduction
2. Experimental
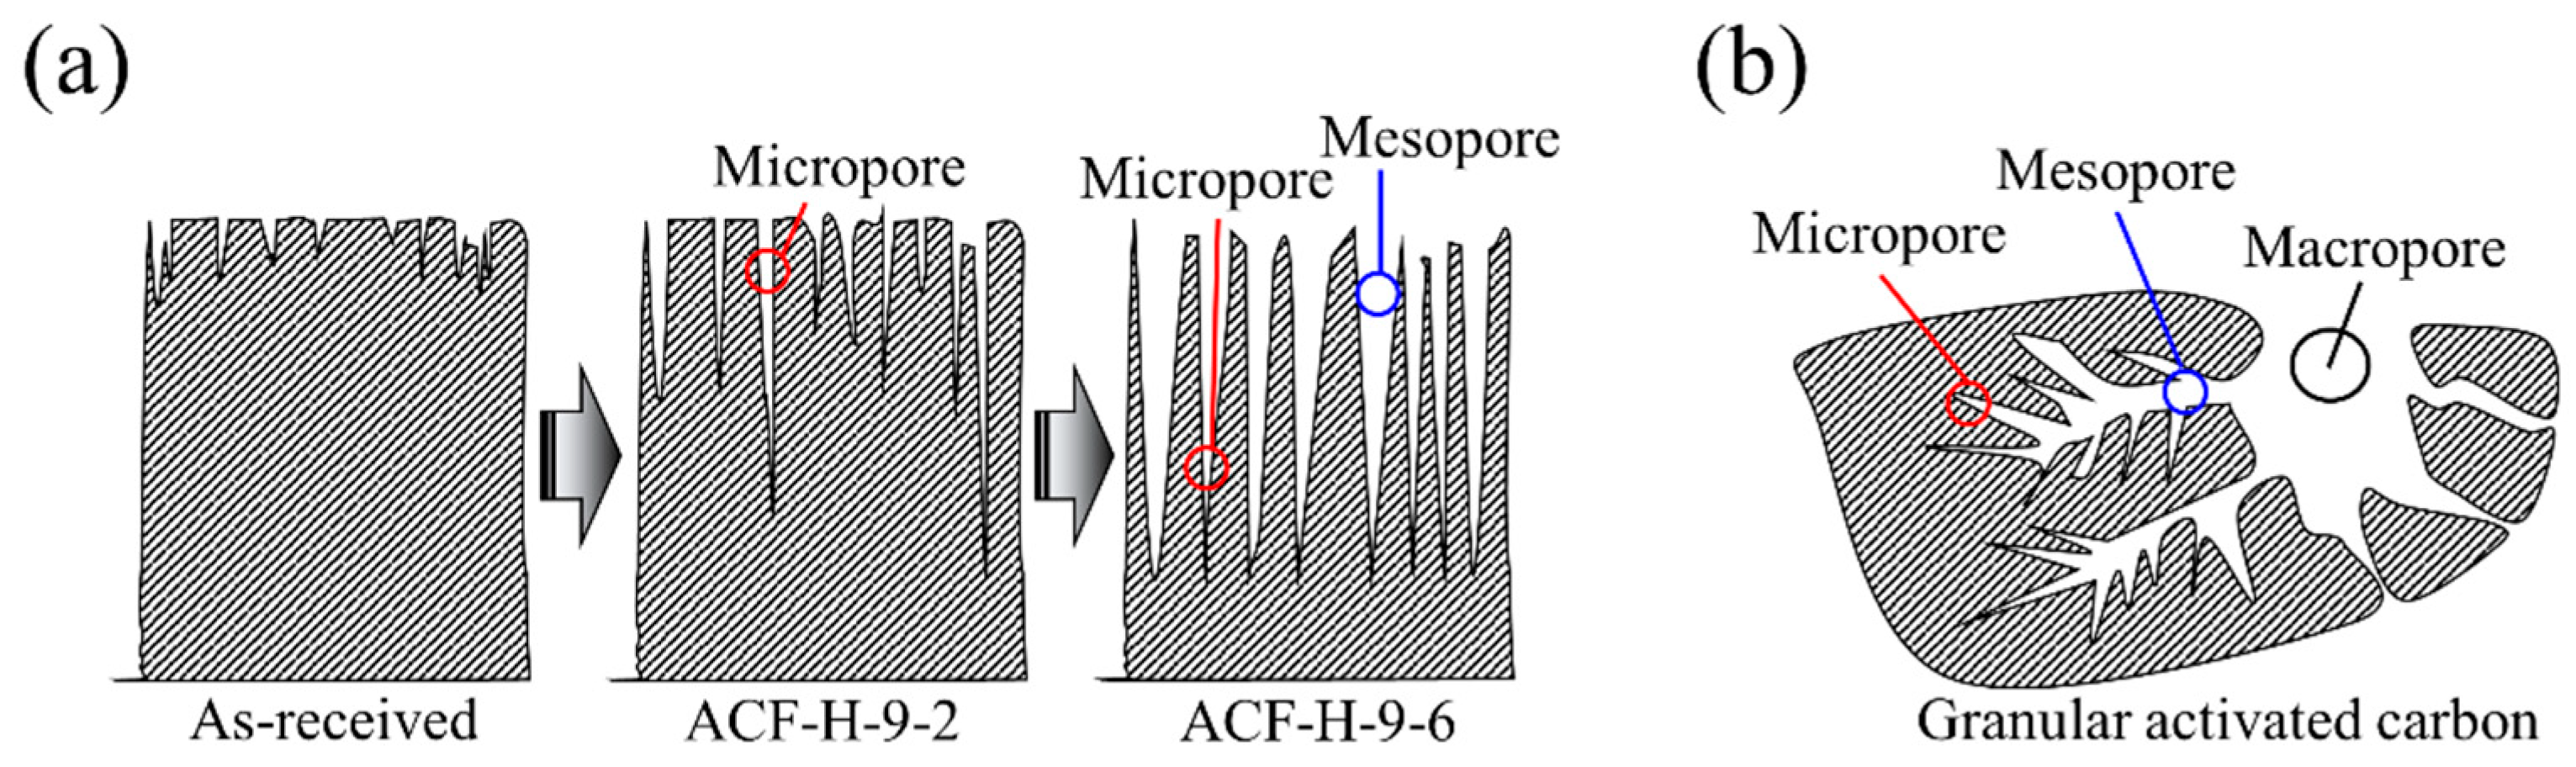
2.1. Preparation of Activated Carbon Fibers
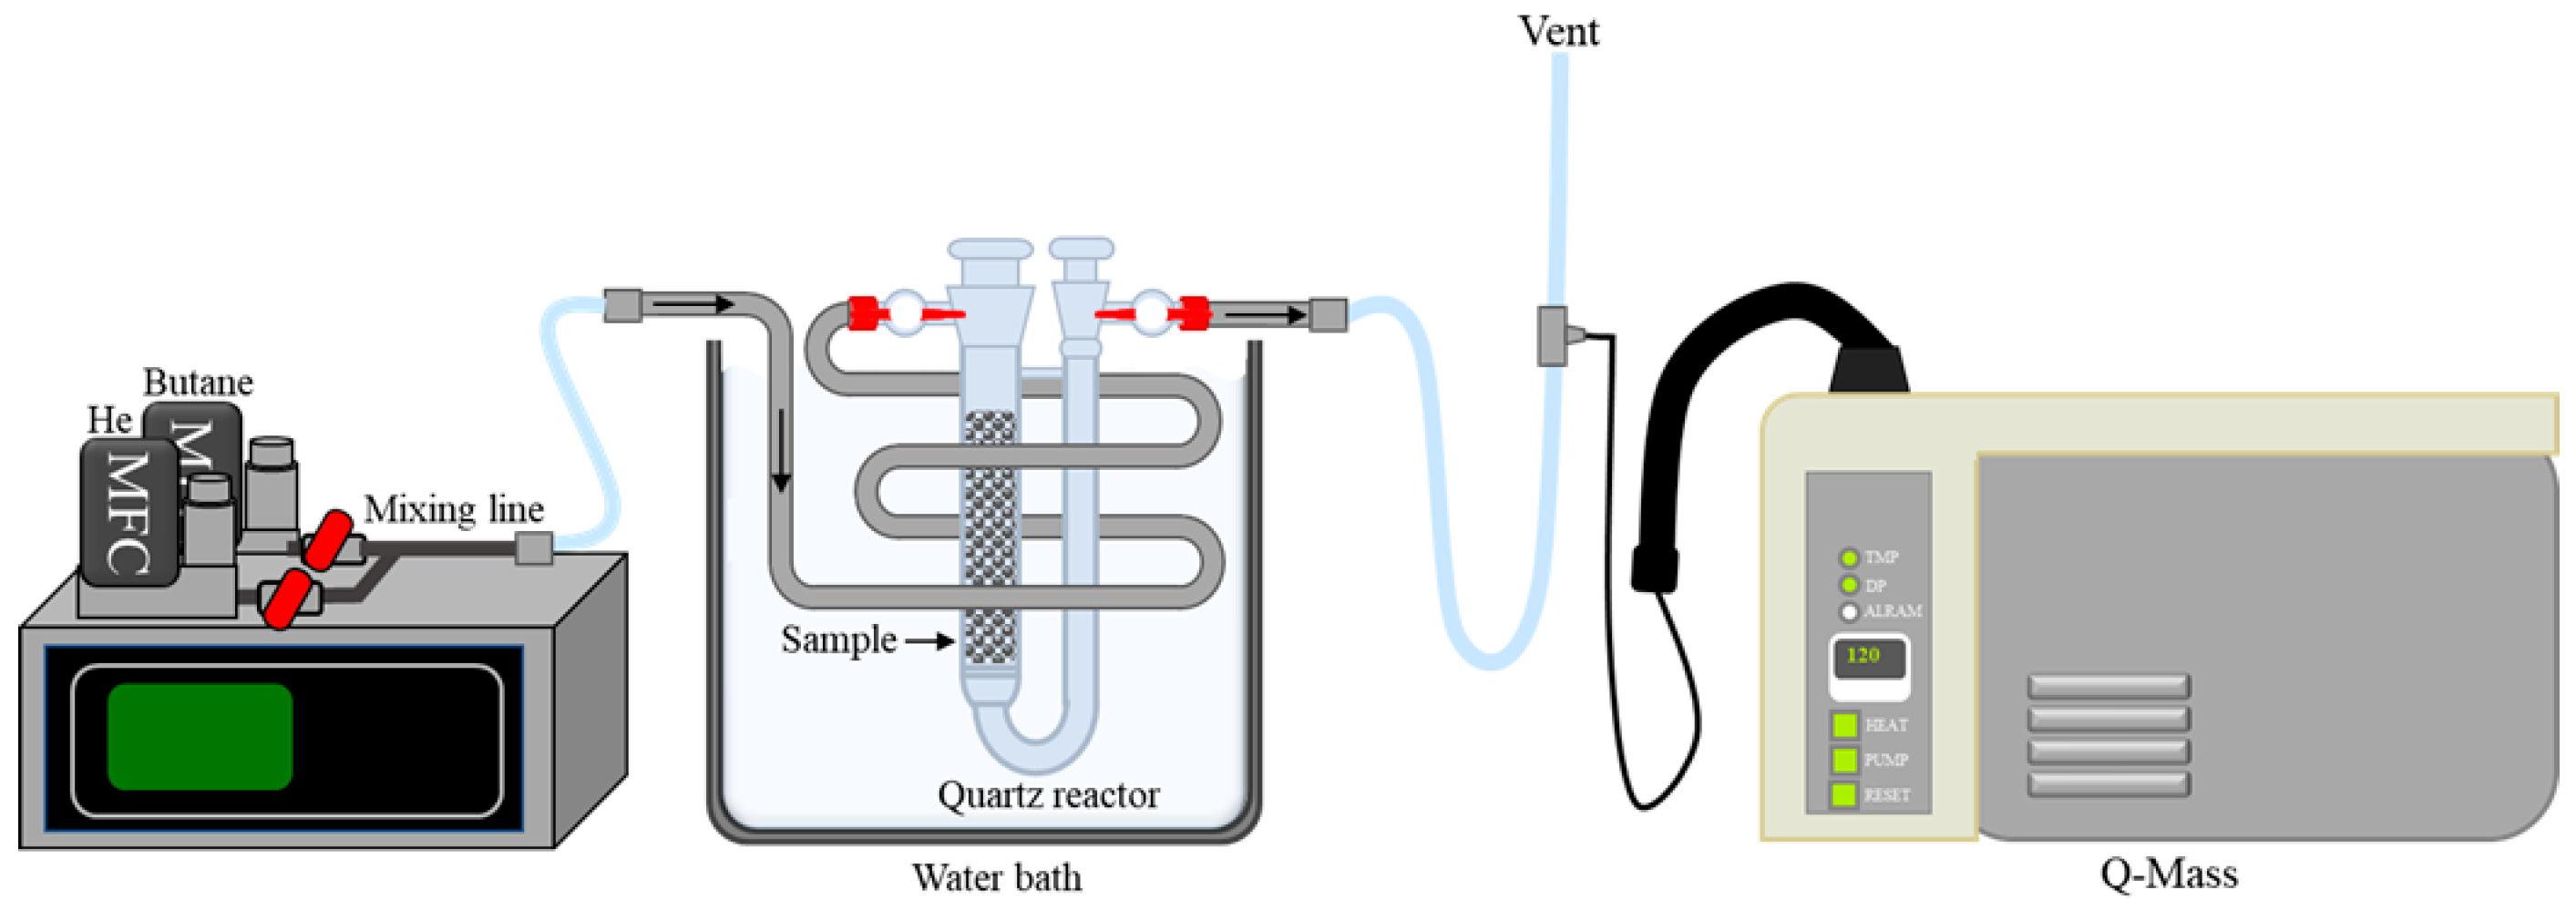
2.2. Characterizations
| Unit | Equation | ||
| Butane working capacitor | g/100 mL | (2) | |
| Butane working capacitor | % | (3) | |
| Butane activity | % | (4) | |
| Butane retentivity | % | (5) |
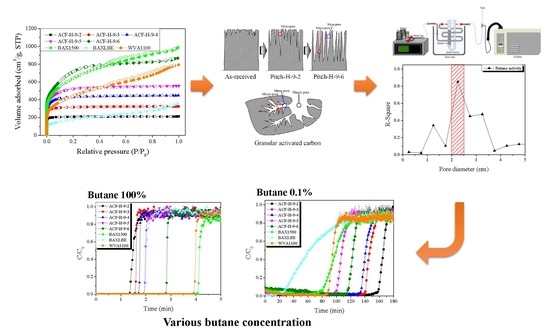
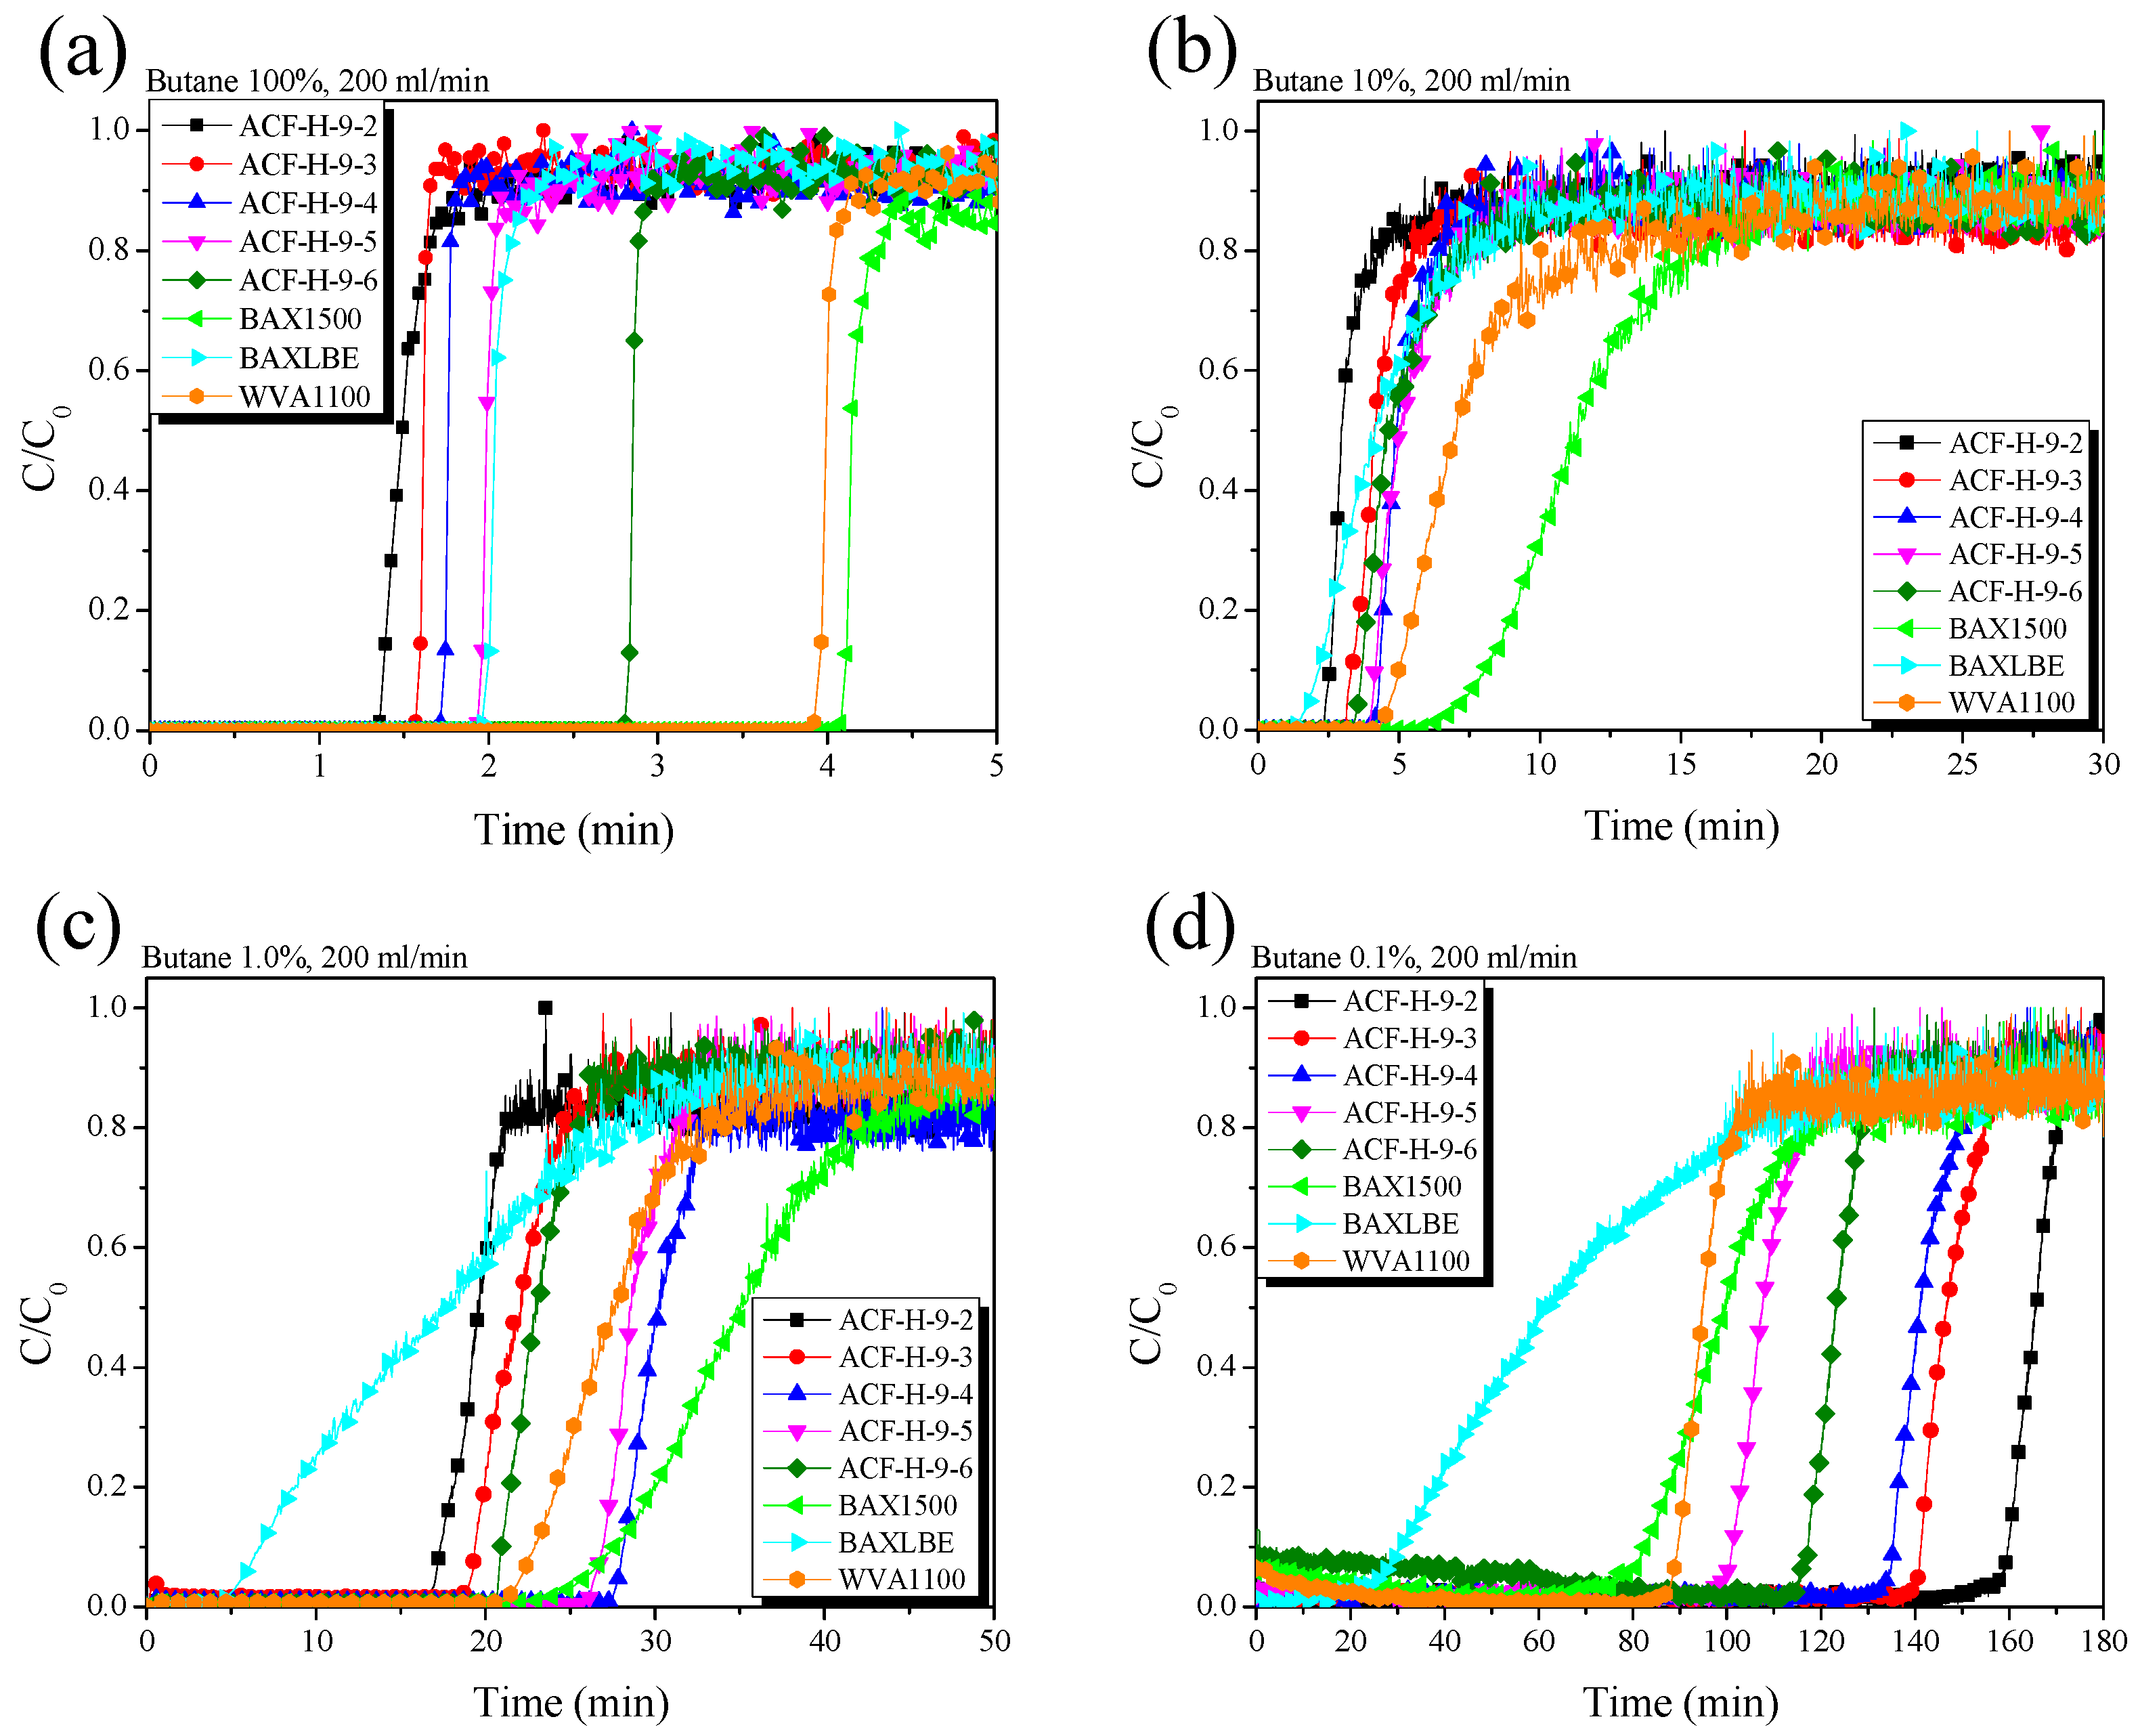
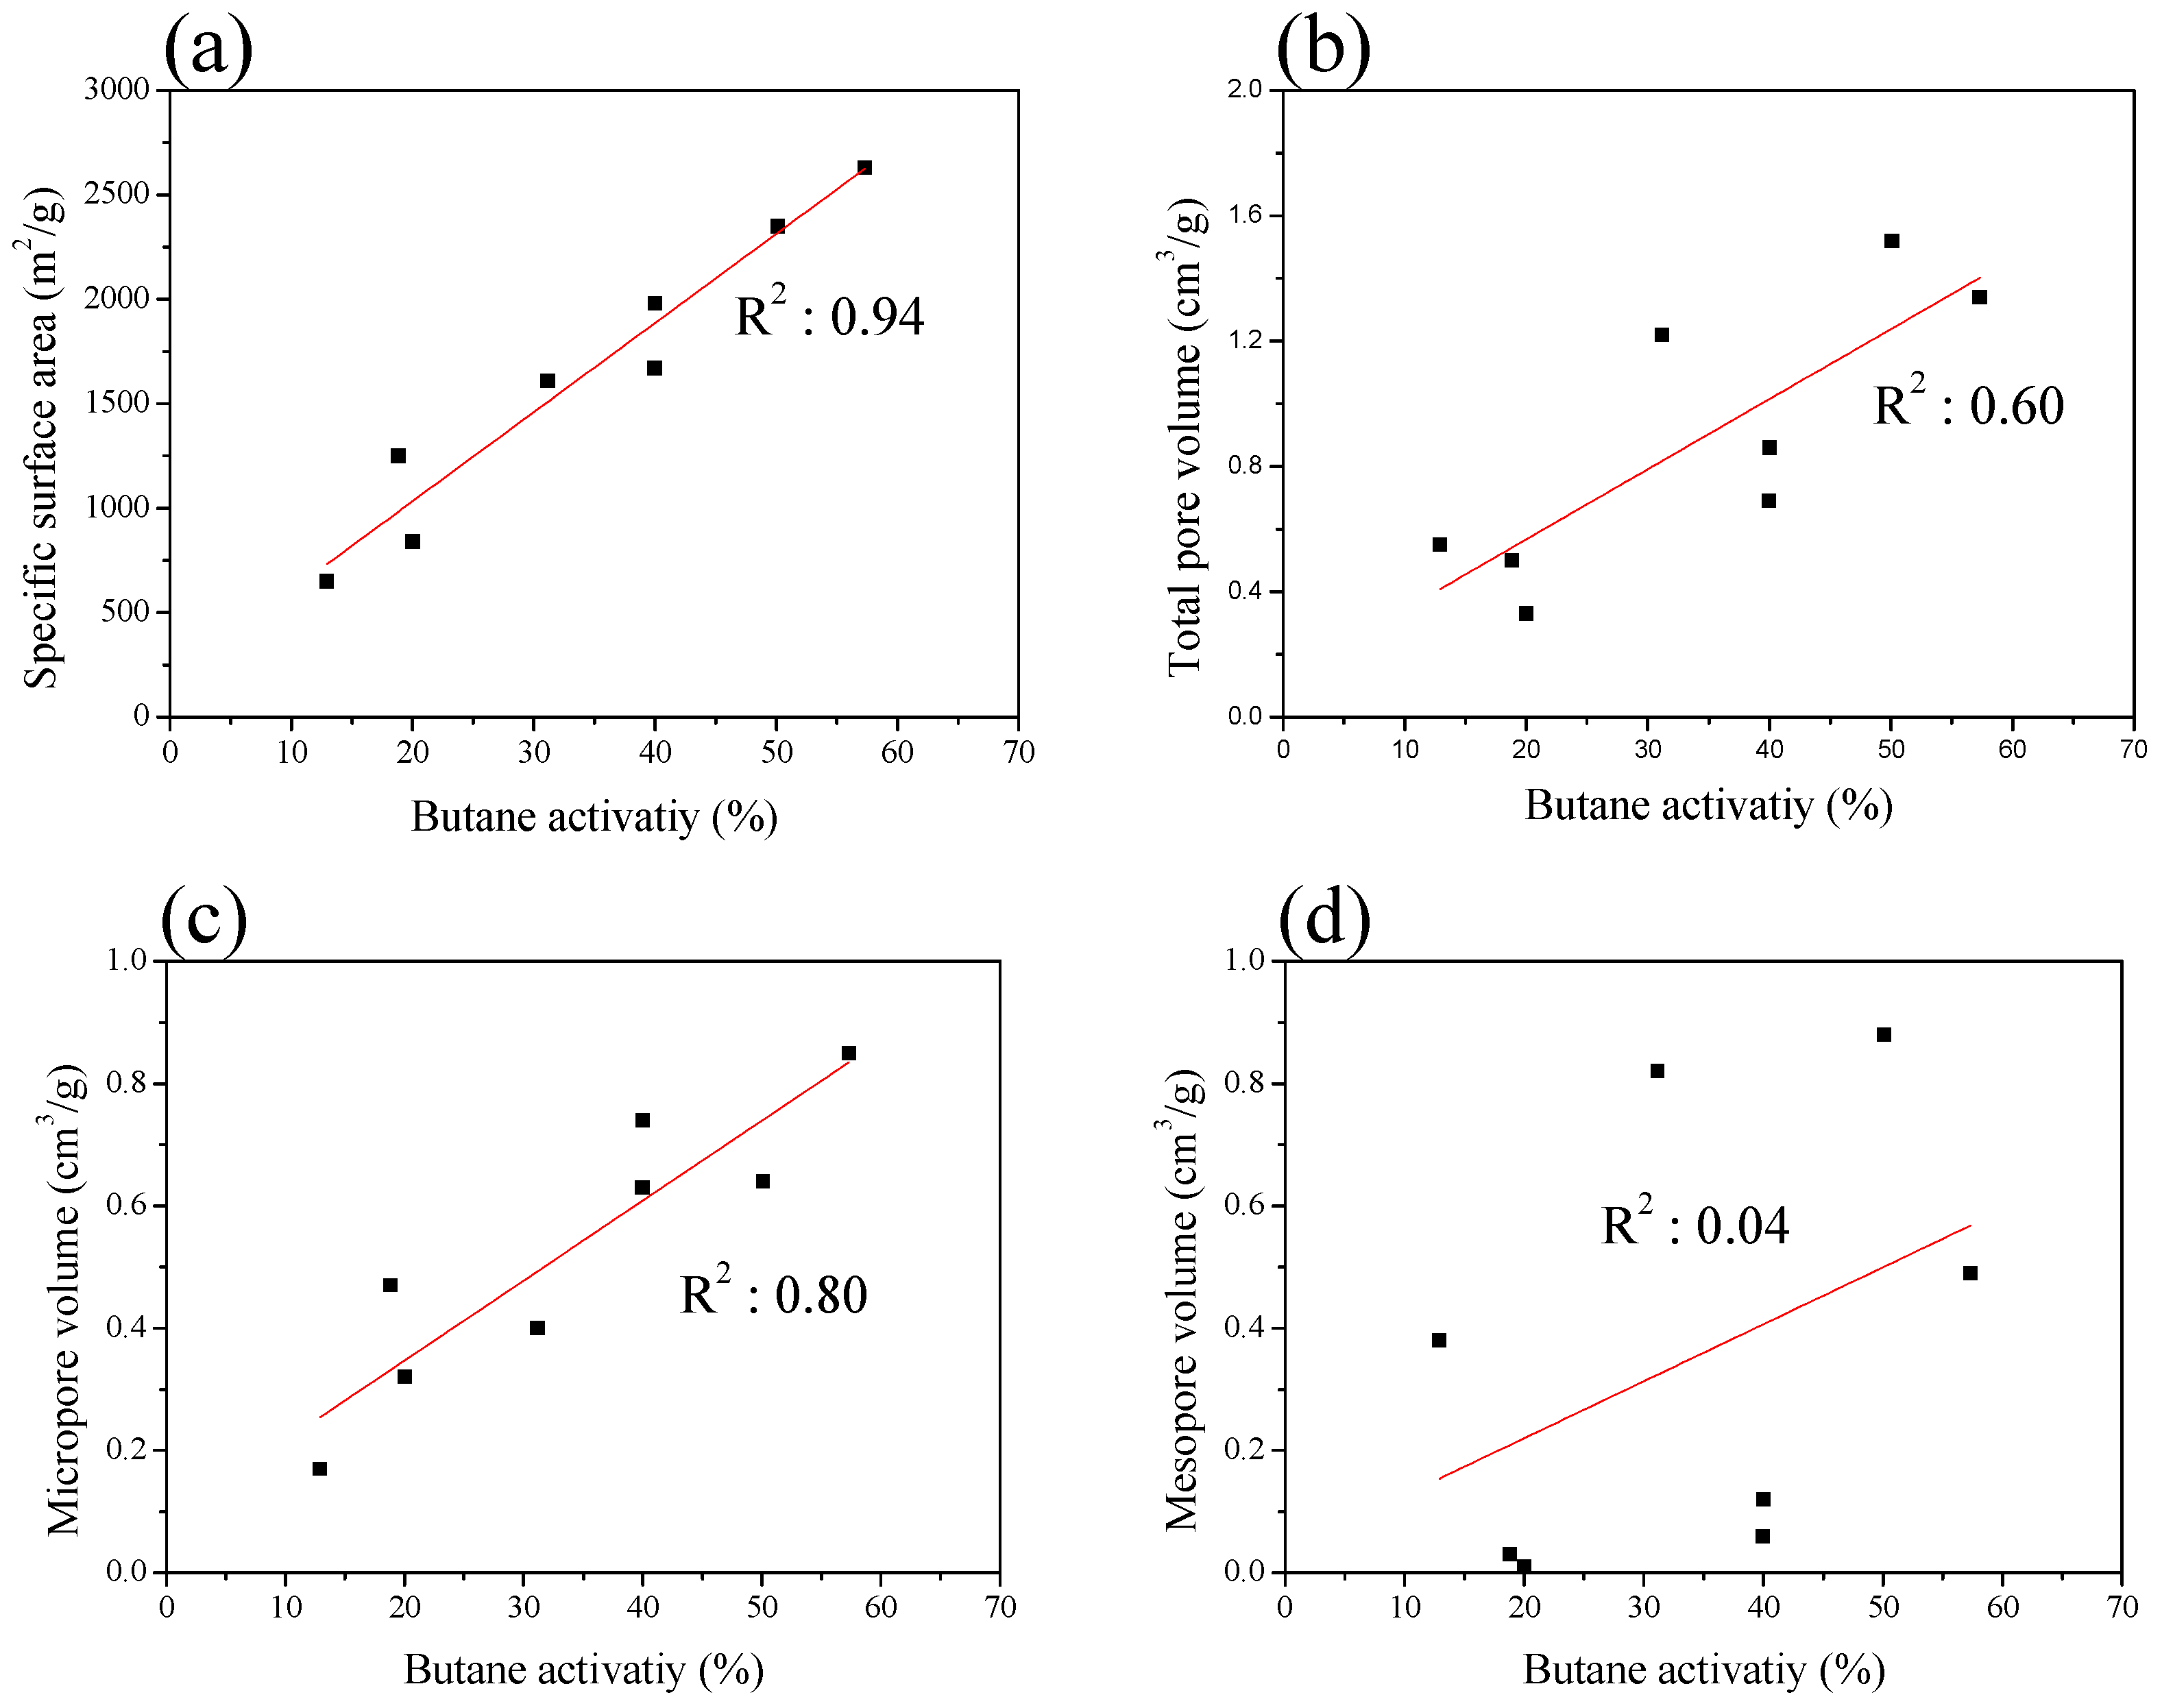
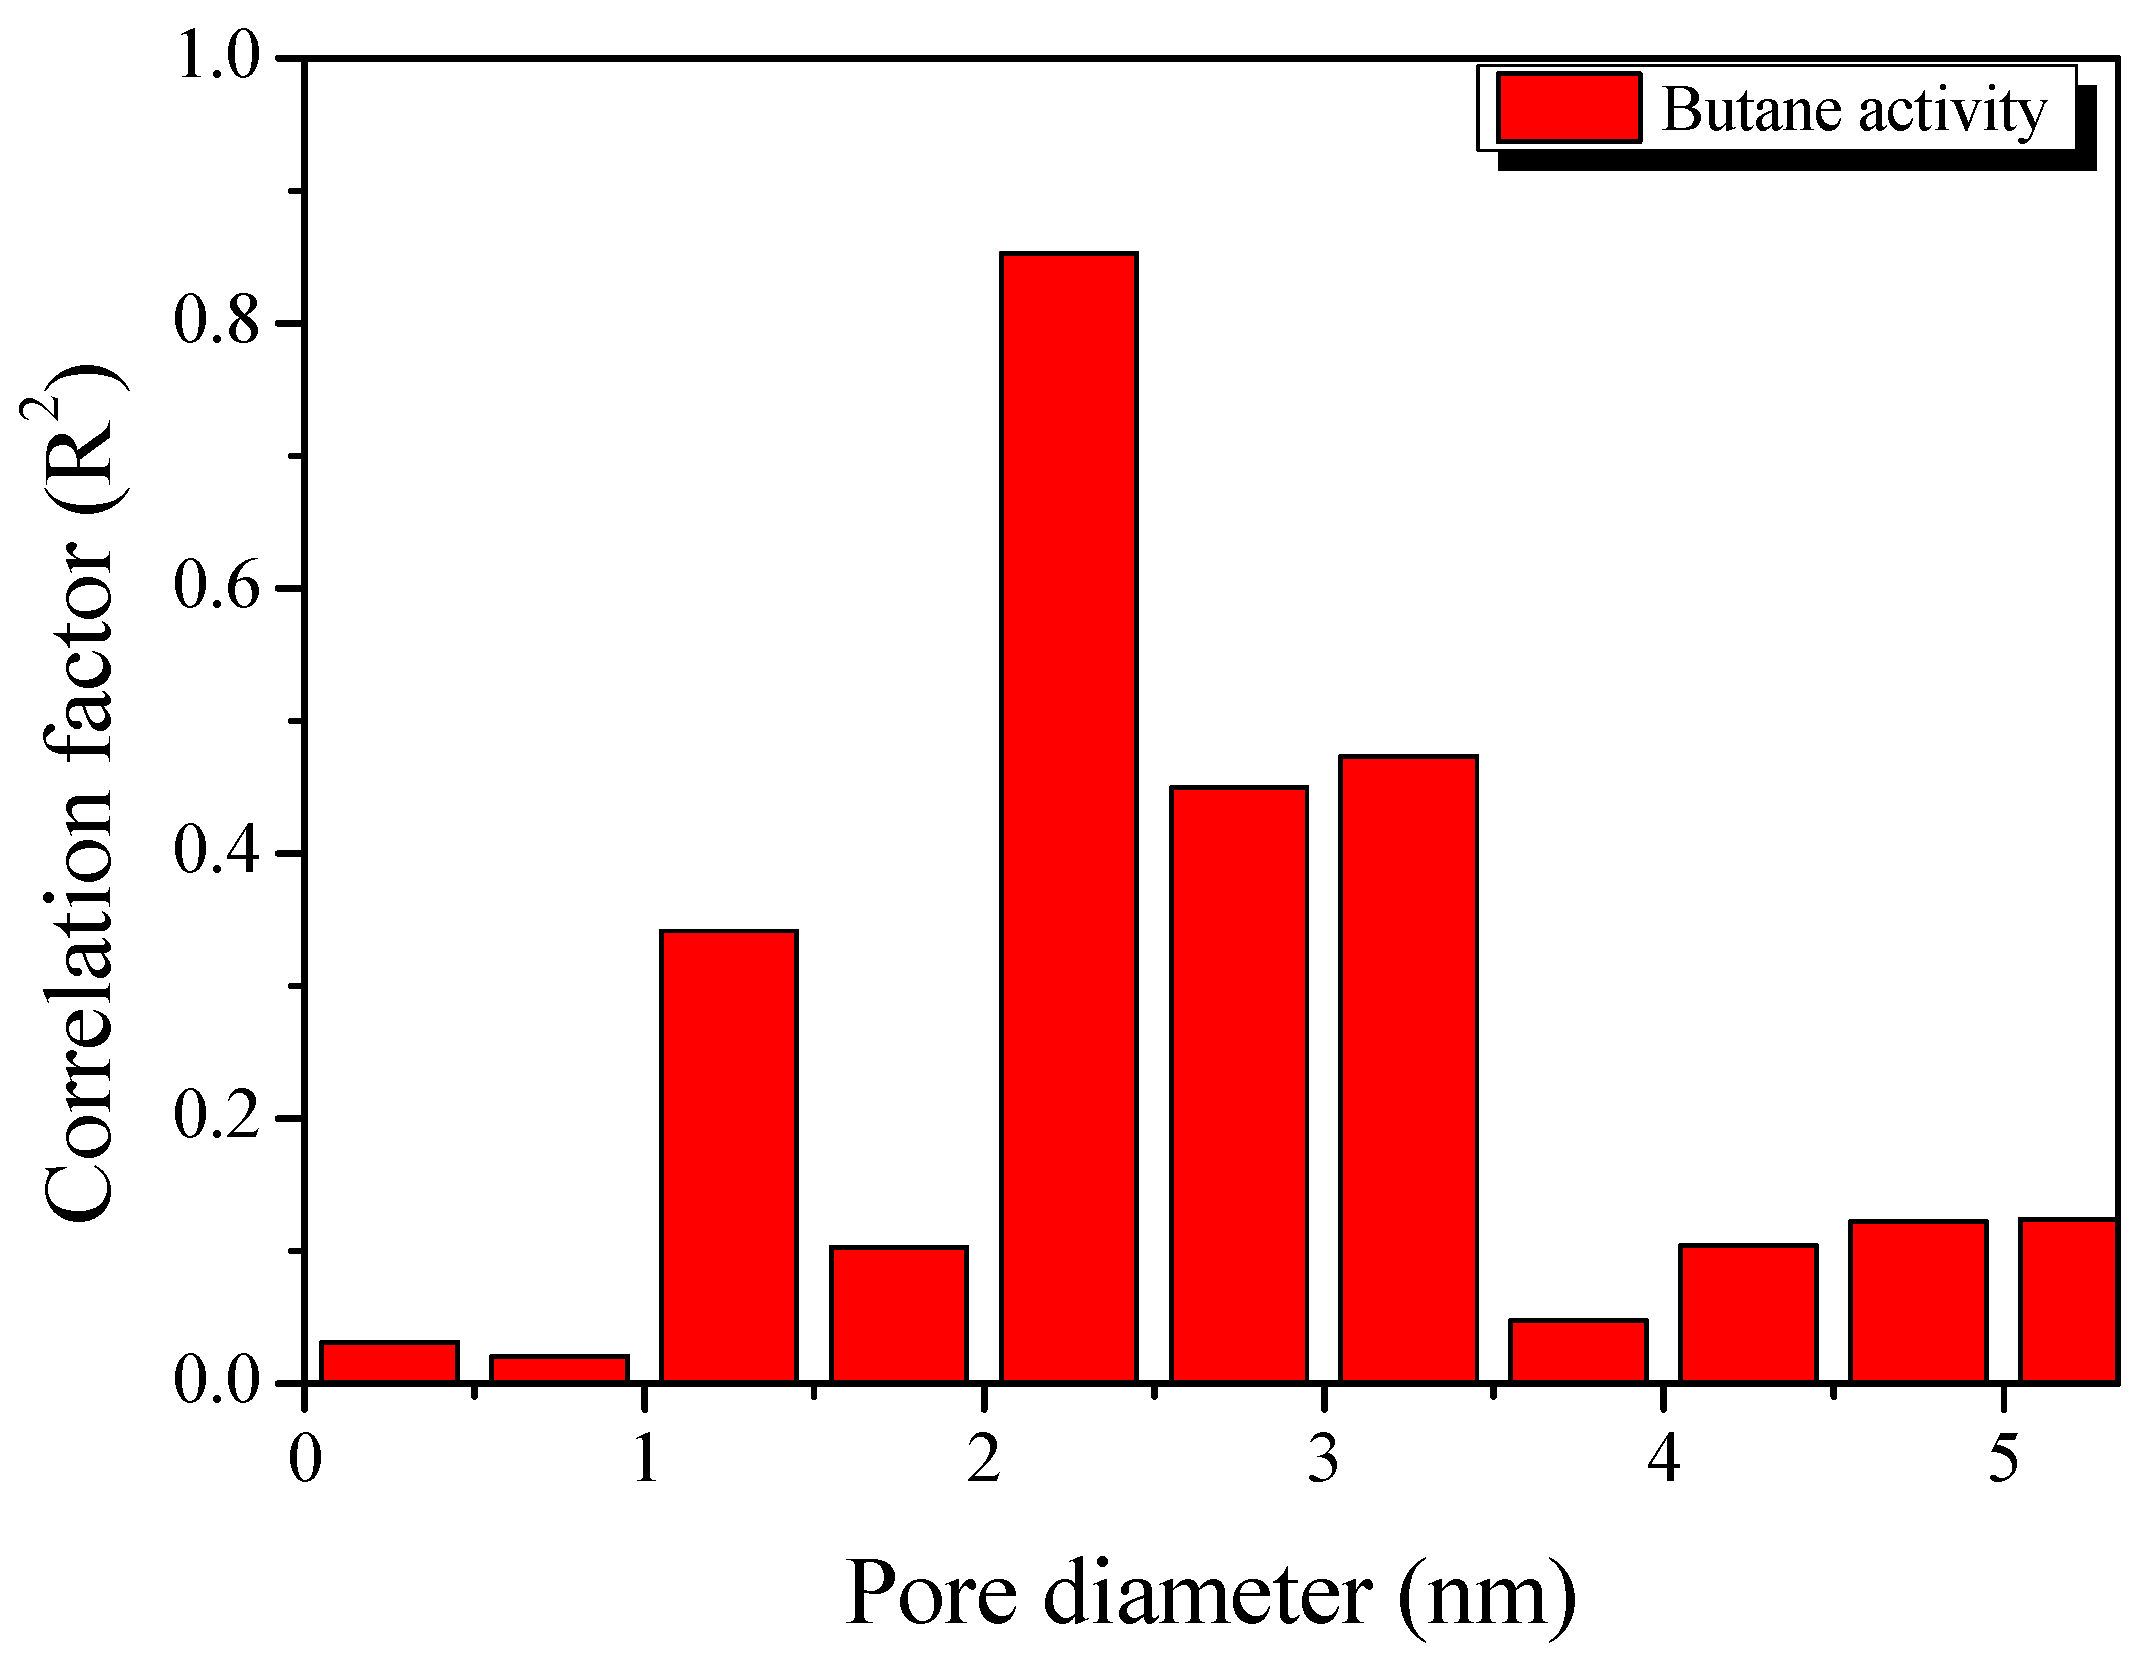
3. Results and Discussion
4. Conclusions
Author Contributions
Funding
Conflicts of Interest
References
- Council of the European Union (CEU). Annex to the Commission Regulation Amending Regulation (EC) No 692/2008 as Regards Emissions from Light Passenger and Commercial Vehicles (Euro 6); Council of the European Union: Brussels, Belgium, 2015. [Google Scholar]
- California Air Resources Board. Amendments to the Low-Emission Vehicle Program—LEV III. Available online: http://www.arb.ca.gov/msprog/levprog/leviii/leviii.htm (accessed on 19 August 2019).
- Manetas, C.; Sharifian, L.; Alexiadou, P.; Lafossas, F.A.; Mohammadi, A.; Koltsakis, G. Modeling of the Competitive Storage of NOx and Sulfur in Automotive Exhaust Catalysts. Top. Catal. 2019, 62, 10–17. [Google Scholar] [CrossRef]
- Kim, H.G.; Yu, Y.; Yang, X.; Ryu, S.K. Carbon dioxide (CO2) concentrations and activated carbon fiber filters in passenger vehicles in urban areas of Jeonju, Korea. Carbon Lett. 2019, 26, 74–80. [Google Scholar]
- Saliba, G.; Saleh, R.; Zhao, Y.; Presto, A.A.; Lambe, A.T.; Frodin, B.; Sardar, S.; Maldonado, H.; Maddox, C.; May, A.A.; et al. Comparison of Gasoline Direct-Injection (GDI) and Port Fuel Injection (PFI) Vehicle Emissions: Emission Certification Standards, Cold-Start, Secondary Organic Aerosol Formation Potential, and Potential Climate Impacts. Environ. Sci. Technol. 2017, 51, 6542–6552. [Google Scholar] [CrossRef] [PubMed]
- Yue, T.; Yue, X.; Chai, F.; Hu, J.; Lai, Y.; He, L.; Zhu, R. Characteristics of volatile organic compounds (VOCs) from the evaporative emissions of modern passenger cars. Atmos. Environ. 2017, 151, 62–69. [Google Scholar] [CrossRef]
- Faith, W.L.; Goodwin, J.T.; Morriss, F.V.; Bolze, C.J. Automobile Exhaust and Somog Formation. Air Pollut. Control Assoc. 1957, 7, 9–12. [Google Scholar] [CrossRef]
- Kotin, P.; Falk, H.L. Atmospheric Factors in Pathogenesis of Lung Cancer. Adv. Cancer Res. 1963, 7, 475–514. [Google Scholar] [PubMed]
- United States Environmental Protection Agency (EPA). Evaporative Emissions from On-Road Vehicles in MOVES2014; EPA: Washington, DC, USA, 2014. [Google Scholar]
- Hiltzik, L.H.; Jagiello, J.Z.; Tolles, E.D.; Williams, R.S. Method for Reducing Emissions from Evaporative Emissions Control Systems. U.S. Patent 6540815 B1, 1 April 2003. [Google Scholar]
- Ishikawa, K.; Abe, S.; Ishimura, S. Activated Carbon Product in Sheet form and Element of Device for Preventing Transpiration of Fuel Vapor. U.S. Patent 7666507 B2, 23 February 2010. [Google Scholar]
- Moyer, D.; Khami, R.; Bellis, A.; Luley, T. Evolution of Engine Air Induction System Hydrocarbon Traps; 2017-01-1014; SAE Technical Paper; SAE International: Warrendale, PA, USA, 2017. [Google Scholar]
- Jamrog, J.R.; Pierce, M.A.; Johnson, P.J. Evaporative Emission Canister for an Automotive Vehicle. U.S. Patent 6237574 B1, 29 May 2001. [Google Scholar]
- Vaishnav, D.; Ehteshami, M.; Collins, V.; Ali, S.; Gregory, A.; Werner, M. CFD Driven Parametric Design of Air-Air Jet Pump for Automotive Carbon Canister Purging. SAE Int. J. Passeng. Cars-Mech. Syst. 2017, 10, 474–486. [Google Scholar] [CrossRef]
- Lee, H.M.; Baek, J.; An, K.H.; Park, S.J.; Park, Y.K.; Kim, B.J. Effects of Pore Structure on n-Butane Adsorption Characteristics of Polymer-Based Activated Carbon. Ind. Eng. Chem. Res. 2019, 58, 736–741. [Google Scholar] [CrossRef]
- Tolles, E.D.; Dimitri, M.S.; Matthews, C.C. High Activity, High Density Activated Carbon. U.S. Patent 5204310, 20 April 1993. [Google Scholar]
- Brown, T.C. Adsorption Properties from Pressure-Varying Langmuir Parameters: N-Butane and Isobutane on Activated Carbon. Energy Fuels 2017, 31, 2109–2117. [Google Scholar] [CrossRef]
- Yuan, H.; Jin, B.; Meng, L.Y. Effect of the SBA-15 template and KOH activation method on CO2 adsorption by N-doped polypyrrole-based porous carbons. Carbon Lett. 2018, 28, 116–120. [Google Scholar]
- Jeguirim, M.; Belhachemi, M.; Limousy, L.; Bennicim, S. Adsorption/reduction of nitrogen dioxide on activated carbons: Textural properties versus surface chemistry—A review. Chem. Eng. J. 2018, 347, 493–504. [Google Scholar] [CrossRef]
- Kim, M.J.; Lee, S.; Lee, K.M.; Jo, H.; Choi, S.S.; Lee, Y.S. Effect of CuO introduced on activated carbon fibers formed by electroless plating on the NO gas sensing. J. Ind. Eng. Chem. 2018, 60, 341–347. [Google Scholar] [CrossRef]
- Ohc, J.Y.; You, Y.W.; Park, J.; Hong, J.S.; Heo, I.; Lee, C.H.; Suh, J.K. Adsorption characteristics of benzene on resin-based activated carbon under humid conditions. J. Ind. Eng. Chem. 2019, 71, 242–249. [Google Scholar]
- Das, D.; Gaur, V.; Verma, N. Removal of volatile organic compound by activated carbon fiber. Carbon 2004, 42, 2949–2962. [Google Scholar] [CrossRef]
- Miura, K.; Nakagawa, H.; Okamoto, H. Production of high density activated carbon fiber by a hot briquetting method. Carbon 2000, 38, 119–125. [Google Scholar] [CrossRef]
- McCue, J.C.; Repik, A.J.; Miller, C.E. Shaped Wood-Based Active Carbon. U.S. Patent 4677086, 30 June 1987. [Google Scholar]
- Happel, J. Pressure Drop Due to Vapor Flow through Moving Beds. Ind. Eng. Chem. 1949, 41, 1161–1174. [Google Scholar] [CrossRef]
- Zhang, X.; Gao, B.; Creamer, A.E.; Cao, C.; Li, Y. Adsorption of VOCs onto engineered carbon materials: A review. J. Hazard. Mater. 2017, 338, 102–123. [Google Scholar] [CrossRef]
- Wigmans, T. Industrial aspects of production and use of activated carbons. Carbon 1989, 27, 13–22. [Google Scholar] [CrossRef]
- Brunauer, S.; Emmet, P.H.; Teller, W.E. Adsorption of gases in multimolecular layers. J. Am. Chem. Soc. 1938, 60, 309–319. [Google Scholar] [CrossRef]
- Lastoskie, C.; Gubbins, K.E.; Quirke, N. Pore size distribution analysis of microporous carbons: A density functional theory approach. J. Phys. Chem. 1993, 97, 4786–4796. [Google Scholar] [CrossRef]
- Olivier, J.P.; Conklin, W.B.; Szombathely, M.V. Determination of pore size distribution from density functional theory: A comparison of nitrogen and argon results. Stud. Surf. Sci. Catal. 1994, 87, 81–89. [Google Scholar]
- Barrett, E.P.; Joyner, L.G.; Halenda, P.P. The determination of pore volume and area distributions in porous substances. I. Computations from nitrogen isotherms. J. Am. Chem. Soc. 1951, 73, 373–380. [Google Scholar] [CrossRef]
- American Society for Testing and Materials. Standard Test Method for Determination of Butane Working Capacity of Activated Carbon; ASTM Standard D5228-16; ASTM: West Conshohocken, PA, USA, 1992. [Google Scholar]
- Sing, K.S.W.; Everett, D.H.; Haul, R.A.W.; Moscou, L.; Pierotti, R.A.; Rouquerol, J.; Siemieniewska, T. Reporting physisorption data for gas/solid systems with special reference to the determination of surface area and porosity. Pure Appl. Chem. 1985, 57, 603–619. [Google Scholar] [CrossRef]


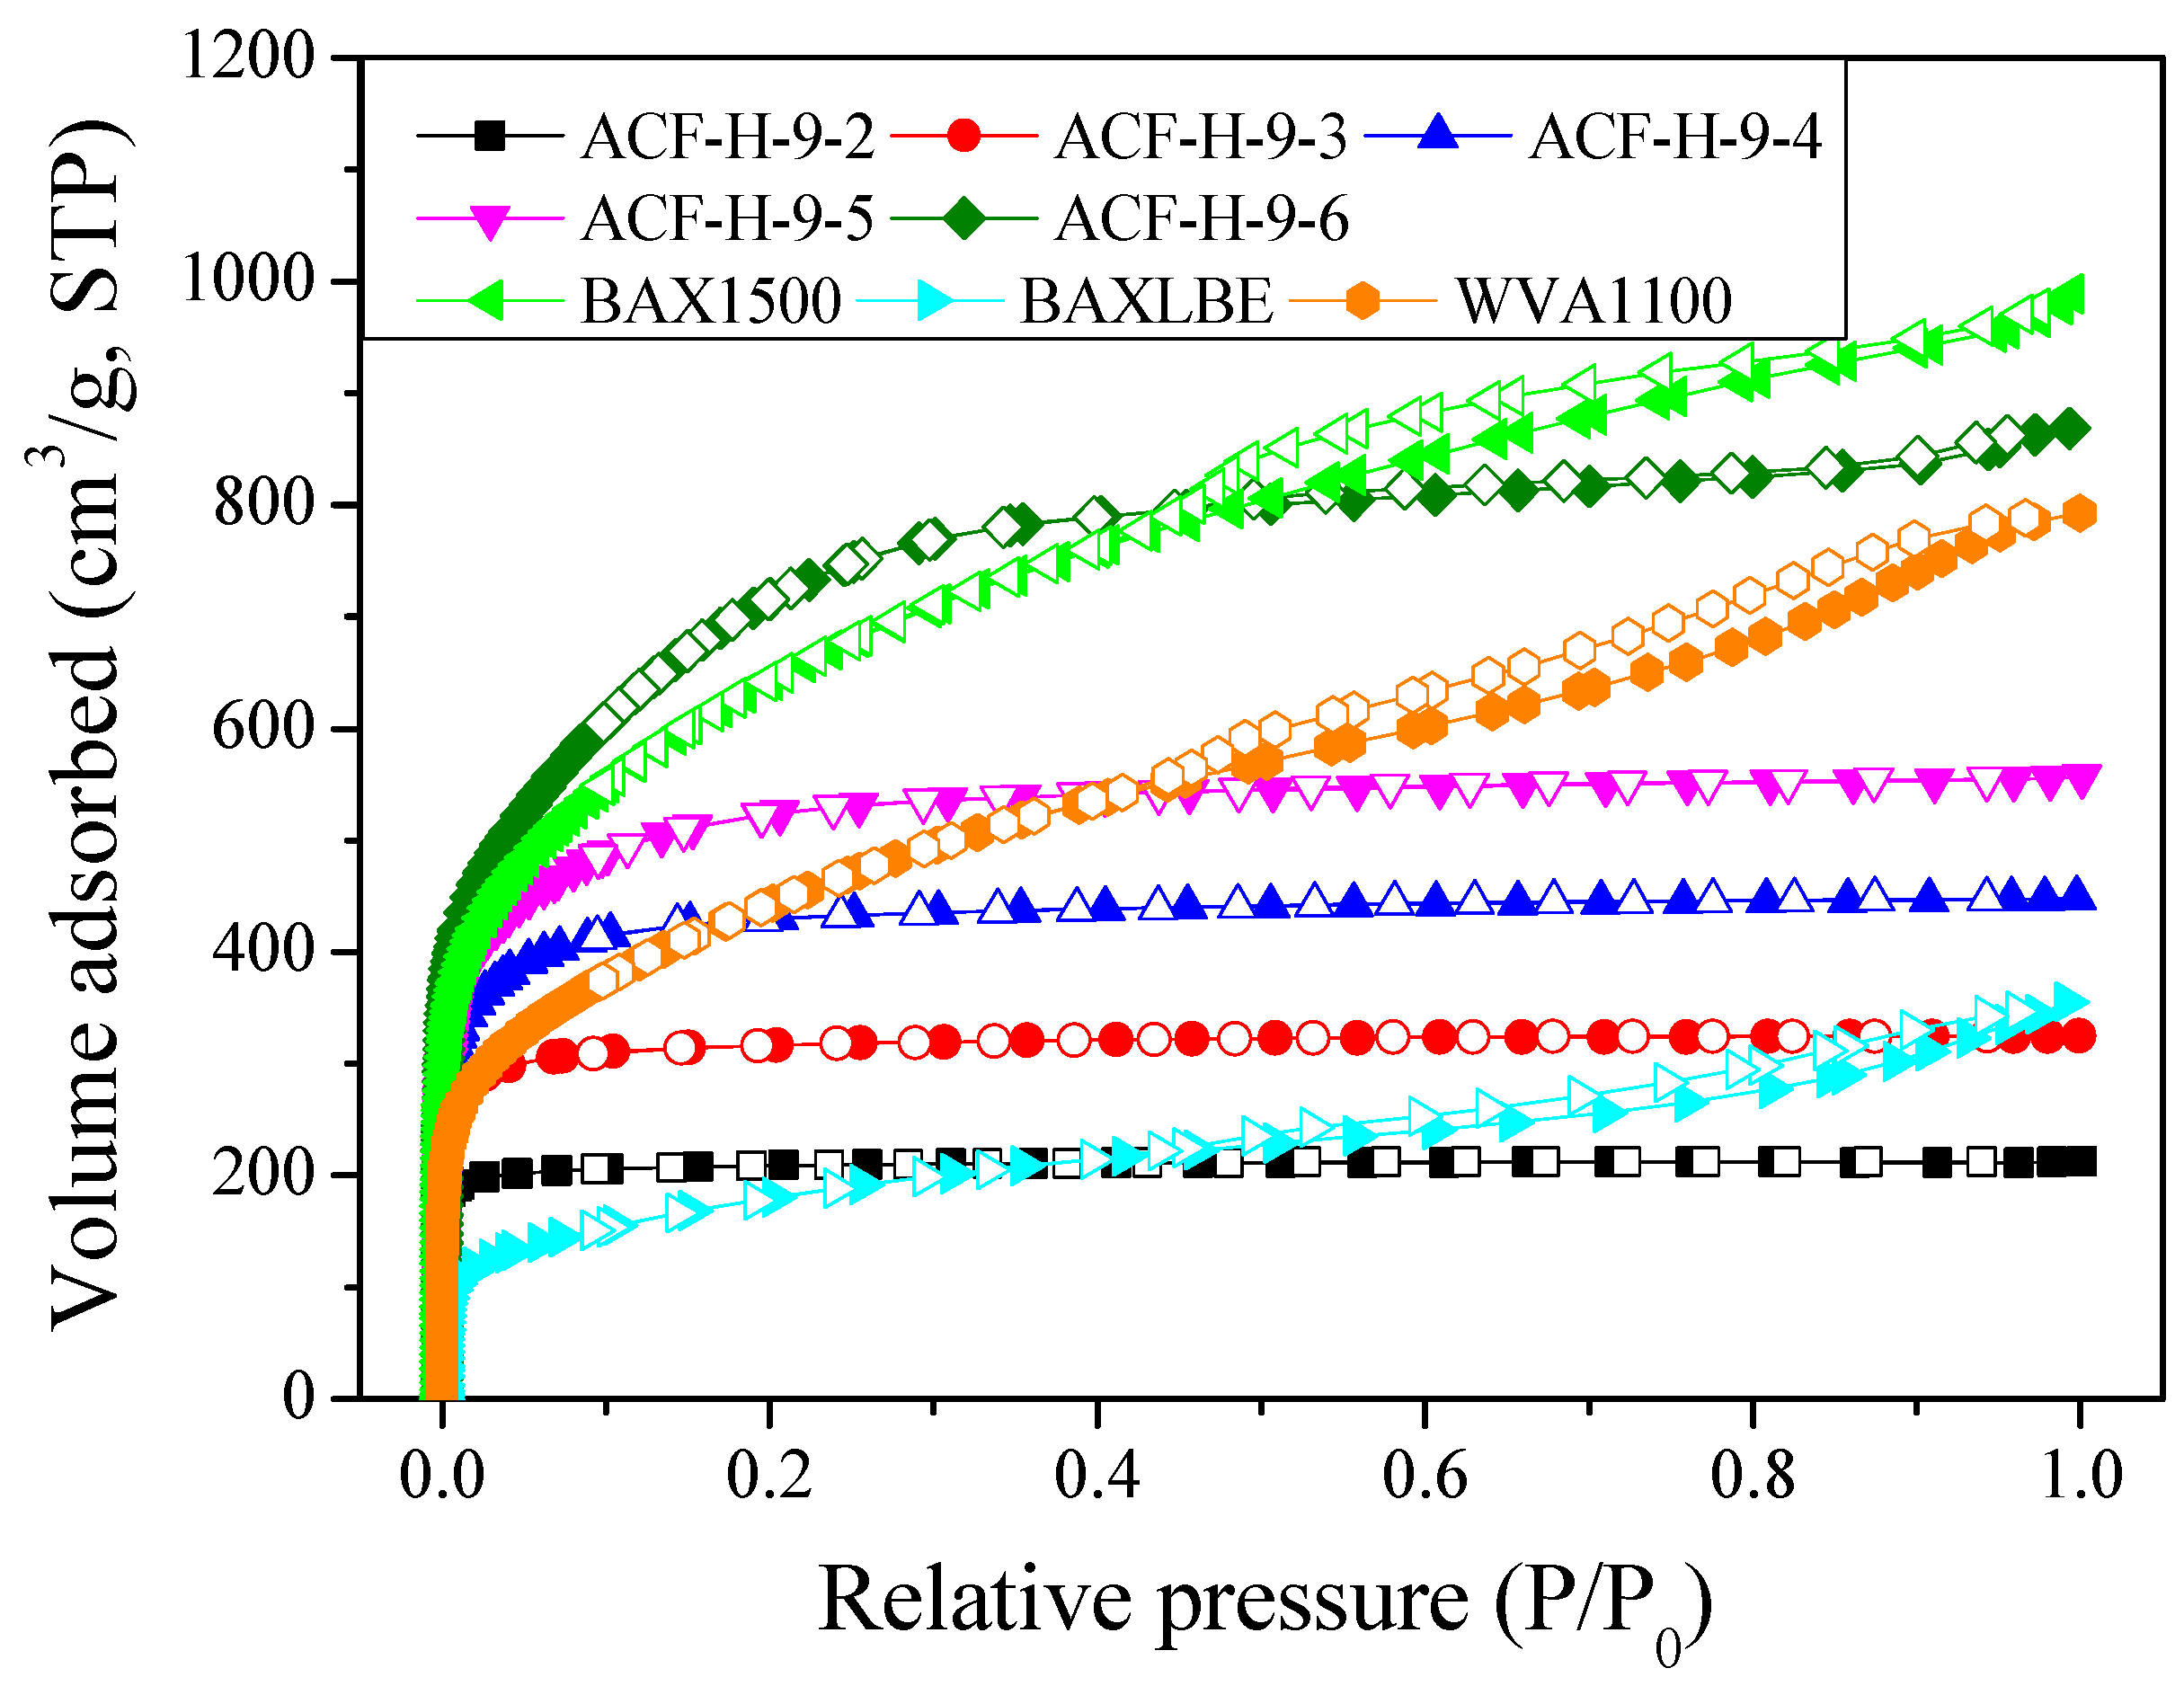
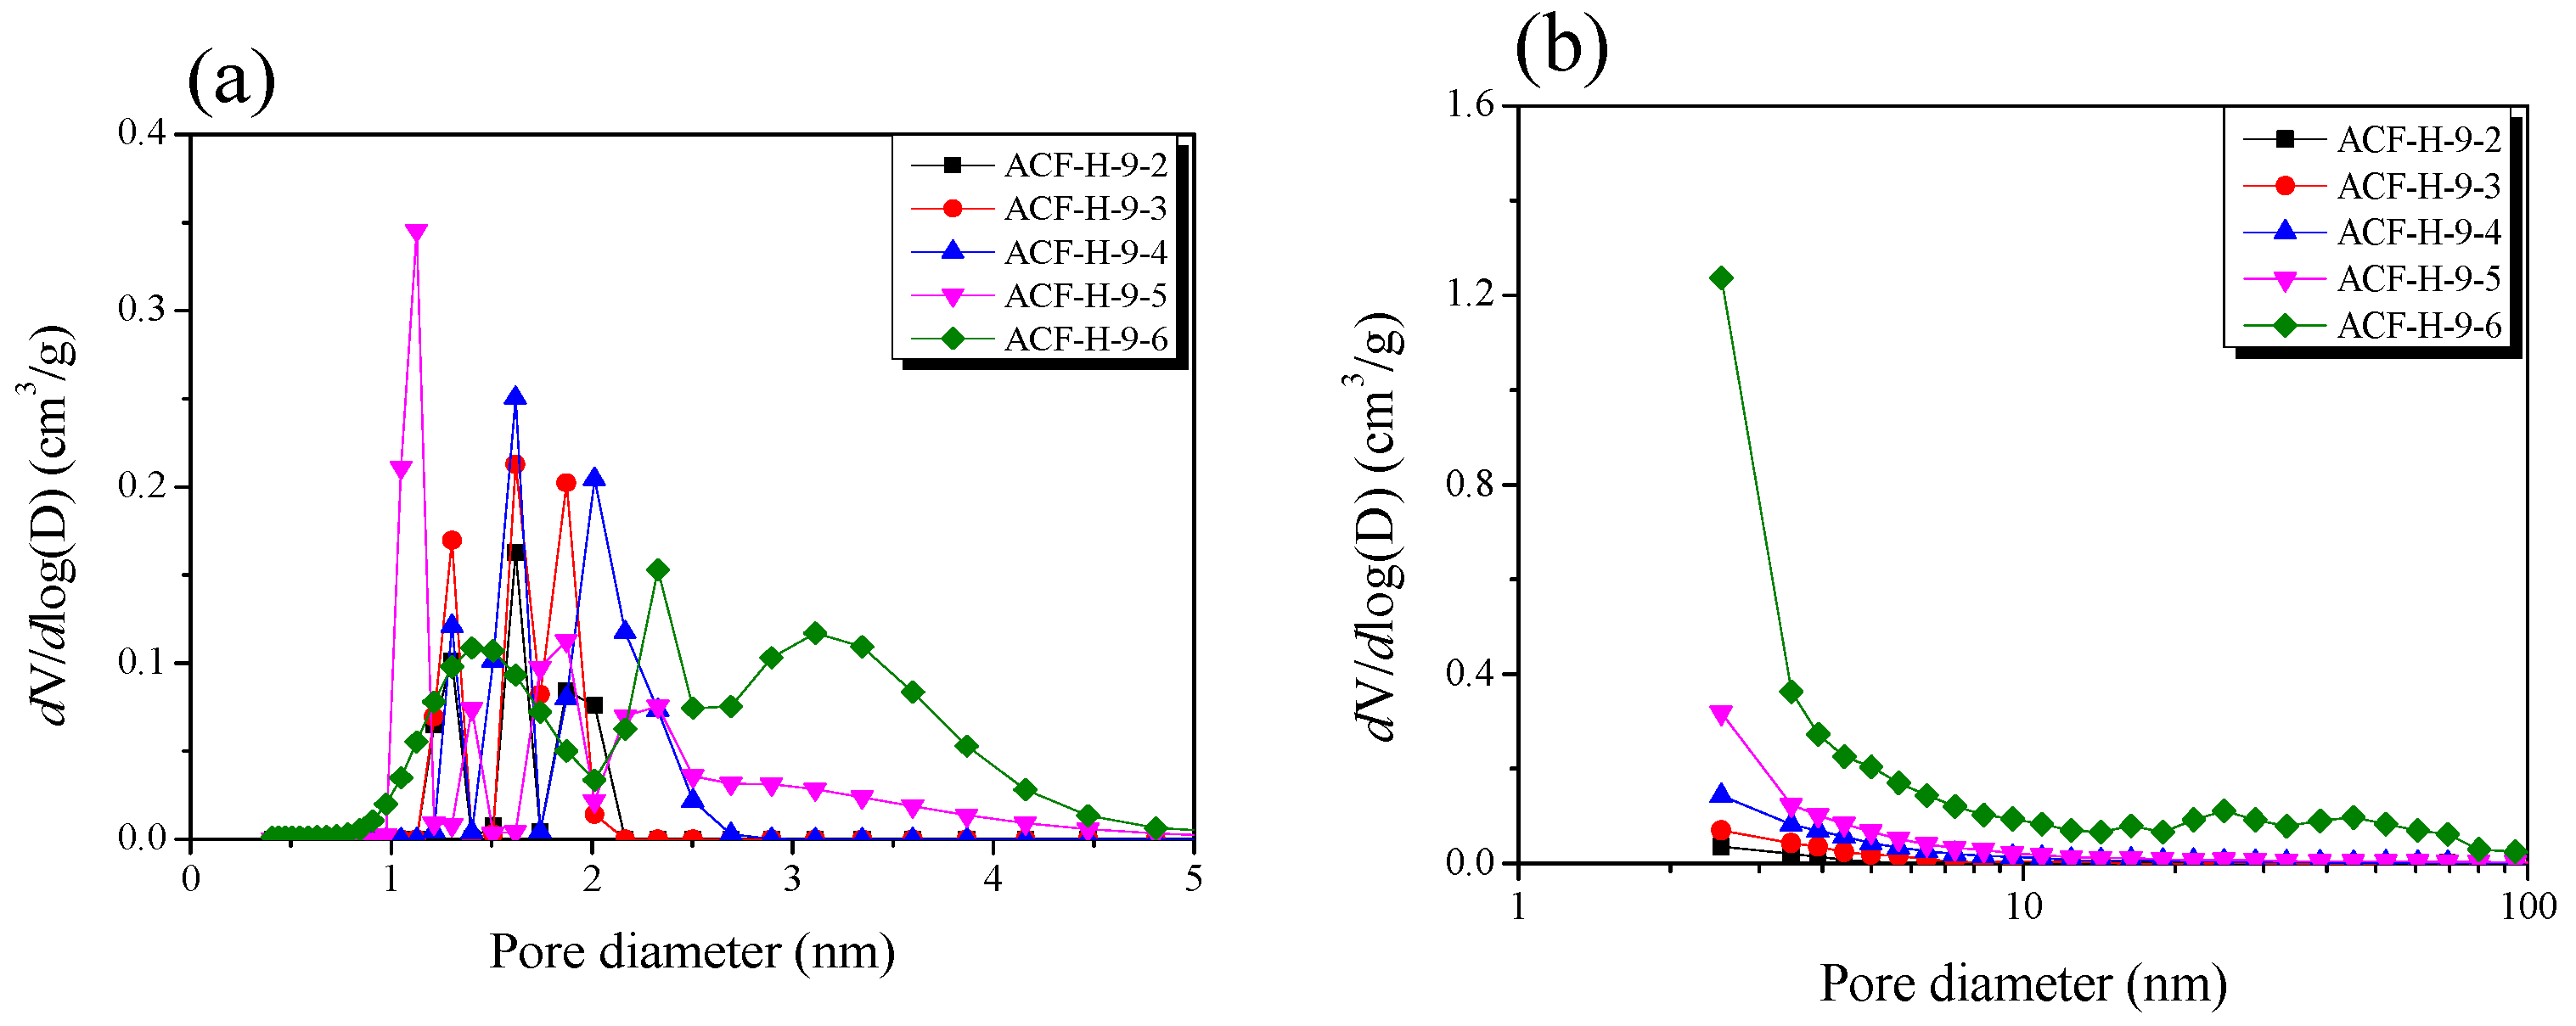
| Sample | SBET 1 (m2/g) | VTotal 2 (cm3/g) | VMicro 3 (cm3/g) | VMeso 4 (cm3/g) | Mesopore 5 Ratio (%) | Yield 6 (%) |
|---|---|---|---|---|---|---|
| ACF-H-9-2 | 840 | 0.33 | 0.32 | 0.01 | 3.0 | 55 |
| ACF-H-9-3 | 1250 | 0.50 | 0.47 | 0.03 | 6.0 | 45 |
| ACF-H-9-4 | 1670 | 0.69 | 0.63 | 0.06 | 8.7 | 38 |
| ACF-H-9-5 | 1980 | 0.86 | 0.74 | 0.12 | 14.0 | 26 |
| ACF-H-9-6 | 2630 | 1.34 | 0.85 | 0.49 | 36.6 | 15 |
| BAX1500 | 2350 | 1.52 | 0.64 | 0.88 | 57.9 | - |
| BAXLBE | 650 | 0.55 | 0.17 | 0.38 | 69.1 | - |
| WVA1100 | 1610 | 1.22 | 0.40 | 0.82 | 67.2 | - |
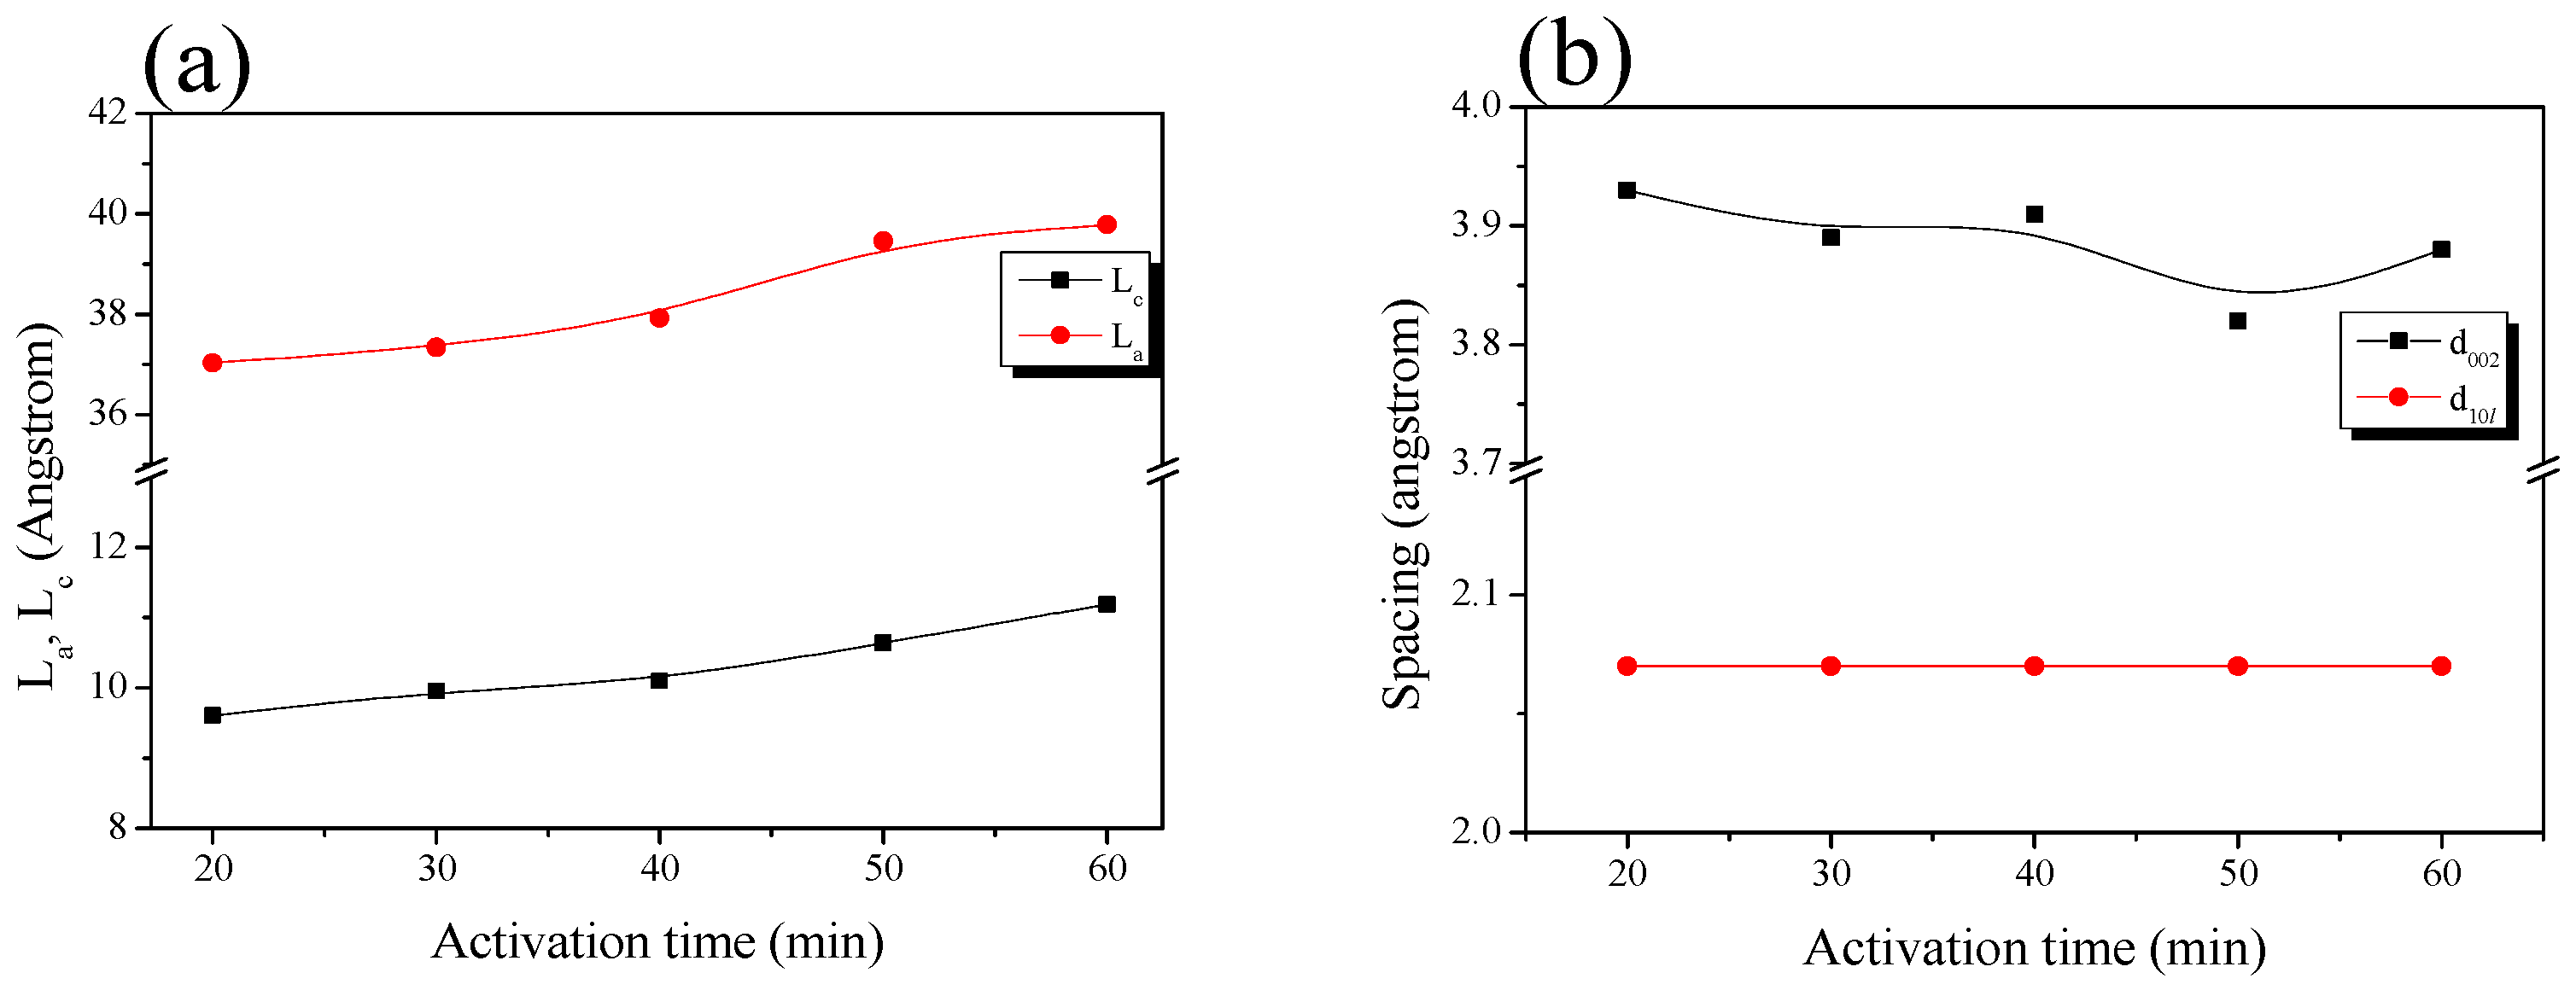
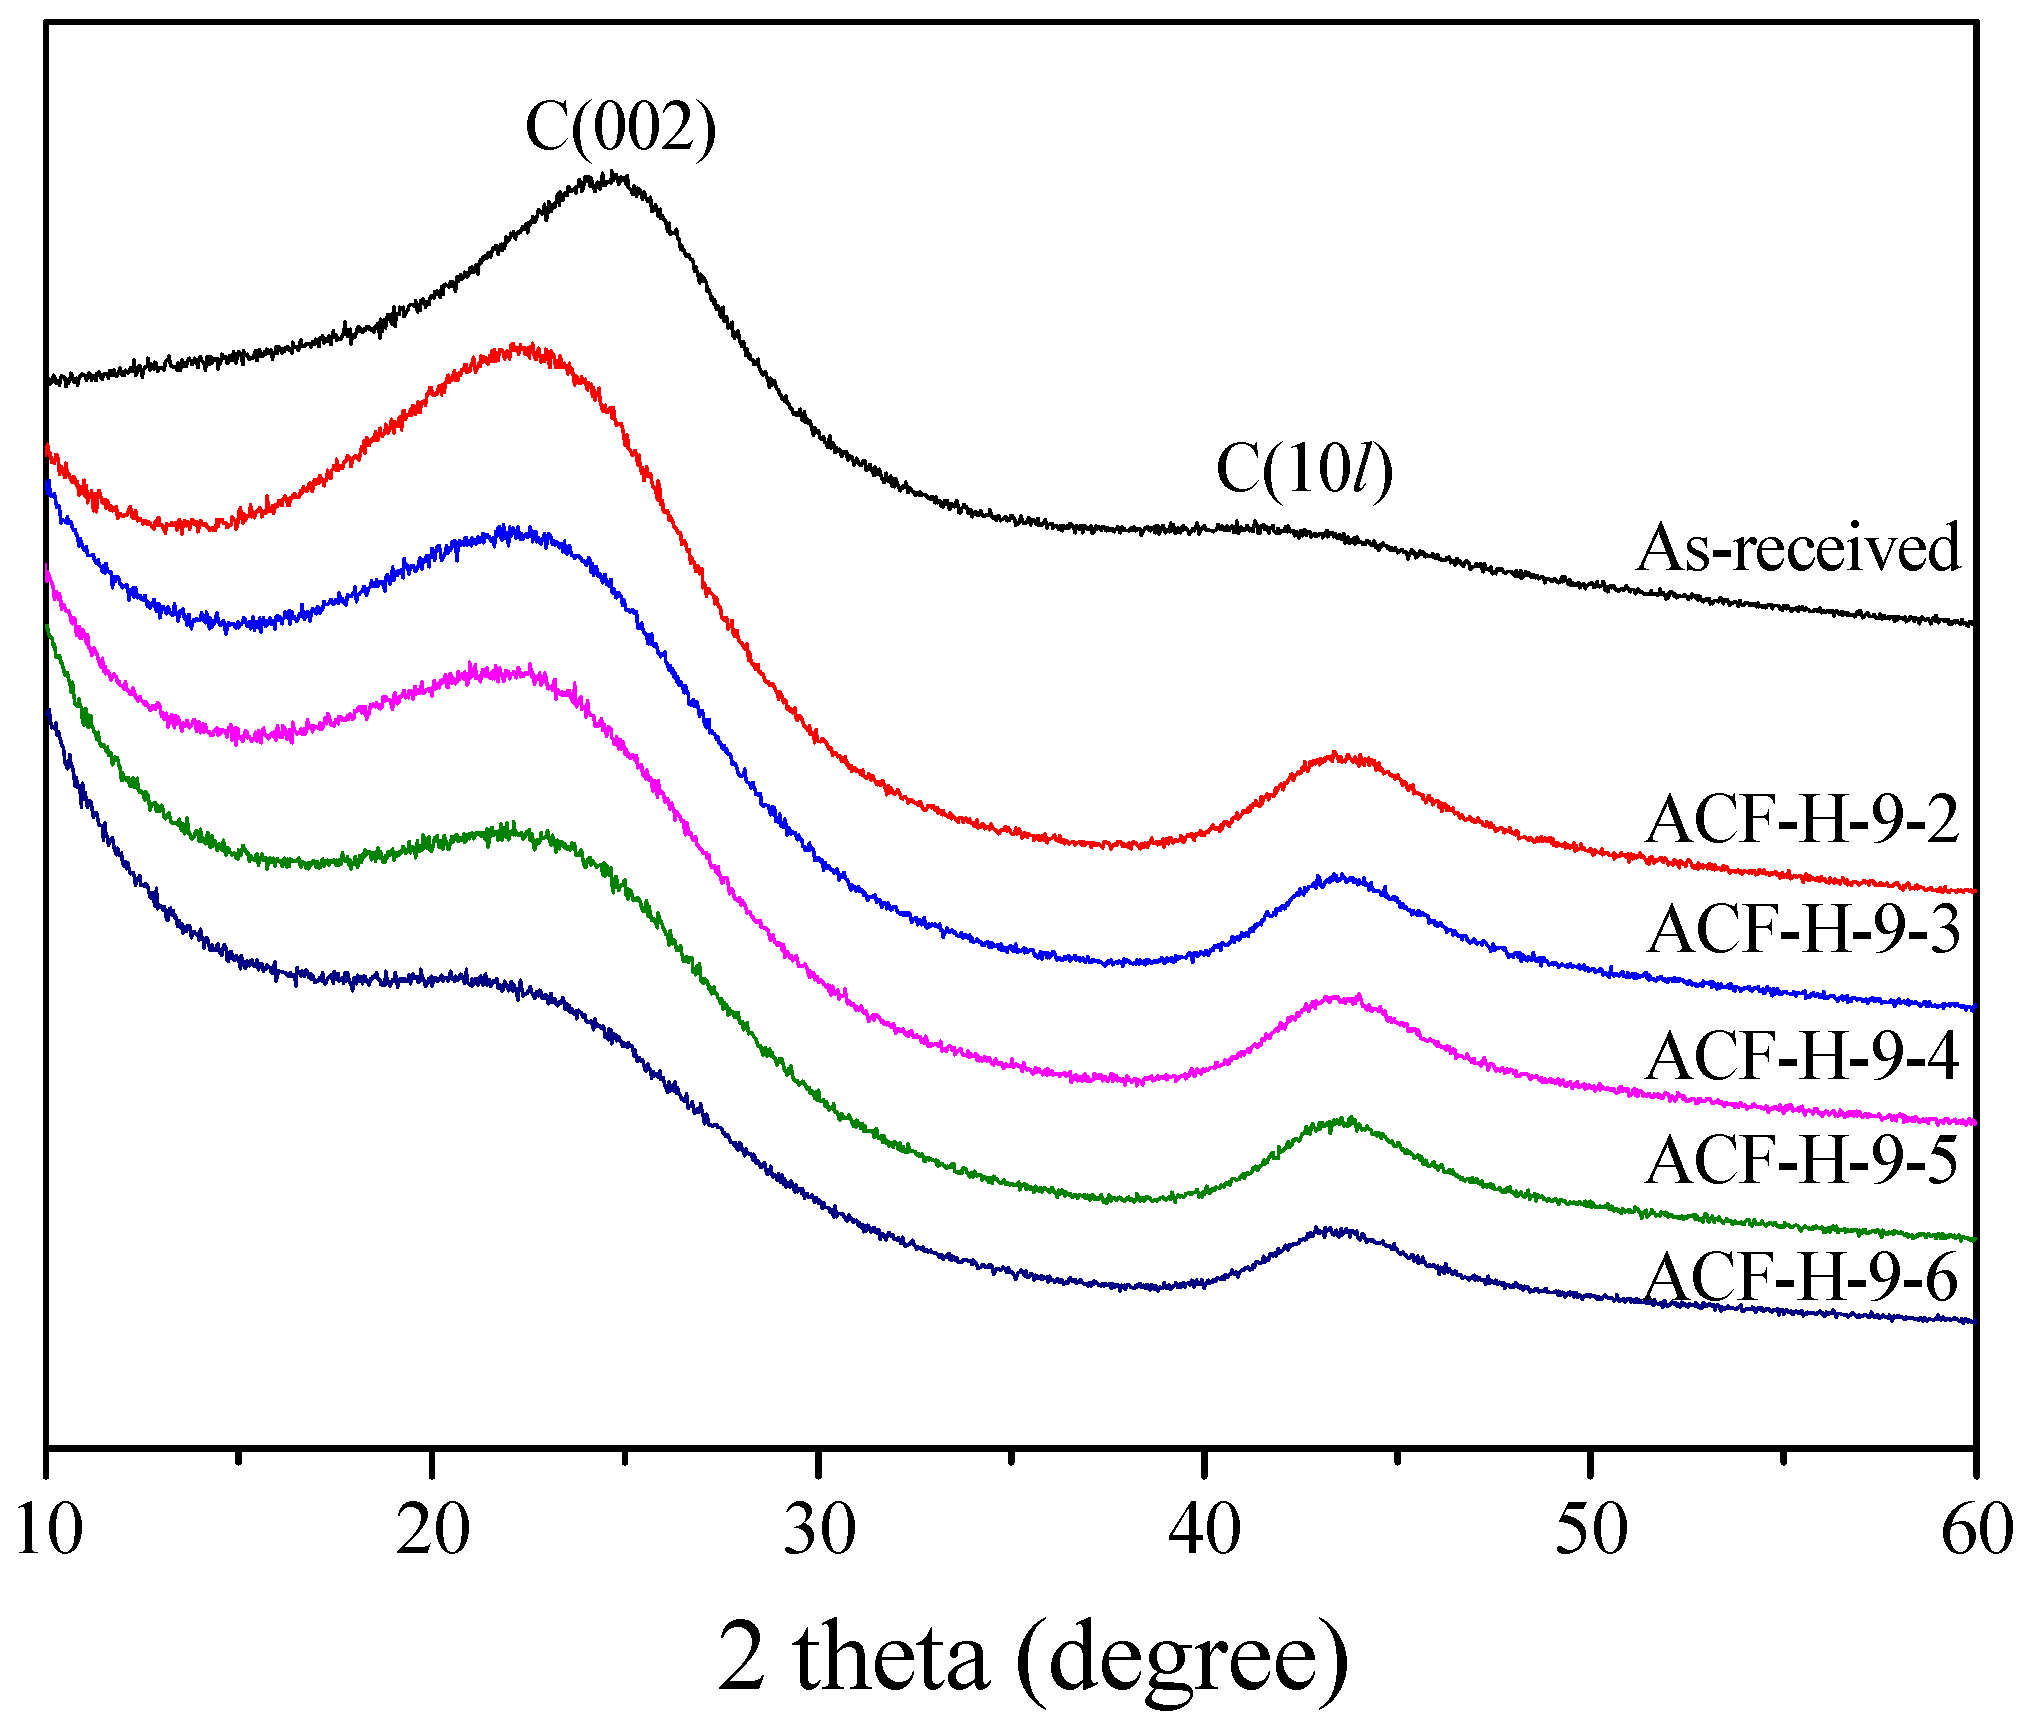
| Sample | 002 Peak | 10l Peak | ||||||
|---|---|---|---|---|---|---|---|---|
| 2θ (°) | d002 (Å) | FWHM (2θ) | Lc (Å) | 2θ (°) | d10l (Å) | FWHM (2θ) | La (Å) | |
| ACF-H-9-2 | 22.62 | 3.93 | 8.44 | 9.61 | 43.78 | 2.07 | 4.73 | 37.03 |
| ACF-H-9-3 | 22.83 | 3.89 | 8.16 | 9.95 | 43.79 | 2.07 | 4.69 | 37.34 |
| ACF-H-9-4 | 22.73 | 3.91 | 8.03 | 10.10 | 43.75 | 2.07 | 4.62 | 37.92 |
| ACF-H-9-5 | 23.25 | 3.82 | 7.63 | 10.64 | 43.76 | 2.07 | 4.44 | 39.46 |
| ACF-H-9-6 | 22.92 | 3.88 | 7.25 | 11.19 | 43.69 | 2.07 | 4.40 | 39.78 |
| Sample | Density (g/mL) | BWC 1 (g/100 mL) | BWC (%) | BA 2 (%) | BR 3 (%) |
|---|---|---|---|---|---|
| ACF-H-9-2 | 0.15 | 1.59 | 10.63 | 20.03 | 5.41 |
| ACF-H-9-3 | 0.14 | 2.18 | 15.56 | 18.83 | 3.27 |
| ACF-H-9-4 | 0.14 | 3.60 | 25.69 | 39.97 | 9.19 |
| ACF-H-9-5 | 0.13 | 4.01 | 30.83 | 40.01 | 9.18 |
| ACF-H-9-6 | 0.13 | 6.00 | 46.13 | 57.33 | 11.47 |
| BAX 1500 | 0.31 | 15.03 | 50.11 | 50.11 | 7.43 |
| BAX LBE | 0.39 | 5.03 | 12.91 | 12.91 | 2.41 |
| WVA 1100 | 0.28 | 8.73 | 31.17 | 31.17 | 5.87 |
© 2019 by the authors. Licensee MDPI, Basel, Switzerland. This article is an open access article distributed under the terms and conditions of the Creative Commons Attribution (CC BY) license (http://creativecommons.org/licenses/by/4.0/).
Share and Cite
Lee, H.-M.; Lee, B.-H.; Park, S.-J.; An, K.-H.; Kim, B.-J. Pitch-Derived Activated Carbon Fibers for Emission Control of Low-Concentration Hydrocarbon. Nanomaterials 2019, 9, 1313. https://doi.org/10.3390/nano9091313
Lee H-M, Lee B-H, Park S-J, An K-H, Kim B-J. Pitch-Derived Activated Carbon Fibers for Emission Control of Low-Concentration Hydrocarbon. Nanomaterials. 2019; 9(9):1313. https://doi.org/10.3390/nano9091313
Chicago/Turabian StyleLee, Hye-Min, Byeong-Hoon Lee, Soo-Jin Park, Kay-Hyeok An, and Byung-Joo Kim. 2019. "Pitch-Derived Activated Carbon Fibers for Emission Control of Low-Concentration Hydrocarbon" Nanomaterials 9, no. 9: 1313. https://doi.org/10.3390/nano9091313
APA StyleLee, H.-M., Lee, B.-H., Park, S.-J., An, K.-H., & Kim, B.-J. (2019). Pitch-Derived Activated Carbon Fibers for Emission Control of Low-Concentration Hydrocarbon. Nanomaterials, 9(9), 1313. https://doi.org/10.3390/nano9091313