Article

Preparation of TiO2 and Fe-TiO2 with an Impinging Stream-Rotating Packed Bed by the Precipitation Method for the Photodegradation of Gaseous Toluene

Shanxi Province Key Laboratory of Higee-Oriented Chemical Engineering, North University of China, Taiyuan 030051, China
*
Author to whom correspondence should be addressed.
Nanomaterials 2019, 9(8), 1173; https://doi.org/10.3390/nano9081173
Submission received: 21 July 2019 / Revised: 13 August 2019 / Accepted: 14 August 2019 / Published: 16 August 2019
(This article belongs to the Special Issue Photocatalytic Nanomaterials)

Abstract

:
Nano-TiO2 has always been one of the most important topics in the research of photocatalysts due to its special activity and stability. However, it has always been difficult to obtain nano-TiO2 with high dispersion, a small particle size and high photocatalytic activity. In this paper, nano-TiO2 powder was prepared by combining the high-gravity technique and direct precipitation method in an impinging stream-rotating packed bed (IS-RPB) reactor followed by Fe3+ in-situ doping. TiOSO4 and NH3·H2O solutions were cut into very small liquid microelements by high-speed rotating packing, and the mass transfer and microscopic mixing of the nucleation and growth processes of nano-TiO2 were strengthened in IS-RPB, which was beneficial to the continuous production of high quality nano-TiO2. Pure TiO2 and iron-doped nano-TiO2 (Fe-TiO2) were obtained in IS-RPB and were investigated by means of X-ray diffraction (XRD), Raman, scanning electron microscopy (SEM), transmission electron microscopy (TEM), X-ray photoelectron spectroscopy (XPS), ultraviolet-visible diffuse reflectance spectroscopy (UV-vis DRS) and Brunauer–Emmett–Teller (BET) analysis, which found that pure TiO2 had a particle size of about 12.5 nm, good dispersibility and a complete anatase crystal at the rotating speed of packing of 800 rpm and calcination temperature of 500 °C. The addition of Fe3+ did not change the crystalline structure of TiO2. Iron was highly dispersed in TiO2 without the detection of aggregates and was found to exist in a positive trivalent form by XPS. With the increase of iron doping, the photoresponse range of TiO2 to visible light was broadened from 3.06 eV to 2.26 eV. The degradation efficiency of gaseous toluene by Fe-TiO2 under ultraviolet light was higher than that of pure TiO2 and commercial P25 due to Fe3+ effectively suppressing the recombination of TiO2 electrons and holes; the highest efficiency produced by 1.0% Fe-TiO2 was 95.7%.

1. Introduction

Because of its high chemical stability and high photocatalytic activity, nano-TiO2 has great development prospects in the fields of environmental protection [1], such as in photocatalytic disinfection, antibacterial use [2,3], wastewater treatment [4], air purification [5], and so on. Especially in the face of the current difficulty of eliminating volatile organic compound (VOC) pollution in the air, TiO2 photocatalysis technology has shown unique advantages [6,7]. However, the preparation cost of nano-TiO2 is high, and the process is difficult to control, meaning that nano-TiO2 has poor dispersion and a wide particle-size distribution. Moreover, the photocatalytic performance restricts its development and application: firstly, the band gap of 3.2 eV limits it to using only ultraviolet light below 387.5 nm in wavelength [8]. Secondly, the electron and hole produced by the light excitation of TiO2 recombine very easily [9,10]. Therefore, developing preparation technology of TiO2 with good dispersion and a uniform particle size and exploring a way to broaden the light response range and inhibit the electron and hole recombination of TiO2 are the key problems which need to be solved urgently in order to develop the commercialization and advanced application of nano-TiO2.
The most common synthesis method of nano-TiO2 is the sol-gel method [11,12]. However, the raw material titanium alkoxide is relatively expensive, and the whole process not only produces a large number of organic compounds but also needs to use a large number of organic solvents, resulting in organic waste pollution, causing problems for the mass production of nano-TiO2. The preparation of nano-TiO2 by the precipitation method has the advantages of a cheap raw material, a simple process and a non-toxic organic solvent, which is convenient for industrial production. However, the traditional precipitation method generally uses an intermittent stirred tank with low mass transfer and microscopic mixing performance as the reactor. The nucleation and growth process occur before the homogeneous mixing of the titanium precursor and precipitant in the intermittent stirred tank, and there is a high level of non-uniformity in this process. It is difficult to move the completely grown particles from the intermittent stirred tank in time, resulting in those particles possibly being used as a crystal nucleus to grow further. As a result, the particle sizes are uneven and seriously agglomerate. High-gravity technology has been proven to be an excellent technology for the preparation of high-quality nanometer powder. The rotating packed bed (RPB) [13] is the typical reactor of high-gravity technology, which uses a motor to drive the packing to rotate at a high speed, resulting in a huge centrifugal force field. In the RPB, the raw material liquid is immediately cut and dispersed by the packing to form a very small liquid microelement, and a uniform microscopic mixing effect is obtained [14]. The nucleation and growth of the particles occur in a uniform supersaturation environment, and so the particles sizes are similar. The particles in a strong centrifugal force field will be immediately thrown out of the packing and separated from the raw materials and will not grow further, meaning that the particles are able to maintain good dispersion. A large number of studies have confirmed that RPB is an excellent reactor for the preparation of nanoparticles by the precipitation method, such as ZrO2 [15], Fe3O4 [16,17], Mg(OH)2 [18], and some composite materials [19,20], etc. However, there are few reports into the preparation of nano-TiO2 by RPB.
In order to improve the photocatalytic performance of TiO2, metal doping has always been favored by the research community [21,22]. Previous studies have shown that doping Mn, Fe, Cu, Co, Ag, Ce and other metal ions can accelerate the migration rate of photogenerated electrons and inhibit the recombination of electrons and holes to a certain extent [23]. In addition, it has been reported that metal ion doping contributes to the expansion of the optical absorption range of TiO2 [24]. U Khalid et al. [25] reported that the band gap of TiO2 decreased to 2.67 eV after doping Mn2+.
In this paper, TiO2 and Fe3+ ions with in-situ doped TiO2 (Fe-TiO2) nanoparticles were prepared by the direct precipitation method with an impinging stream-rotating packed bed (IS-RPB) [20,26,27] as a reactor and used for the photodegradation of gaseous toluene as a typical pollutant in air. The main purpose of this work is to make use of the efficient mass transfer capacity and strong microscopic mixing characteristics of IS-RPB to obtain nano-TiO2 with high dispersion and small particle size and to prepare Fe-TiO2 by uniformly doping Fe3+ in TiO2. The doping of Fe3+ shows the ability to enhance the response of TiO2 to visible light and reduce the rebinding of electrons and holes, which is beneficial to improving the photocatalytic performance. The morphology, structure and optical response of TiO2 and Fe-TiO2 were analyzed by various characterization methods. The photocatalytic activity of the photocatalyst was studied by the degradation of gaseous toluene as the typical VOC. Toluene was taken as the target VOC mainly because it is one of the most common pollutants both indoors or outdoors [28,29]. Furthermore, there have been many studies on the photocatalytic degradation of toluene, and thus there is a sufficient theoretical basis and practical feasibility [30,31,32].

2. Materials and Method

2.1. Materials

Titanyl sulfate (TiOSO4, 93%) was purchased from Shanghai Macklin Biochemical Co., Ltd. (Shanghai, China). Ammonium hydroxide solution (NH3·H2O, 25%–28%), ethanol anhydrous (99.5%), ferric chloride hexahydrate (FeCl3·6H2O, 99.0%) and other chemicals were obtained from Tianjin Guangfu Fine Chemical Research Institute (Tianjin, China). All reagents were used without any additional purification, and all stock and working solutions were prepared in deionized water.

2.2. Synthesis of Nano-TiO2

In order to prepare nano-TiO2, an IS-RPB reactor was used for the immediate precipitation process with NH3·H2O as a precipitant, as in the studies of Fan et al. [16] and Jiao et al. [33]. The details of the reactor are as follows: the packing was made by stainless steel wire meshes with a 2.5 mm diameter—the inter diameter, outer diameter and axial height of which, respectively, were 60 mm, 160 mm and 60 mm—and was connected to the motor by shaft. Two jet nozzles with a 1.5 mm diameter were employed in the opposite direction to cause solutions to be ejected to form an impinging stream. Others elements included the liquid inlet/outlet, a shell with a 200 mm diameter, et al.
The complete process was as follows: TiOSO4 at 0.2 mol/L and pH = 1 was prepared as solution A. NH3·H2O of 1.0 mol/L was prepared as solution B. Then, solution A and B separately were added to liquid storage tanks 1 and 2, and the solution entered the liquid distributor through the action of the pump; the flow rates were adjusted to be the same by a liquid flowmeter. After that, two stream flows were ejected at high speed from a jet nozzle in the opposite direction, producing an extended radial impinging spray surface, completing the first micromixing. Then, the impinging spray surface entered from the inner surface of the packing; under the action of centrifugal force, the liquid passed through the packing and was cut and dispersed by the high-speed rotating packing many times simultaneously to complete the second micromixing and precipitation reaction. Finally, the precipitates were collected and then separated using a high-speed centrifuge and were washed with deionized water and ethanol anhydrous to neutral pH, and no sulfate ion was detected by Ba2+. The precipitates were dried to obtain amorphous nano-TiO2. Then, nano-TiO2 was calcined at 400 °C to 800 °C to obtain a crystalline structure. The experimental setup is shown in Figure 1.
Previous studies [15,16] have shown that the rotating speed of packing has a great influence on the synthesis of nanomaterials by RPB or IS-RPB. Rotating packing is not only the source of a high-gravity field but also the most important and basic technical support of high-gravity technology. In this experiment, by changing the rotating speed of the packing to 400, 800 and 1200 rpm (according to the calculation formula of Fan et al. [16] and Jiao et al. [33], the corresponding high-gravity levels are 10.44, 41.78, 94.01), we investigated the effect of the rotating speed of packing in IS-RPB on the synthesis of nano-TiO2.

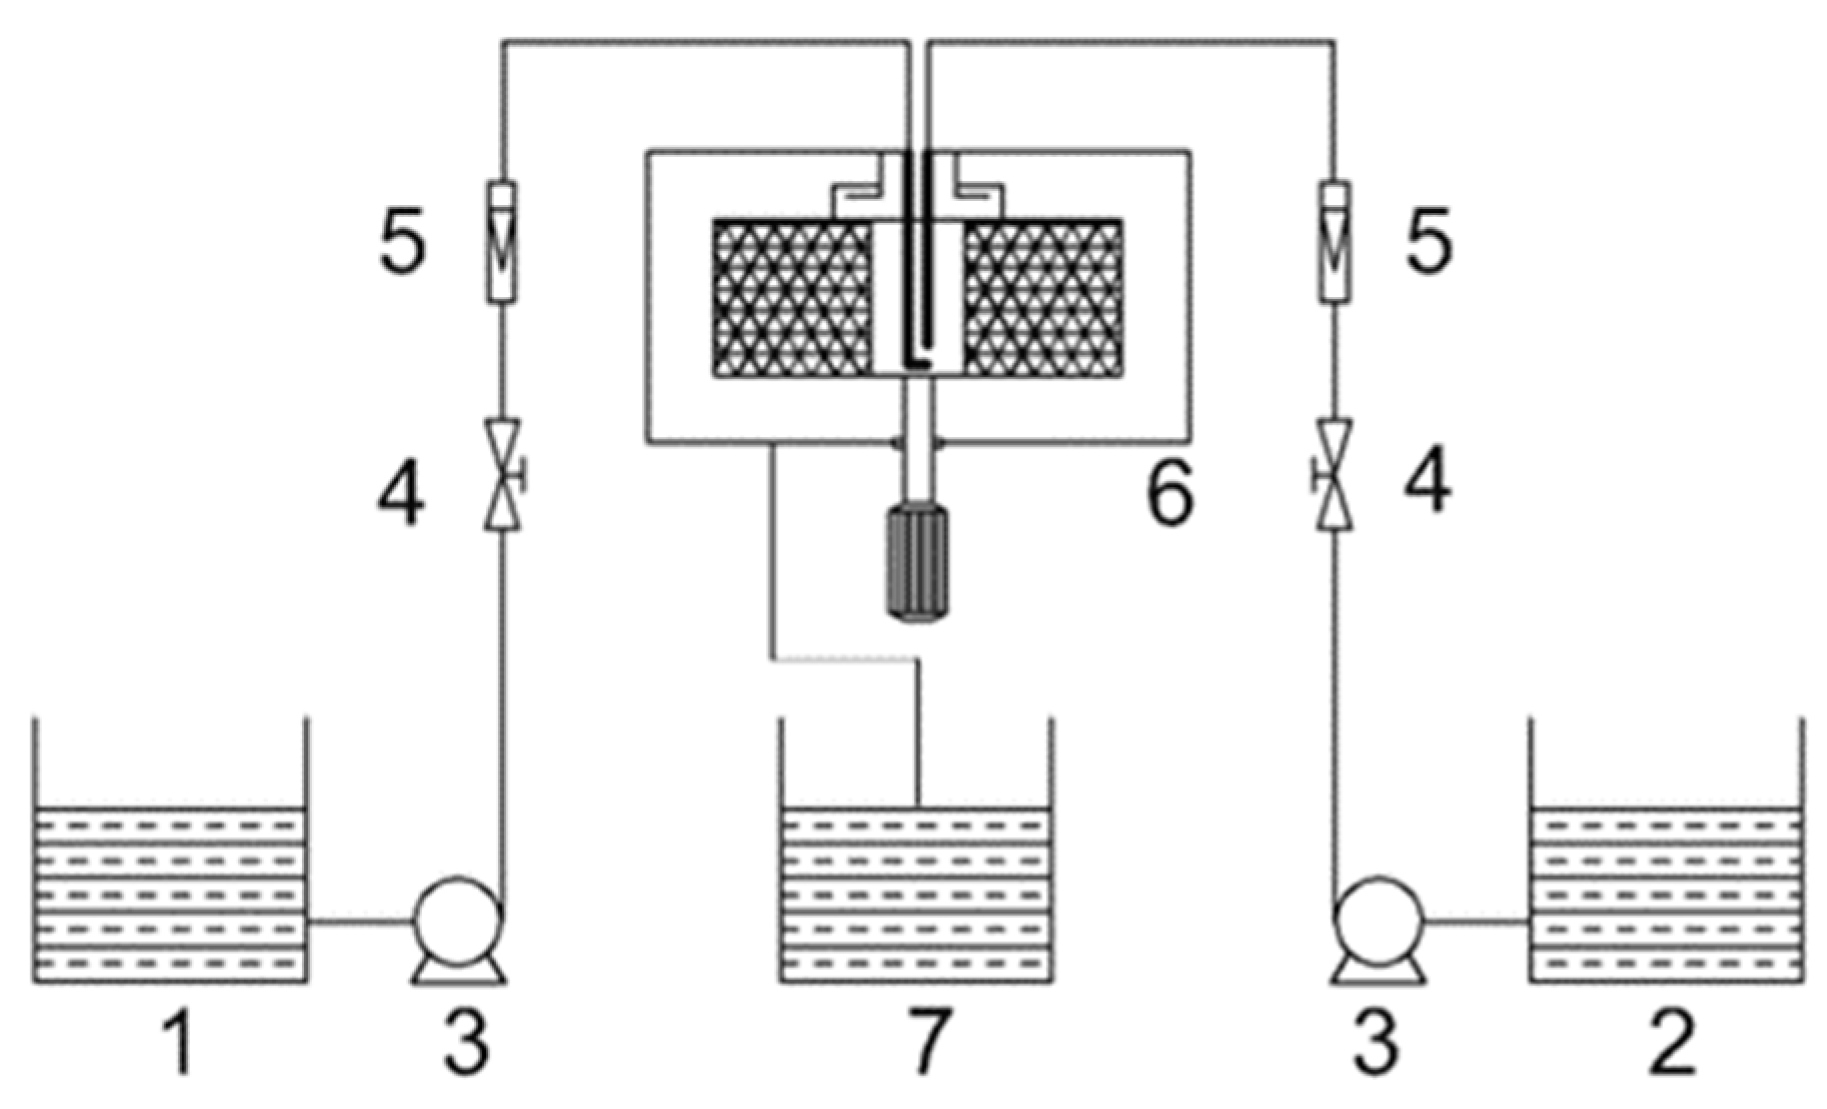
2.3. Synthesis of Fe-TiO2 Nanoparticles

Fe-TiO2 were prepared by adding a varying amount of FeCl3·6H2O into solution A, as described in Section 2.2, and other steps were repeated as per Section 2.2. In this experimental, 0.1351 g to 1.3510 g of FeCl3·6H2O were added to solution A; the molar ratios of Fe3+ to Ti4+ were 0.5%, 1.0%, 3%, 5%. The resulting Fe-TiO2 nanoparticles were called 0.5%Fe-TiO2, 1.0%Fe-TiO2 et al.

2.4. Characterization

The crystalline structures of the synthesized nanoparticles were detected using an X-ray diffractometer (XRD, DX-2700, China). The Raman spectra were determined using MultiRAM Raman spectroscopy (Bruker Corporation, Raman, Italy). The chemical states of the samples were determined using X-ray photoelectron spectroscopy (XPS, Escalab 250Xi, USA). The morphology, microstructure and particle size of the synthesized nanoparticles were measured using an SEM (HITACHI S4800, Tokyo, Japan) and a transmission electron microscope and high-resolution transmission electron microscopy (TEM and HRTEM, FEI Titan G2 60-300, USA) equipped with energy dispersive X-ray (EDX) spectroscopy. The optical absorption ranges of the samples were ascertained using UV-vis diffused reflectance spectroscopy (UV-vis DRS, Agilent cary 5000, USA).

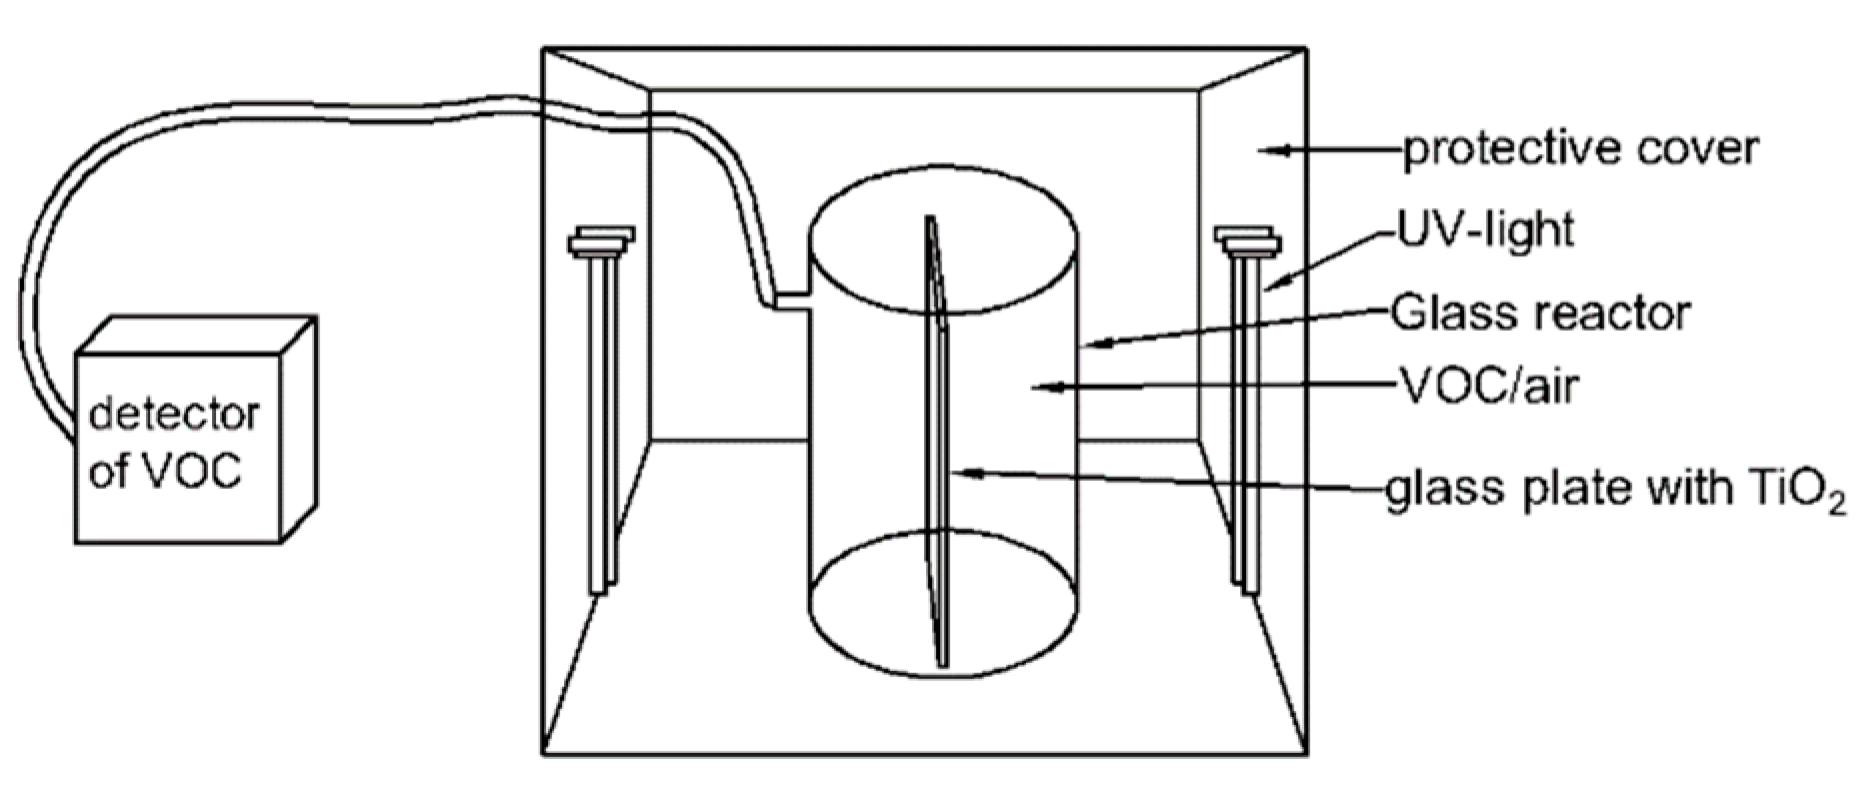
2.5. Photocatalytic Activity

The photocatalytic activity was evaluated in a self-made quartz reactor (Figure 2; the volume is 3.2 L) at normal temperature and pressure. The environment in the reactor was consistent with indoor conditions. In the experiment, the photocatalyst was sprayed onto a glass plate by ethanol suspension, and then the glass plate was put into the quartz reactor. After the quartz reactor was sealed, 1.5 µL of liquid toluene (C7H8, 99%) was injected using a microsyringe (the toluene concentration was 105 ppm). The conversion formula is as follows:
V T = M V m × ( C V × 10 6 ) × V R ρ × 99 %
where VT (µL) is the volume of liquid toluene, M (92.14 g/mol) is the molar mass of toluene, Vm (24.5 L/mol) is the molar volume of gas at normal temperature and pressure, CV (ppm) is the gaseous toluene concentration, VR (3.2 L) is the volume of the self-made quartz reactor, ρ (0.865 g/cm3) is the density of toluene, and 99% is the purity of liquid toluene. We waited for toluene to be mixed evenly, and a UV lamp (18 W, 254 nm) was turned on at the front of the irradiation reactor. The light intensity was 10.96 mW/cm2, measured by a PM120VA spectro-irradiator. The toluene concentration was detected by an online FID detector (SIGNAL GROUP, USA) at an interval of 30 min.

3. Results and Discussion

3.1. The Effect of Different Rotating Speeds of Packing and Calcination Temperature on Nano-TiO2

Nano-TiO2 synthesized at different rotating speeds of packing in IS-RPB and calcined at 500 °C is shown in Figure 3; the nano-TiO2 is spherical and granular. With the increase of the rotating speed of packing, the particle size decreases gradually. This is mainly because, at a higher rotating speed, the liquid microelement cut by the packing is smaller, and the liquid microelement has a faster coagulation and dispersion rate, resulting in a better microscopic mixing effect. The precipitation reaction occurs in a more uniform and higher supersaturation environment. When the rotating speed of packing is 1200 rpm, because the surface energy of small particles is higher, the dispersion and uniformity of particle sizes are obviously worse than TiO2 synthesized at rotating speeds of 400 and 800 rpm. In fact, the particle sizes at 400 rpm and 800 rpm are, respectively, about 25 ± 5 nm and 13 ± 3 nm from the SEM images, and the spherical granular structure is also obvious. However, due to the serious agglomeration phenomenon, there is no obvious spherical granular structure at 1200 rpm from the SEM images, and the particles have a wide particle size distribution. The better dispersion and uniform particle sizes are better for the production and application of nanomaterials, and so the best speed in the experiment is 800 rpm. TEM shows that the particle size of nano-TiO2 obtained under 800 rpm was about 12.5 nm.
The XRD spectra of nano-TiO2 synthesized at different temperatures are shown in Figure 4. In the XRD spectra, the characteristic peak of the anatase phase appears in TiO2 after calcination at 400 °C, but the peak pattern is weak, indicating that the crystal is not complete and only partially transformed into the anatase phase. TiO2 annealed at 500 °C shows a complete anatase diffraction peak, and the main peaks appear at the angles of 2θ at 25.18°, 37.90°, 48.09°, 53.96°, 62.71°, 69.12°, 70.30° and 75.00°, respectively, corresponding to the crystal planes of the anatase phase being (101), (004), (200), (105), (204), (220), (215), respectively. The results show that the amorphous TiO2 is completely transformed from amorphous to anatase (JCPDS No. 021/1272) [34,35]. After being calcinated at 700 °C and 800 °C, the rutile diffraction peak (2θ at 27.34° and other positions) appears. The peak pattern becomes particularly sharp after calcination at 600 °C, 700 °C and 800 °C, reflecting the increase of grain size after calcination at higher temperatures. The grain size is calculated by the Scherrer formula.
D = k λ β cos θ
where D is the grain size, k is the Scherrer constant, λ is the X-ray wavelength (0.15406 nm), β is the full width at half maximum (FWHM), and θ is the Bragg diffraction angle. The grain size of nano-TiO2 was calculated by using the strongest peak (2θ = 25°) [36] with its FWHM in Figure 4. As shown in Table 1, the grain sizes of TiO2 after calcination at 400 °C and 500 °C are 8.4 and 9.6 nm. When the temperature continues to increase, the grain size begins to increase greatly. This phenomenon is consistent with that in the studies of Rajesh et al. [37] and Phoon et al. [38], who reported that the grain size of TiO2 increased with the increase of calcination temperature from 523 K to 1023 K. Generally speaking, anatase TiO2 has good photocatalytic activity, while rutile has higher stability. In this paper, TiO2 calcined at 500 °C has a complete anatase phase and small grain size. Figure 3g shows the TEM image of nano-TiO2 after calcination at 500 °C, and the particle size is about 12.5 nm. Finally, according to the method of Surolia et al. [39], the percentage of the two phases in the nano-TiO2 was determined by the intensity of the peak at 2θ = 25.18° and 27.34°. The proportion of anatase (A (%)) was calculated by Formula (3):
A = 100 1 + 1.265 I R I A
where IA and IR are the intensity of the anatase peak at 2θ = 25.18° and the rutile peak at 2θ = 27.34°. Crystallinity was calculated by measuring the total peak area under four major peaks at 2θ = 25.18°, 37.90°, 48.09°, 53.96° with reference to P25 as 100%. The result is shown in Table 1.

3.2. Characterization of the Pure TiO2 and Fe-TiO2

In order to accelerate the migration rate of electrons in TiO2, inhibit the recombination of the electron and hole, improve the photoresponse range of TiO2 and improve the photocatalytic efficiency of TiO2, TiO2 was modified by the in-situ doping of Fe3+ ions by precipitation at 800 rpm in IS-RPB. The catalyst was characterized after being calcinated at 500 °C.

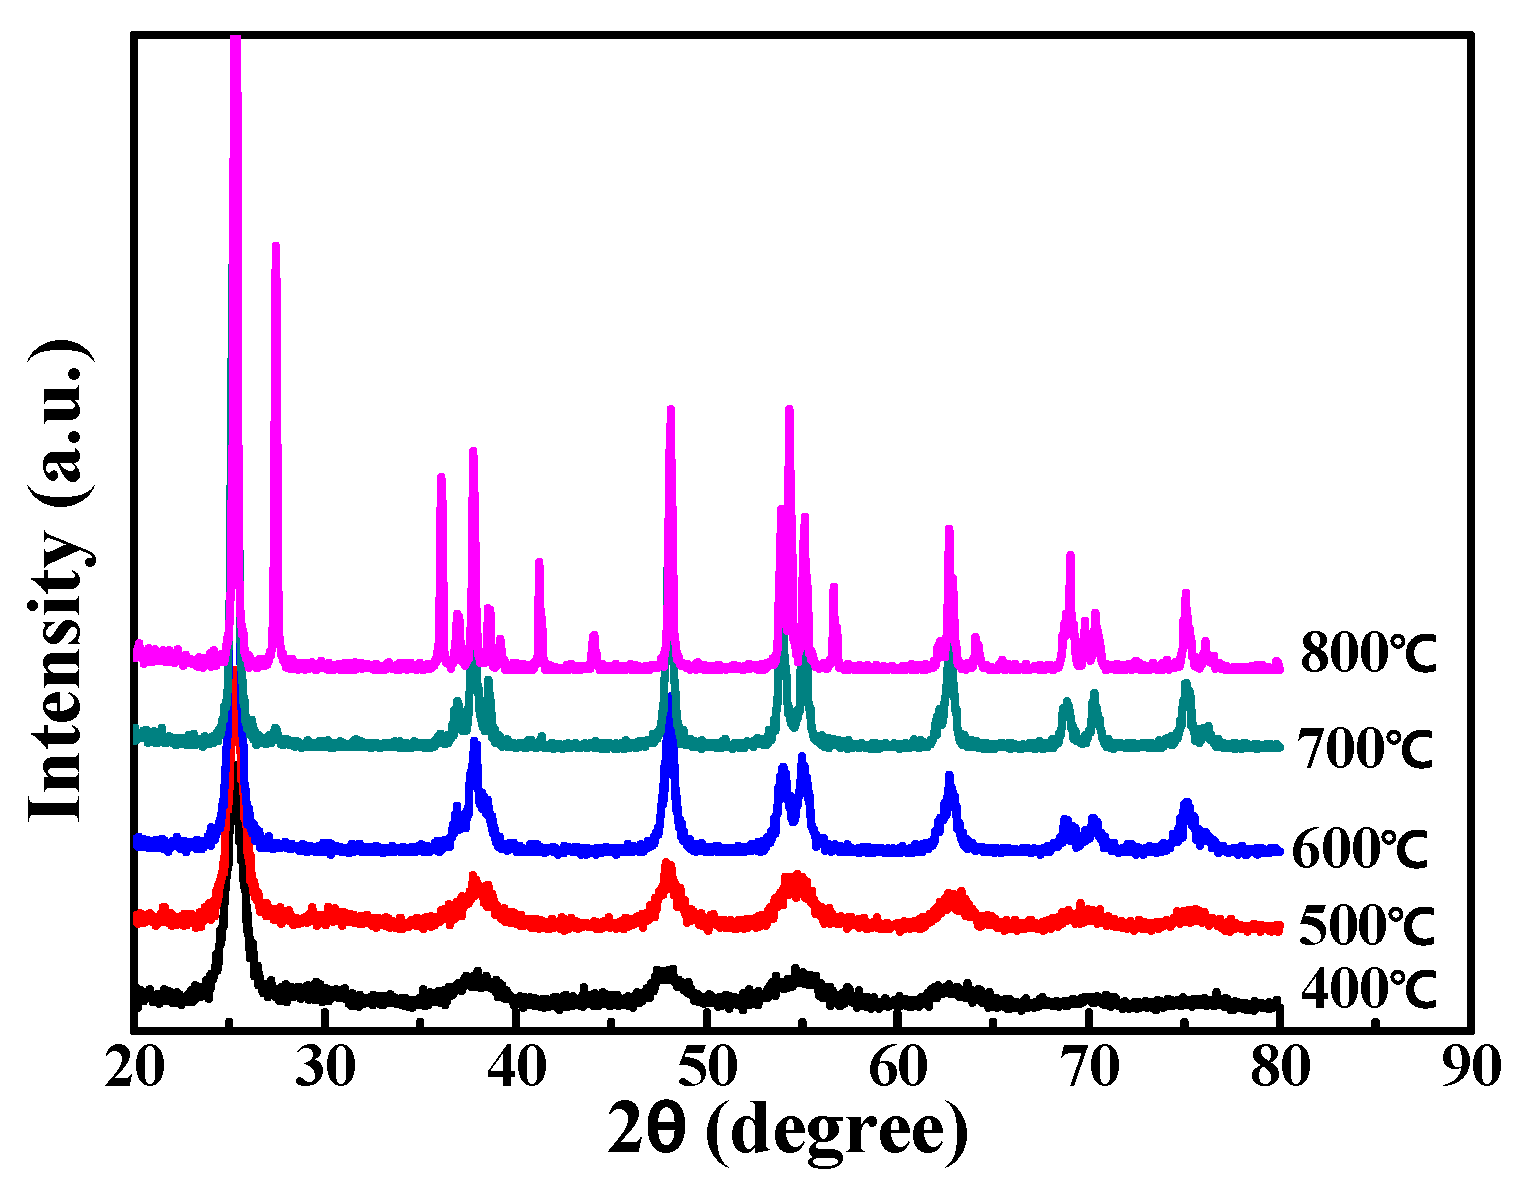
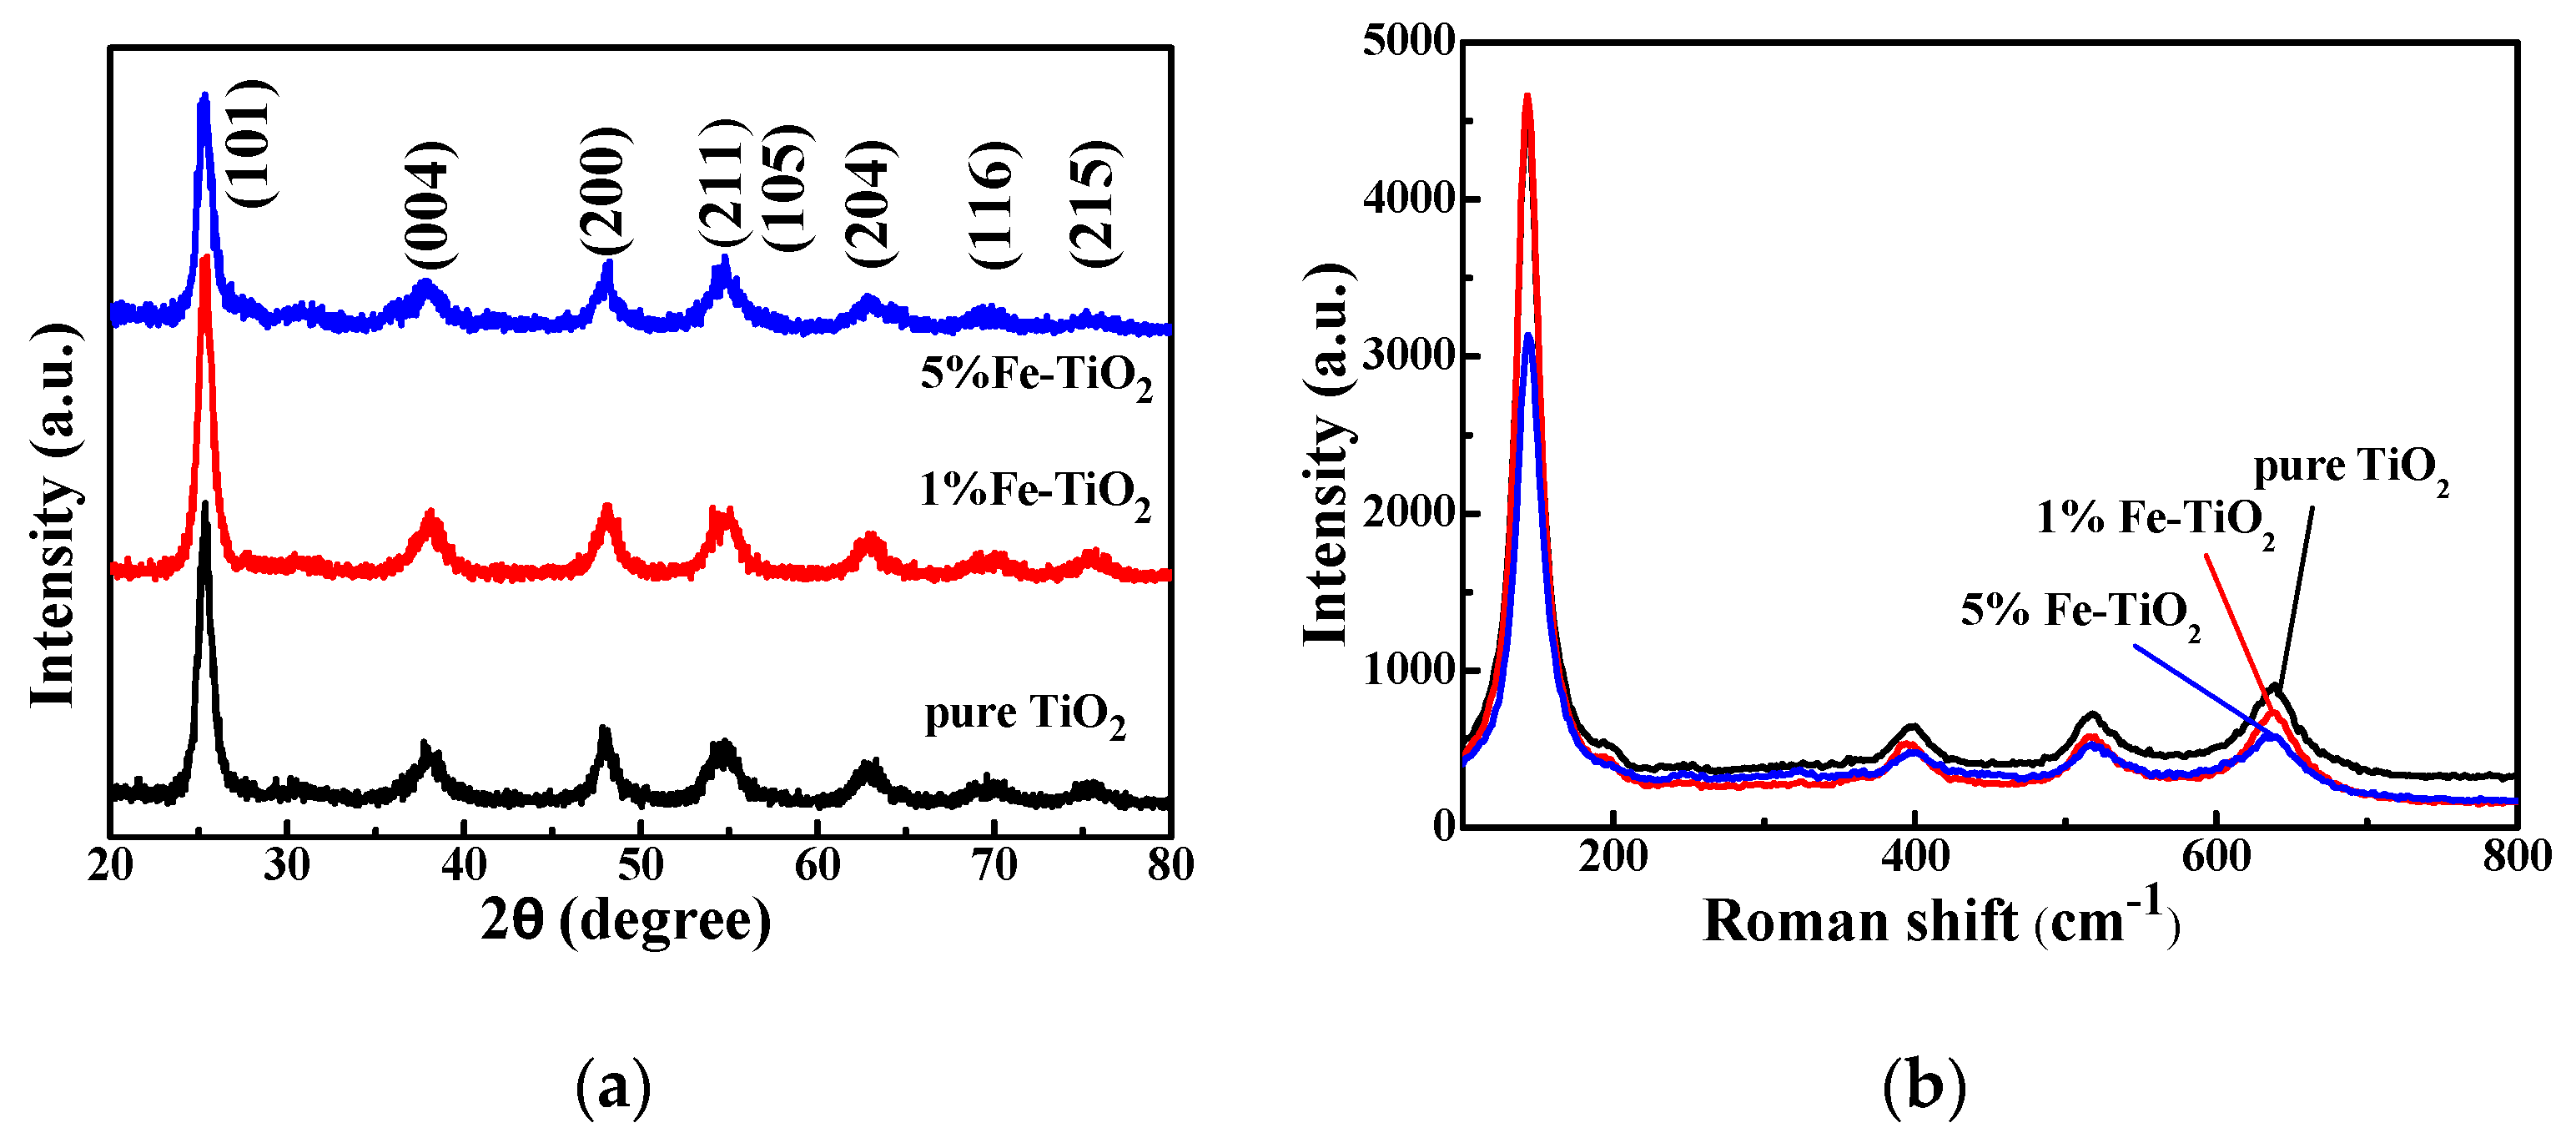
3.2.1. XRD Characterization

The crystal structures of pure TiO2 and Fe-TiO2 were characterized by XRD. As shown in Figure 5a, the positions of the diffraction peaks of pure TiO2 and Fe-TiO2 are the same, and each diffraction peak is the diffraction peak of the anatase phase (the corresponding crystal plane is marked in the diagram). Additionally, the diffraction peaks of pure TiO2 and Fe-TiO2 are the same. There are no diffraction peaks of the rutile phase and iron-related crystal phase in the XRD pattern, which indicates that the doping of Fe3+ does not change the crystal structure of TiO2, and Fe3+ does not form a phase alone. However, compared with the pure TiO2 and Fe-TiO2 XRD spectra, the diffraction peak intensity decreases after doping the iron, indicating that the existence of Fe3+ has an inhibitory effect on the crystallization of TiO2 [36].

3.2.2. Raman Characterization
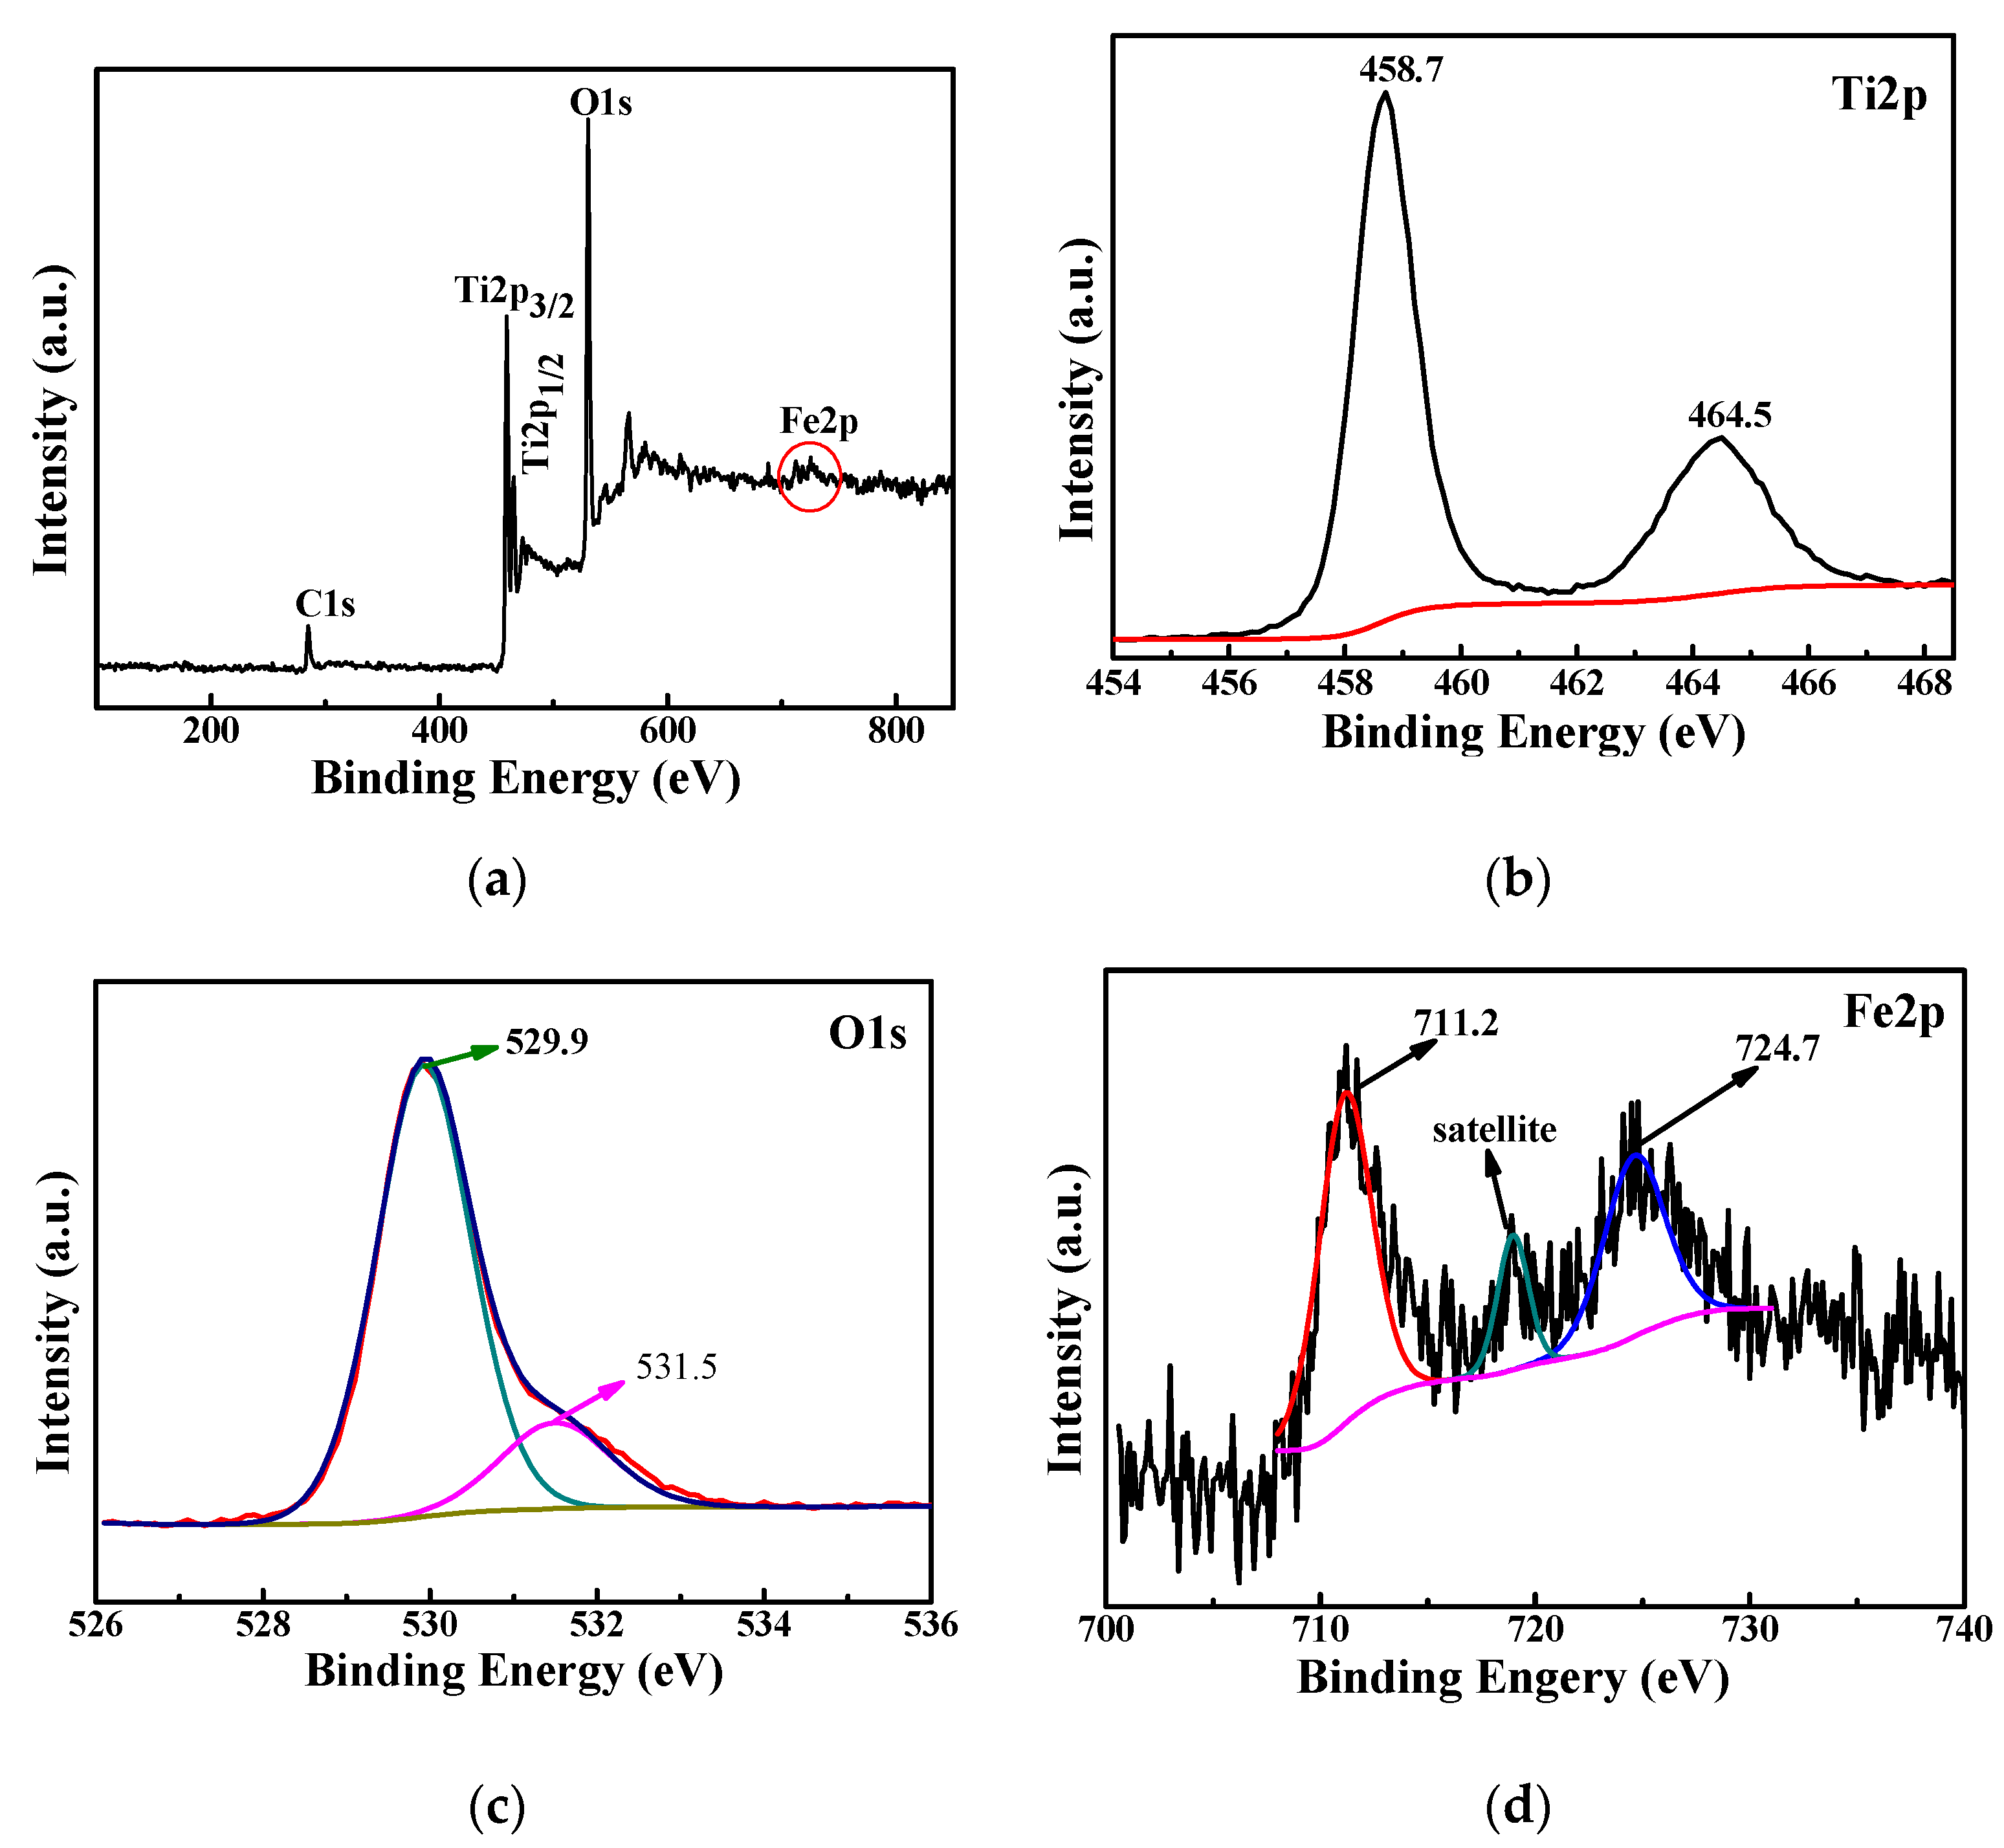
The Raman spectra of the prepared photocatalysts are shown in Figure 5b. The characteristic peaks at 141.6 cm−1, 396.3 cm−1, 516.4 cm−1 and 638.9 cm−1 correspond to the anatase phase [40,41], but there are no characteristic peaks of the rutile phase and iron-related phase except for the four peaks of the anatase phase. Compared with pure TiO2 and Fe-TiO2, it is found that the Raman shift does not change after Fe3+ doping, but the peak intensity and peak width change in varying degrees; in particular, the peak intensity of 5%Fe-TiO2 decreases and the peak width increases, indicating that Fe3+ replacing Ti4+ in the lattice results in the increase of lattice distortion and peak width, while the inhibition of crystal transformation weakens the peak intensity. This conclusion is consistent with the analysis of XRD patterns.

3.2.3. XPS Analysis

XRD and Raman analysis did not find the specific existence state of iron, but both showed evidence of the existence of iron. Therefore, the synthesized Fe-TiO2 was analyzed by XPS to determine the specific existence of iron. Figure 6 shows the full XPS spectrum of 5%Fe-TiO2 and the high-resolution spectra of Ti2p, O1s and Fe2p. All electron binding energies were calibrated according to C1s (284.6 eV) of contaminated carbon. The full spectrum of 5.0%Fe-TiO2 is shown in Figure 6a; the main elements are Ti and O, and there are relatively few Fe elements in the sample, meaning that the detected signal of the Fe element is relatively weak. The peaks at 458.7 eV and 464.5 eV correspond to the Ti2p characteristic peaks of Ti2p3/2 and Ti2p1/2 in Figure 6b. The peaks at 529.9 eV and 531.5 eV correspond to the characteristic peaks of O1s in Figure 6c. Figure 6d shows less obvious Fe2p characteristic peaks than Figure 6a, which are the main characteristic peaks of Fe2p3/2 and Fe2p1/2 corresponding to 711.5 eV and 724.6 eV and the satellite peaks of 718.9 eV. This is consistent with the detection of Fe3+ by Yamashita et al. [42], which proves that iron exists in the positive trivalent form. No single iron phase is found in Raman spectra and XRD, leading us to speculate that iron could be doped into the lattice.

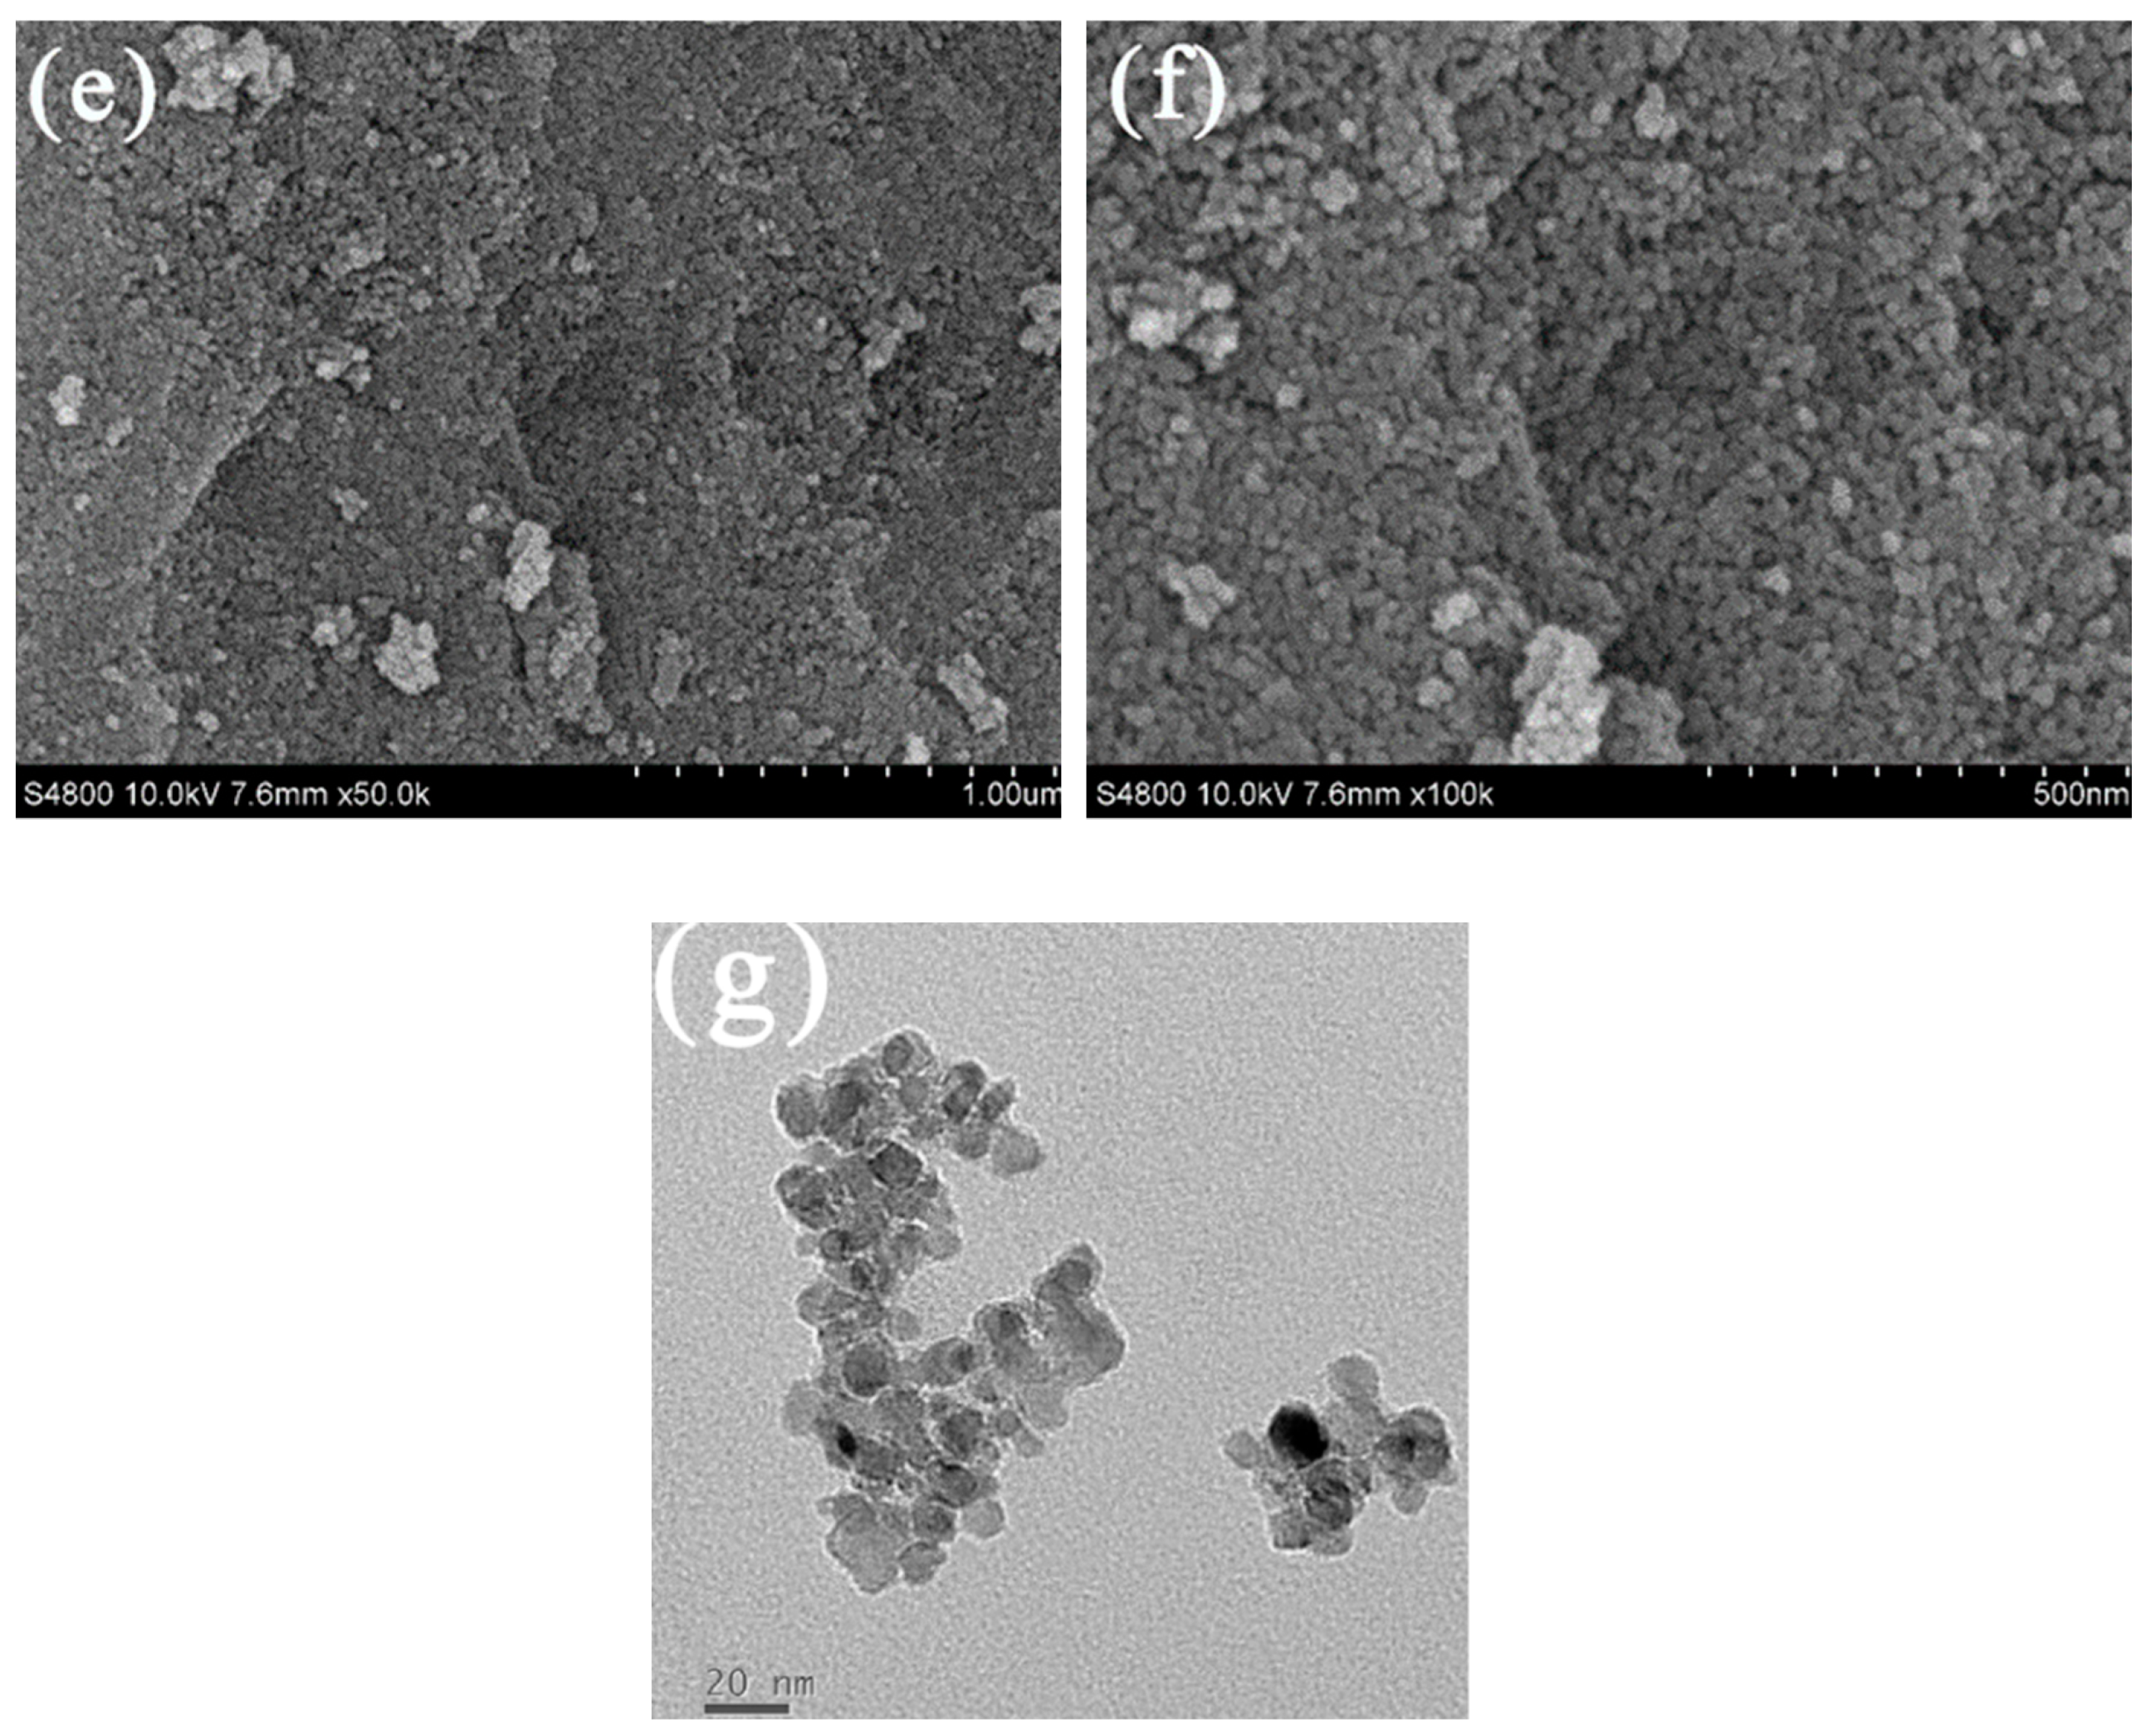
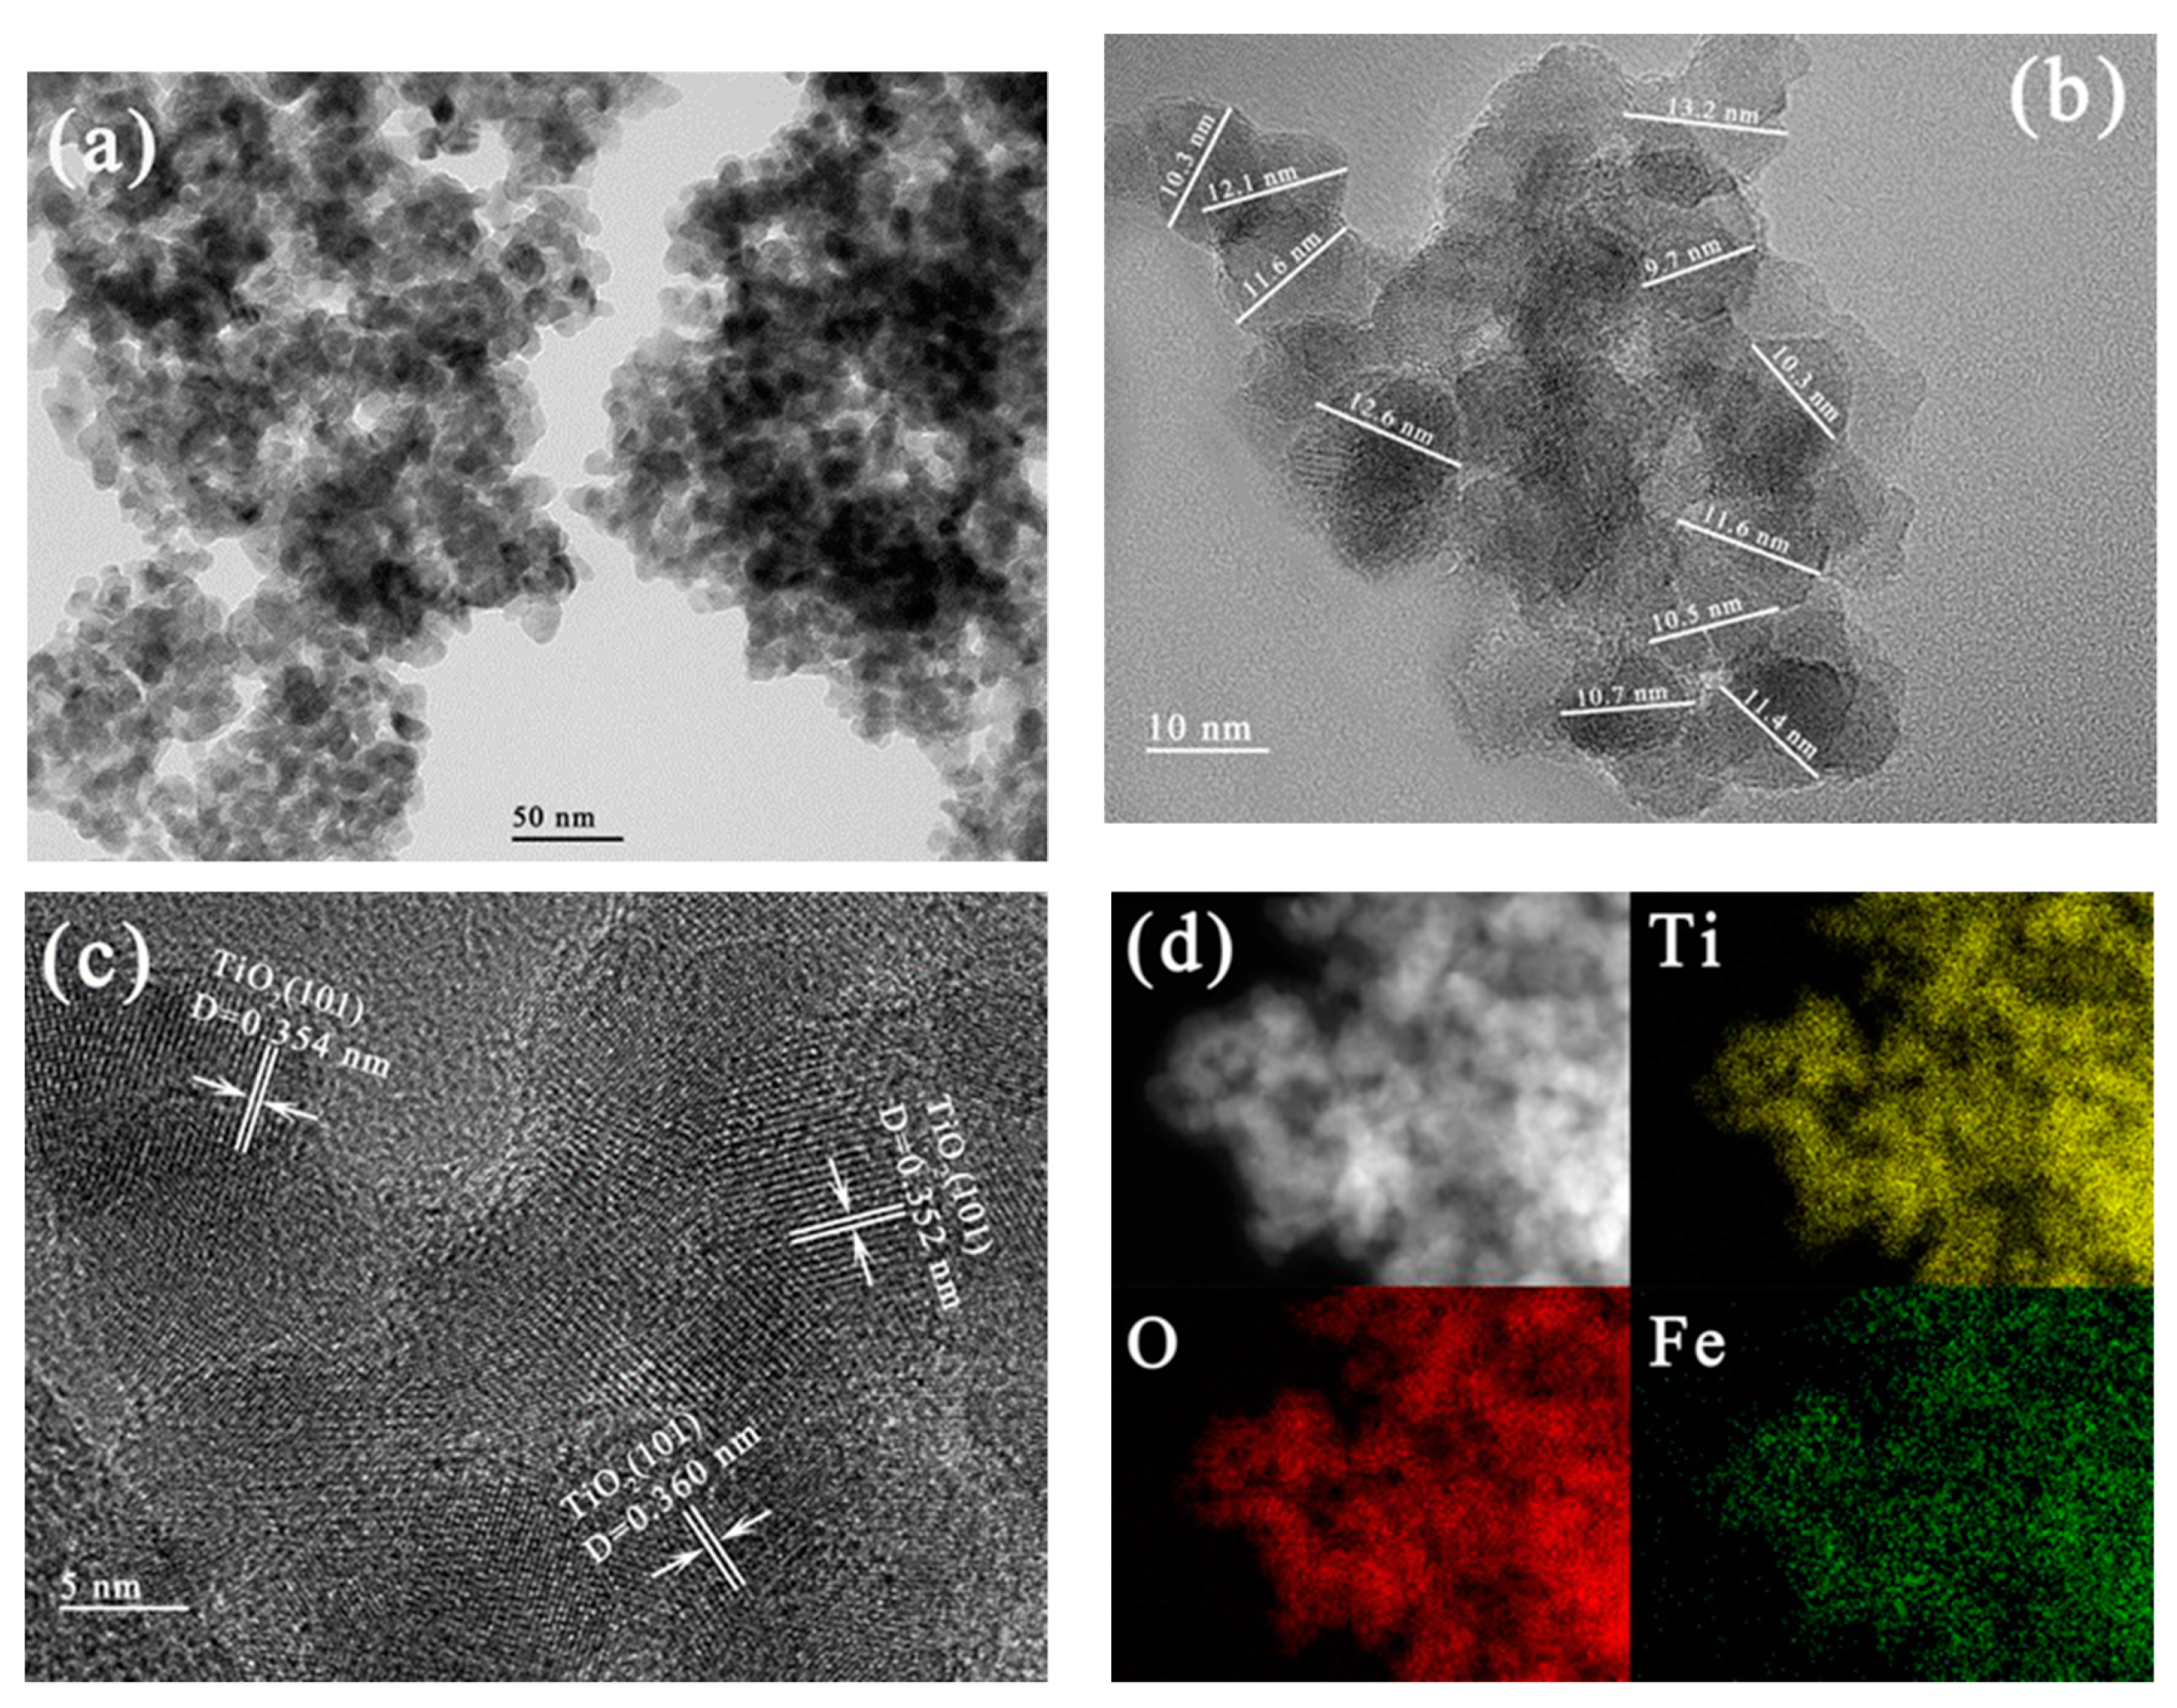
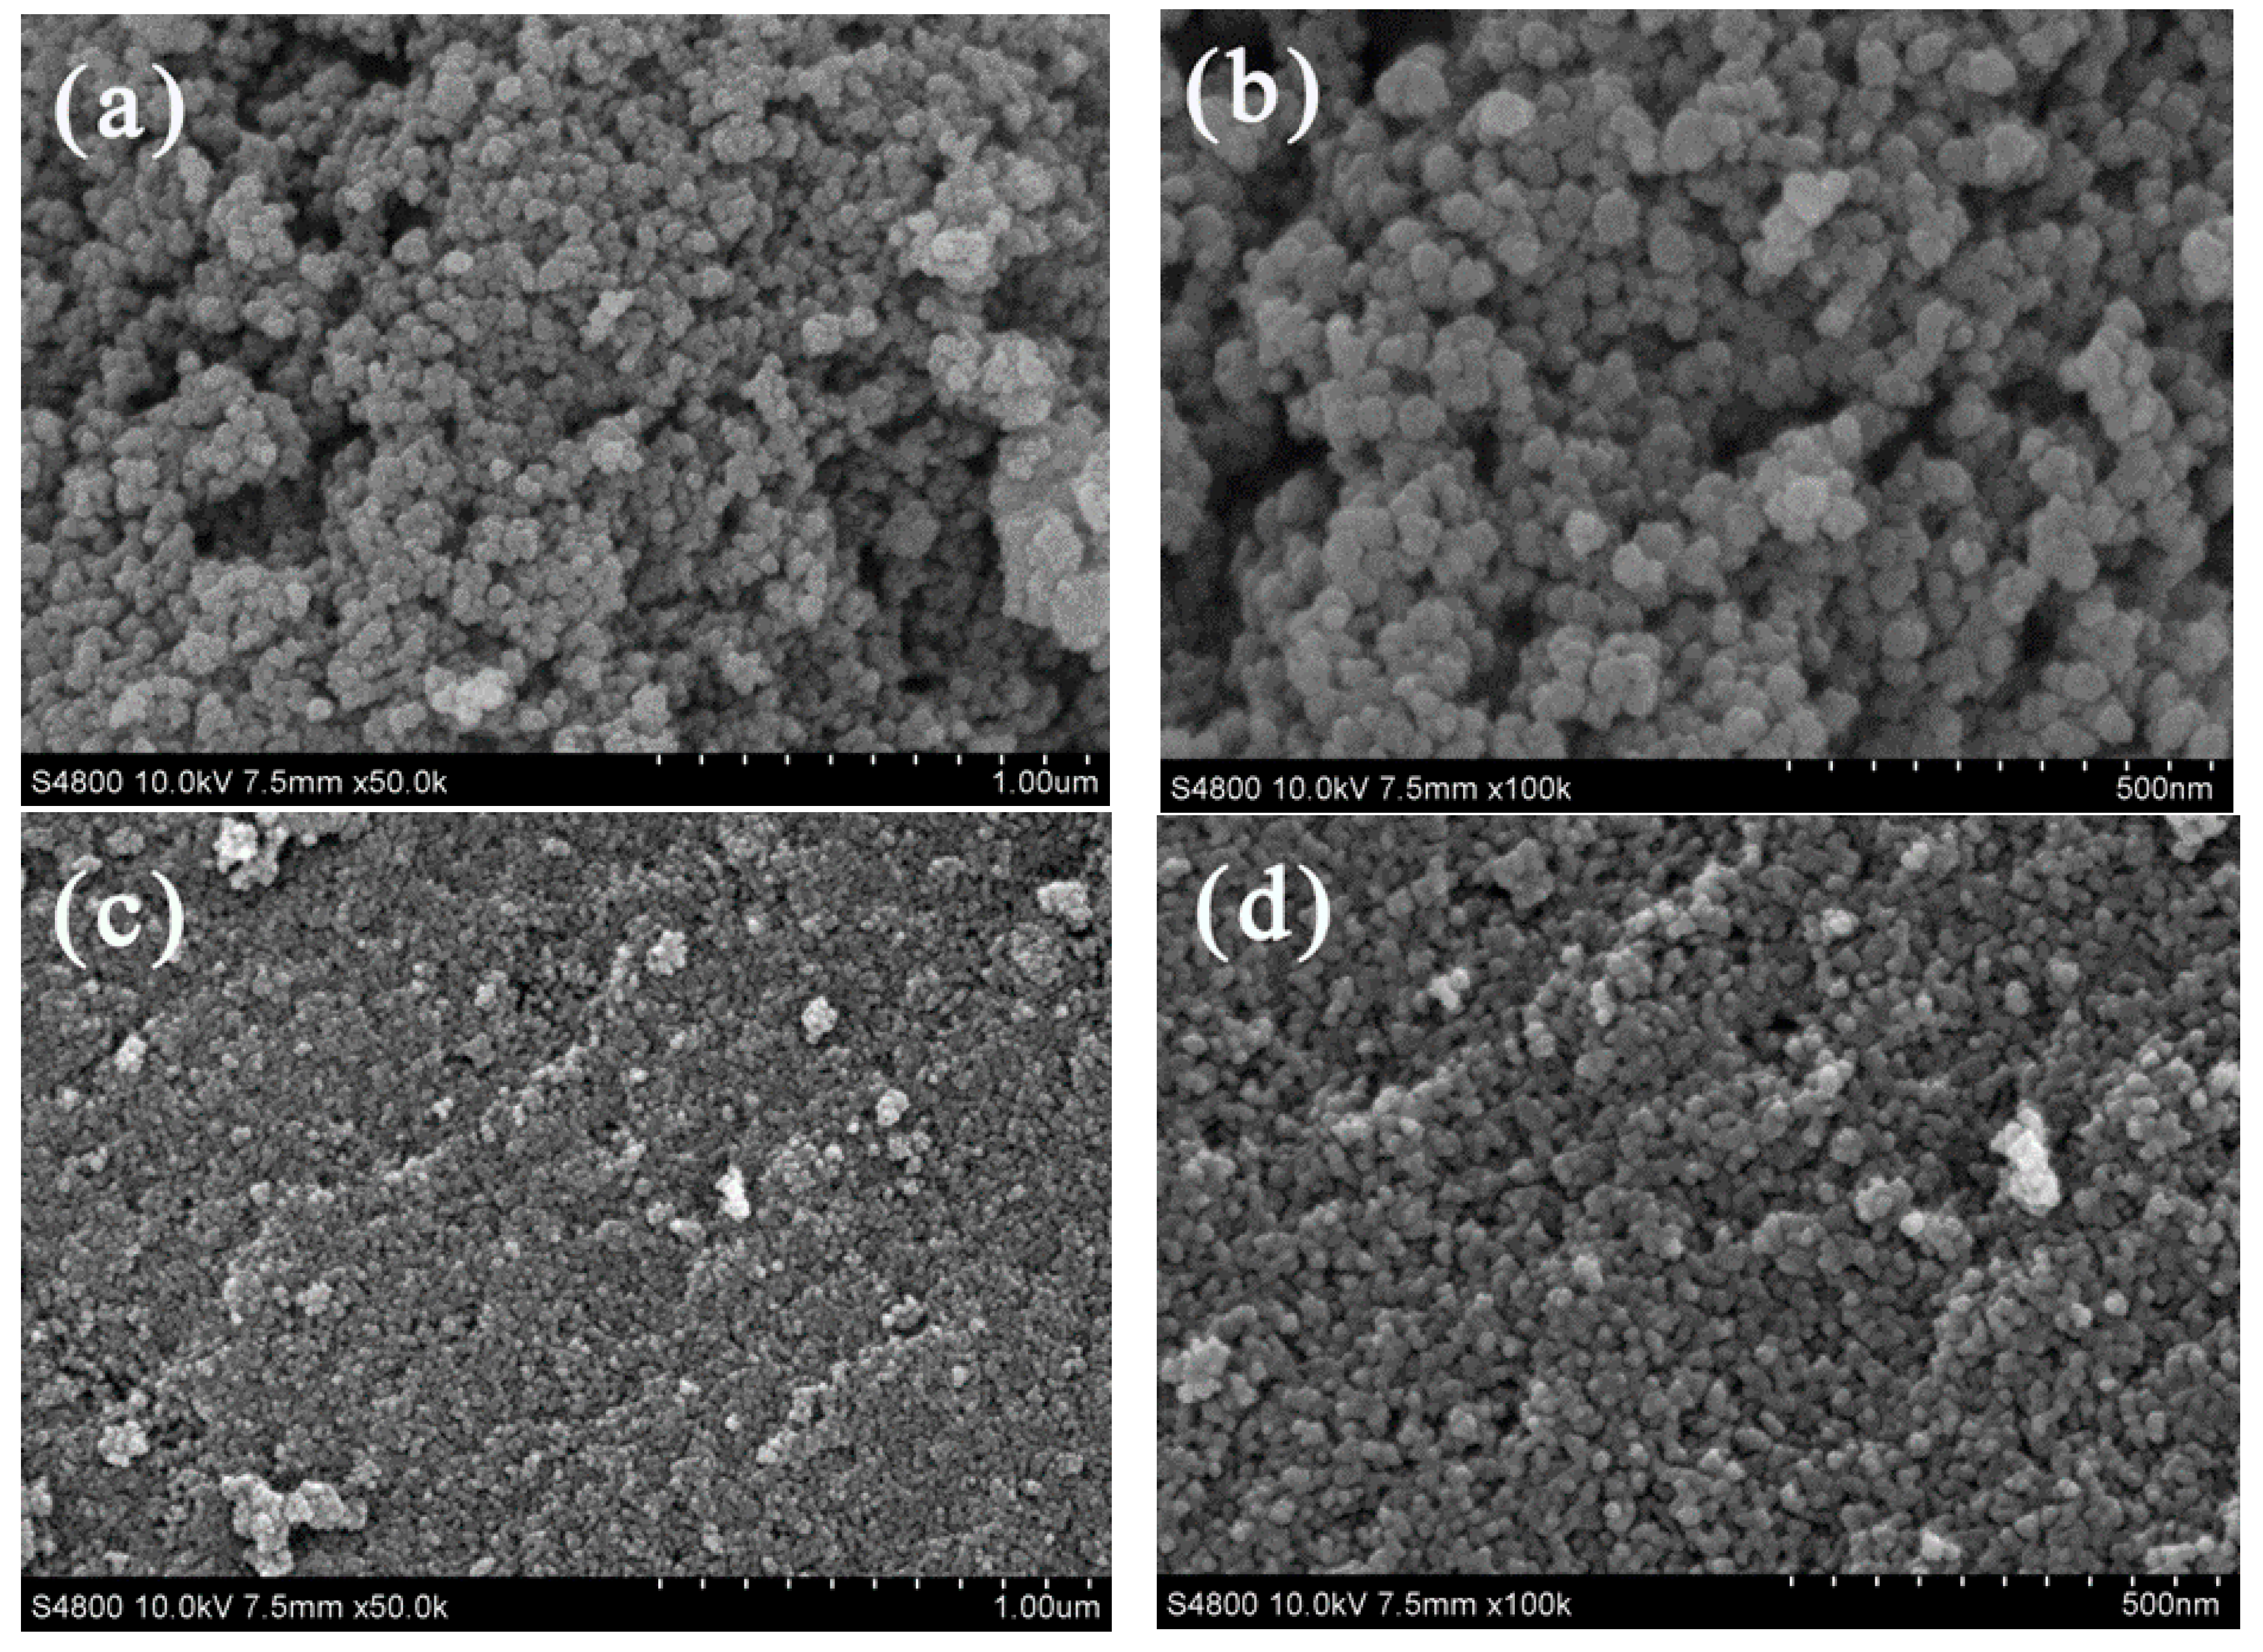
3.2.4. TEM, HRTEM and EDX Mapping

TEM and HRTEM images of 5%Fe-TiO2 nanoparticles were measured to study their morphology and microstructure (Figure 7a–c). From Figure 7a,b, it can be seen that the 5% Fe-TiO2 particles remain the same spherical particles as the prepared pure TiO2, with a particle size of 11.3 ± 1.9 nm. The lattice stripes of 5%Fe-TiO2 particles are shown in Figure 7c, and the lattice stripe spacing of 0.352 to 0.360 nm corresponds to the (101) crystal plane of the TiO2 anatase phase. EDX mapping characterization was carried out to determine the doping status of Fe3+ in TiO2. From Figure 7d, it can be seen that Fe, Ti and O elements are uniformly distributed in the whole visual field, indicating that Fe has formed uniform doping in TiO2 and also proving that the uniform doping of Fe elements could be realized in IS-RPB.

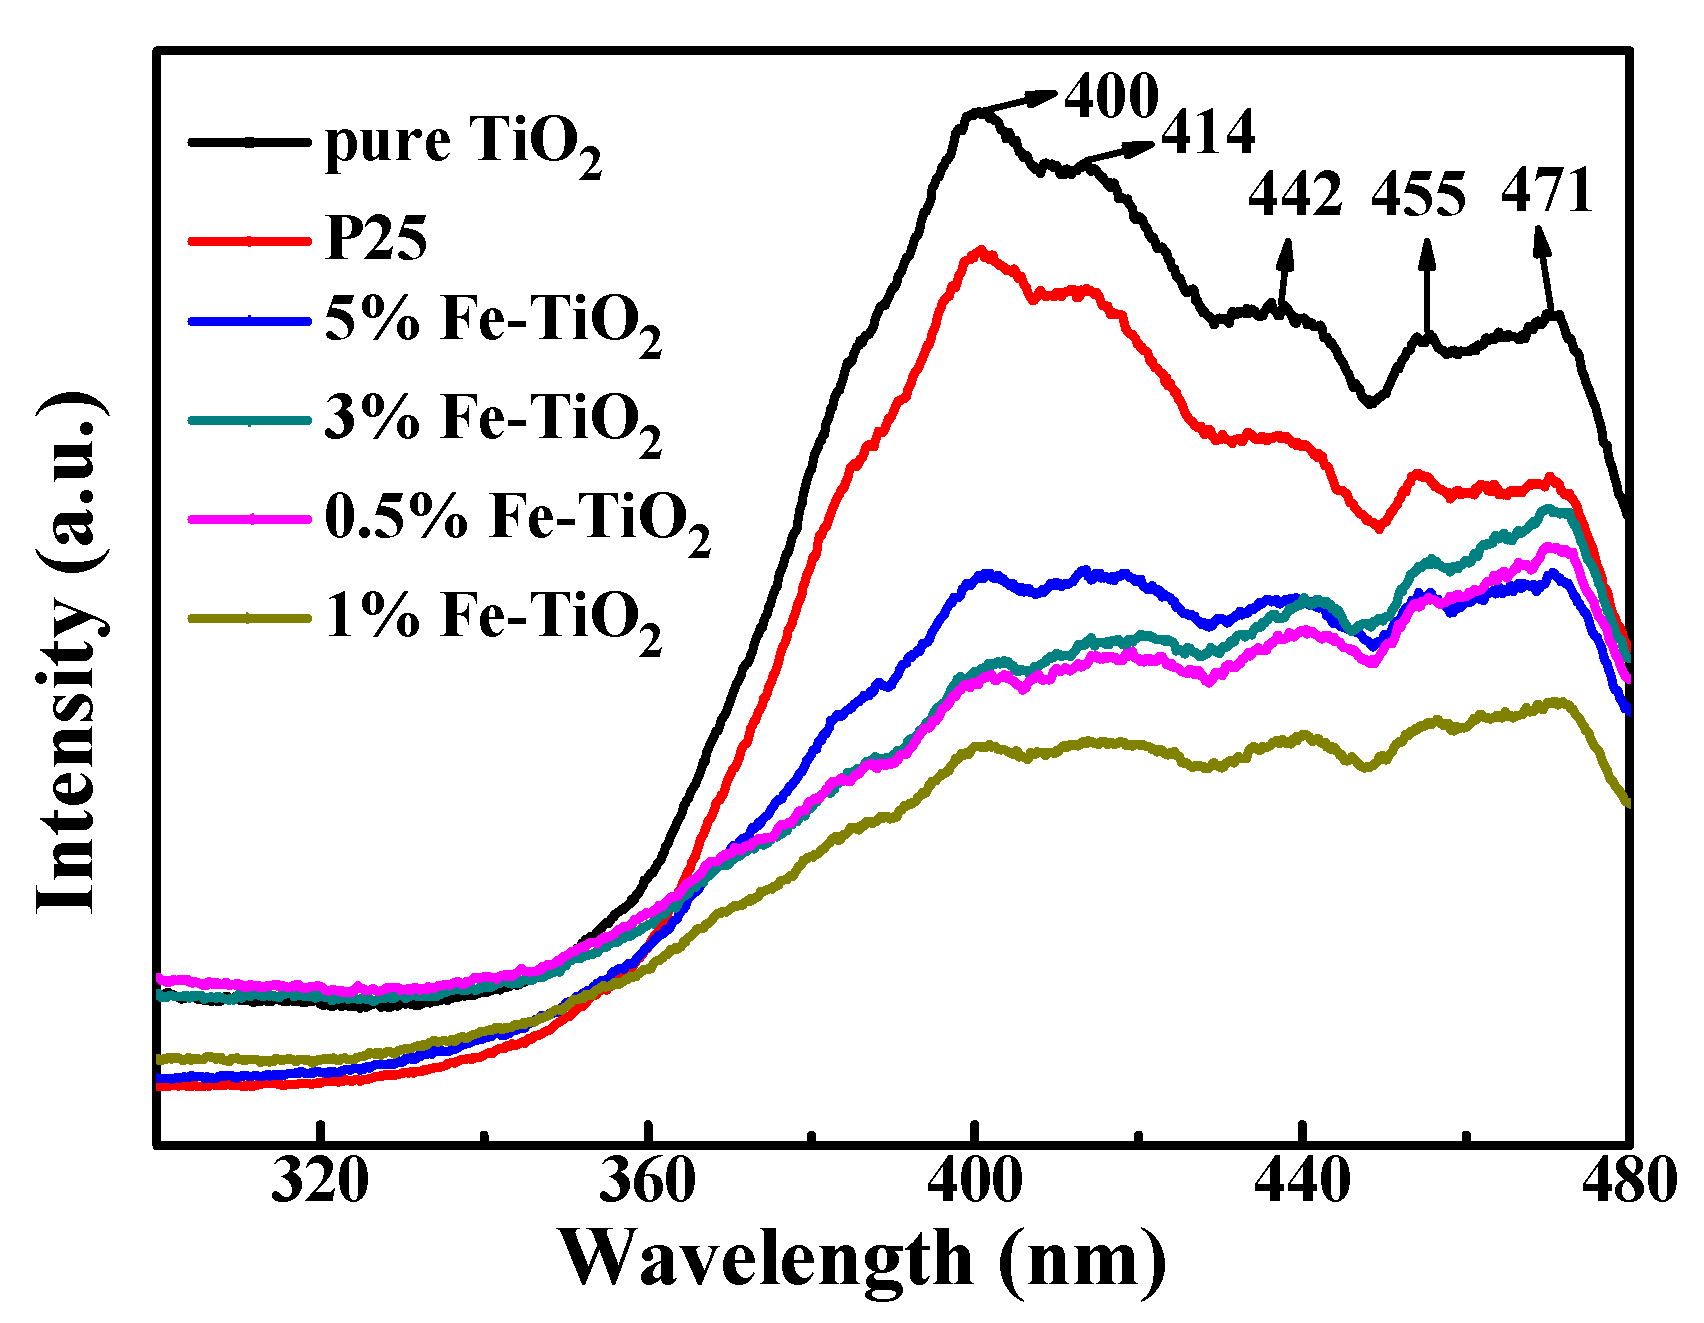
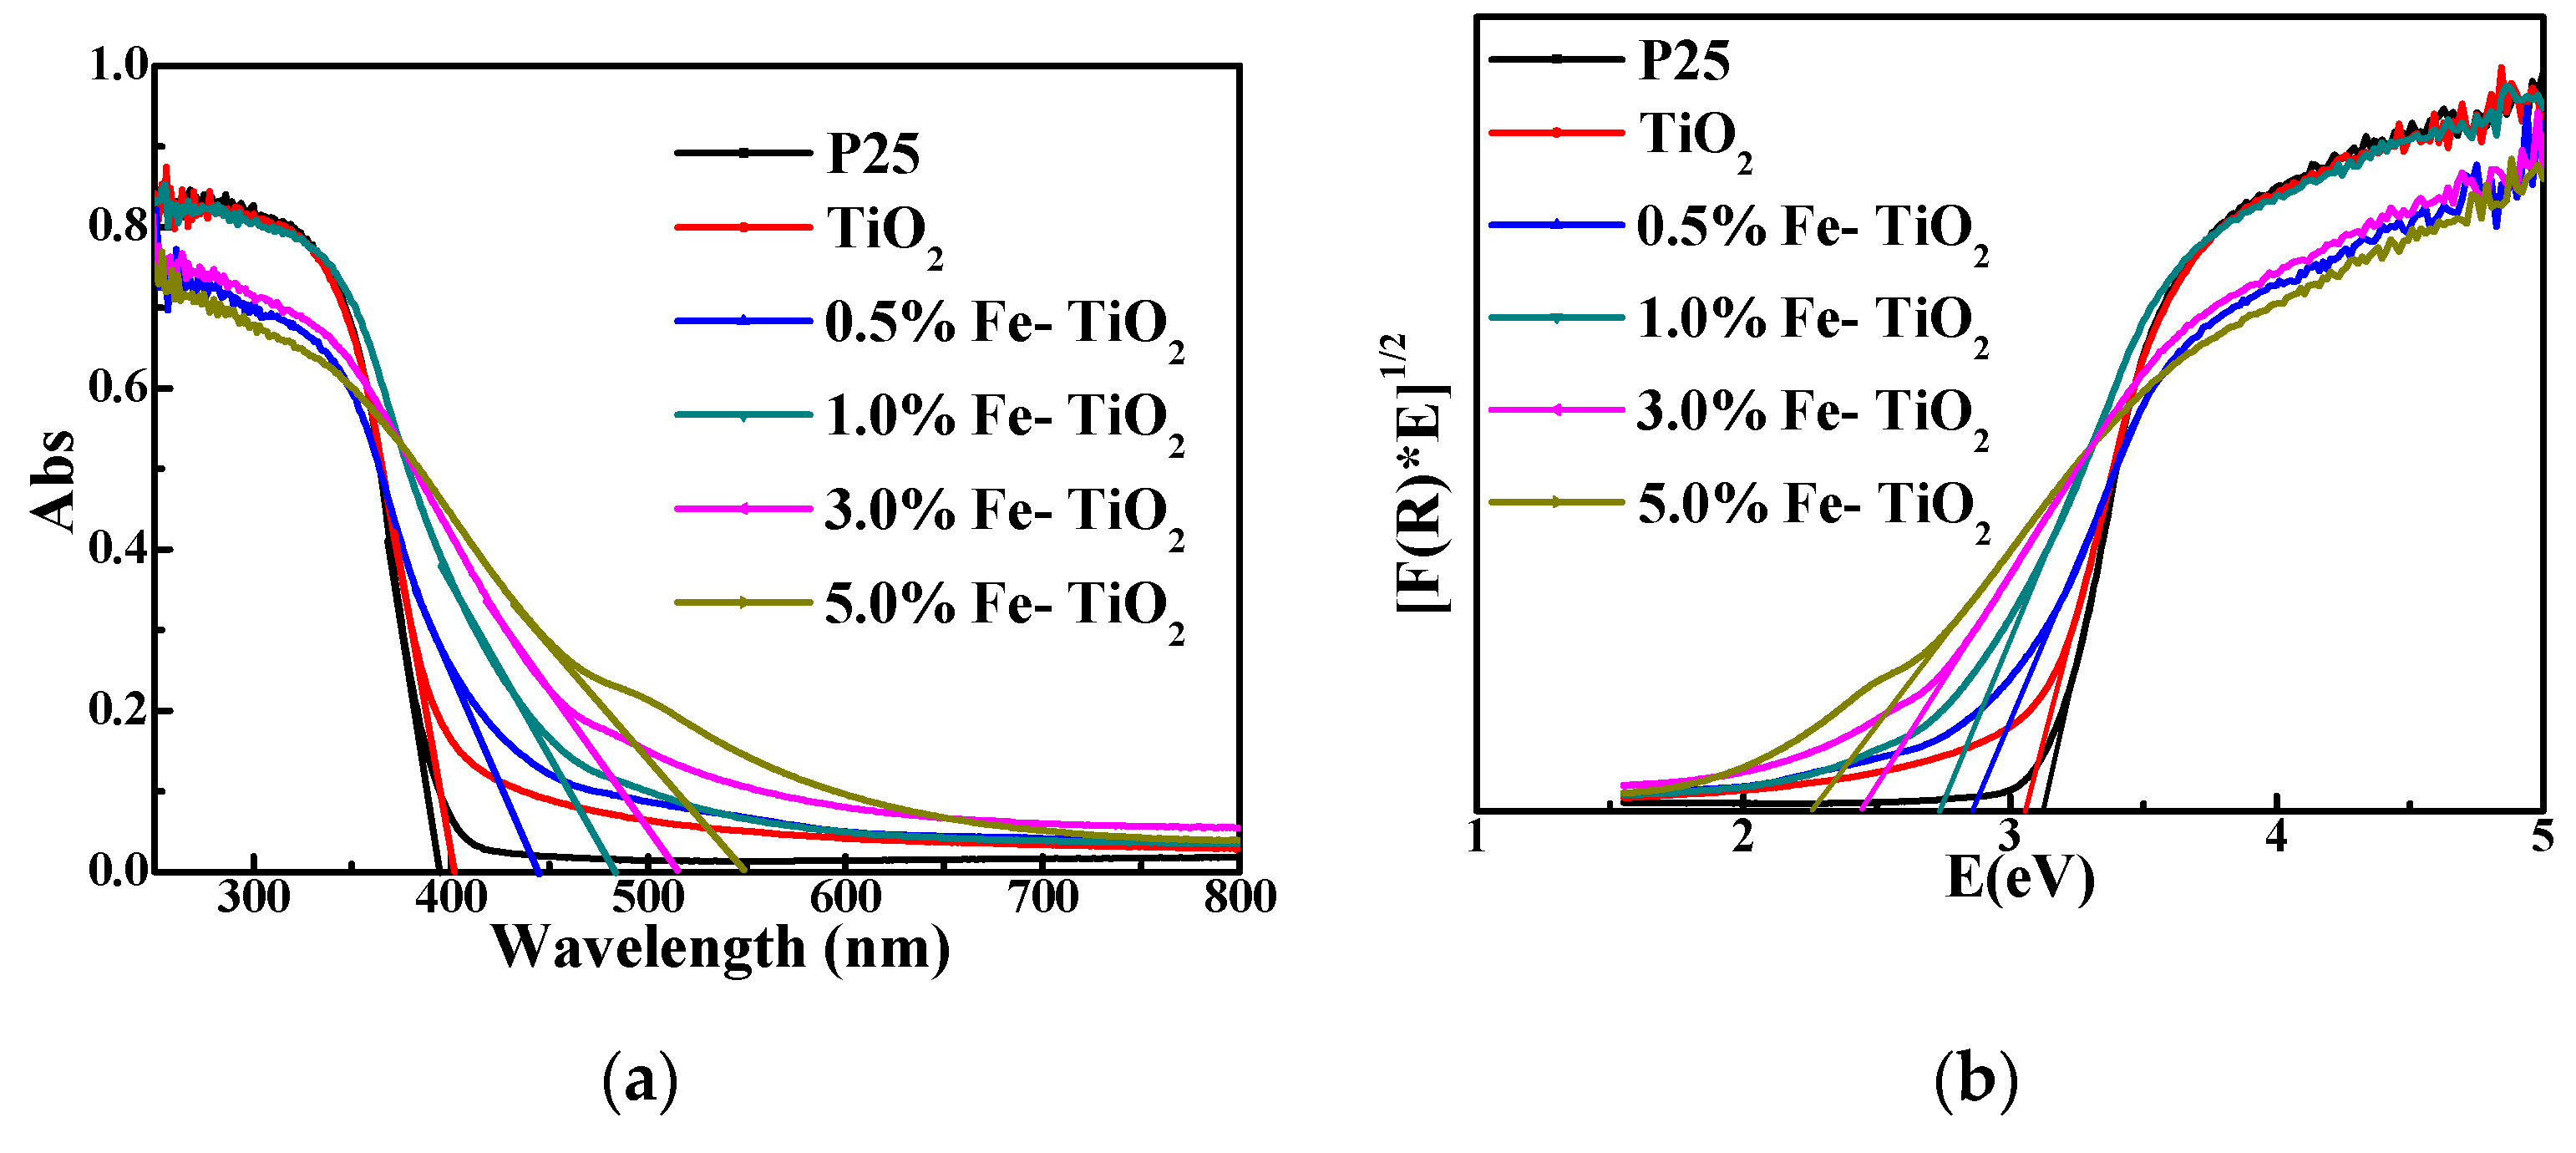
3.2.5. Photoresponse of Nano-TiO2
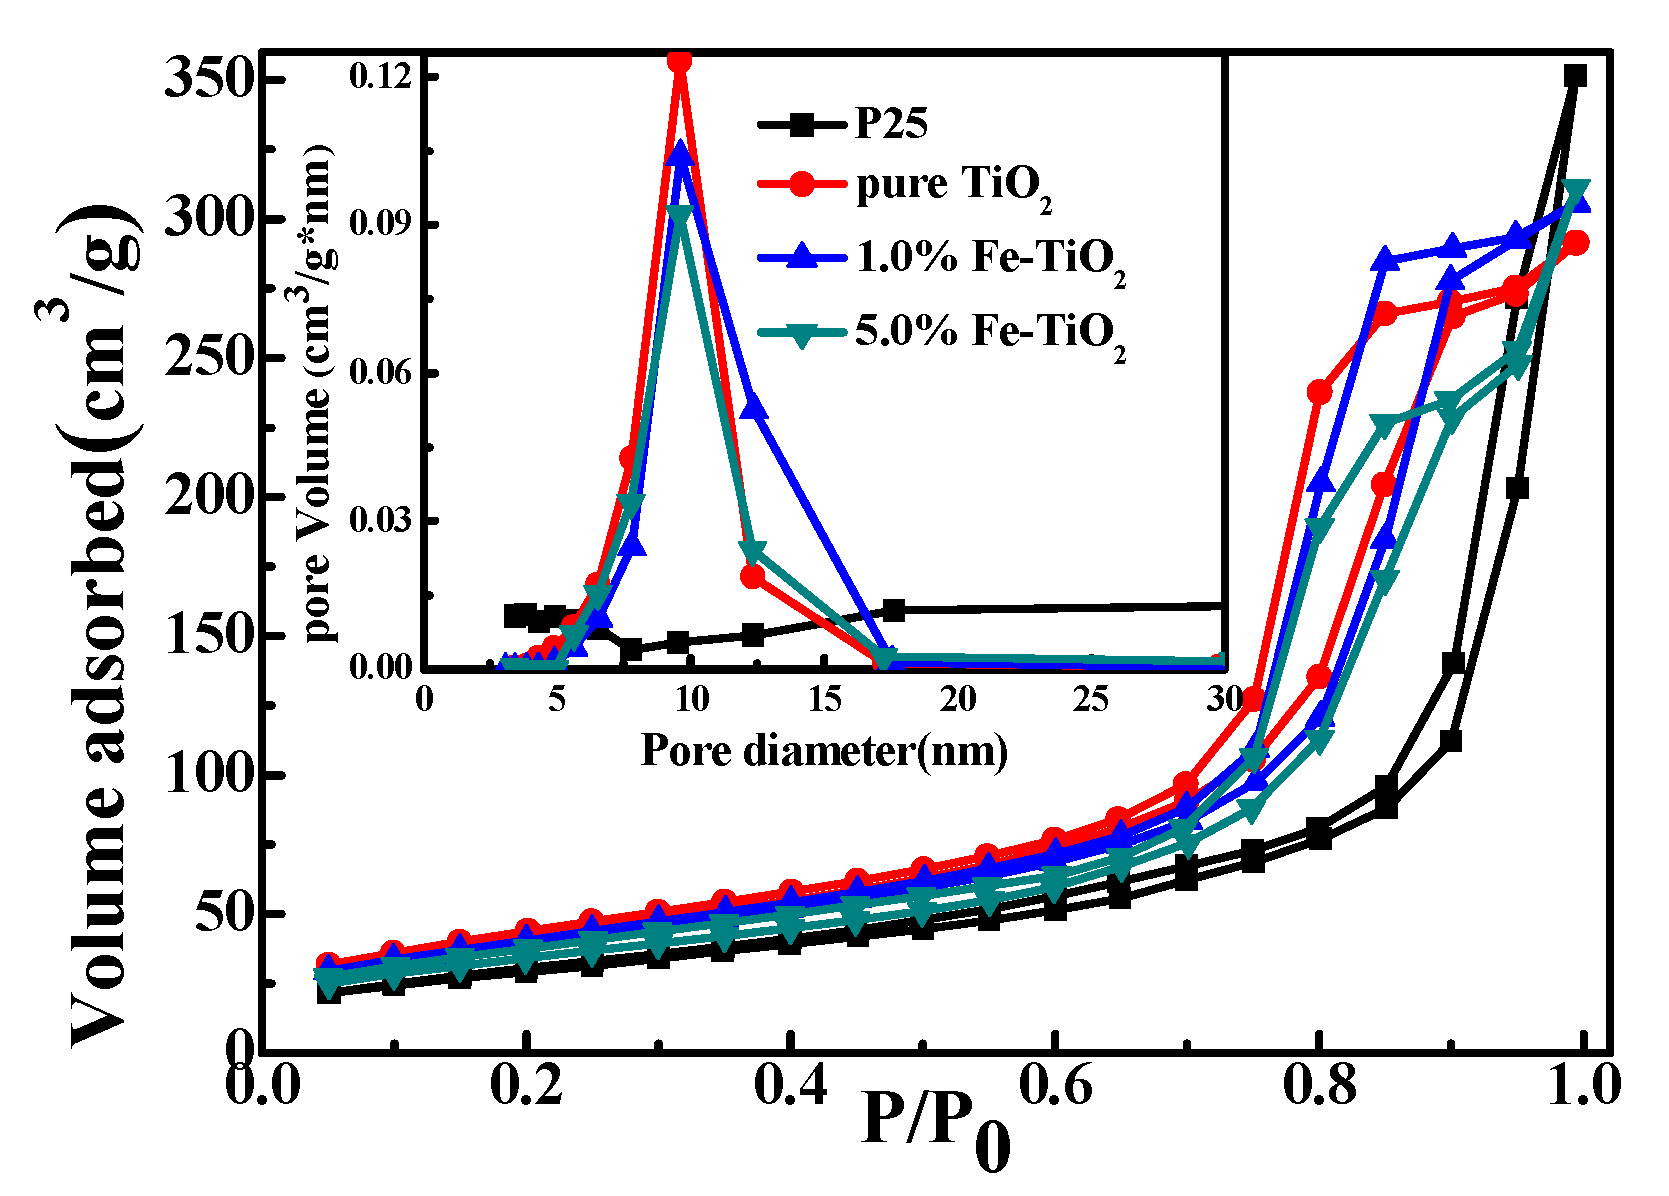
The photoresponse of prepared samples was analyzed by UV-Vis DRS and compared with commercial P25. The results are shown in Figure 8a. The curves of all the samples have a similar shape, indicating that iron did not significantly change TiO2. The difference of the curves lies in the difference of the downward trend and amplitude at 350 to 600 nm. The intersection of the tangent with transverse coordinates at the most obvious downward trend of the curve represents the limit of light absorption. All samples had strong light absorption below 400 nm, but P25 and pure TiO2 had almost no absorption at 400 to 800 nm. On the contrary, Fe-TiO2 shows different degrees of absorption to visible light, and the maximum optical absorption wavelength increases with the increase of Fe3+ content. This is probably due to the fact that Fe3+ precipitates uniformly in TiO2 during precipitation synthesis, and after calcination at high temperature, Fe3+ enters into the TiO2 lattice and uniformly replaces part of Ti4+, resulting in the absorption of visible light. The calculation of the band gap energy of samples by the Kubelka–Munk formula is as follows:
A = lg ( R )
F ( R ) = ( 1 R ) 2 / 2 R
E = 1240 / λ
where A is the absorbance, R is the reflectivity, E is the band gap energy and λ is the optical wavelength. The band gap energy diagram of the sample is obtained by using (F(R)*E)1/2 as the longitudinal coordinate and E as the transverse coordinate, as shown in Figure 8b. The linear part of the spectrum is extended and the intersection point with the transverse coordinate is the band gap energy of the sample. The band gap energies of P25 and pure TiO2 are 3.12 eV and 3.06 eV, respectively. With the increase of Fe3+ content from 0.5% to 5.0%, the band gap energy decreases from 2.86 eV to 2.26 eV. The main reason for this is that the iron doping into the TiO2 lattice produces a new impurity energy level, which changes the electronic structure, leading to the decrease of the band gap energy and the absorption of visible light [43,44].

3.2.6. BET Analysis

In order to analyze the surface area, total pore volume and average pore diameter of photocatalysts, N2 adsorption–desorption isotherms were measured, and the corresponding data are shown in Table 2. In Figure 9, the adsorption trend and desorption trend of pure TiO2, 1.0%Fe-TiO2 and 5.0%Fe-TiO2 prepared by IS-RPB show sharp changes at P/P0 between 0.6 and 0.9, indicating that isotherms are the IV-type and that the pore is mesoporous. The hysteretic loop formed by the curve is obviously H2-type, indicating that the catalyst has an ink-bottle-type pore structure [45]. P25 corresponds to the non-porous II-type isotherm. In the pore size distribution diagram and Table 2, the three catalysts prepared by IS-RPB show similar small and narrow pore size distributions and a similar total pore volume, while P25 has a wide pore size distribution and a pore size of 30.56 nm, which is the reason the specific surface area of the three catalysts is larger than P25.

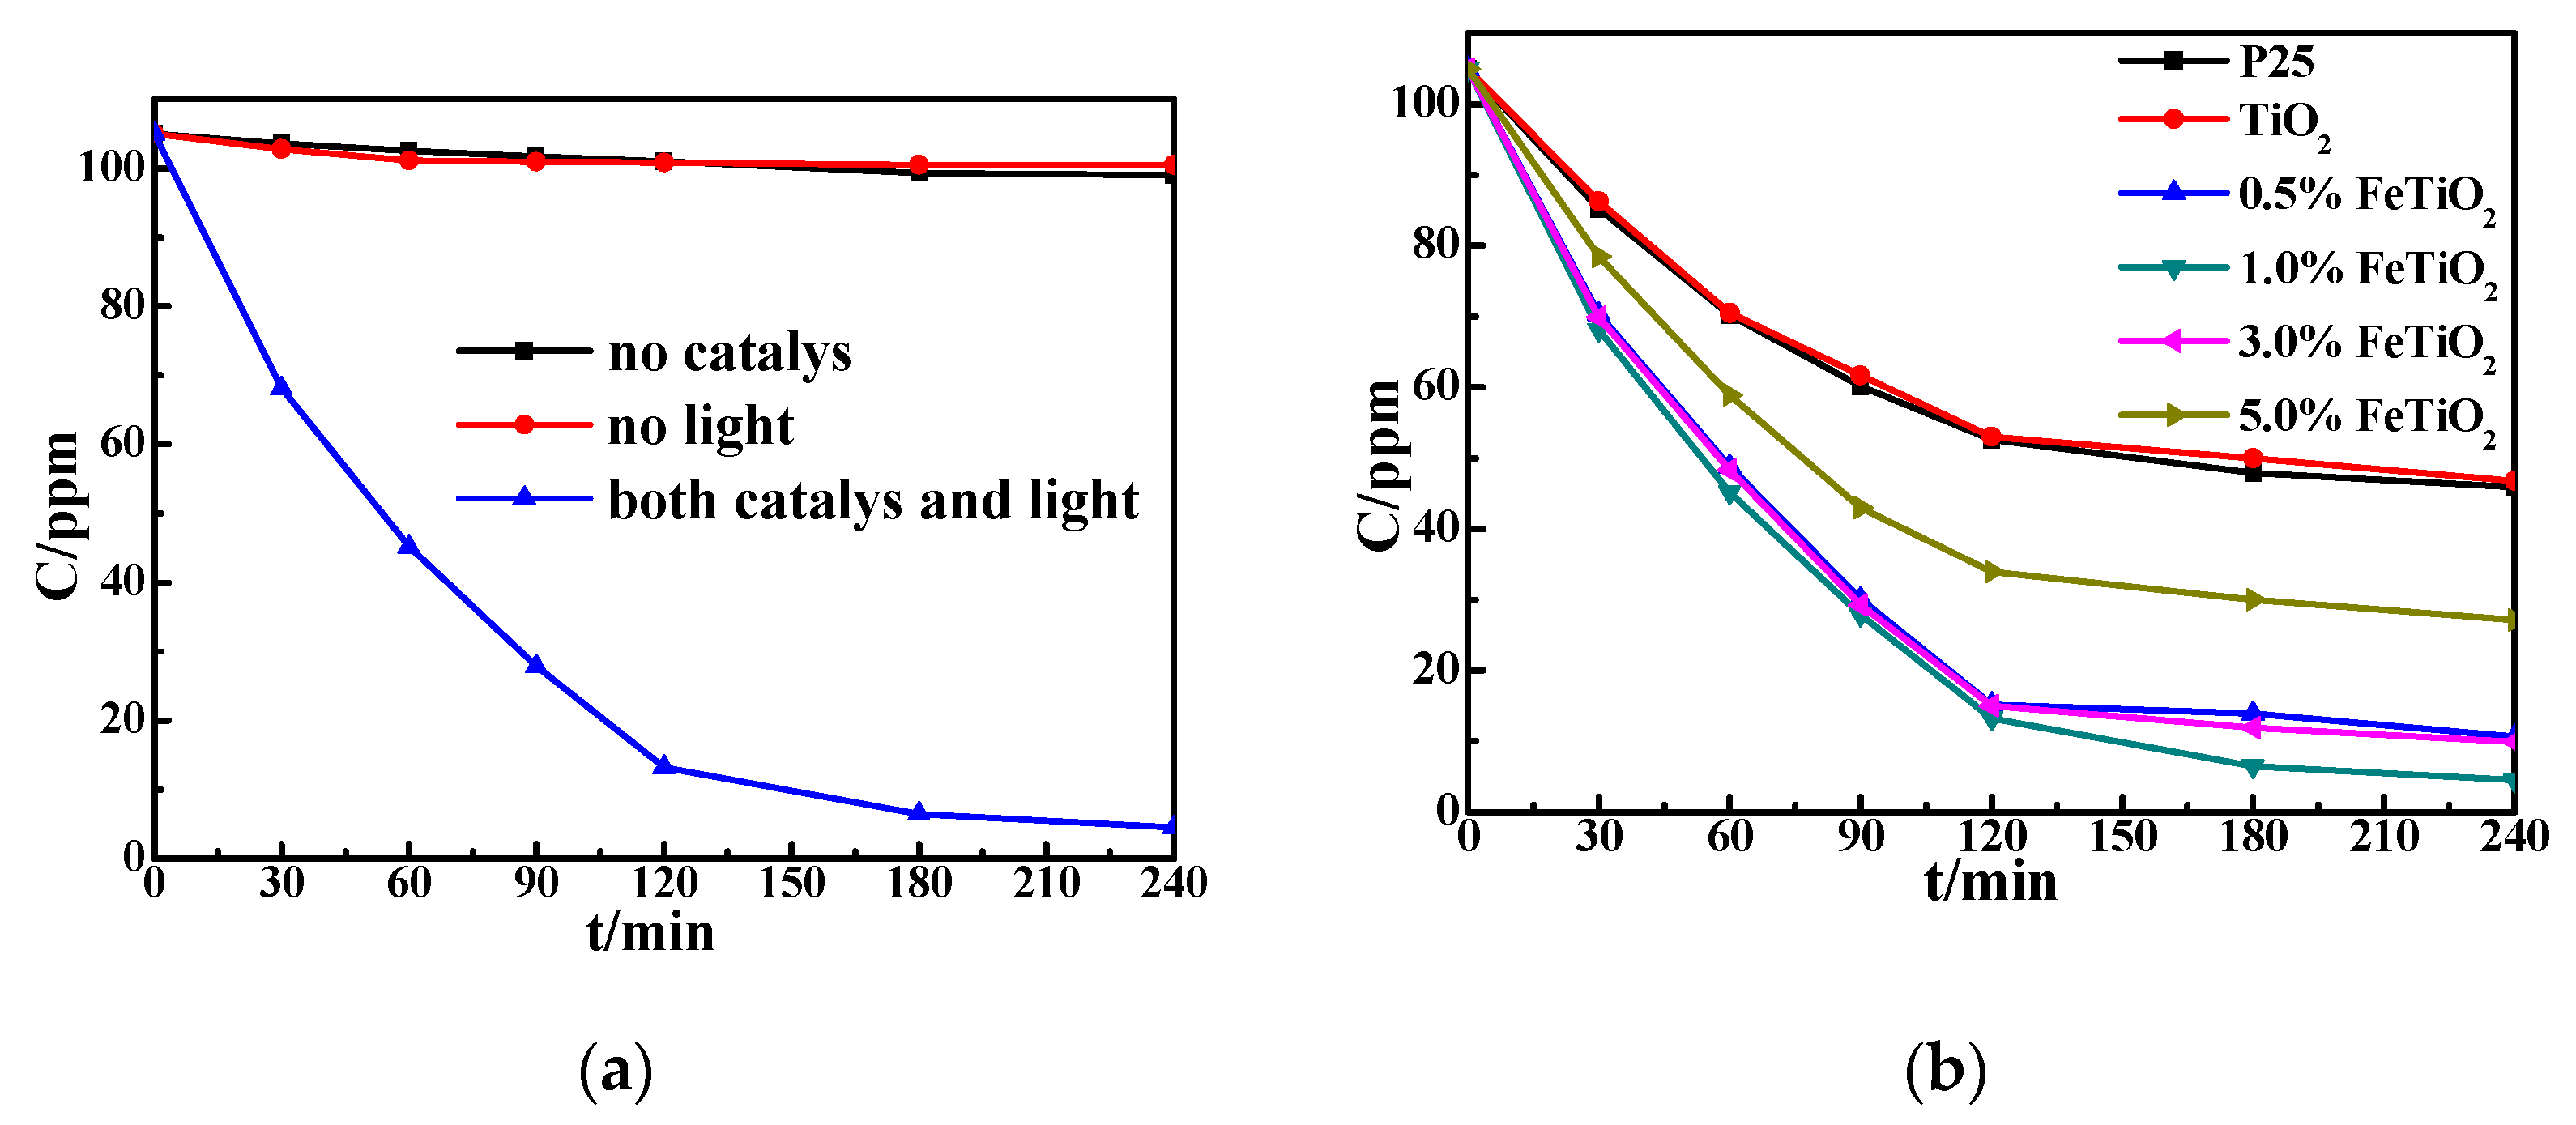
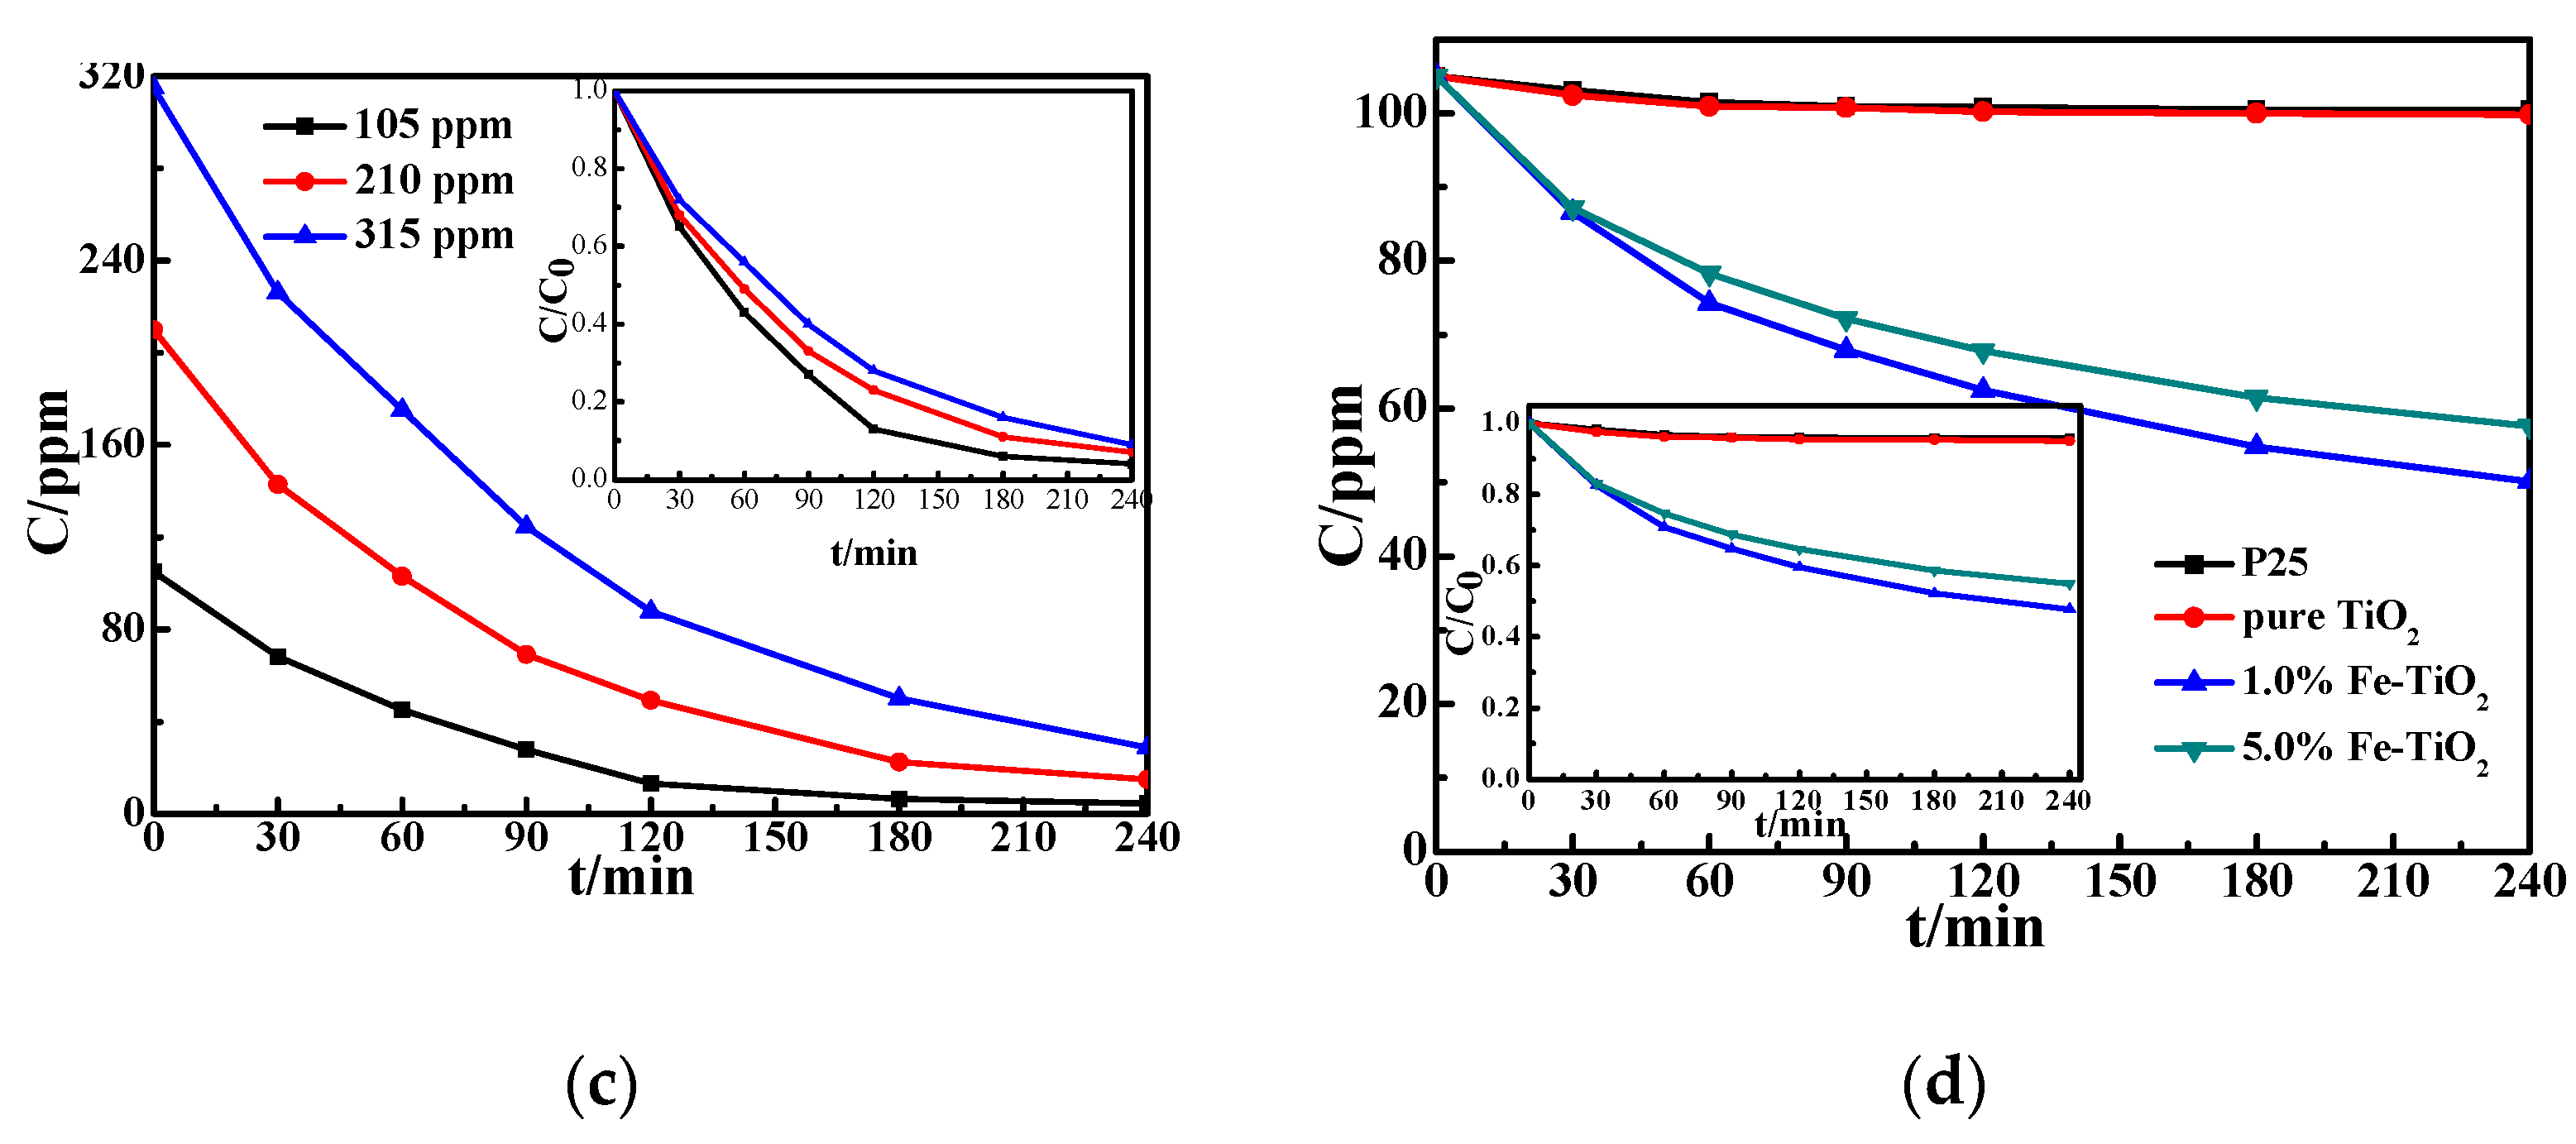
3.3. Photocatalytic Activity

A control experiment was carried out to explore the adsorption of toluene by the catalyst and the direct decomposition of toluene by high-energy UV light; i.e., toluene was degraded by only the catalyst, only light, and both the catalyst and light (1.0%Fe-TiO2 was used as the catalyst). The result is shown in Figure 10a. Using only the catalyst, there is a slight decrease of the toluene concentration at the initial time, which was caused by the adsorption of the catalyst on toluene, and the concentration no longer decreases when the adsorption reaches equilibrium. Using only light, the toluene concentration remained weakly decreasing as the degradation progressed, because the photon energy at 254 nm was larger and a little toluene was decomposed. Using both the catalyst and light, toluene was greatly degraded. This is because TiO2 is excited by UV light, forming electrons and holes, and a series of reactions produce oxidative species such as ·OH, which can effectively decompose toluene.
Figure 10b compares the photocatalytic properties of the prepared pure TiO2 and Fe-TiO2 with commercial P25 as a control. The degradation rates of P25 and pure TiO2 were 56.2% and 55.4%, respectively, because the electron and holes of pure TiO2 were easily combined and rendered inefficient. The two crystal phases of P25 transferred some electrons between the two phases, thus exhibiting slightly higher efficiency than pure TiO2. When Fe3+ was doped, the efficiency was greatly improved. The degradation efficiencies of Fe-TiO2 with Fe3+ at 0.5%, 1.0%, 3.0%, and 5.0% were 89.9%, 95.7%, 90.5% and 74.1%, respectively. This is due to the beneficial effect of iron doping on the formation of TiO2, which leads to the enhancement of photocatalytic activity.
Figure 10c shows the concentration change curves of the degradation process of different initial toluene concentrations over time. When the initial toluene concentration is 105 ppm, the degradation efficiency is higher than the initial concentration at 210 ppm and 315 ppm in the same time. When the degradation efficiency is the same, the degradation time at a high concentration is often longer. However, the degradation amount increases simultaneously with the increase of initial concentration, which may be due to the increased likelihood of contact between the toluene and the catalyst, resulting in more degradation.
The result of UV-vis DRS has shown a photoresponse under visible light. In order to explore the degradation ability of the catalyst under visible light, an Xe lamp (300 W, 25.89 mW/cm2), the light of which was below 400 nm, eliminated by an ultraviolet cut-off filter, was used as a visible light source. Figure 10d shows the degradation ability of P25, pure TiO2 and two Fe-TiO2. P25 and pure TiO2 showed no degradation ability under visible light; the minimal decrease of toluene was caused by adsorption. On the contrary, both 1.0%Fe-TiO2 and 5.0%Fe-TiO2 showed degradation ability under visible light. However, the photocatalytic efficiency decreased from 95.7% and 74.1% under UV light to 54.9% and 47.7%, respectively. The possible reason for this is that the addition of iron leads to the absorption of visible light by TiO2. However, because the energy of visible light is lower than that of UV light, only part of the light was used, and so the photodegradation efficiency is lower than that under UV light.

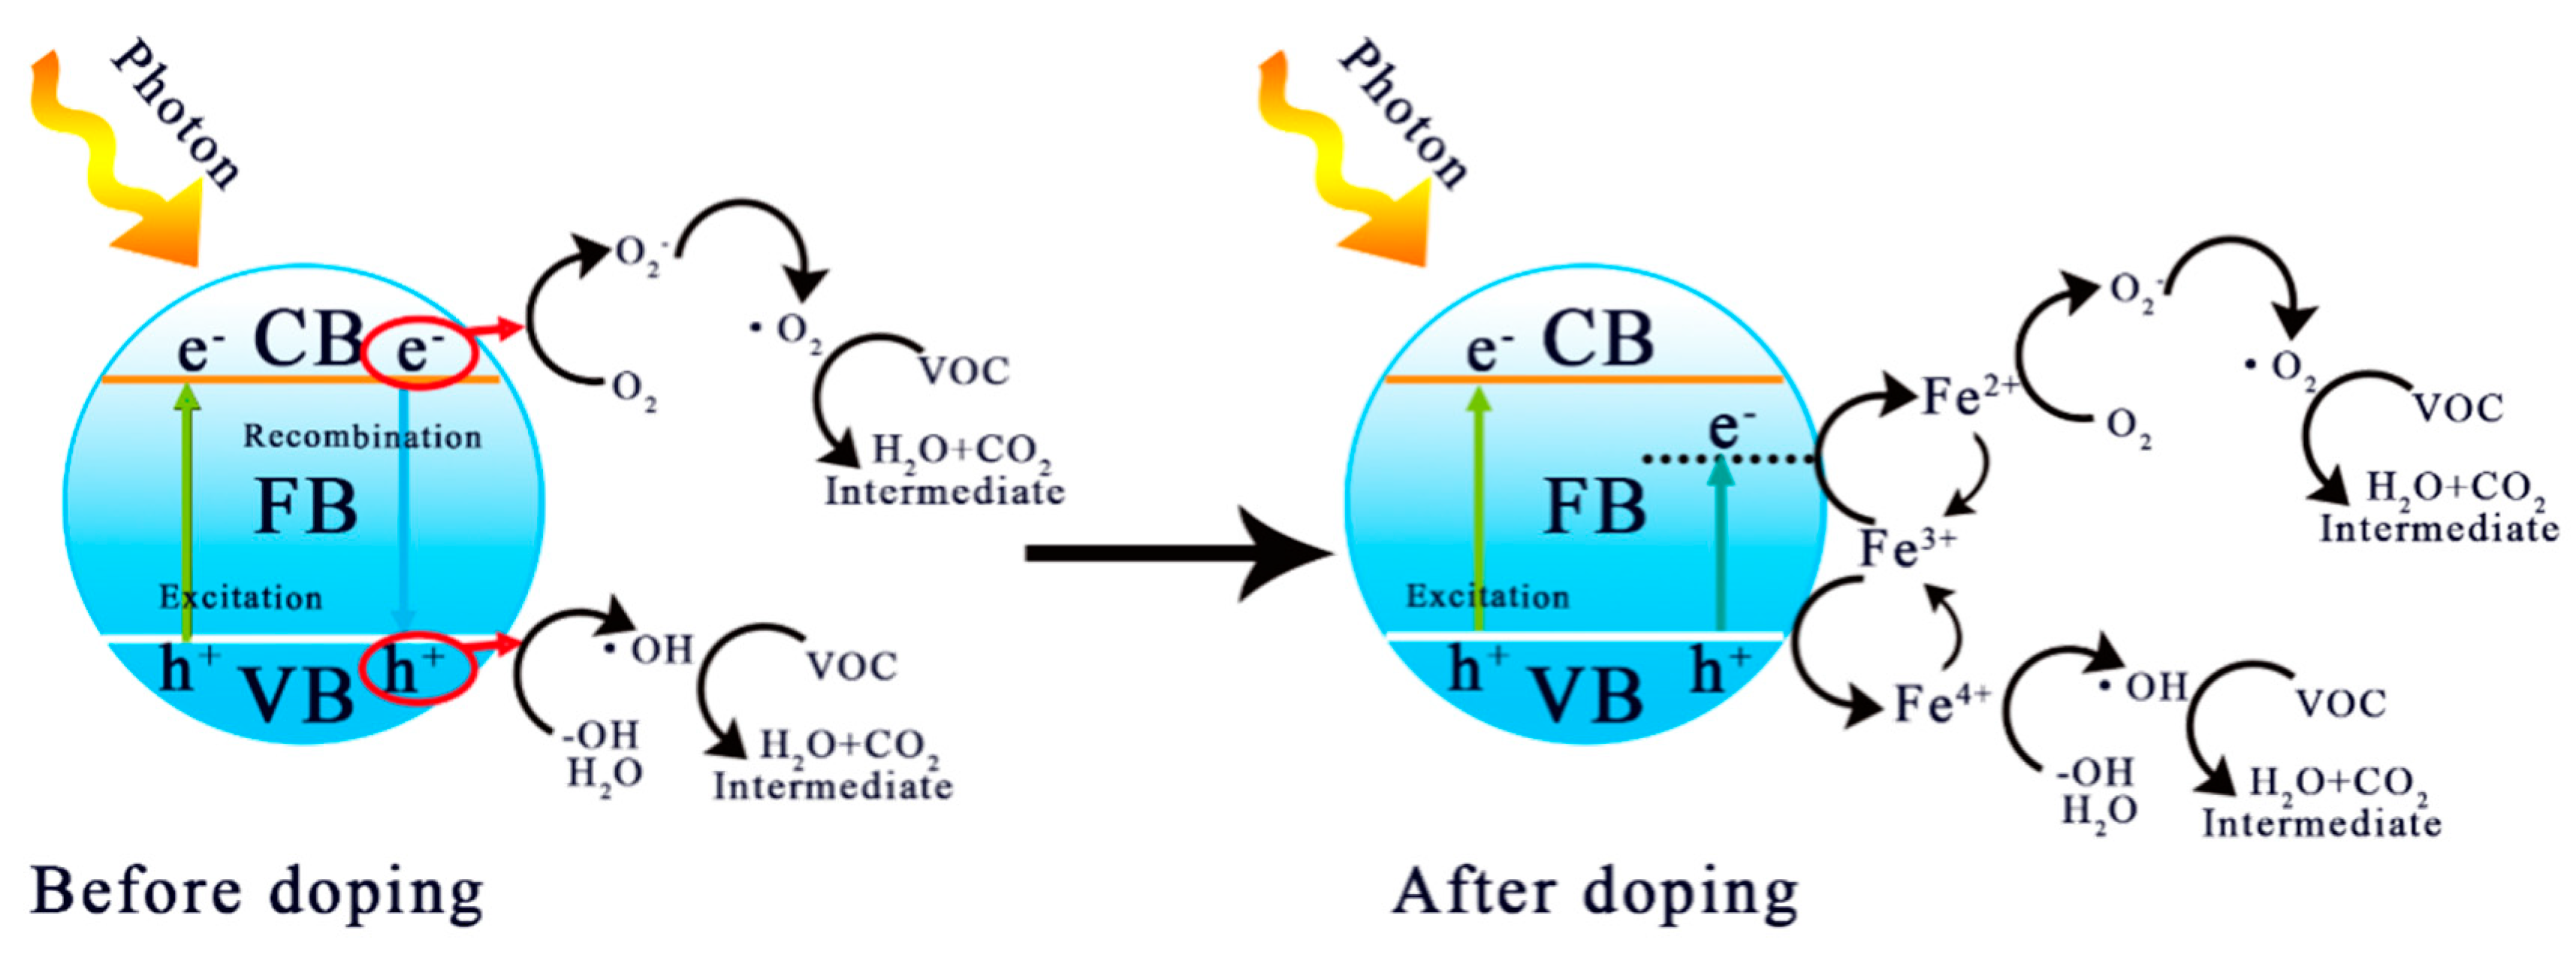
3.4. Possible Mechanism of Photocatalytic Enhancement

The degradation experiment of toluene showed that the degradation efficiency of Fe-TiO2 was higher than that of TiO2 and P25. To explain this phenomenon, photoluminescence spectra (PL) were employed under the excitation of light of the same wavelength (254 nm) as the degradation experiment (Figure 11). The main peak positions of all catalysts were the same, distributed at 400, 414, 442, 455 and 471 nm, and no new emission peaks appeared at the PL of Fe-TiO2. The peak at 400 nm corresponds to the recombination of electrons and holes of TiO2; the other peaks were probably produced by oxygen vacancies or band edge free excitons [46,47]. The peak intensity of Fe-TiO2 at 400 nm is obviously weakened, which shows that the doping of iron has an obvious inhibitory effect on the recombination of electrons and holes. The weakening trend of peak intensity is completely consistent with the degradation at different catalysts, which shows that the doping of Fe3+ has an optimum concentration and that 1% Fe may be the optimal doping concentration. The doping level was insufficient at 0.5%Fe-TiO2, and Fe3+ may become the recombination center of electrons and holes, leading to reduced catalytic performance, because of the high iron content at 5%Fe-TiO2.
Figure 12 shows a possible mechanism of photocatalytic enhancement. It has been shown that the iron in Fe-TiO2 exists in the form of Fe3+ and maintains a highly uniform distribution, while the radius of Fe3+ is close to that of Ti4+, which is conducive to the formation of uniform substitution doping into the lattice [22], resulting in a doping level with low width. The generation of this energy level leads to the red shift of light absorption. At the same time, Fe3+ exhibits a transformation of Fe3+→Fe4+ and Fe3+→Fe2+, which can capture and transfer photogenerated electrons and holes, respectively [22,36,46]. The recombination of them is prevented, which improves the quantum efficiency, which is consistent with the results shown by PL spectra.

4. Conclusions

In summary, a high-gravity precipitation method for the synthesis of nano-TiO2 was developed in this work. Through the exploration of the synthesis process, TiO2 with anatase crystals, smaller particle sizes, better dispersion and average particle sizes of 12.5 nm was obtained in IS-RPB. When the calcination temperature was 500 °C, nano-TiO2 had a better anatase crystal and maintained a smaller particle size. At the same time, Fe-TiO2 was synthesized in situ for the degradation of toluene as a VOC. The results show that the Fe-TiO2 anatase phase remains intact, and the variation of the Raman peak width and intensity shows evidence of the existence of iron. XPS and EDX mapping shows that iron was uniformly distributed in TiO2 and exists in the positive trivalent form. When the Fe3+ was increased from 0.5% to 5.0%, the band gap energy of the catalyst was reduced from 3.06 eV in undoped Fe to 2.86 eV and 2.26 eV. Fe3+ not only broadens the photoresponse range but also effectively suppresses the recombination of the electron and hole. As a result, the catalytic activity was enhanced. The degradation rate of 1.0%Fe-TiO2 to toluene of 105 ppm reached 95.7% after 4 h under UV light.

Author Contributions

G.Z. performed the experiments; G.Z., Q.Z. designed the experiments; Q.Z., Y.L. supervised the project; Q.Z., Y.L., J.G contributed materials/reagents/analysis tools; G.Z. wrote the paper; S.Z., J.G acquired the funding. The manuscript was revised based on the comments of all authors. All authors have approved the final version of the manuscript.

Funding

This research was funded by the National Natural Science Foundation of China grant number 21808214.

Acknowledgments

The work was supported by the National Natural Science Foundation of China (21808214).

Conflicts of Interest

The authors declare no conflict of interest.

References

  1. Humayun, M.; Raziq, F.; Khan, A.; Luo, W. Modification Strategies of TiO2 for Potential Applications in Photocatalysis: A Critical Review. Green Chem. Lett. Rev. 2018, 11, 86–102. [Google Scholar] [CrossRef]
  2. Yu, H.T.; Song, L.; Hao, Y.F.; Lu, N.; Quan, X.; Chen, S.; Zhang, Y.B.; Feng, Y.J. Fabrication of Pilot-Scale Photocatalytic Disinfection Device by Installing TiO2 Coated Helical Support into UV Annular Reactor for Strengthening Sterilization. Chem. Eng. J. 2016, 283, 1506–1513. [Google Scholar] [CrossRef]
  3. Beltrán-Partidaab, E.; Valdez-Salasb, B.; Escamillab, A.; Curielb, M.; Valdez-Salasc, E.; Nedevb, N.; Bastidasd, J.M. Disinfection of Titanium Dioxide Nanotubes using Super-Oxidized Water Decrease Bacterial Viability without Disrupting Osteoblast Behavior. Mater. Sci. Eng. C Mater. Biol. Appl. 2016, 60, 239–245. [Google Scholar] [CrossRef] [PubMed]
  4. Wang, C.; Liu, H.; Liu, Y.; He, G.A.; Jiang, C.C. Comparative Activity of TiO2 Microspheres and P25 Powder for Organic Degradation: Implicative Importance of Structural Defects and Organic Adsorption. Appl. Surf. Sci. 2014, 319, 2–7. [Google Scholar] [CrossRef]
  5. Lyu, J.; Zhu, L.Z.; Burda, C. Optimizing Nanoscale TiO2 for Adsorption-Enhanced Photocatalytic Degradation of Low-Concentration Air Pollutants. ChemCatChem 2013, 5, 3114–3123. [Google Scholar] [CrossRef]
  6. Cha, B.J.; Saqlaina, S.; Seob, H.O.; Kim, Y.D. Hydrophilic Surface Modification of TiO2 to Produce a Highly Sustainable Photocatalyst for Outdoor Air Purification. Appl. Surf. Sci. 2019, 479, 31–38. [Google Scholar] [CrossRef]
  7. Kovalevskiyab, N.S.; Lyulyukinab, M.N.; Selishchevabet, D.S.; Kozlovabal, D.V. Analysis of Air Photocatalytic Purification using a Total Hazard Index: Effect of the Composite TiO2/Zeolite Photocatalyst. J. Hazard. Mater. 2018, 358, 302–309. [Google Scholar] [CrossRef]
  8. Khalilzadeh, H.; Fatemi, S. Spouted Bed Reactor for VOC Removal by Modified Nano-TiO2 Photocatalytic Particles. Chem. Eng. Res. Des. 2016, 115, 241–250. [Google Scholar] [CrossRef]
  9. Cui, M.F.; Pan, S.; Tang, Z.; Chen, X.; Qiao, X.; Xu, Q. Physiochemical Properties of N-N Heterostructured TiO2/Mo-TiO2 Composites and Their Photocatalytic Degradation of Gaseous Toluene. Chem. Speciat. Bioavailab. 2017, 29, 60–69. [Google Scholar] [CrossRef]
  10. Daghrir, R.; Drogui, P.; Robert, D. Photoelectrocatalytic Technologies for Environmental Applications. J. Photochem. Photobiol. A. 2012, 238, 41–52. [Google Scholar] [CrossRef]
  11. Xiang, J.; Yin, Q.; Zhang, K.; Guo, X.; Wang, X. Fabrication, Structural Morphology and Photocatalytic Activity of Mesoporous TiO2 Prepared by Fast Sol-Gel Method. Mater. Technol. 2014, 30, 213–217. [Google Scholar] [CrossRef]
  12. Jang, I.; Leong, H.J.; Noh, H.; Kang, T.; Kong, S.; Oh, S.G. Preparation of N-Functionalized TiO2 Particles using One-step Sol-Gel Method and Their Photocatalytic Activity. J. Ind. Eng. Chem. 2016, 37, 380–389. [Google Scholar] [CrossRef]
  13. Xiang, Y.; Wen, L.X.; Chu, G.W.; Shao, L.; Xiao, G.T.; Chen, J.F. Modeling of the Precipitation Process in a Rotating Packed Bed and Its Experimental Validation. Chin. J. Chem. Eng. 2010, 18, 249–257. [Google Scholar] [CrossRef]
  14. Yang, H.J.; Chu, G.W.; Xiang, Y.; Chen, J.F. Characterization of Micromixing Efficiency in Rotating Packed Beds by Chemical Methods. Chem. Eng. J. 2006, 121, 147–152. [Google Scholar] [CrossRef]
  15. He, X.L.; Wang, Z.; Pu, Y.; Wang, D.; Tang, R.J.; Cui, S.M.; Wang, J.X.; Chen, J.F. High-Gravity-Assisted Scalable Synthesis of Zirconia Nanodispersion for Light Emitting Diodes Encapsulation with Enhanced Light Extraction Efficiency. Chem. Eng. Sci. 2019, 195, 1–10. [Google Scholar] [CrossRef]
  16. Fan, H.L.; Zhou, S.F.; Qi, G.S.; Liu, Y.Z. Continuous Preparation of Fe3O4 Nanoparticles using Impinging Stream-Rotating Packed Bed Reactor and Magnetic Property Thereof. J. Alloy. Compd. 2015, 662, 497–504. [Google Scholar] [CrossRef]
  17. Lin, C.C.; Ho, J.M.; Wu, M.S. Continuous Preparation of Fe3O4 Nanoparticles using a Rotating Packed Bed: Dependence of Size and Magnetic Property on Temperature. Powder Technol. 2015, 274, 441–445. [Google Scholar] [CrossRef]
  18. Sun, Q.; Chen, B.; Wu, X.; Wang, M.; Zhang, C.; Zenf, X.F.; Wang, J.X.; Chen, J.F. Preparation of Transparent Suspension of Lamellar Magnesium Hydroxide Nanocrystals Using a High-Gravity Reactive Precipitation Combined with Surface Modification. Ind. Eng. Chem. Res. 2015, 54, 666–671. [Google Scholar] [CrossRef]
  19. Zhao, Z.J.; Wang, Z.Y.; Wang, D.; Wang, J.X.; Fosterac, N.R.; Pu, Y.; Chen, J.F. Preparation of 3D Graphene/Iron Oxides Aerogels Based on High-Gravity Intensified Reactive Precipitation and Their Applications for Photo-Fenton Reaction. Chem. Eng. Process. 2018, 129, 77–83. [Google Scholar] [CrossRef]
  20. Fan, H.L.; Ma, X.Z.; Zhou, S.F.; Huang, J.; Liu, Y.Q.; Liu, Y.Z. Highly Efficient Removal of Heavy Metal Ions by Carboxymethyl Cellulose-Immobilized Fe3O4 Nanoparticles Prepared via High-Gravity Technology. Carbohydr. Polym. 2019, 213, 39–49. [Google Scholar] [CrossRef]
  21. Mittal, A.; Mari, B.; Sharma, S.; Kumari, V.; Maken, S.; Kumari, K.; Kumar, N. Non-Metal Modified TiO2: A Step towards Visible Light Photocatalysis. J. Mater. Sci. Mater. Electron. 2019, 30, 3186–3207. [Google Scholar] [CrossRef]
  22. Shayegan, Z.; Lee, C.S.; Haghighat, F. TiO2 Photocatalyst for Removal of Volatile Organic Compounds in Gas Phase–A Review. Chem. Eng. J. 2018, 334, 2408–2439. [Google Scholar] [CrossRef]
  23. Kumaravel, V.; Mathew, S.; Bartlett, J.; Pillaiab, S.C. Photocatalytic Hydrogen Production using Metal Doped TiO2: A Review of Recent Advances. Appl. Catal. B Environ. 2018, 224, 1021–1064. [Google Scholar] [CrossRef]
  24. Khaki, M.R.D.; Shafeeyan, M.S.; Raman, A.A.A.; Daud, W.M.A.W. Application of Doped Photocatalysts for Organic Pollutant Degradation-A Review. J. Environ. Manage. 2017, 198, 78–94. [Google Scholar] [CrossRef] [PubMed]
  25. Umar, K.; Ibrahim, M.N.M.; Ahmad, A.; Rafatullah, M. Synthesis of Mn-Doped TiO2 by Novel Route and Photocatalytic Mineralization/Intermediate Studies of Organic Pollutants. Res. Chem. Intermed. 2019, 45, 2927–2945. [Google Scholar] [CrossRef]
  26. Jiao, W.Z.; Liu, Y.Z.; Qi, G.S. A New Impinging Stream-Rotating Packed Bed Reactor for Improvement of Micromixing Iodide and Iodate. Chem. Eng. J. 2010, 157, 168–173. [Google Scholar] [CrossRef]
  27. Jiao, W.Z.; Wang, Y.; Li, X.; Xu, C.; Liu, Y.Z.; Zhang, Q.L. Stabilization Performance of Methanol-Diesel Emulsified Fuel Prepared using an Impinging Stream-Rotating Packed Bed. Renew. Energy 2016, 85, 573–579. [Google Scholar] [CrossRef]
  28. Shin, S.H.; Jo, W.K. Volatile Organic Compound Concentrations in Newly Built Apartment Buildings during Pre- and Post-Occupancy Stages. Int. J. Environ. Anal. Chem. 2014, 94, 356–369. [Google Scholar] [CrossRef]
  29. Jo, W.K.; Choi, S.J. Vehicle Occupants’ Exposure to Aromatic Volatile Organic Compounds while Commuting on an Urban-suburban Route in Korea. J. Air Waste Manag. 1996, 46, 749–754. [Google Scholar] [CrossRef]
  30. Jo, W.K. Purification of Aromatic Hydrocarbons via Fibrous Activated Carbon/Photocatalytic Composite Coupled with UV Light-Emitting Diodes. Environ. Technol. 2013, 34, 1175–1181. [Google Scholar] [CrossRef]
  31. Jo, W.K.; Kang, H.J.; Chun, H.H. Degradation of Gas-Phase Organic Contaminants via Nitrogen-Embedded One-Dimensional Rod-Shaped Titania in a Plug-Flow Reactor. Environ. Technol. 2014, 35, 2132–2139. [Google Scholar] [CrossRef] [PubMed]
  32. Jo, W.K. Coupling of Titania with Multiwall Carbon Nanotubes for Decomposition of Gas-Phase Pollutants under Simulated Indoor Conditions. J. Air Waste Manag. 2013, 63, 963–970. [Google Scholar] [CrossRef]
  33. Jiao, W.Z.; Qin, Y.; Luo, S.; He, Z.; Feng, Z.; Liu, Y.Z. Simultaneous Formation of Nanoscale Zero-Valent Iron and Degradation of Nitrobenzene in Wastewater in an Impinging Stream-Rotating Packed Bed Reactor. Chem. Eng. J. 2017, 321, 564–571. [Google Scholar] [CrossRef]
  34. Bensouici, F.; Bououdina, M.; Dakhel, A.A.; Tala-Ighilaet, R.; Tounanea, M.; Iratnia, A.; Souierd, T.; Liu, S.; Cai, W. Optical, Structural and Photocatalysis Properties of Cu-Doped TiO2 Thin Films. Appl. Surf. Sci. 2017, 395, 110–116. [Google Scholar] [CrossRef]
  35. Sathyaseelan, B.; Manikandan, E.; Lakshmanan, V.; Baskaranf, I.; Sivakumarb, K.; Ladchumananan- dasivamg, R.; Kennedydh, J.; Maazad, M. Structural, Optical and Morphological Properties of Post-Growth Calcined TiO2 Nanopowder for Opto-Electronic Device Application: Ex-Situ Studies. J. Alloy. Compd. 2016, 671, 486–492. [Google Scholar] [CrossRef]
  36. Majeed Khana, M.A.; Siwachb, R.; Kumarb, S.; Alhazaaac, A.N. Role of Fe Doping in Tuning Photocatalytic and Photoelectrochemical Properties of TiO2 for Photodegradation of Methylene Blue. Opt. Laser Technol. 2019, 11, 170–178. [Google Scholar] [CrossRef]
  37. Tayade, R.J.; Kulkarni, R.G.; Jasra, R.V. Photocatalytic Degradation of Aqueous Nitirobenzene by Nanocrystalline TiO2. Ind. Eng. Chem. Res. 2006, 45, 922–927. [Google Scholar] [CrossRef]
  38. Chen, Y.F.; Lee, C.Y.; Yang, M.Y.; Chiu, H.T. The Effect of Calcination Temperature on the Crystallinity of TiO2 Nanopowders. J. Cryst. Growth 2003, 247, 363–370. [Google Scholar] [CrossRef]
  39. Surolia, P.K.; Tayade, R.J.; Jasra, R.V. Effect of Anions on the Photocatalytic Activity of Fe(III) Salts Impregnated TiO2. Ind. Eng. Chem. Res. 2007, 46, 6196–6203. [Google Scholar] [CrossRef]
  40. Isaria, A.A.; Payana, A.; Fattahia, M.; Jorfibc, S.; Kakavandide, B. Photocatalytic Degradation of Rhodamine B and Real Textile Wastewater using Fe-Doped TiO2 Anchored on Reduced Graphene Oxide (Fe-TiO2/rGO): Characterization and Feasibility, Mechanism and Pathway Studies. Appl. Surf. Sci. 2018, 462, 549–564. [Google Scholar] [CrossRef]
  41. Lim, J.H.; Bae, D.; Fong, A. Titanium Dioxide in Food Products: Quantitative Analysis using ICP-MS and Raman Spectroscopy. J. Agric. Food. Chem. 2018, 66, 13533–13540. [Google Scholar] [CrossRef] [PubMed]
  42. Yamashita, T.; Hayes, P. Analysis of XPS Spectra of Fe2+ and Fe3+ Ions in Oxide Materials. Appl. Surf. Sci. 2008, 254, 2441–2449. [Google Scholar] [CrossRef]
  43. Ma, J.; He, H.; Liu, F. Effect of Fe on the Photocatalytic Removal of NOx over Visible Light Responsive Fe/TiO2 Catalysts. Appl. Catal. B Environ. 2015, 179, 21–28. [Google Scholar] [CrossRef]
  44. Hemraj, M.; Yadav, T.V.; Kolekar, S.H.; Pawar, J.S.K. Enhanced Photocatalytic Inactivation of Bacteria on Fe-Containing TiO2 Nanoparticles under Fluorescent Fight. J. Mater. Sci. Mater. Med. 2016, 27, 57. [Google Scholar]
  45. Sun, S.; Ding, J.; Bao, J.; Gao, C.; Qi, Z.; Yang, X.; He, B.; Li, C. Photocatalytic degradation of gaseous toluene on Fe-TiO2 under visible light irradiation: A study on the structure, activity and deactivation mechanism. Appl. Surf. Sci. 2012, 258, 5031–5037. [Google Scholar] [CrossRef]
  46. Meng, H.; Wang, B.; Liu, S.; Jiang, R.; Long, H. Hydrothermal Preparation, Characterization and Photocatalytic Activity of TiO2/Fe–TiO2 Composite Catalysts. Ceram. Int. 2013, 39, 5785–5793. [Google Scholar] [CrossRef]
  47. Ren, L.; Li, Y.; Mao, M.; Lan, L.; Lao, X.; Zhao, X. Significant Improvement in Photocatalytic Activity by Forming Homojunction between Anatase TiO2 Nanosheets and Anatase TiO2 Nanoparticles. Appl. Surf. Sci. 2019, 490, 283–292. [Google Scholar] [CrossRef]
Figure 1. Experimental setup: 1, 2: liquid storage tank; 3: pump; 4: valve; 5: rotormeter; 6: impinging steam-rotating packed bed (IS-RPB); 7: collection tank.
Nanomaterials 09 01173 g001
Figure 2. The self-made quartz reactor.
Nanomaterials 09 01173 g002
Figure 3. SEM images of nano-TiO2 at rotating speeds of the packing of 400 rpm (a,b), 800 rpm (c,d), and 1200 rpm (e,f). TEM images of nano-TiO2 at a rotating speed of the packing of 800 rpm (g).
Nanomaterials 09 01173 g003aNanomaterials 09 01173 g003b
Figure 4. XRD spectra of nano-TiO2 calcined at different temperatures.
Nanomaterials 09 01173 g004
Figure 5. (a) XRD spectra of pure TiO2 and Fe-TiO2; (b) Raman spectra of pure TiO2 and Fe-TiO2.
Nanomaterials 09 01173 g005
Figure 6. XPS spectra of 5%Fe-TiO2 (a) and the high-resolution spectra of Ti2p (b), O1s (c) and Fe2p (d).
Nanomaterials 09 01173 g006
Figure 7. TEM (a) and HRTEM (b,c) images, energy dispersive X-ray (EDX) mapping (d) of 5%Fe-TiO2.
Nanomaterials 09 01173 g007
Figure 8. (a) UV-vis diffused reflectance spectroscopy (DRS) spectra and (b) band gap energies of P25, pure TiO2 and Fe-TiO2.
Nanomaterials 09 01173 g008
Figure 9. N2 adsorption–desorption isotherms and the pore size distributions of photocatalysts.
Nanomaterials 09 01173 g009
Figure 10. Photodegradation of toluene in the control experiment (a), using different catalysts (b), under different initial toluene concentrations (c) and using visible light (d).
Nanomaterials 09 01173 g010aNanomaterials 09 01173 g010b
Figure 11. Photoluminescence (PL) spectra of different catalysts excited by UV light of 254 nm.
Nanomaterials 09 01173 g011
Figure 12. Possible mechanism of photocatalytic enhancement of Fe3+-doping.
Nanomaterials 09 01173 g012
Table 1. Size of nano-TiO2 and crystallinity calculated by XRD (X-ray diffraction).
Temperature (°C)FWHM (°)β’ (rad)XRD Size (nm)Anatase (%)Rutile (%)Crystallinity (%)
P25---77%23%100%
4000.9510.01668.4100%0%70%
5000.8370.01439.6100%0%82%
6000.4880.008516.5100%0%110%
7000.3080.005426.095%5%97%
8000.1630.002850.267%33%81%
Table 2. Surface area, total pore volume and average pore diameter of photocatalysts.
PhotocatalystsSurface Area (m2/g)Total Pore Volume (cm3/g)Average Pore Diameter (nm)
P25105.960.543830.56
TiO2148.470.45089.58
1.0%Fe-TiO2140.180.46439.60
5.0%Fe-TiO2123.500.48139.58

