Improved Catalytic Performance of Au/α-Fe2O3-Like-Worm Catalyst for Low Temperature CO Oxidation

Abstract
:1. Introduction
2. Materials and Methods
2.1. Materials
2.2. Preparation of α-Fe2O3 Support
2.3. Preparation of Au/α-Fe2O3
2.4. Characterization
2.5. CO Oxidation Catalytic Activity
3. Results and Discussion
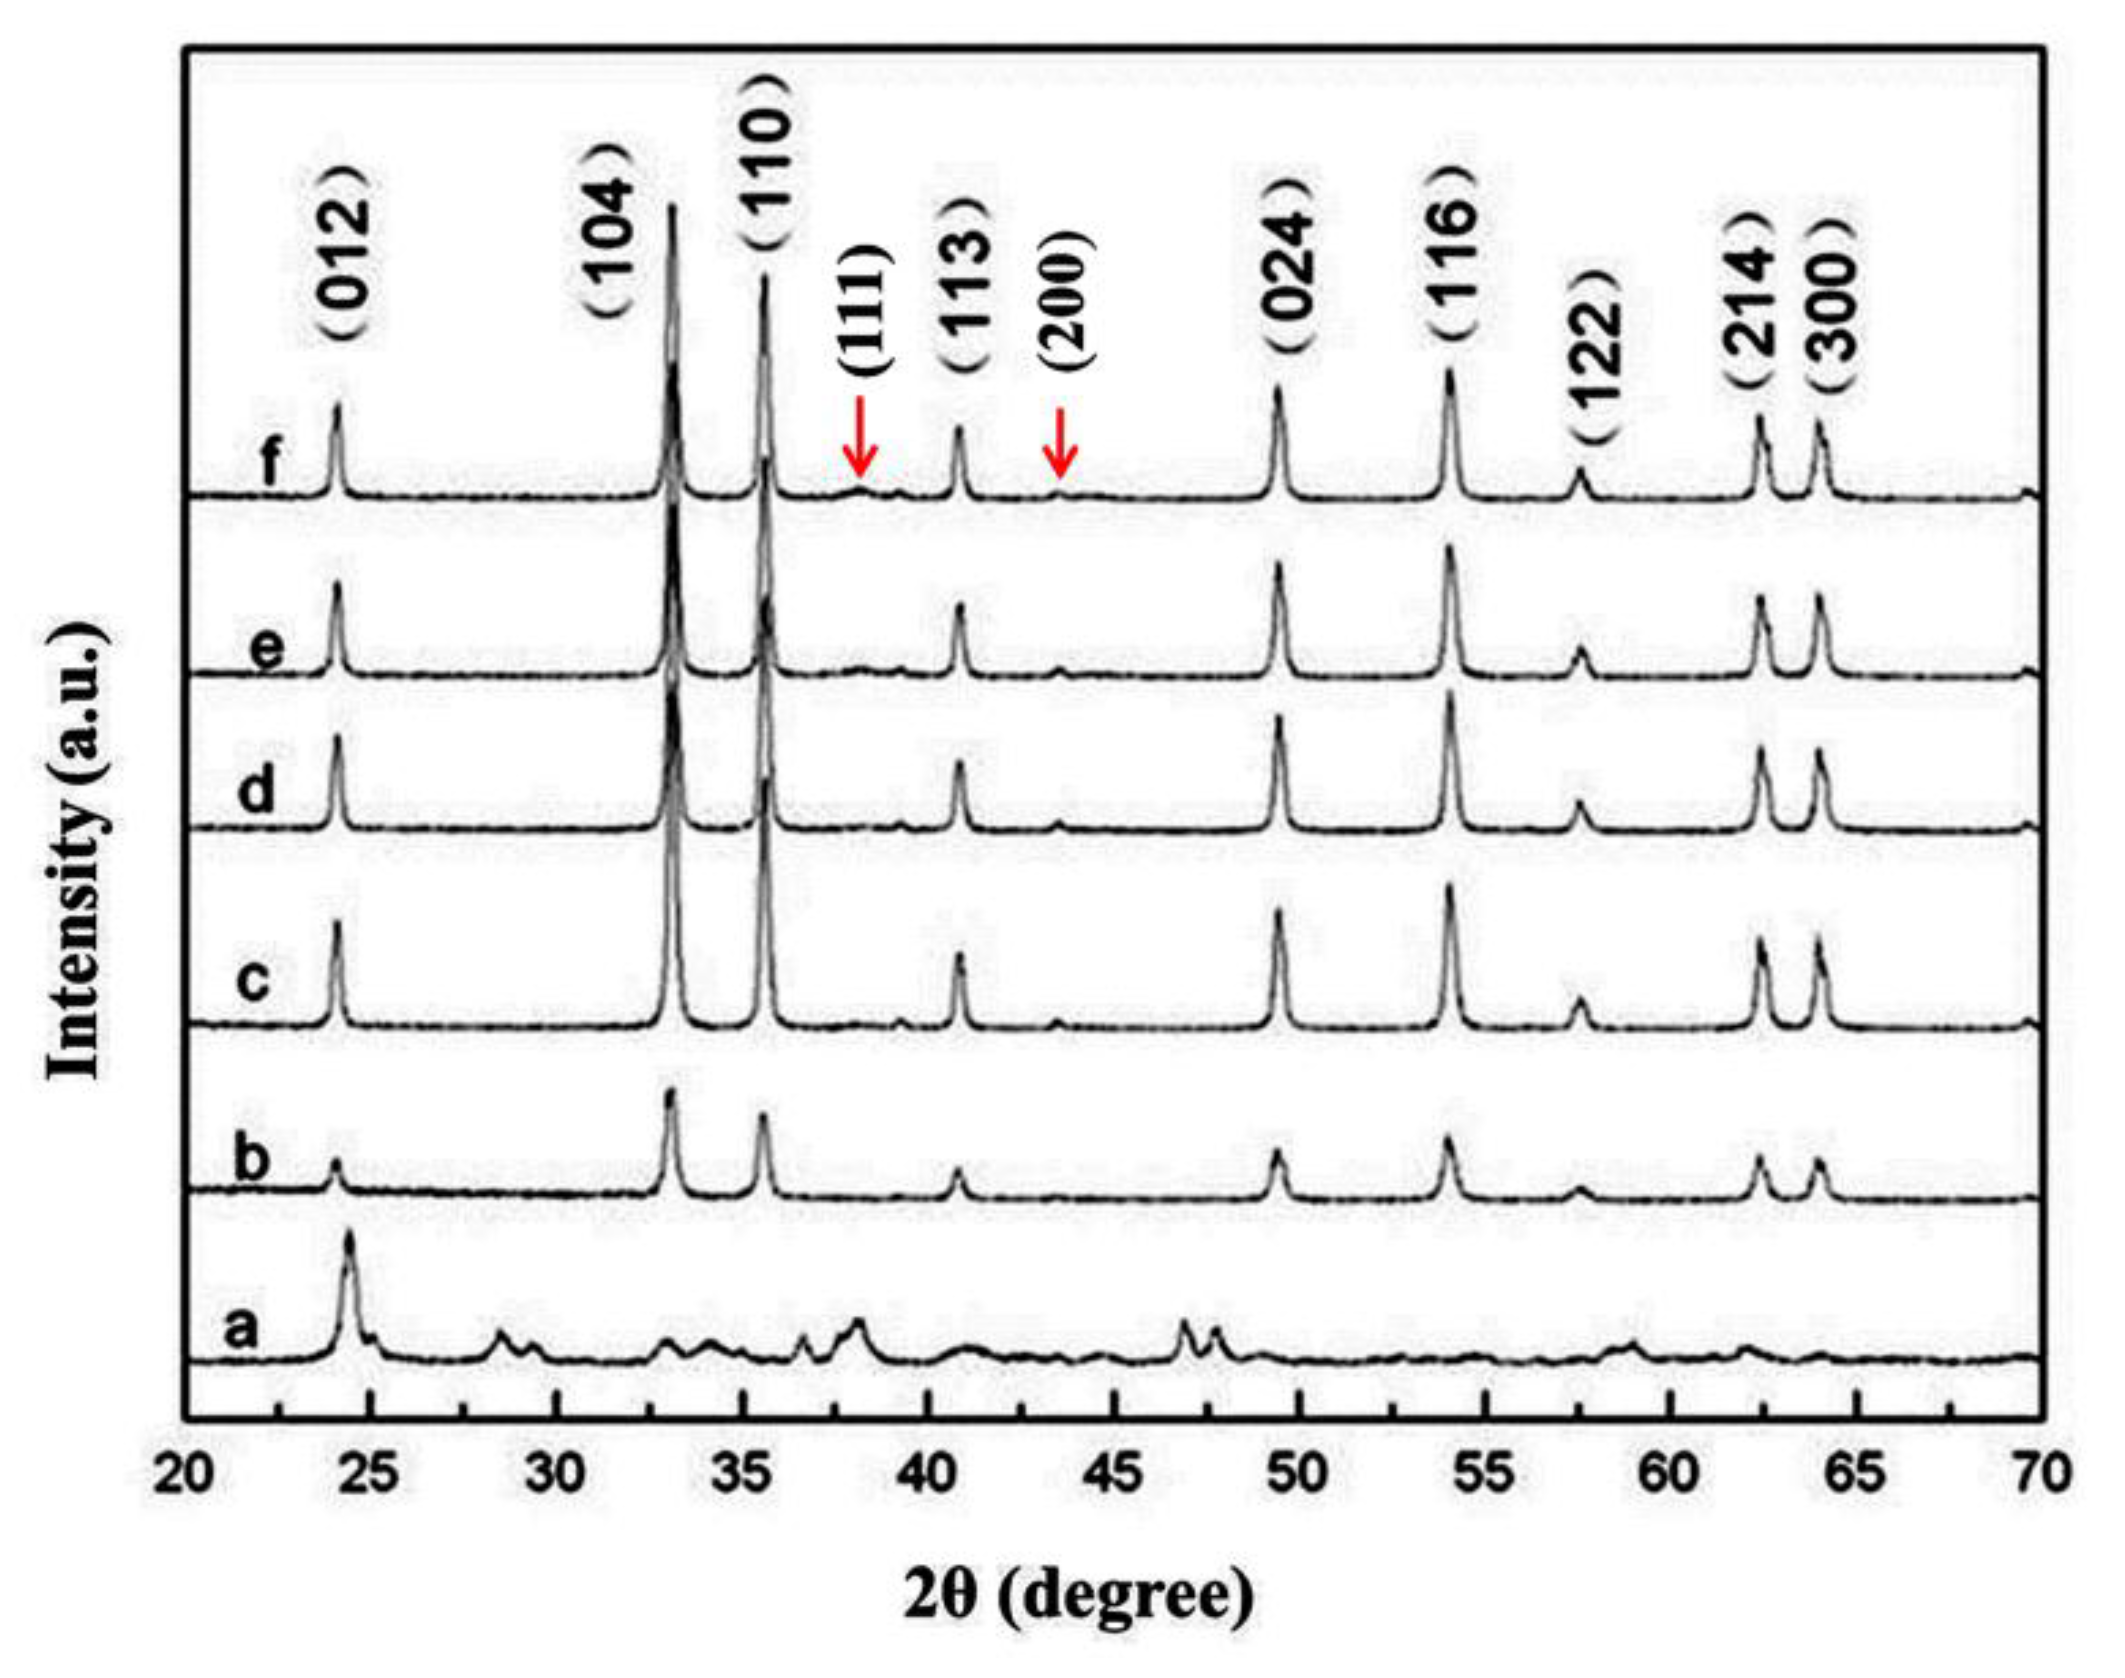
3.1. ICP and XRD
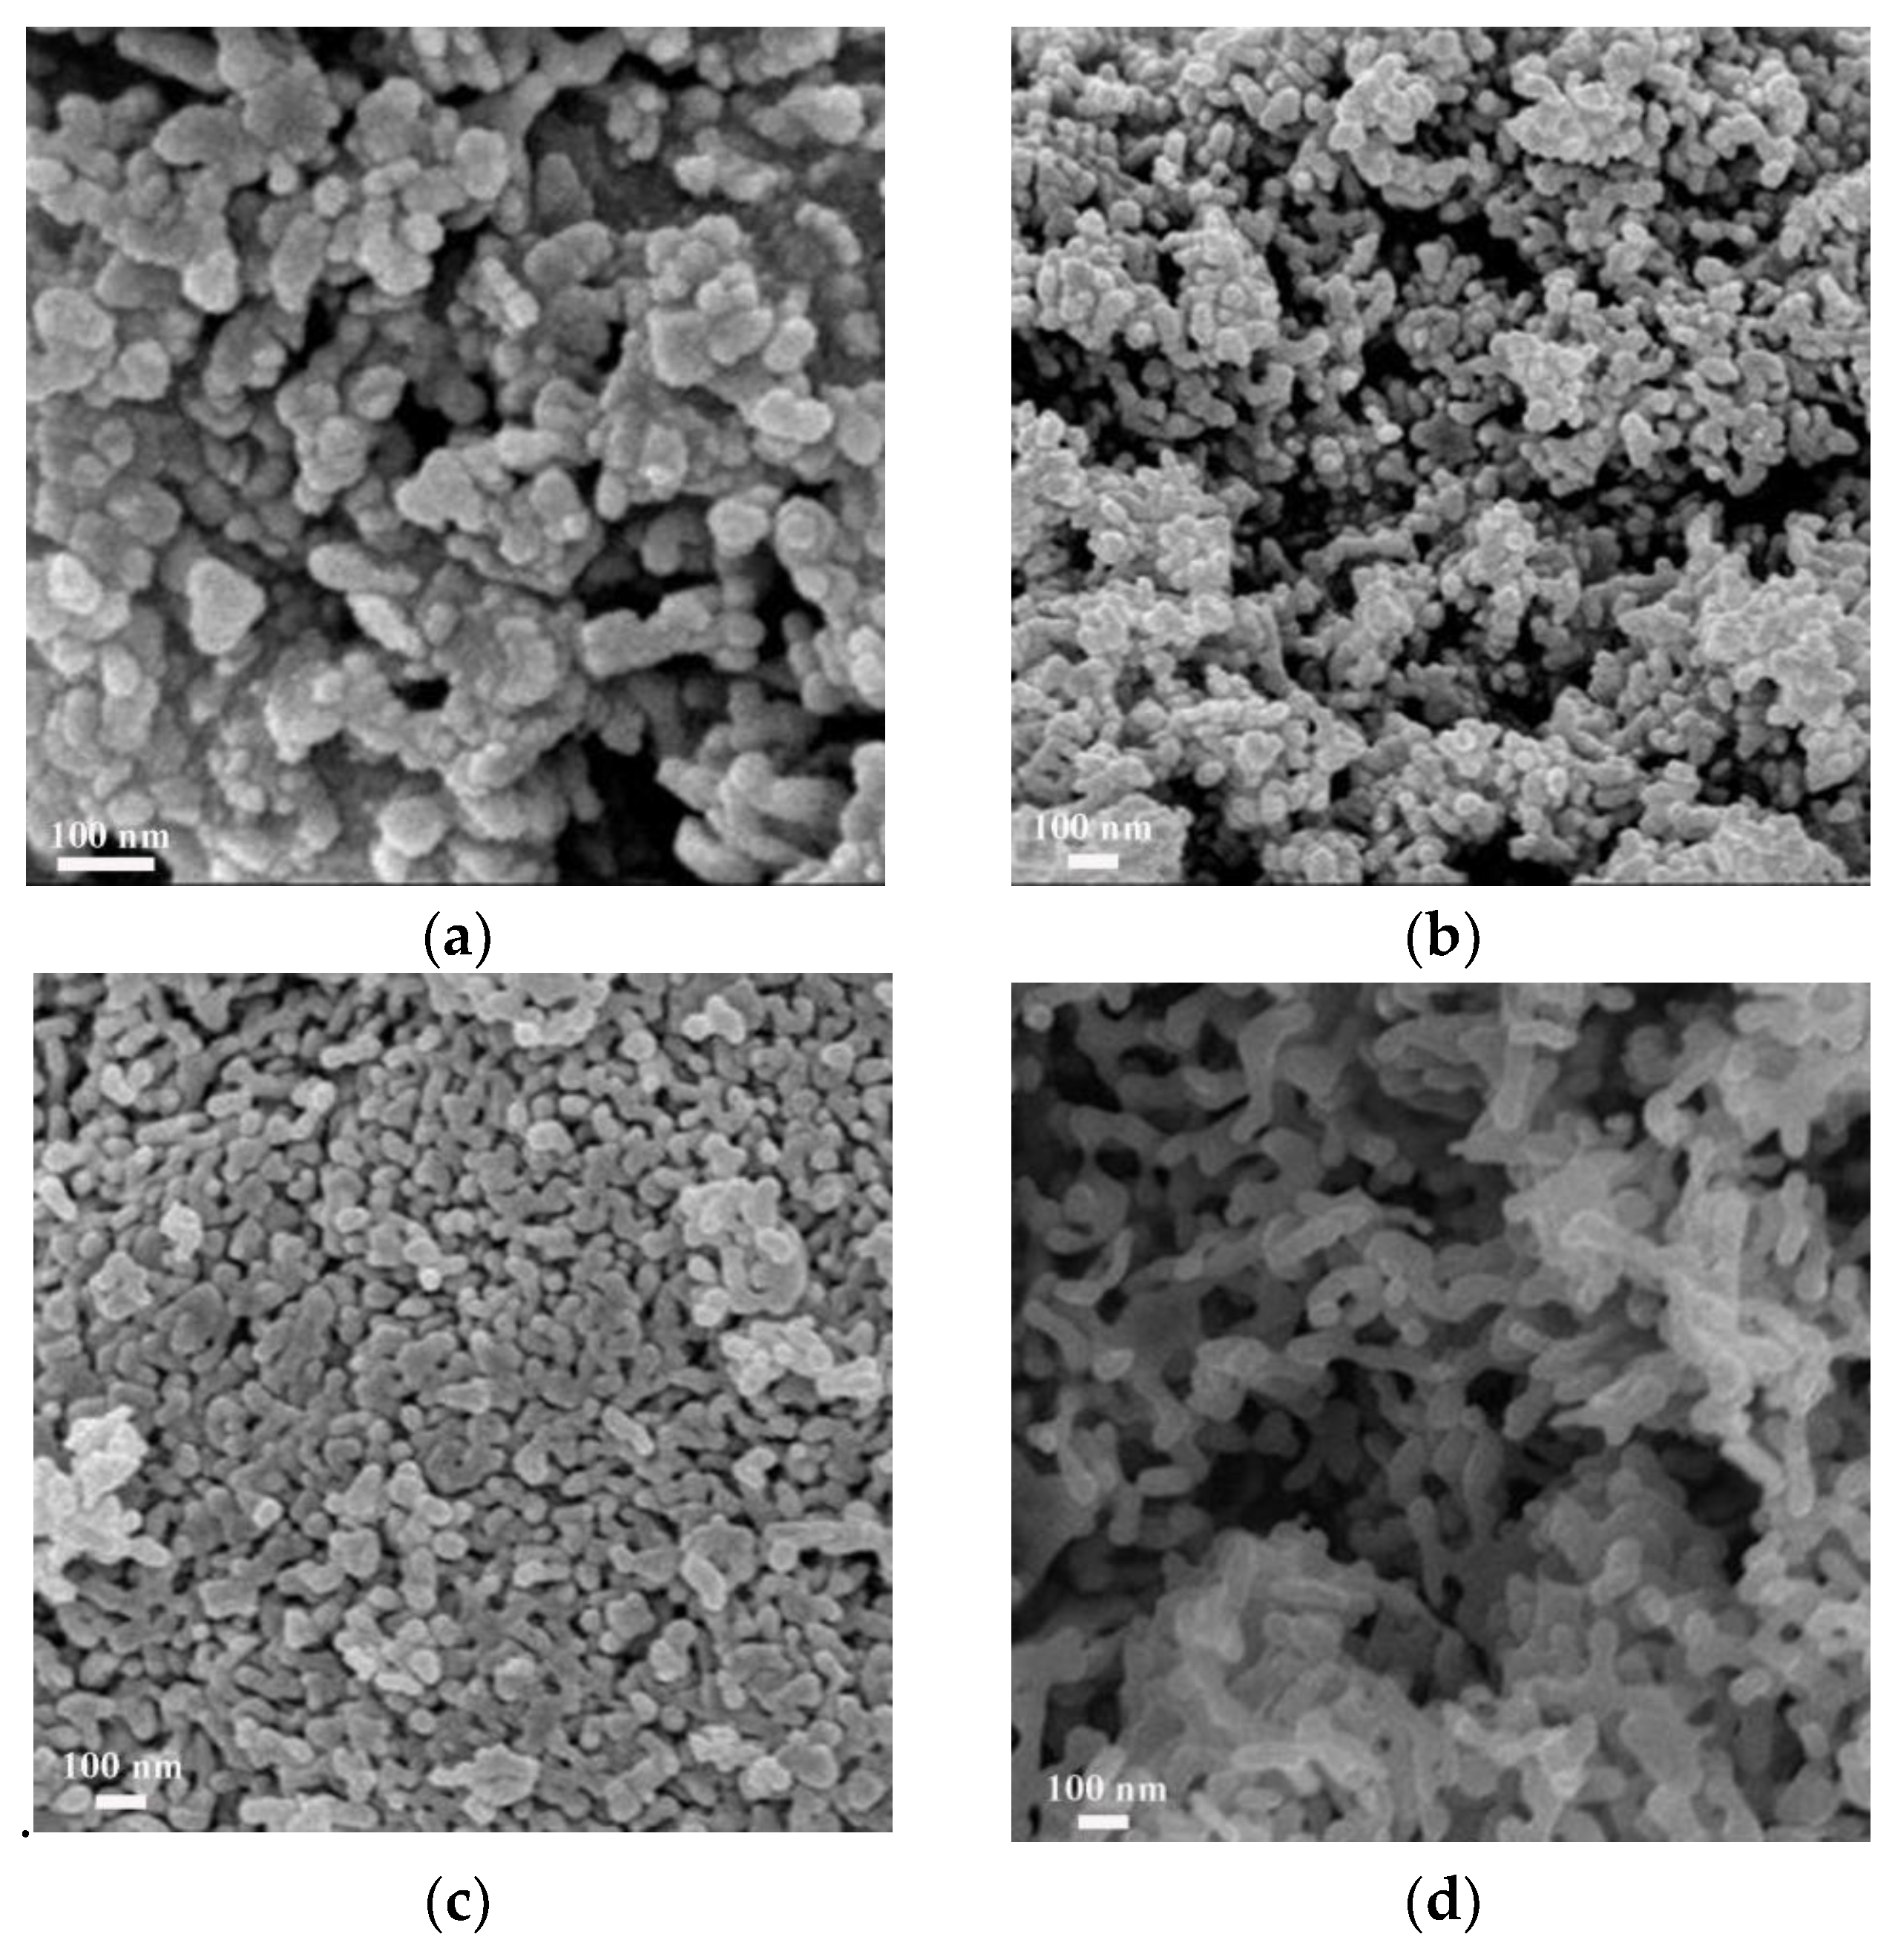
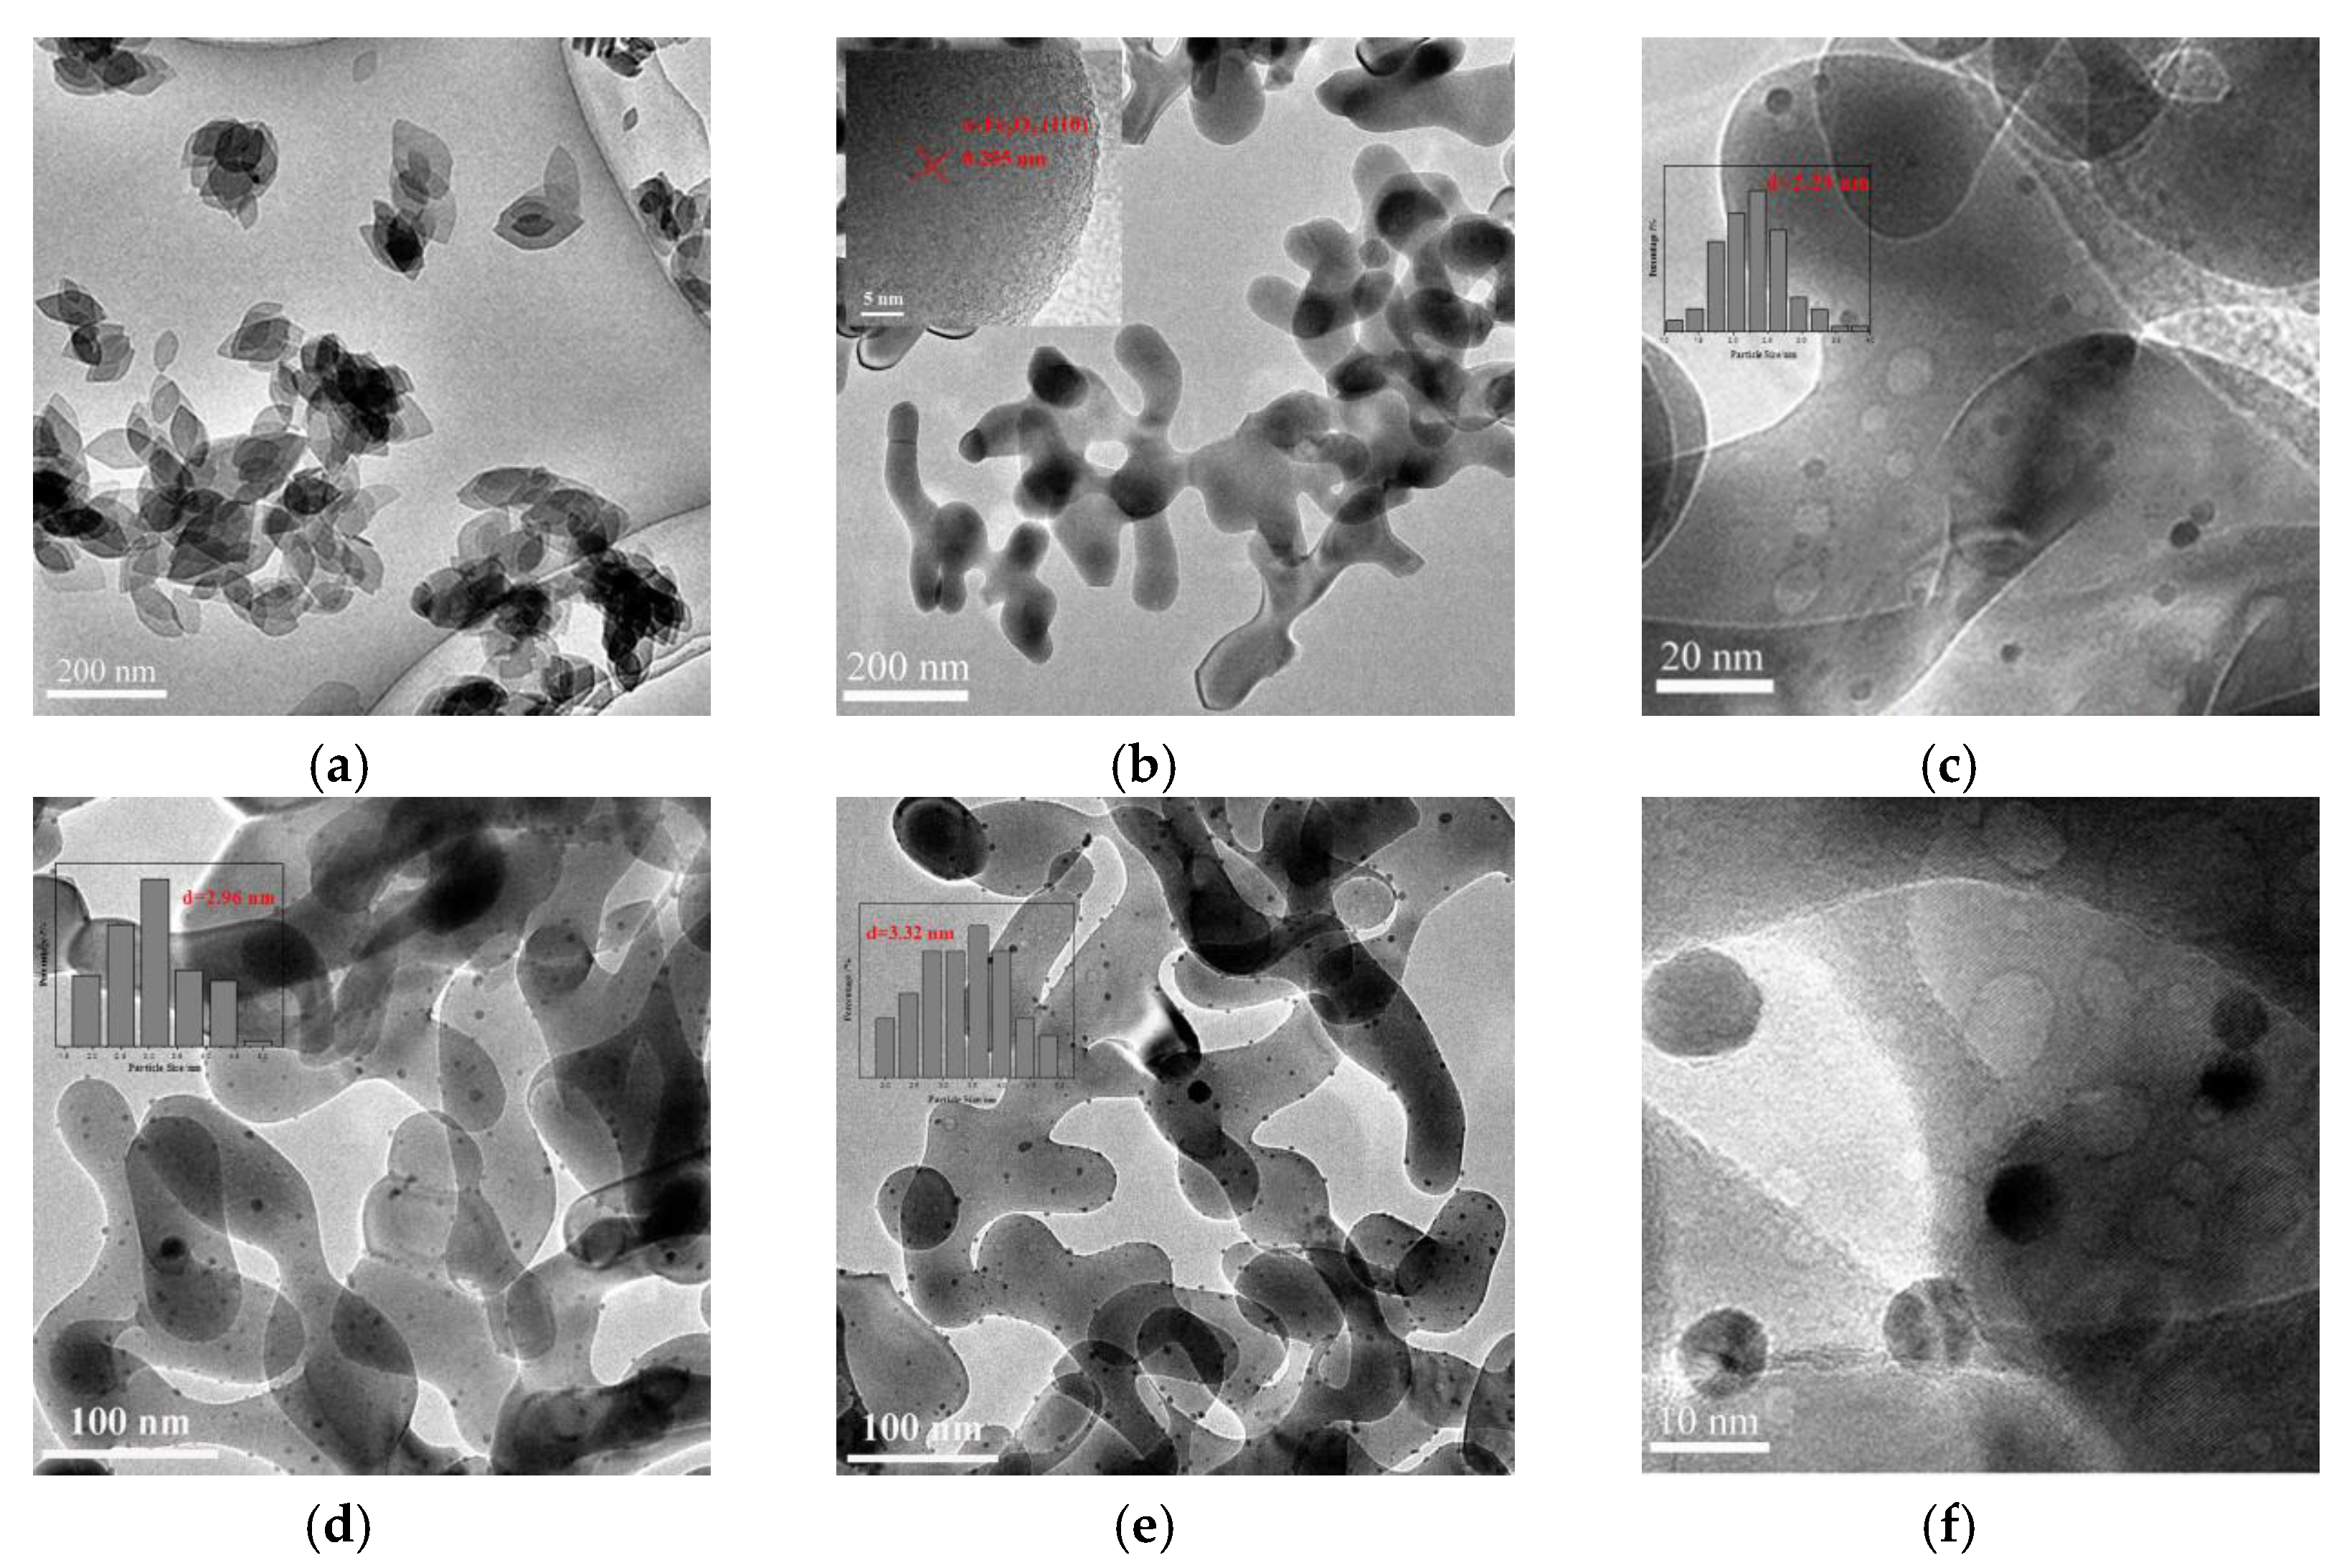
3.2. SEM and TEM
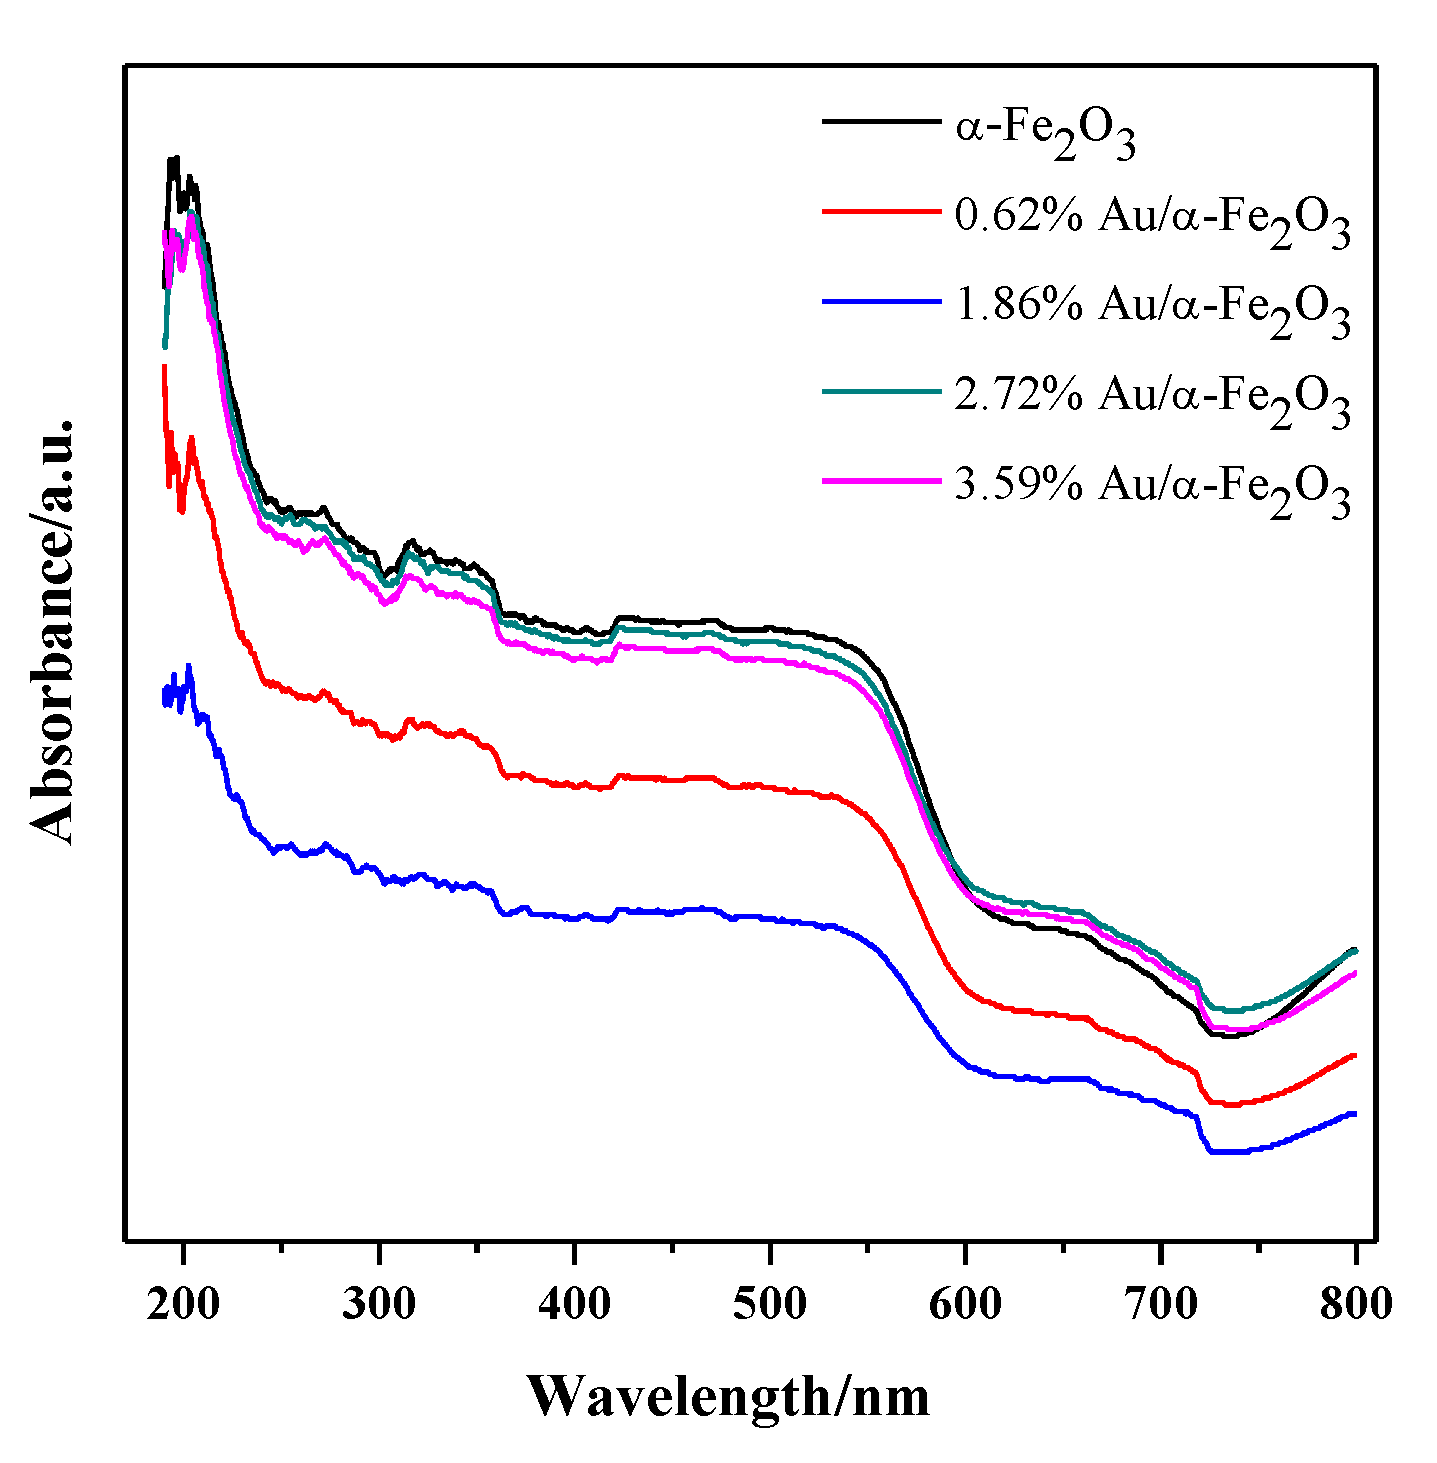
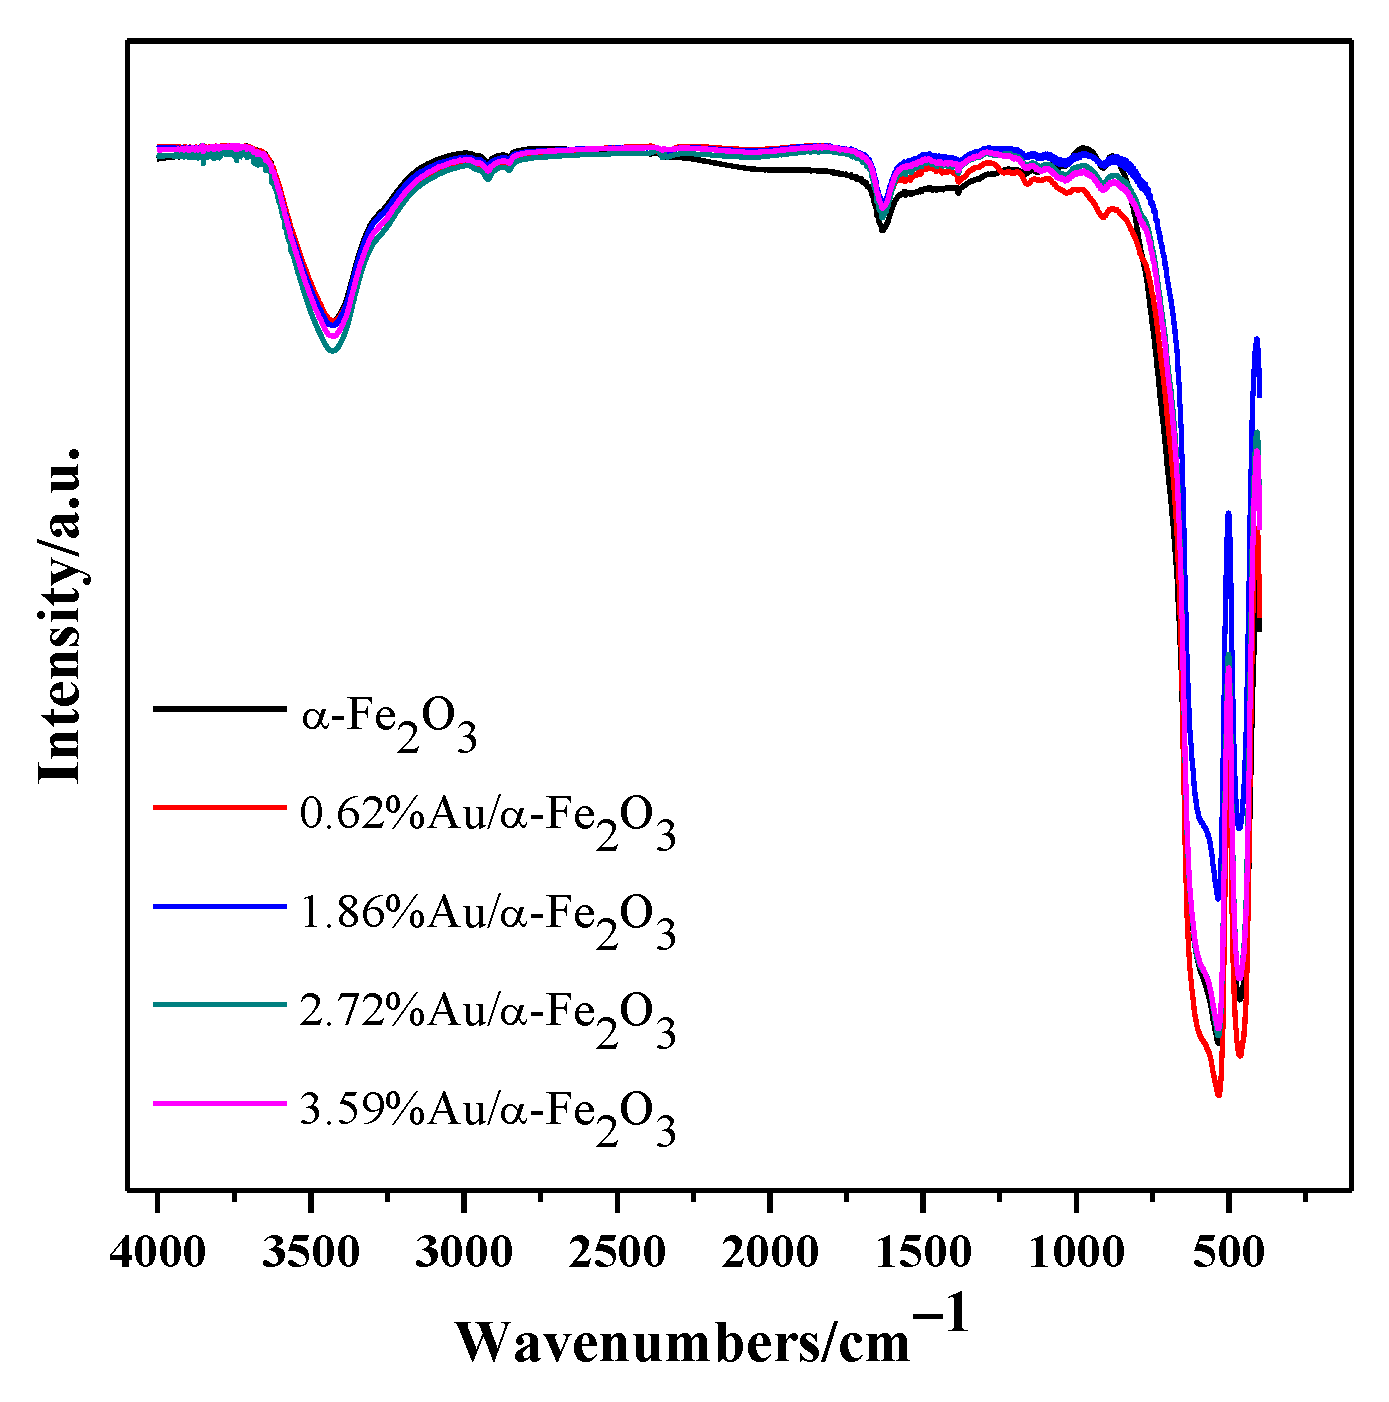
3.3. UV-Vis DRS and FTIR
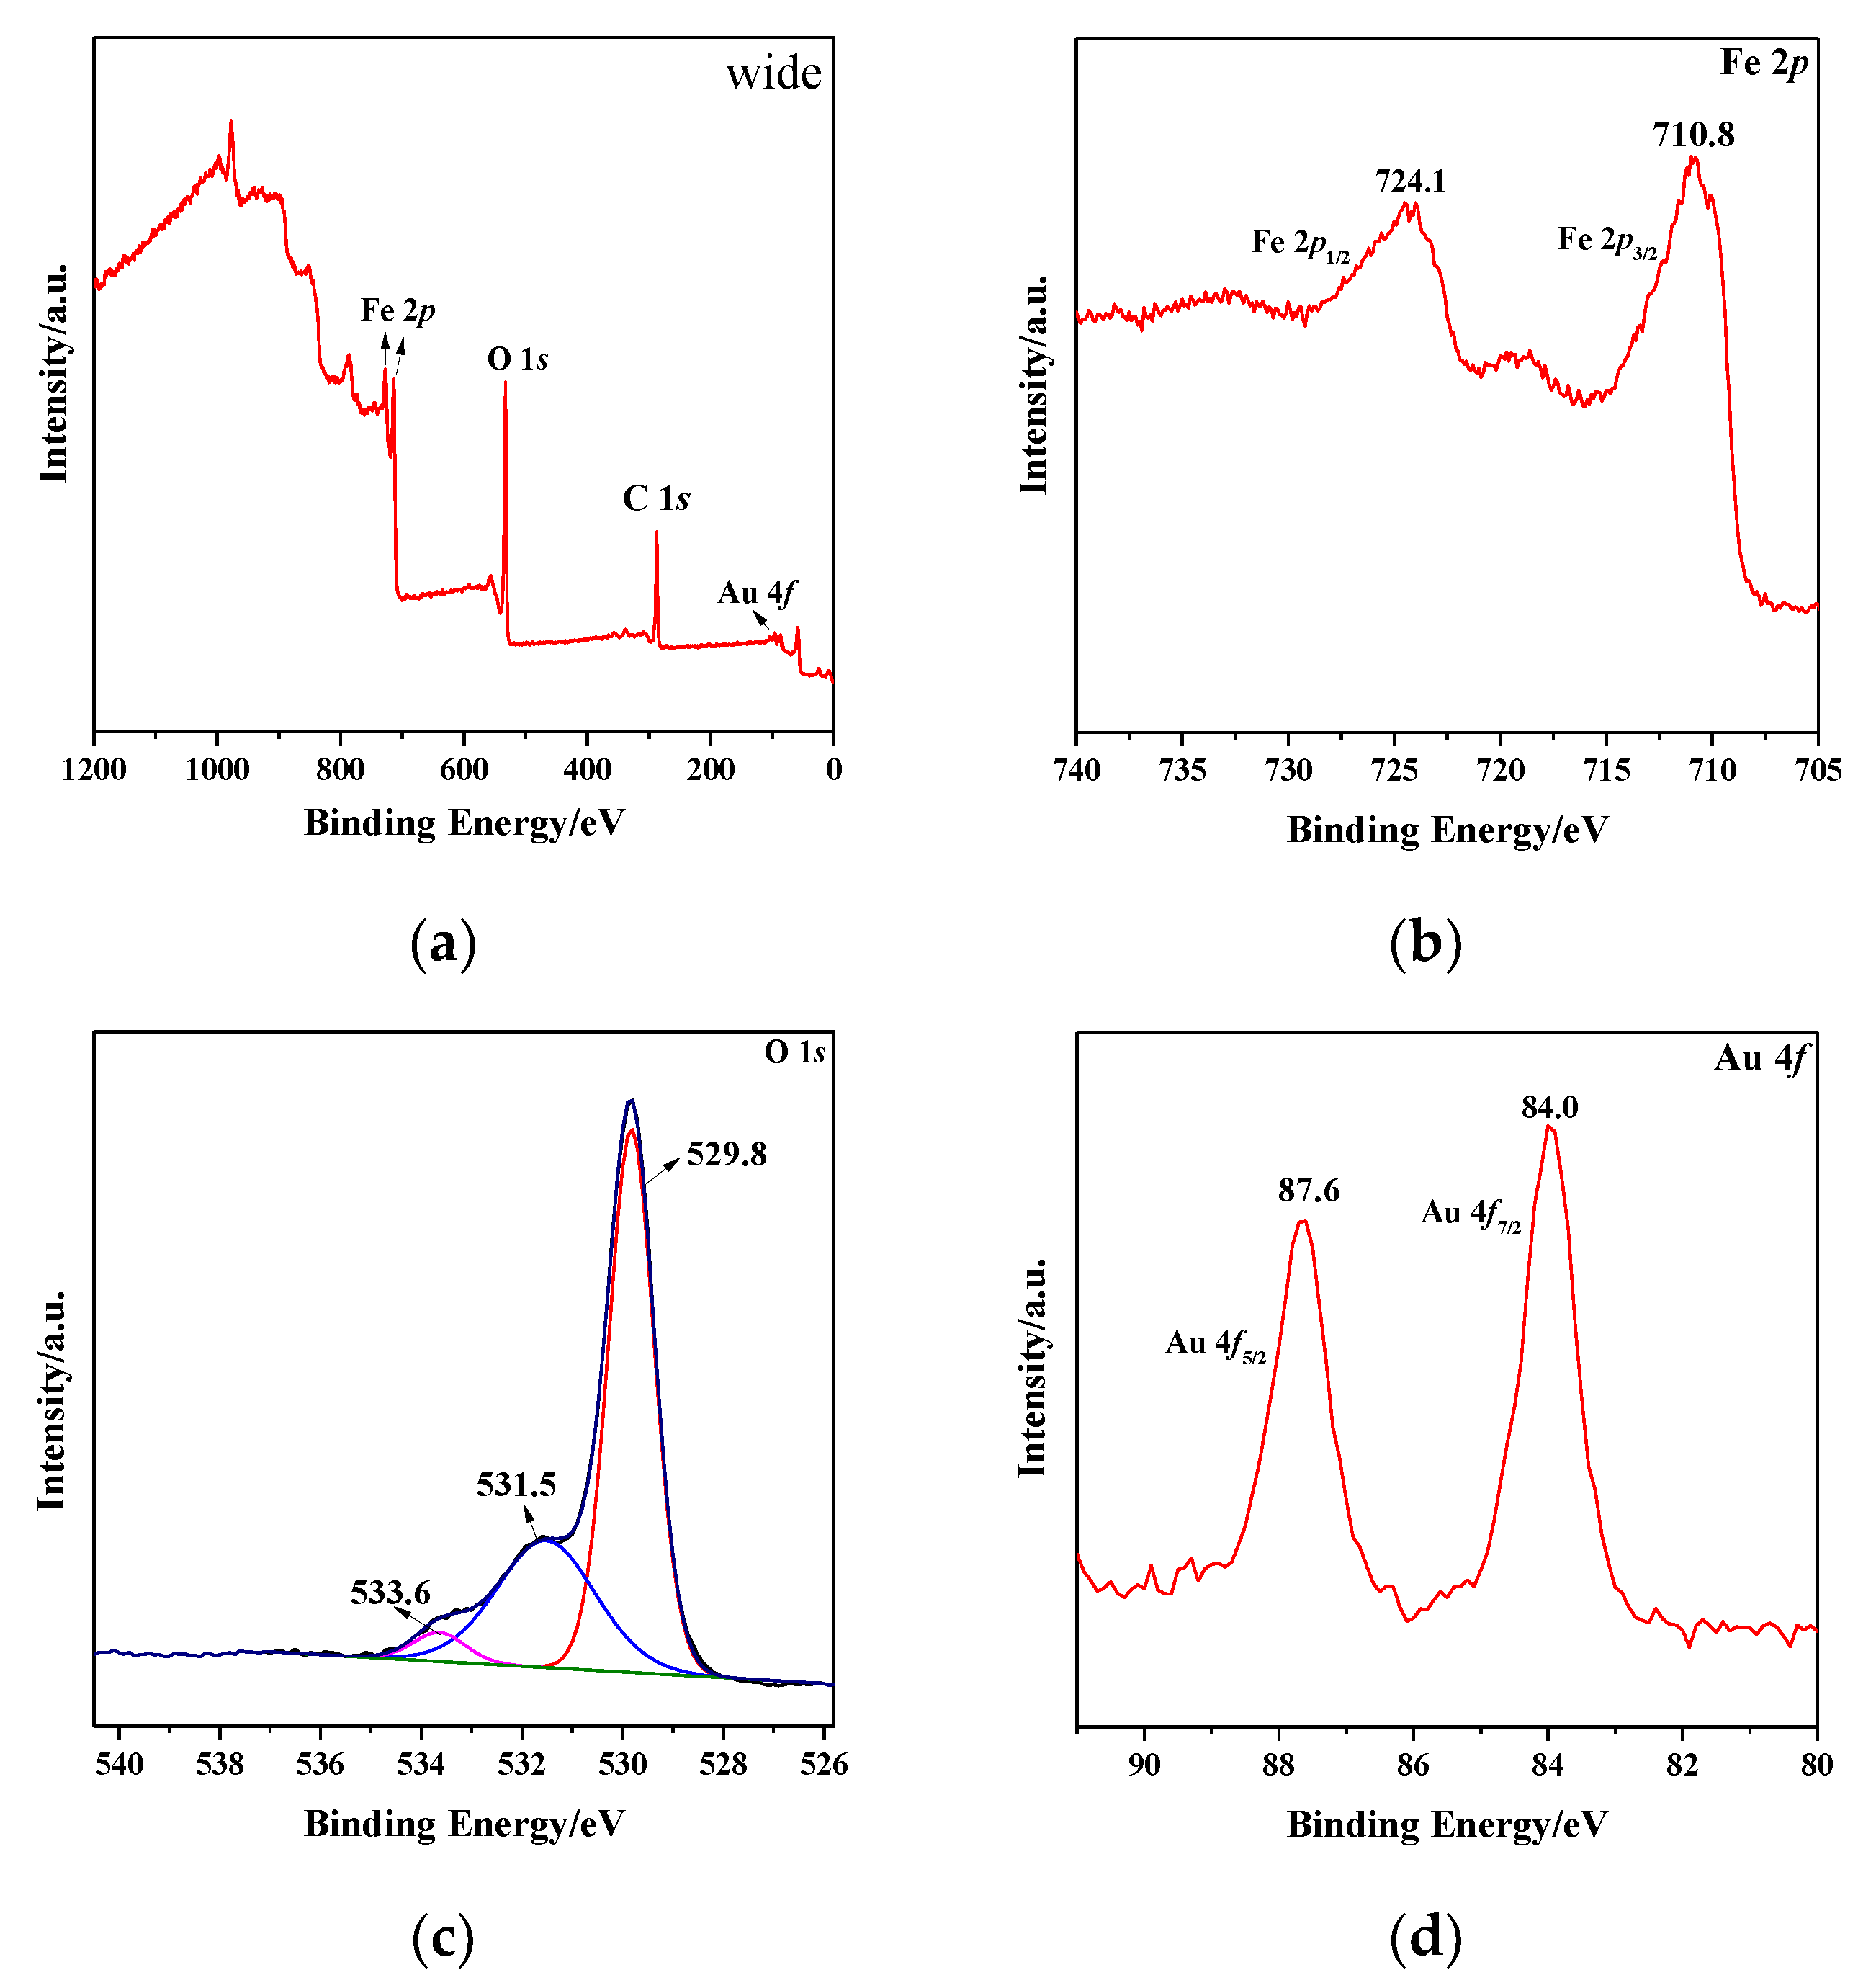
3.4. XPS
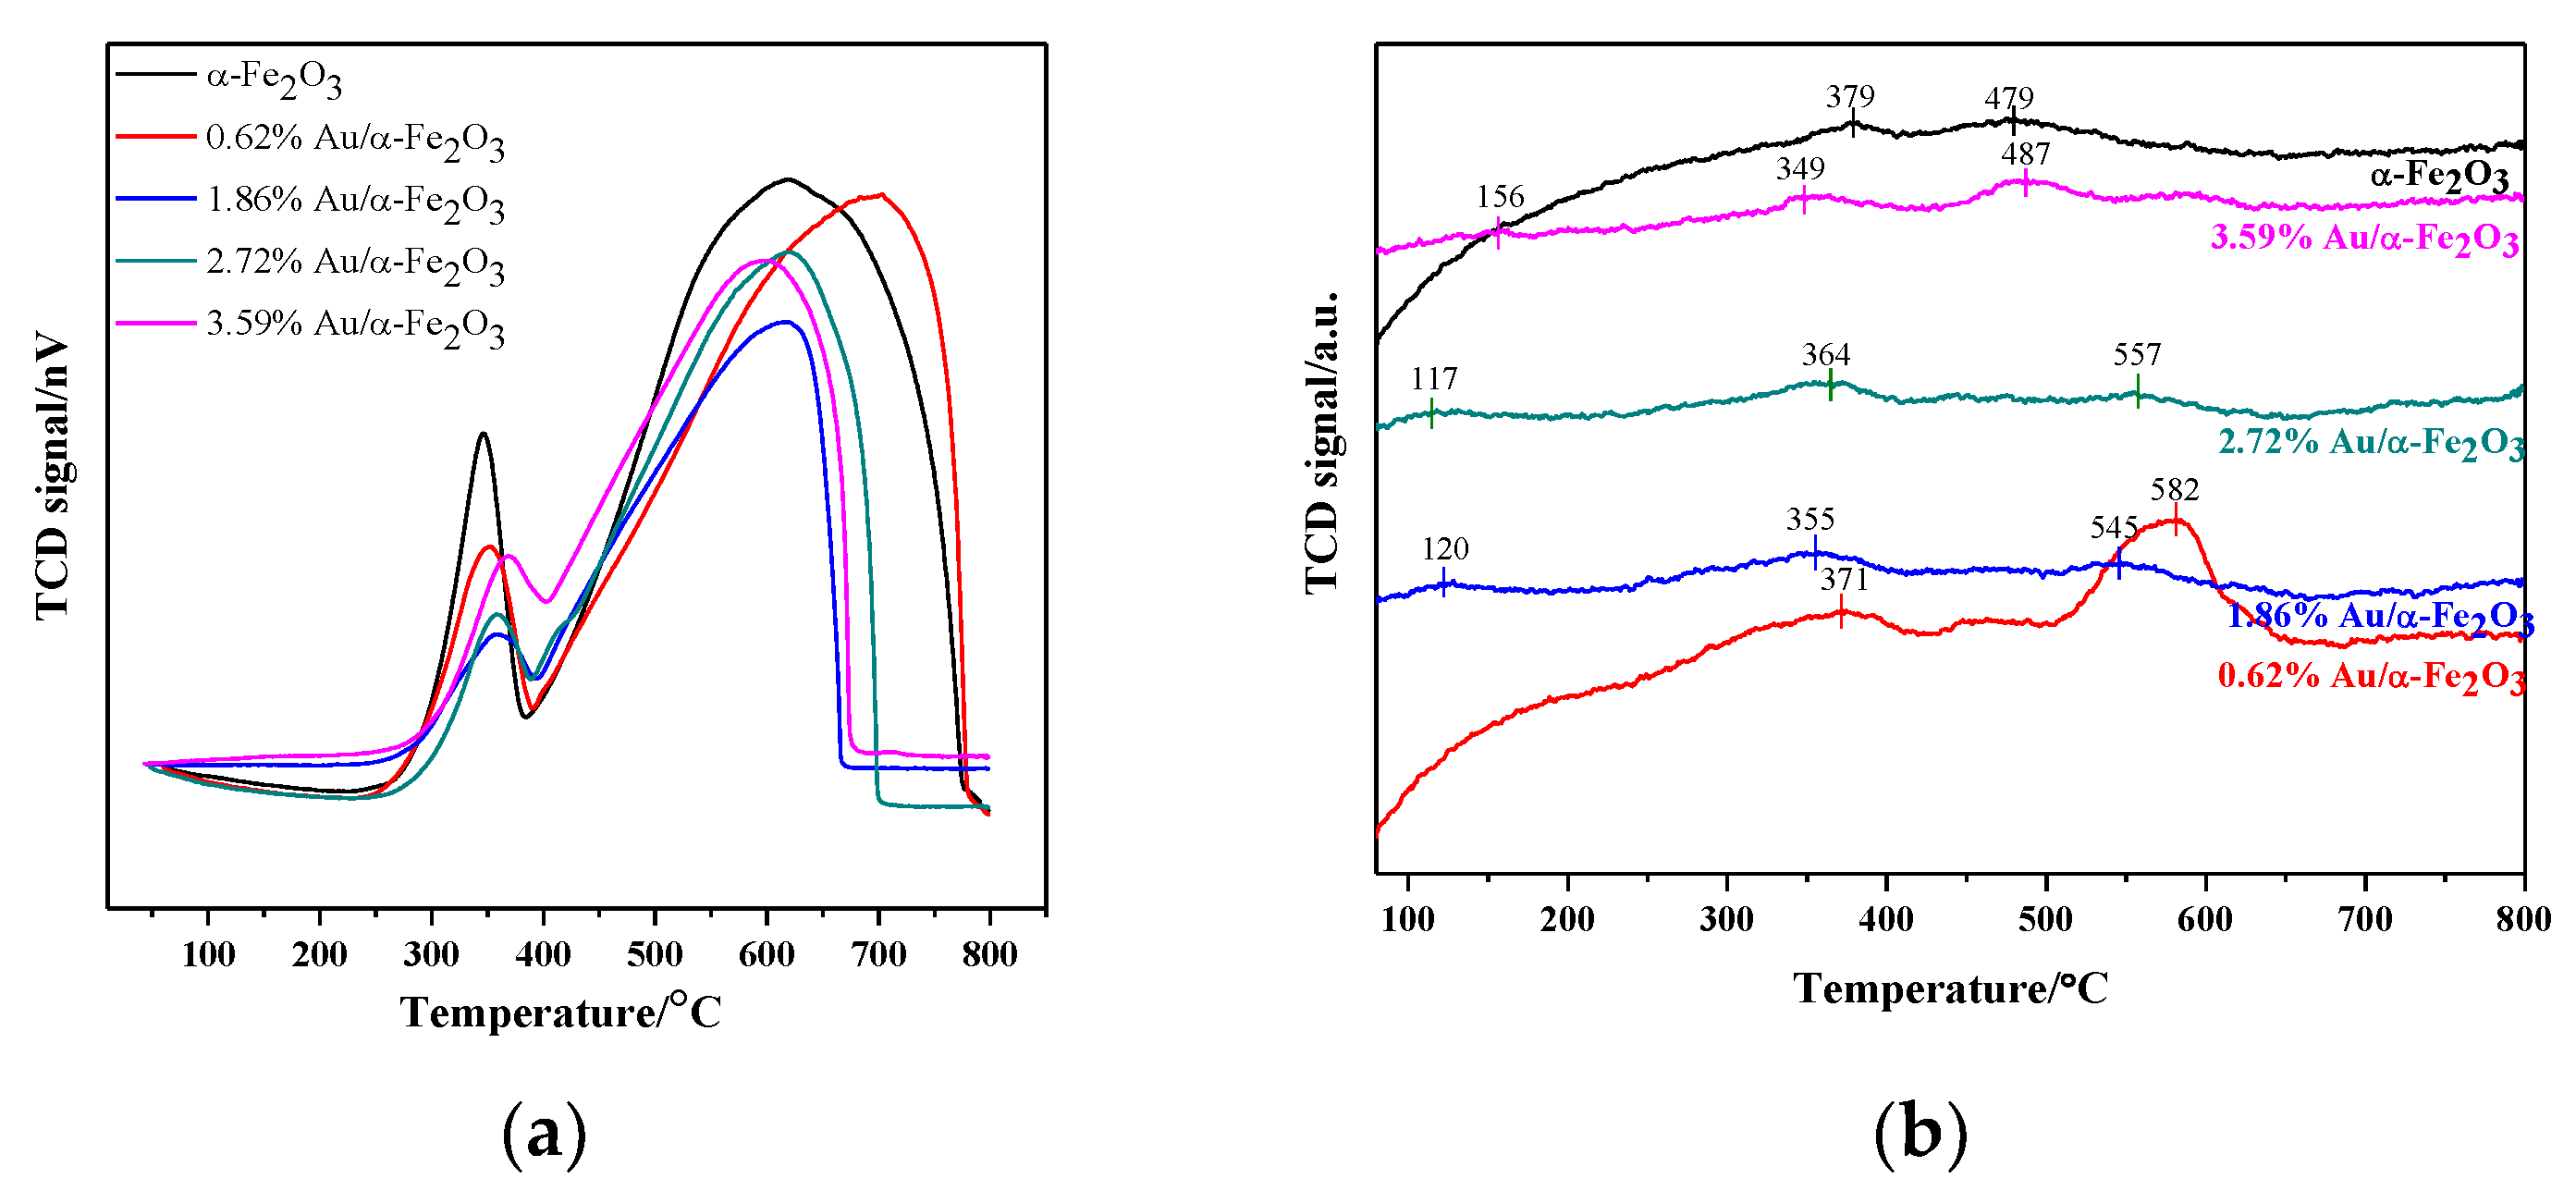
3.5. H2-TPR and NH3-TPD
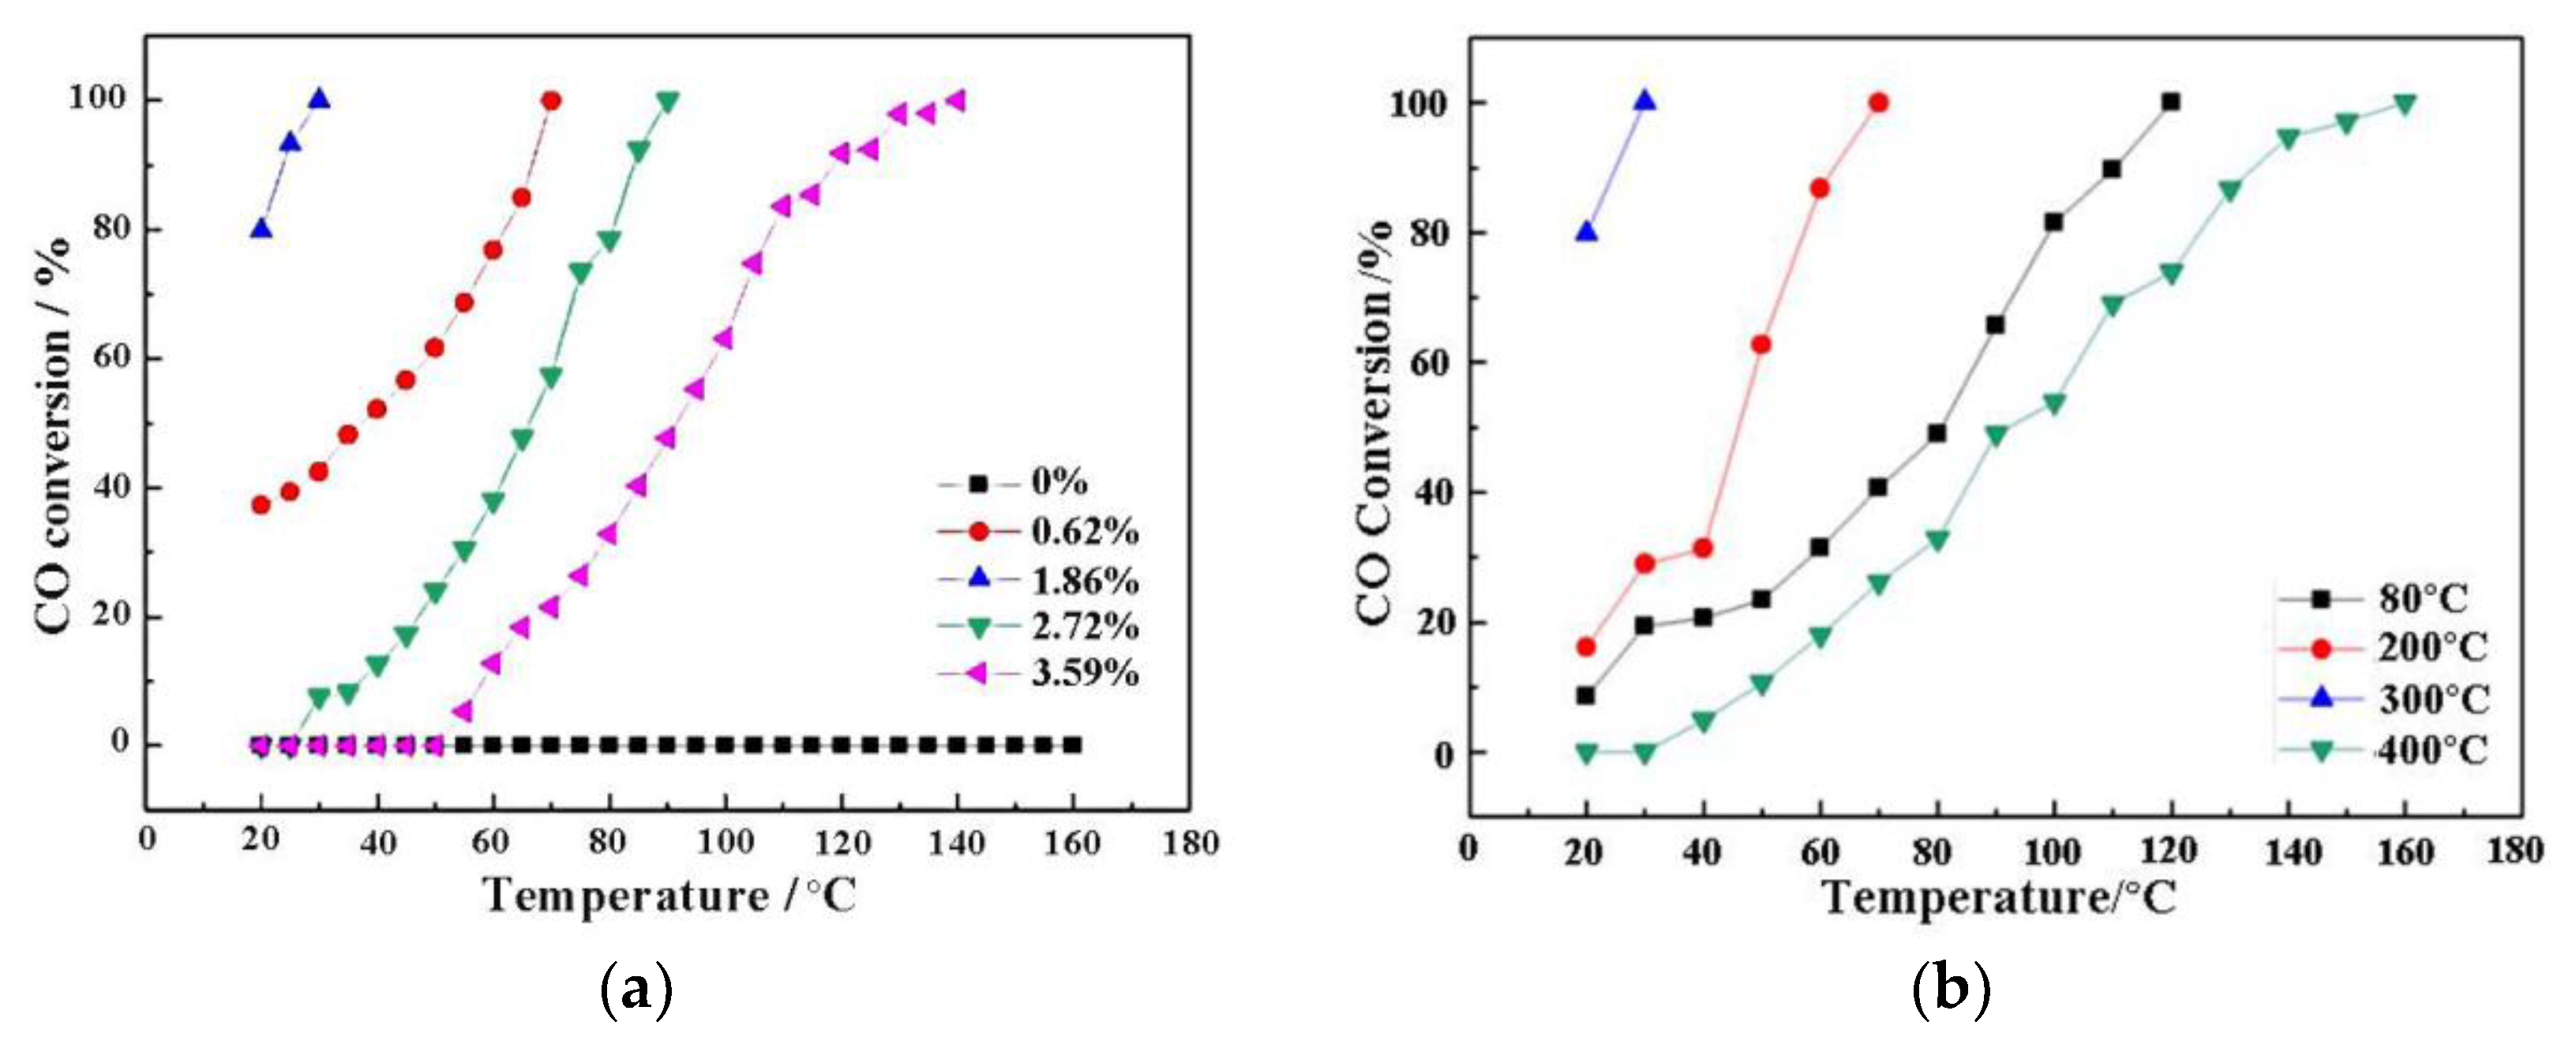
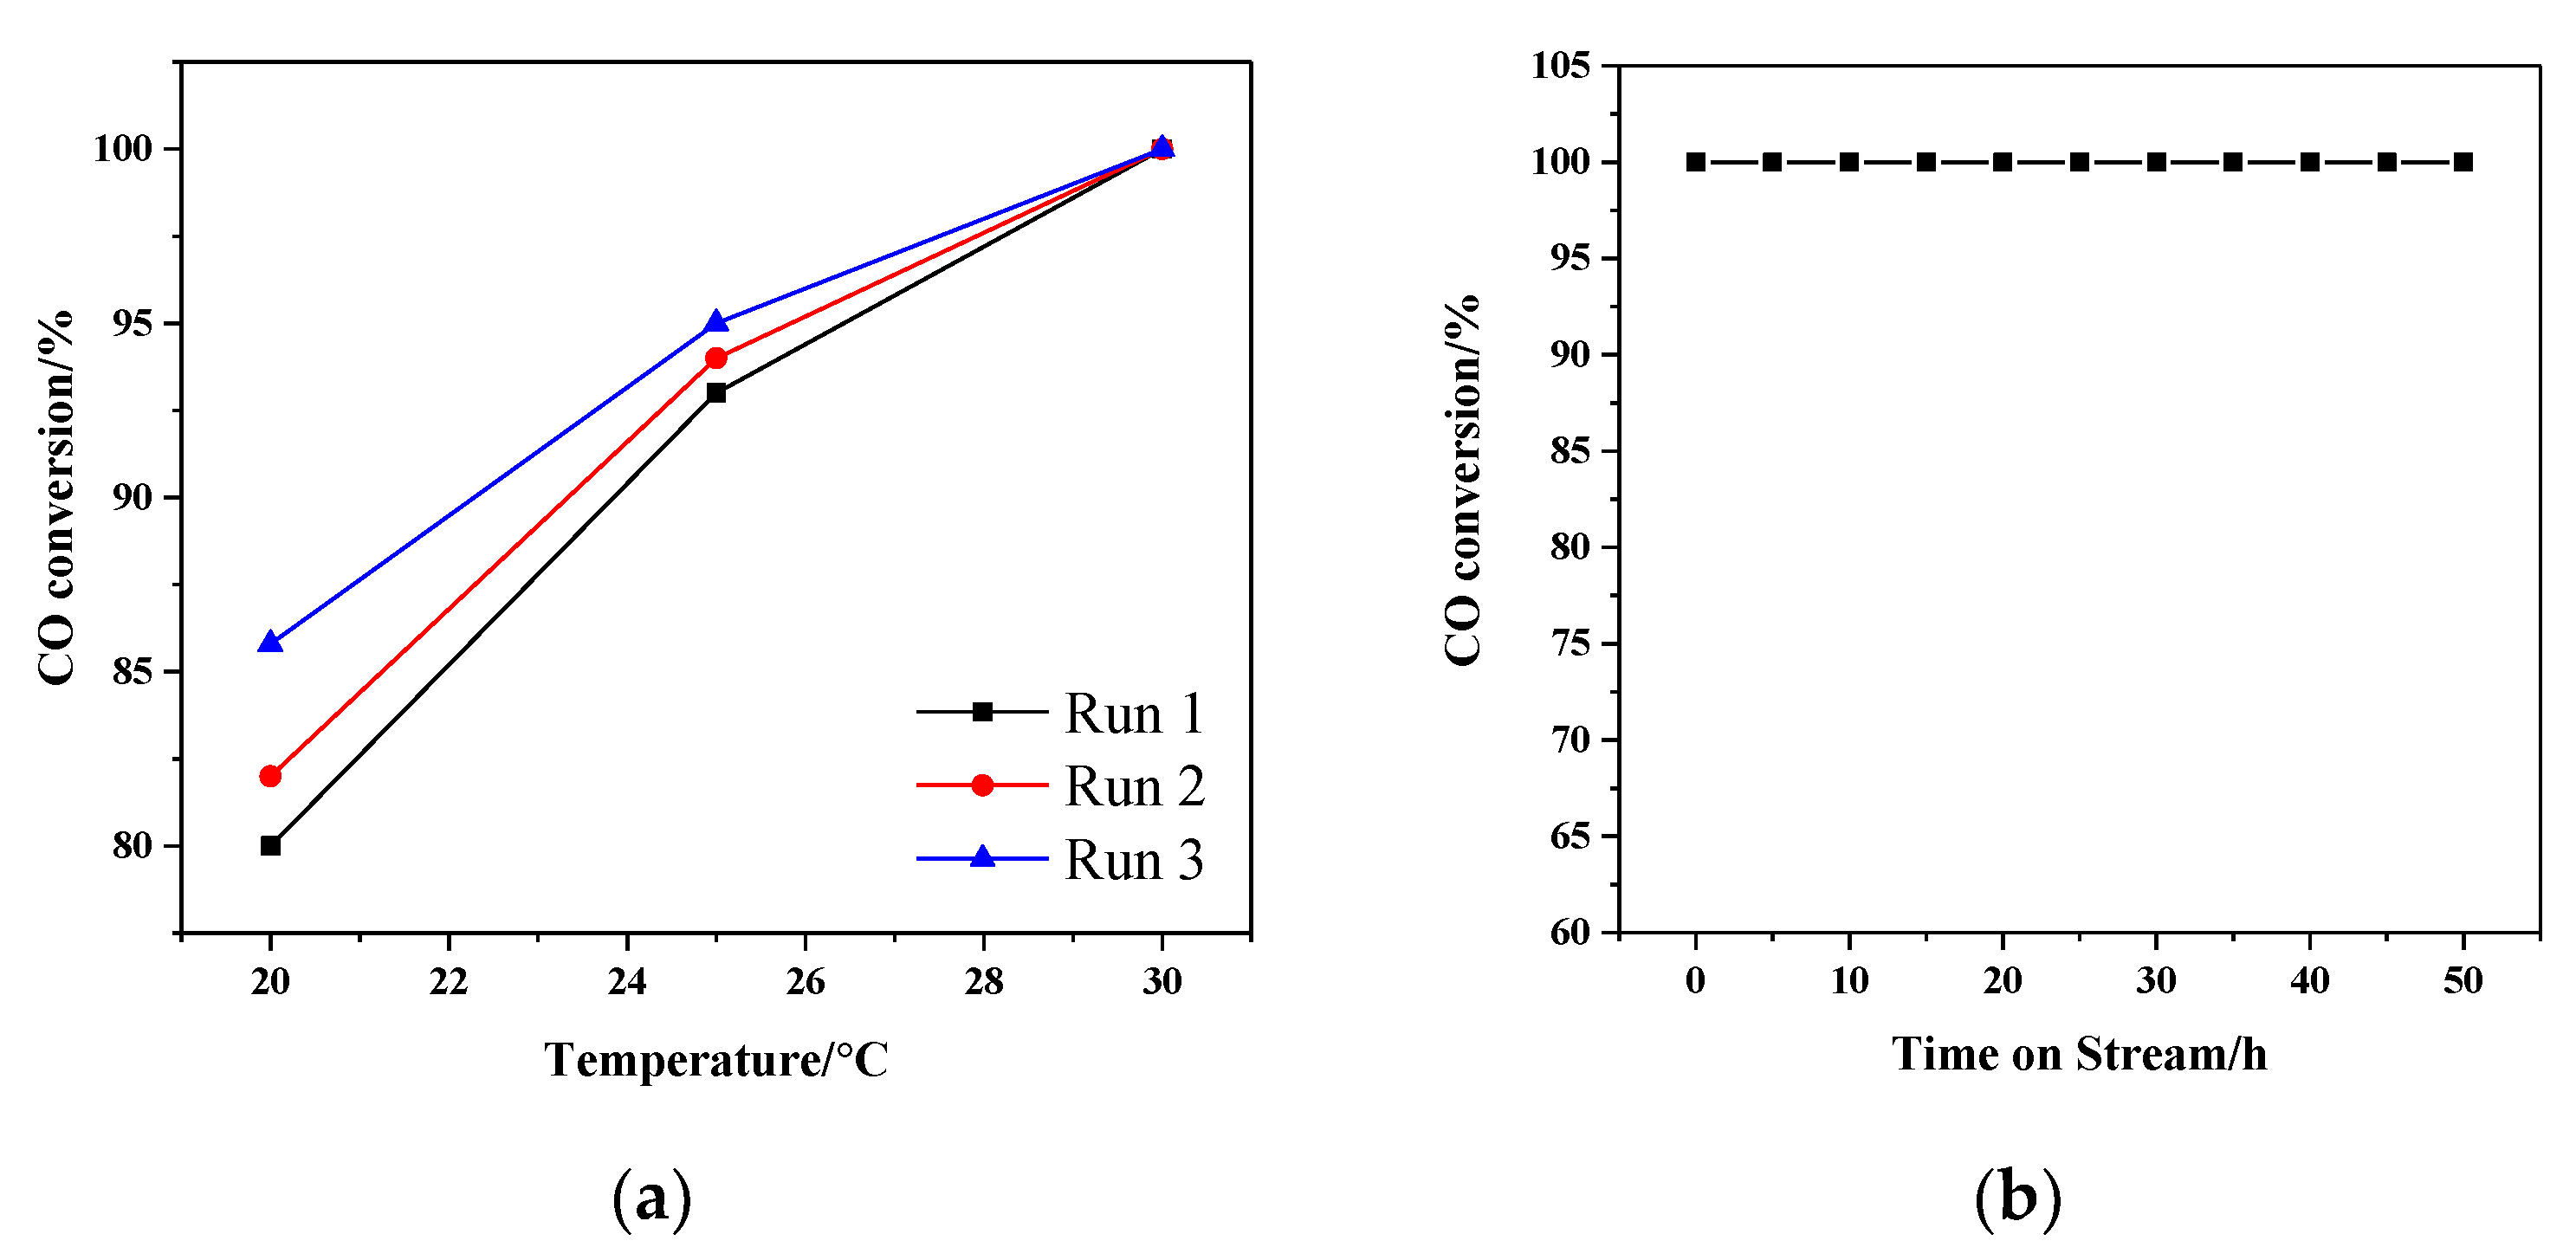
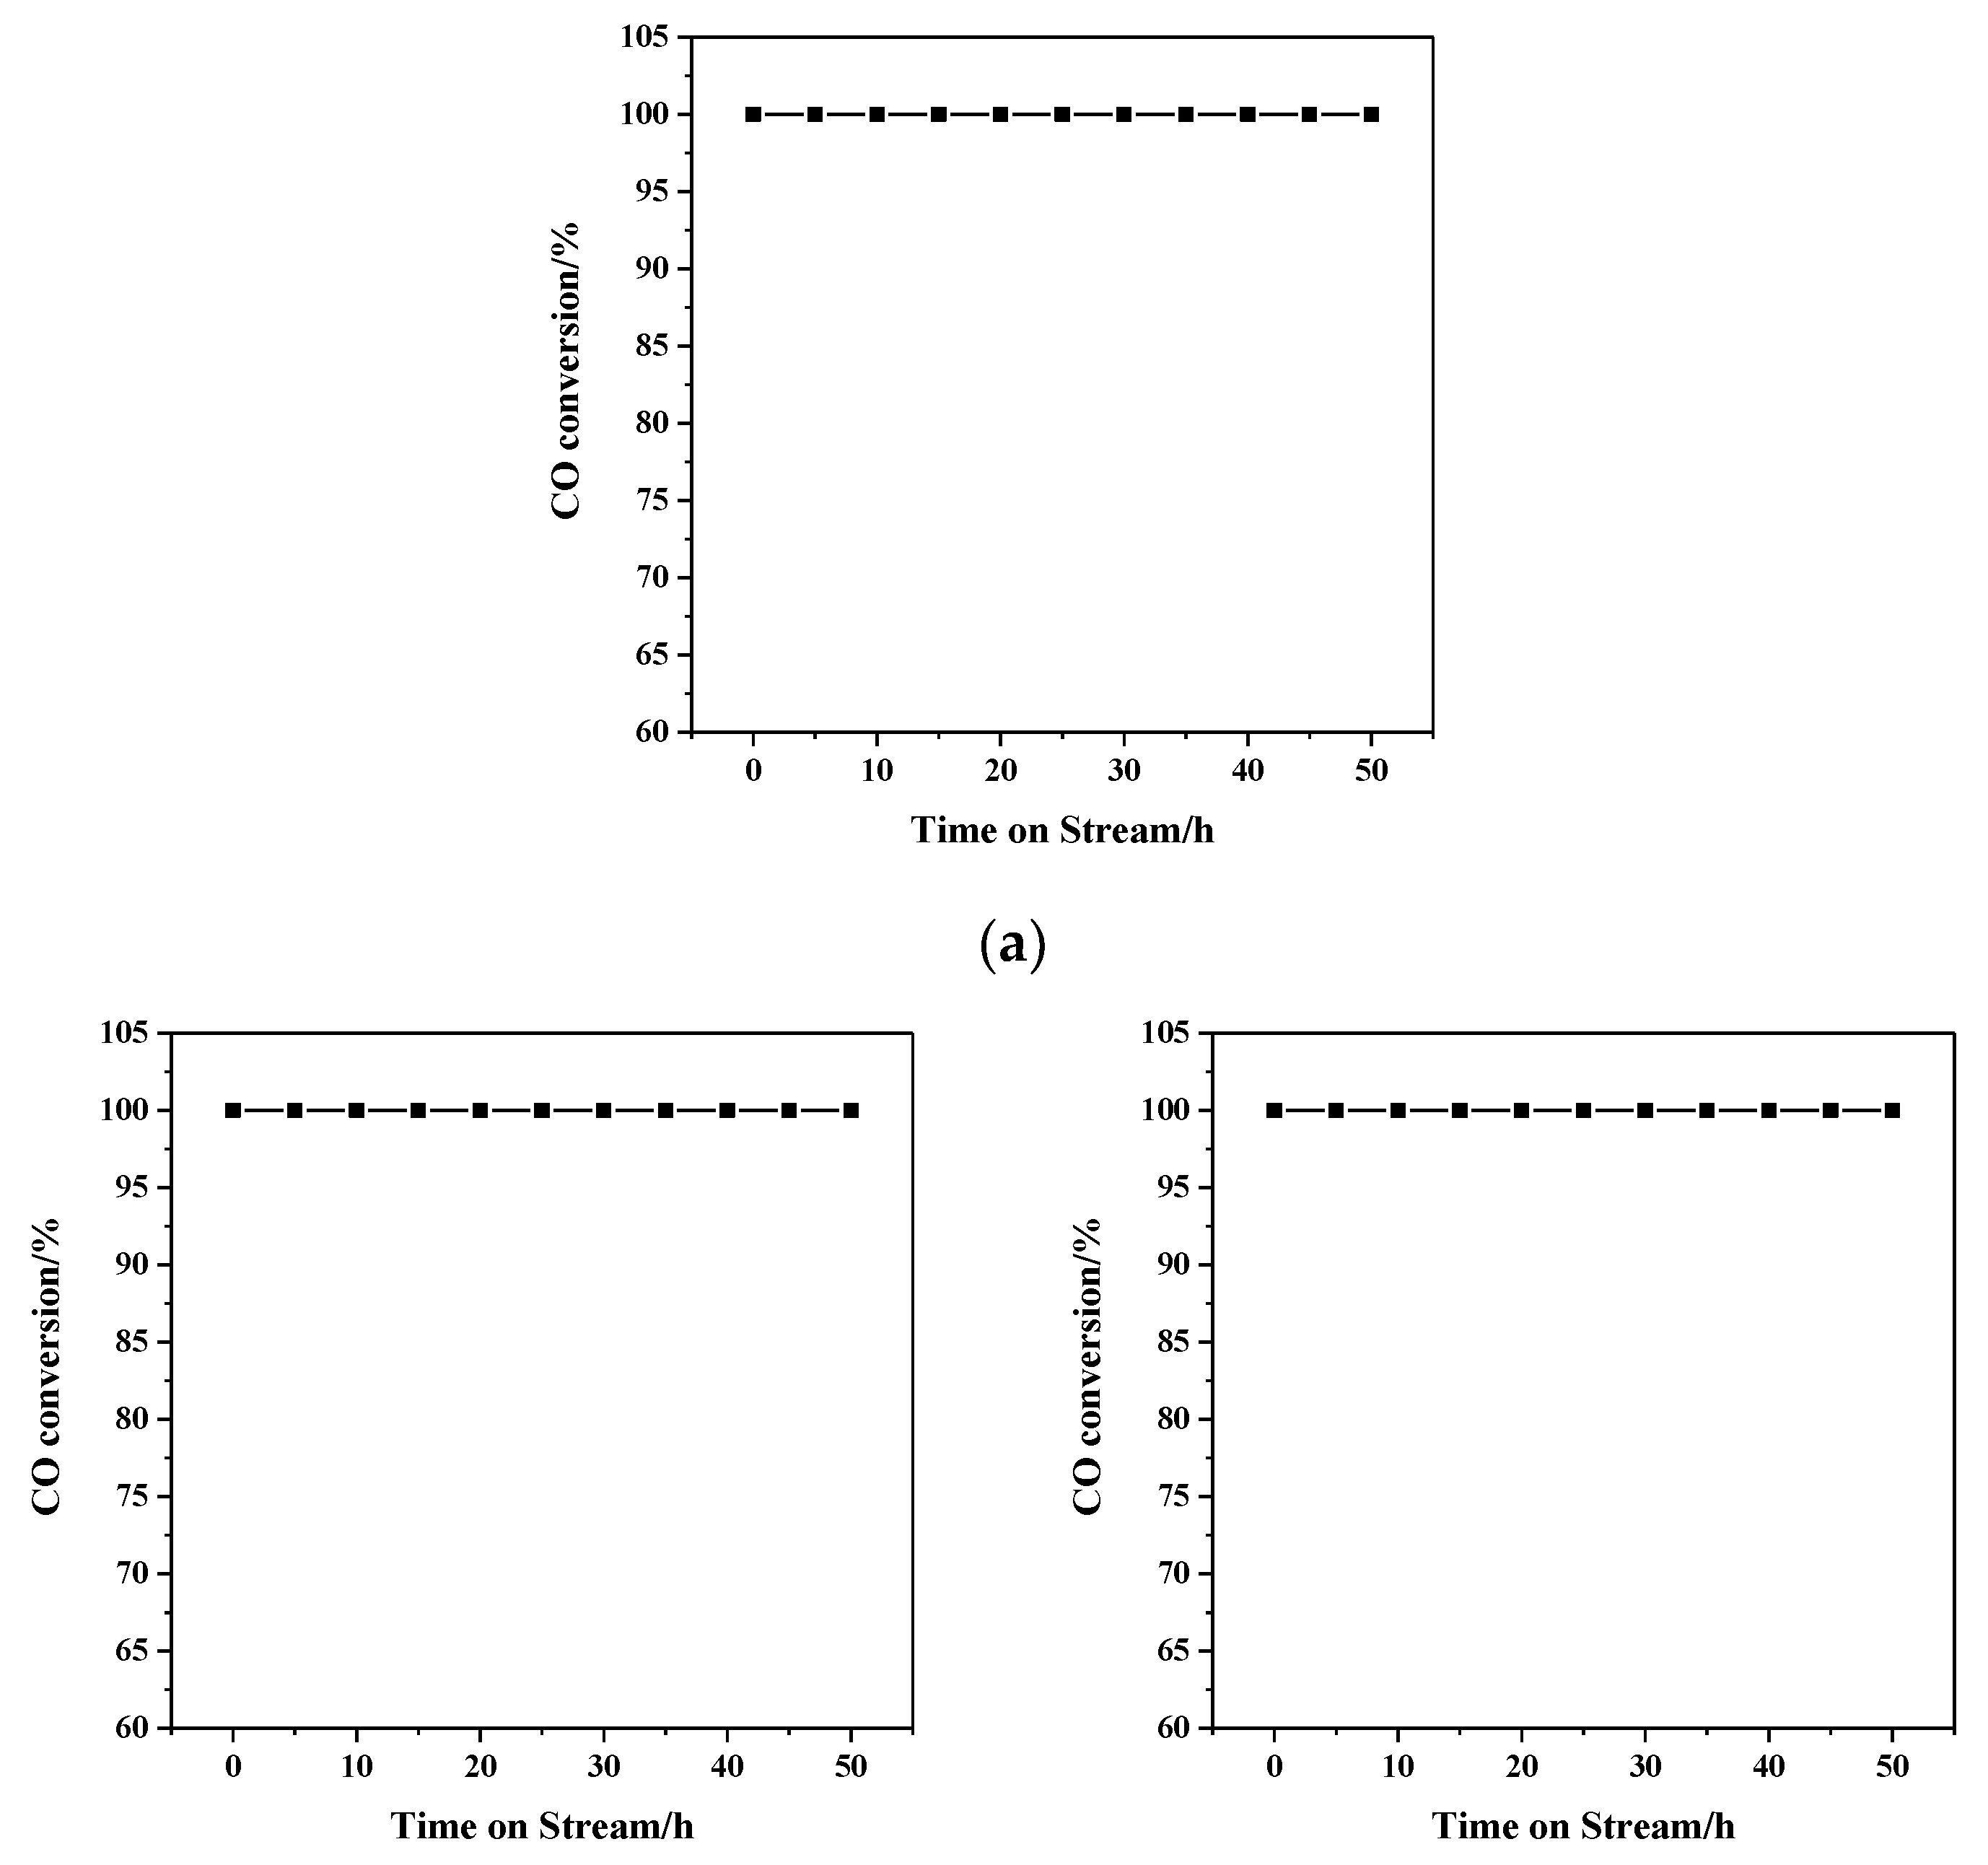
3.6. CO Oxidation Catalytic Activity
4. Conclusions
Author Contributions
Funding
Acknowledgments
Conflicts of Interest
References
- Zhang, X.; Hou, F.; Li, H.; Yang, Y.; Wang, Y.; Liu, N.; Yang, Y. A strawsheave-like metal organic framework Ce-BTC derivative containing high specific surface area for improving the catalytic activity of CO oxidation reaction. Microporous Mesoporous. Mater. 2018, 259, 211–219. [Google Scholar] [CrossRef]
- Zhang, X.; Yang, Y.; Song, L.; Wang, Y.; He, C.; Wang, Z.; Cui, F. High and stable catalytic activity of Ag/Fe2O3 catalysts derived from MOFs for CO oxidation. J. Mol. Catal. A-Chem. 2018, 447, 80–89. [Google Scholar] [CrossRef]
- Trimm, D.L. Minimisation of carbon monoxide in a hydrogen stream for fuel cell application. Appl. Catal. A-Gen. 2005, 296, 1–11. [Google Scholar] [CrossRef]
- Alshehri, A.A.; Narasimharao, K. Low temperature oxidation of carbon monoxide over mesoporous Au-Fe2O3 catalysts. J. Nanomater. 2017, 2017, 14. [Google Scholar] [CrossRef]
- Haruta, M.; Kobayashi, T.; Sano, H.; Yamada, N. Novel gold catalysts for the oxidation of carbon monoxide at a temperature far below 0 °C. Chem. Lett. 1987, 16, 405–408. [Google Scholar] [CrossRef]
- Lopez, N.; Janssens, T.V.W.; Clausen, B.S.; Xu, Y.; Mavrikakis, M.; Bligaard, T.; KNørskov, J. On the origin of the catalytic activity of gold nanoparticles for low-temperature CO oxidation. J. Catal. 2004, 223, 232–235. [Google Scholar] [CrossRef]
- Jia, K.; Zhang, H.; Li, W. Effect of morphology of the ceria support on the activity of Au/CeO2 catalysts for CO oxidation. Chin. J. Catal. 2008, 29, 1089–1092. [Google Scholar] [CrossRef]
- Guczi, L.; Beck, A.; Frey, K. Role of promoting oxide morphology dictating the activity of Au/SiO2 catalyst in CO oxidation. Gold Bull. 2009, 42, 5–12. [Google Scholar] [CrossRef]
- Li, S.; Zhu, H.; Qin, Z.; Wang, G.; Zhang, Y.; Wu, Z.; Li, Z.; Chen, G.; Dong, W.; Wu, Z.; et al. Morphologic effects of nano CeO2-TiO2 on the performance of Au/CeO2-TiO2 catalysts in low-temperature CO oxidation. Appl. Catal. B-Environ. 2014, 144, 498–506. [Google Scholar] [CrossRef]
- Guo, J.; Han, Q.; Zhong, S.; Huang, W.; Zhang, S. Au/M-TiO2 nanotube catalysts (M = Ce, Ga, Co, Y): Preparation, characterization and their catalytic activity for CO oxidation. J. Sol-Gel Sci. Technol. 2018, 86, 699–710. [Google Scholar] [CrossRef]
- Tang, H.; Liu, F.; Wei, J.; Qiao, B.; Zhao, K.; Su, Y.; Jin, C.; Li, L.; Liu, J.; Wang, J.; et al. Ultrastable hydroxyapatite/titanium-dioxide-supported gold nanocatalyst with strong metal-support interaction for carbon monoxide oxidation. Angew. Chem. Int. Ed. 2016, 55, 10606–10611. [Google Scholar] [CrossRef]
- Bond, G.C.; Thompson, D.T. Catalysis by gold. Catal. Rev.-Sci. Eng. 1999, 41, 319–388. [Google Scholar] [CrossRef]
- Wang, J.; Qin, C.; Wang, H.; Chu, M.; Zada, A.; Zhang, X.; Li, J.; Raziq, F.; Qu, Y.; Jing, L. Exceptional photocatalytic activities for CO2 conversion on Al-O bridged g-C3N4/α-Fe2O3 z-scheme nanocomposites and mechanism insight with isotopesZ. Appl. Catal. B-Environ. 2018, 221, 459–466. [Google Scholar] [CrossRef]
- Ding, J.; Zhang, L.; Liu, Q.; Dai, W.L.; Guan, G. Synergistic effects of electronic structure of WO3 nanorods with the dominant {001} exposed facets combined with silver size-dependent on the visible-light photocatalytic activity. Appl. Catal. B-Environ. 2017, 203, 335–342. [Google Scholar] [CrossRef]
- Zhang, J.; Hu, Y.; Jiang, X.; Chen, S.; Meng, S.; Fu, X. Design of a direct Z-scheme photocatalyst: Preparation and characterization of Bi2O3/g-C3N4 with high visible light activity. J. Hazard. Mater. 2014, 280, 713–722. [Google Scholar] [CrossRef]
- Lakhera, S.K.; Watts, A.; Hafeez, H.Y.; Neppolian, B. Interparticle double charge transfer mechanism of heterojunction α-Fe2O3/Cu2O mixed oxide catalysts and its visible light photocatalytic activity. Catal. Today 2018, 300, 58–70. [Google Scholar] [CrossRef]
- Yin, H.; Ma, Z.; Chi, M. Heterostructured catalysts prepared by dispersing Au@Fe2O3 core-shell structures on supports and their performance in CO oxidation. Catal. Today 2011, 160, 87–95. [Google Scholar] [CrossRef]
- Wang, G.H.; Li, W.C.; Jia, K.M.; Spliethoff, B.; Schüth, F.; Lu, A.H. Shape and size controlled α-Fe2O3 nanoparticles as supports for gold-catalysts: Synthesis and influence of support shape and size on catalytic performance. Appl. Catal. A-Gen. 2009, 364, 42–47. [Google Scholar] [CrossRef]
- Sun, B.; Feng, X.; Yao, Y.; Su, Q.; Ji, W.; Au, C.T. Substantial pretreatment effect on CO oxidation over controllably synthesized Au/FeOx hollow nanostructures via hybrid Au/β-FeOOH@SiO2. ACS Catal. 2013, 3, 3099–3105. [Google Scholar] [CrossRef]
- Zeng, L.; Li, K.; Wang, H.; Yu, H.; Zhu, X.; Wei, Y.; Ning, P.; Shi, C.; Luo, Y. CO oxidation on Au/α-Fe2O3-hollow catalysts: General synthesis and structural dependence. J. Phys. Chem. C 2017, 121, 12696–12710. [Google Scholar] [CrossRef]
- Tanaka, S.; Lin, J.; Kaneti, Y.V.; Yusa, S.; Jikihara, Y.; Nakayama, T.; Zakaria, M.B.; Alshehri, A.A.; You, J.; Hossain, M.S.A.; et al. Gold nanoparticles supported on mesoporous iron oxide for enhanced CO oxidation reaction. Nanoscale 2018, 10, 4779–4785. [Google Scholar] [CrossRef]
- Yu, H.; Guo, J.; Dong, F.; Zhu, B.; Huang, W.; Zhang, S. A comparative study of CO catalytic oxidation on Au/YPO4-prisms and Au/YPO4-rods. J. Nanopart. Res. 2017, 19, 204. [Google Scholar] [CrossRef]
- Liu, H.; Tian, K.; Ning, J.; Zhong, Y.; Zhang, Z.; Hu, Y. One-step solvothermal formation of Pt nanoparticles decorated Pt2+-doped α-Fe2O3 nanoplates with enhanced photocatalytic O2 evolution. ACS Catal. 2019, 9, 1211–1219. [Google Scholar] [CrossRef]
- Mishra, M.; Chun, D.M. α-Fe2O3 as a photocatalytic material: A review. Appl. Catal. A-Gen. 2015, 498, 126–141. [Google Scholar] [CrossRef]
- Haruta, M.; Tsubota, S.; Kobayashi, T.; Kageyama, H.; Genet, M.J.; Delmon, B. Low-temperature oxidation of CO over gold supported on TiO2, α-Fe2O3 and Co3O4. J. Catal. 1993, 144, 175–192. [Google Scholar] [CrossRef]
- He, Y.P.; Miao, Y.M.; Li, C.R.; Wang, S.Q.; Cao, L.; Xie, S.S.; Yang, G.Z.; Zou, B.S.; Burda, C. Size and structure effect on optical transitions of iron oxide nanocrystals. Phys. Rev. B 2005, 71, 125411. [Google Scholar] [CrossRef]
- Narasimharao, K.; Al-Shehri, A.; Al-Thabaiti, S. Porous Ag-Fe2O3 nanocomposite catalysts for the oxidation of carbon monoxide. Appl. Catal. A-Gen. 2015, 505, 431–440. [Google Scholar] [CrossRef]
- Carrot, G.; Valmalette, J.C.; Plummer, C.J.G.; Scholz, S.M.; Dutta, J.; Hofmann, H.; Hilborn, J.G. Gold nanoparticle synthesis in graft copolymer micelles. Colloid Polym. Sci. 1998, 276, 853–859. [Google Scholar] [CrossRef]
- Gopi, D.; Shinyjoy, E.; Kavitha, L. Influence of ionic substitution in improving the biological property of carbon nanotubes reinforced hydroxyapatite composite coating on titanium for orthopedic applications. Ceram. Int. 2015, 41, 5454–5463. [Google Scholar] [CrossRef]
- Sathyaseelan, B.; Manikandan, E.; Lakshmanan, V.; Baskaran, I.; Sivakumar, K.; Ladchumananandasivam, R.; Kennedy, J.; Maaza, M. Structural, optical and morphological properties of post-growth calcined TiO2 nanopowder for opto-electronic device application: Ex-situ studies. J. Alloys Compd. 2016, 671, 486–492. [Google Scholar] [CrossRef]
- Maji, S.K.; Mukherjee, N.; Mondal, A.; Adhikary, B. Synthesis, characterization and photocatalytic activity of α-Fe2O3 nanoparticles. Polyhedron 2012, 33, 145–149. [Google Scholar] [CrossRef]
- Mishra, M.; Park, H.; Chun, D.M. Photocatalytic properties of Au/Fe2O3 nano-composites prepared by co-precipitation. Adv. Powder Technol. 2016, 27, 130–138. [Google Scholar] [CrossRef]
- Grosvenor, A.P.; Kobe, B.A.; Biesinger, M.C.; McIntyre, N.S. Investigation of multiplet splitting of Fe 2p XPS spectra and bonding in iron compounds. Surf. Interface Anal. 2004, 36, 1564–1574. [Google Scholar] [CrossRef]
- Hoch, L.B.; He, L.; Qiao, Q.; Liao, K.; Reyes, L.M.; Zhu, Y.; Ozin, G.A. Effect of precursor selection on the photocatalytic performance of indium oxide nanomaterials for gas-phase CO2 reduction. Chem. Mater. 2016, 28, 4160–4168. [Google Scholar] [CrossRef]
- Ma, R.; Yin, L.; Li, L.; Zhang, S.; Wen, T.; Zhang, C.; Wang, X.; Chen, Z.; Hayat, T.; Wang, X. Comparative investigation of Fe2O3 and Fe1–xS nanostructures for uranium decontamination. ACS Appl. Nano Mater. 2018, 1, 5543–5552. [Google Scholar] [CrossRef]
- Llorca, J.; Casanovas, A.; Domínguez, M.; Casanova, I.; Angurell, I.; Seco, M.; Rossell, O. Plasma-activated core-shell gold nanoparticle films with enhanced catalytic properties. J. Nanopart. Res. 2008, 10, 537–542. [Google Scholar] [CrossRef]
- Li, M.; Wu, Z.; Ma, Z.; Schwartz, V.; Mullins, D.R.; Dai, S.; Overbury, S.H. CO oxidation on Au/FePO4 catalyst: Reaction pathways and nature of Au sites. J. Catal. 2009, 266, 98–105. [Google Scholar] [CrossRef]
- Munteanu, G.; Ilieva, L.; Andreeva, D. Kinetic parameters obtained from TPR data for α-Fe2O3 and Auα-Fe2O3 systems. Thermochim. Acta 1997, 291, 171–177. [Google Scholar] [CrossRef]
- Liang, M.; Kang, W.; Xie, K. Comparison of reduction behavior of Fe2O3, ZnO and ZnFe2O4 by TPR technique. J. Nat. Gas Chem. 2009, 18, 110–113. [Google Scholar] [CrossRef]
- Wang, H.; Ping, N.; Zhang, Q.; Liu, X.; Zhang, T.; Hu, J.; Wang, L. Effect of different RuO2 contents on selective catalytic oxidation of ammonia over RuO2-Fe2O3 catalysts. J. Fuel Chem. Technol. 2019, 47, 215–223. [Google Scholar] [CrossRef]
- Han, J.; Meeprasert, J.; Maitarad, P.; Nammuangruk, S.; Shi, L.; Zhang, D. Investigation of the facet-dependent catalytic performance of Fe2O3/CeO2 for the selective catalytic reduction of NO with NH3. J. Phys. Chem. C 2016, 120, 1523–1533. [Google Scholar] [CrossRef]
- Liu, J.; Meeprasert, J.; Namuangruk, S.; Zha, K.; Li, H.; Huang, L.; Maitarad, P.; Shi, L.; Zhang, D. Facet-activity relationship of TiO2 in Fe2O3/TiO2 nanocatalysts for selective catalytic reduction of NO with NH3: In situ DRIFTs and DFT studies. J. Phys. Chem. C 2017, 121, 4970–4979. [Google Scholar] [CrossRef]
- Carabineiro, S.A.C.; Bogdanchikova, N.; Tavares, P.B.; Figueiredo, J.L. Nanostructured iron oxide catalysts with gold for the oxidation of carbon monoxide. RSC Adv. 2012, 2, 2957–2965. [Google Scholar] [CrossRef]
- Zhong, Z.; Ho, J.; Teo, J.; Shen, S.; Gedanken, A. Synthesis of porous α-Fe2O3 nanorods and deposition of very small gold particles in the pores for catalytic oxidation of CO. Chem. Mater. 2007, 19, 4776–4782. [Google Scholar] [CrossRef]
- Wang, F.; Li, H.; Shen, W. Influence of Au particle size on Au/CeO2 catalysts for CO oxidation. Catal. Today 2011, 175, 541–545. [Google Scholar] [CrossRef]
- Boccuzzi, F.; Chiorino, A.; Manzoli, M.; Lu, P.; Akita, T.; Ichikawa, S.; Haruta, M. Au/TiO2 nanosized samples: A catalytic, TEM and FTIR study of the effect of calcination temperature on the CO oxidation. J. Catal. 2001, 202, 256–267. [Google Scholar] [CrossRef]
- Zhao, K.; Qiao, B.; Zhang, Y.; Wang, J. The roles of hydroxyapatite and FeOx in a Au/FeOx hydroxyapatite catalyst for CO oxidation. Chin. J. Catal. 2013, 34, 1386–1394. [Google Scholar] [CrossRef]
- Ma, Z.; Brown, S.; Overbury, S.H.; Dai, S. Au/PO43−/TiO2 and PO43−/Au/TiO2 catalysts for CO oxidation: Effect of synthesis details on catalytic performance. Appl. Catal. A-Gen. 2007, 327, 226–237. [Google Scholar] [CrossRef]
- Qi, C.; Su, H.; Guan, R.; Xu, X. An investigation into phosphate-doped Au/alumina for low temperature CO oxidation. J. Phys. Chem. C 2012, 116, 17492–17500. [Google Scholar] [CrossRef]
- Liu, J.X.; Su, Y.; Filot, I.A.W.; Hensen, E.J.M. A linear scaling relation for CO oxidation on CeO2-supported Pd. J. Am. Chem. Soc. 2018, 140, 4580–4587. [Google Scholar] [CrossRef]
- Wan, J.; Chen, W.; Jia, C.; Zheng, L.; Dong, J.; Zheng, X.; Wang, Y.; Yan, W.; Chen, C.; Peng, Q.; et al. Defect effects on TiO2 nanosheets: Stabilizing single atomic site Au and promoting catalytic properties. Adv. Mater. 2018, 30, 1705369. [Google Scholar] [CrossRef]
- Duan, Z.; Henkelman, G. Calculations of CO oxidation over a Au/TiO2 catalyst: A study of active sites, catalyst deactivation and moisture effects. ACS Catal. 2018, 8, 1376–1383. [Google Scholar] [CrossRef]

| Catalyst | Au Loading (wt.%) | Au Particle size (nm) | Specific Rate (molCOgAu−1h−1) | T100 (K) | Reference |
|---|---|---|---|---|---|
| Au/α-Fe2O3-like-worm | 1.86 | 2.3 | 2.61 | 303 | This work |
| Au/Fe2O3-WGC | 0.5 | 3.7 | 0.10 | 623 | [43] |
| Au/Fe2O3 | 1.0 | 7.4 | 0.94 | 423 | [43] |
| Au/commercial Fe2O3 (Fluka) | 0.5 | 1–5 | 1.21 | -- | [44] |
| Au/Fe2O3-nanorod | 0.5 | 1–5 | 3.99 | -- | [44] |
| Au/Fe2O3-mesoporous | 7.9 | 3–10 | 0.30 | 523 | [21] |
| Au/CeO2 | 3.2 | 5.4 | 0.26 | 320 | [45] |
© 2019 by the authors. Licensee MDPI, Basel, Switzerland. This article is an open access article distributed under the terms and conditions of the Creative Commons Attribution (CC BY) license (http://creativecommons.org/licenses/by/4.0/).
Share and Cite
Han, Q.; Zhang, D.; Guo, J.; Zhu, B.; Huang, W.; Zhang, S. Improved Catalytic Performance of Au/α-Fe2O3-Like-Worm Catalyst for Low Temperature CO Oxidation. Nanomaterials 2019, 9, 1118. https://doi.org/10.3390/nano9081118
Han Q, Zhang D, Guo J, Zhu B, Huang W, Zhang S. Improved Catalytic Performance of Au/α-Fe2O3-Like-Worm Catalyst for Low Temperature CO Oxidation. Nanomaterials. 2019; 9(8):1118. https://doi.org/10.3390/nano9081118
Chicago/Turabian StyleHan, Qiuwan, Dongyang Zhang, Jiuli Guo, Baolin Zhu, Weiping Huang, and Shoumin Zhang. 2019. "Improved Catalytic Performance of Au/α-Fe2O3-Like-Worm Catalyst for Low Temperature CO Oxidation" Nanomaterials 9, no. 8: 1118. https://doi.org/10.3390/nano9081118
APA StyleHan, Q., Zhang, D., Guo, J., Zhu, B., Huang, W., & Zhang, S. (2019). Improved Catalytic Performance of Au/α-Fe2O3-Like-Worm Catalyst for Low Temperature CO Oxidation. Nanomaterials, 9(8), 1118. https://doi.org/10.3390/nano9081118