Structural Characterization and Digestibility of Curcumin Loaded Octenyl Succinic Nanoparticles
Abstract
1. Introduction
2. Materials and Methods
2.1. Materials
2.2. Preparation of OSA Grafted on SGC and OSA–SGC Nanoparticles
2.3. Determination of Degree of Substitution
2.4. Determination of the Critical Micelle Concentration (CMC)
2.5. Preparation of Curcumin OSA–SGC Complexes
2.6. Encapsulation Efficiency (EE) and Loading Content (LC)
2.7. FTIR of OSA, OSA–SGC and OSA–SGC–CUR
2.8. X-ray Diffraction
2.9. Dynamic Light Scattering (DLS)
2.10. Thermogravimetric Analysis (TGA)
2.11. Transmission Electron Microscopy (TEM)
2.12. Intestinal and Blood Environment Slow Release Simulation
2.13. Statistical Analysis
3. Results and Discussion
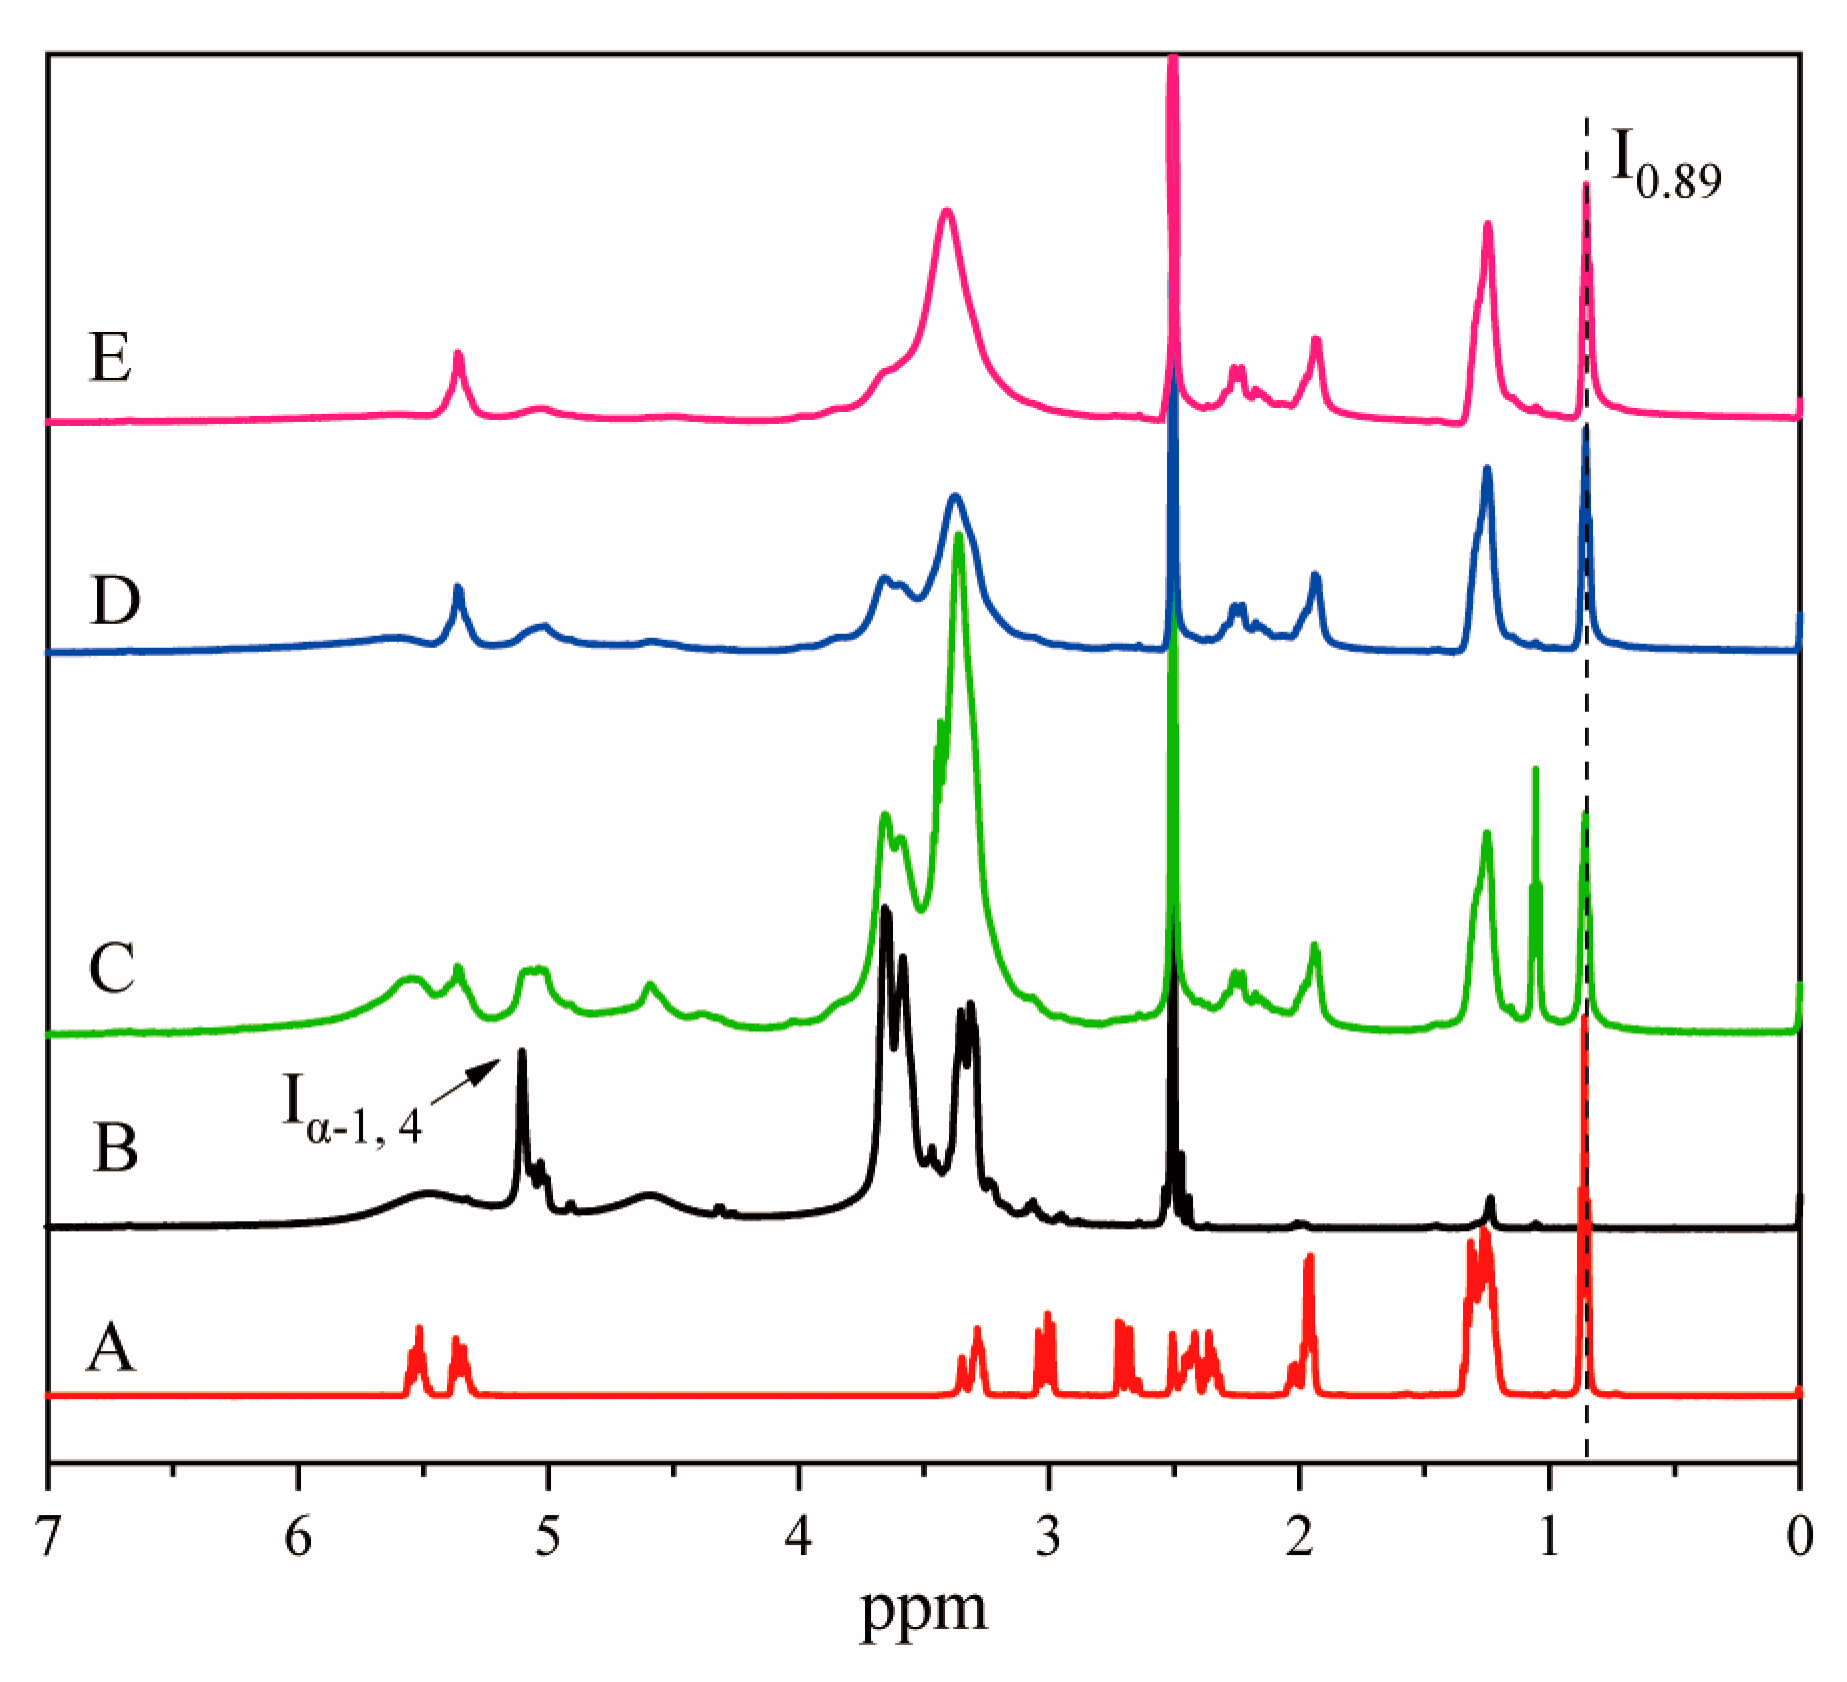
3.1. Determination of the Degree of Substitution
3.2. Self-Assembly Behavior of Amphiphilic Starch Derivatives
3.3. Inclusion Complexes of Encapsulation Efficiency and Loading Content
3.4. DS on Curcumin Encapsulation, Particle Size, Zeta Potential and Polydispersity Coefficient
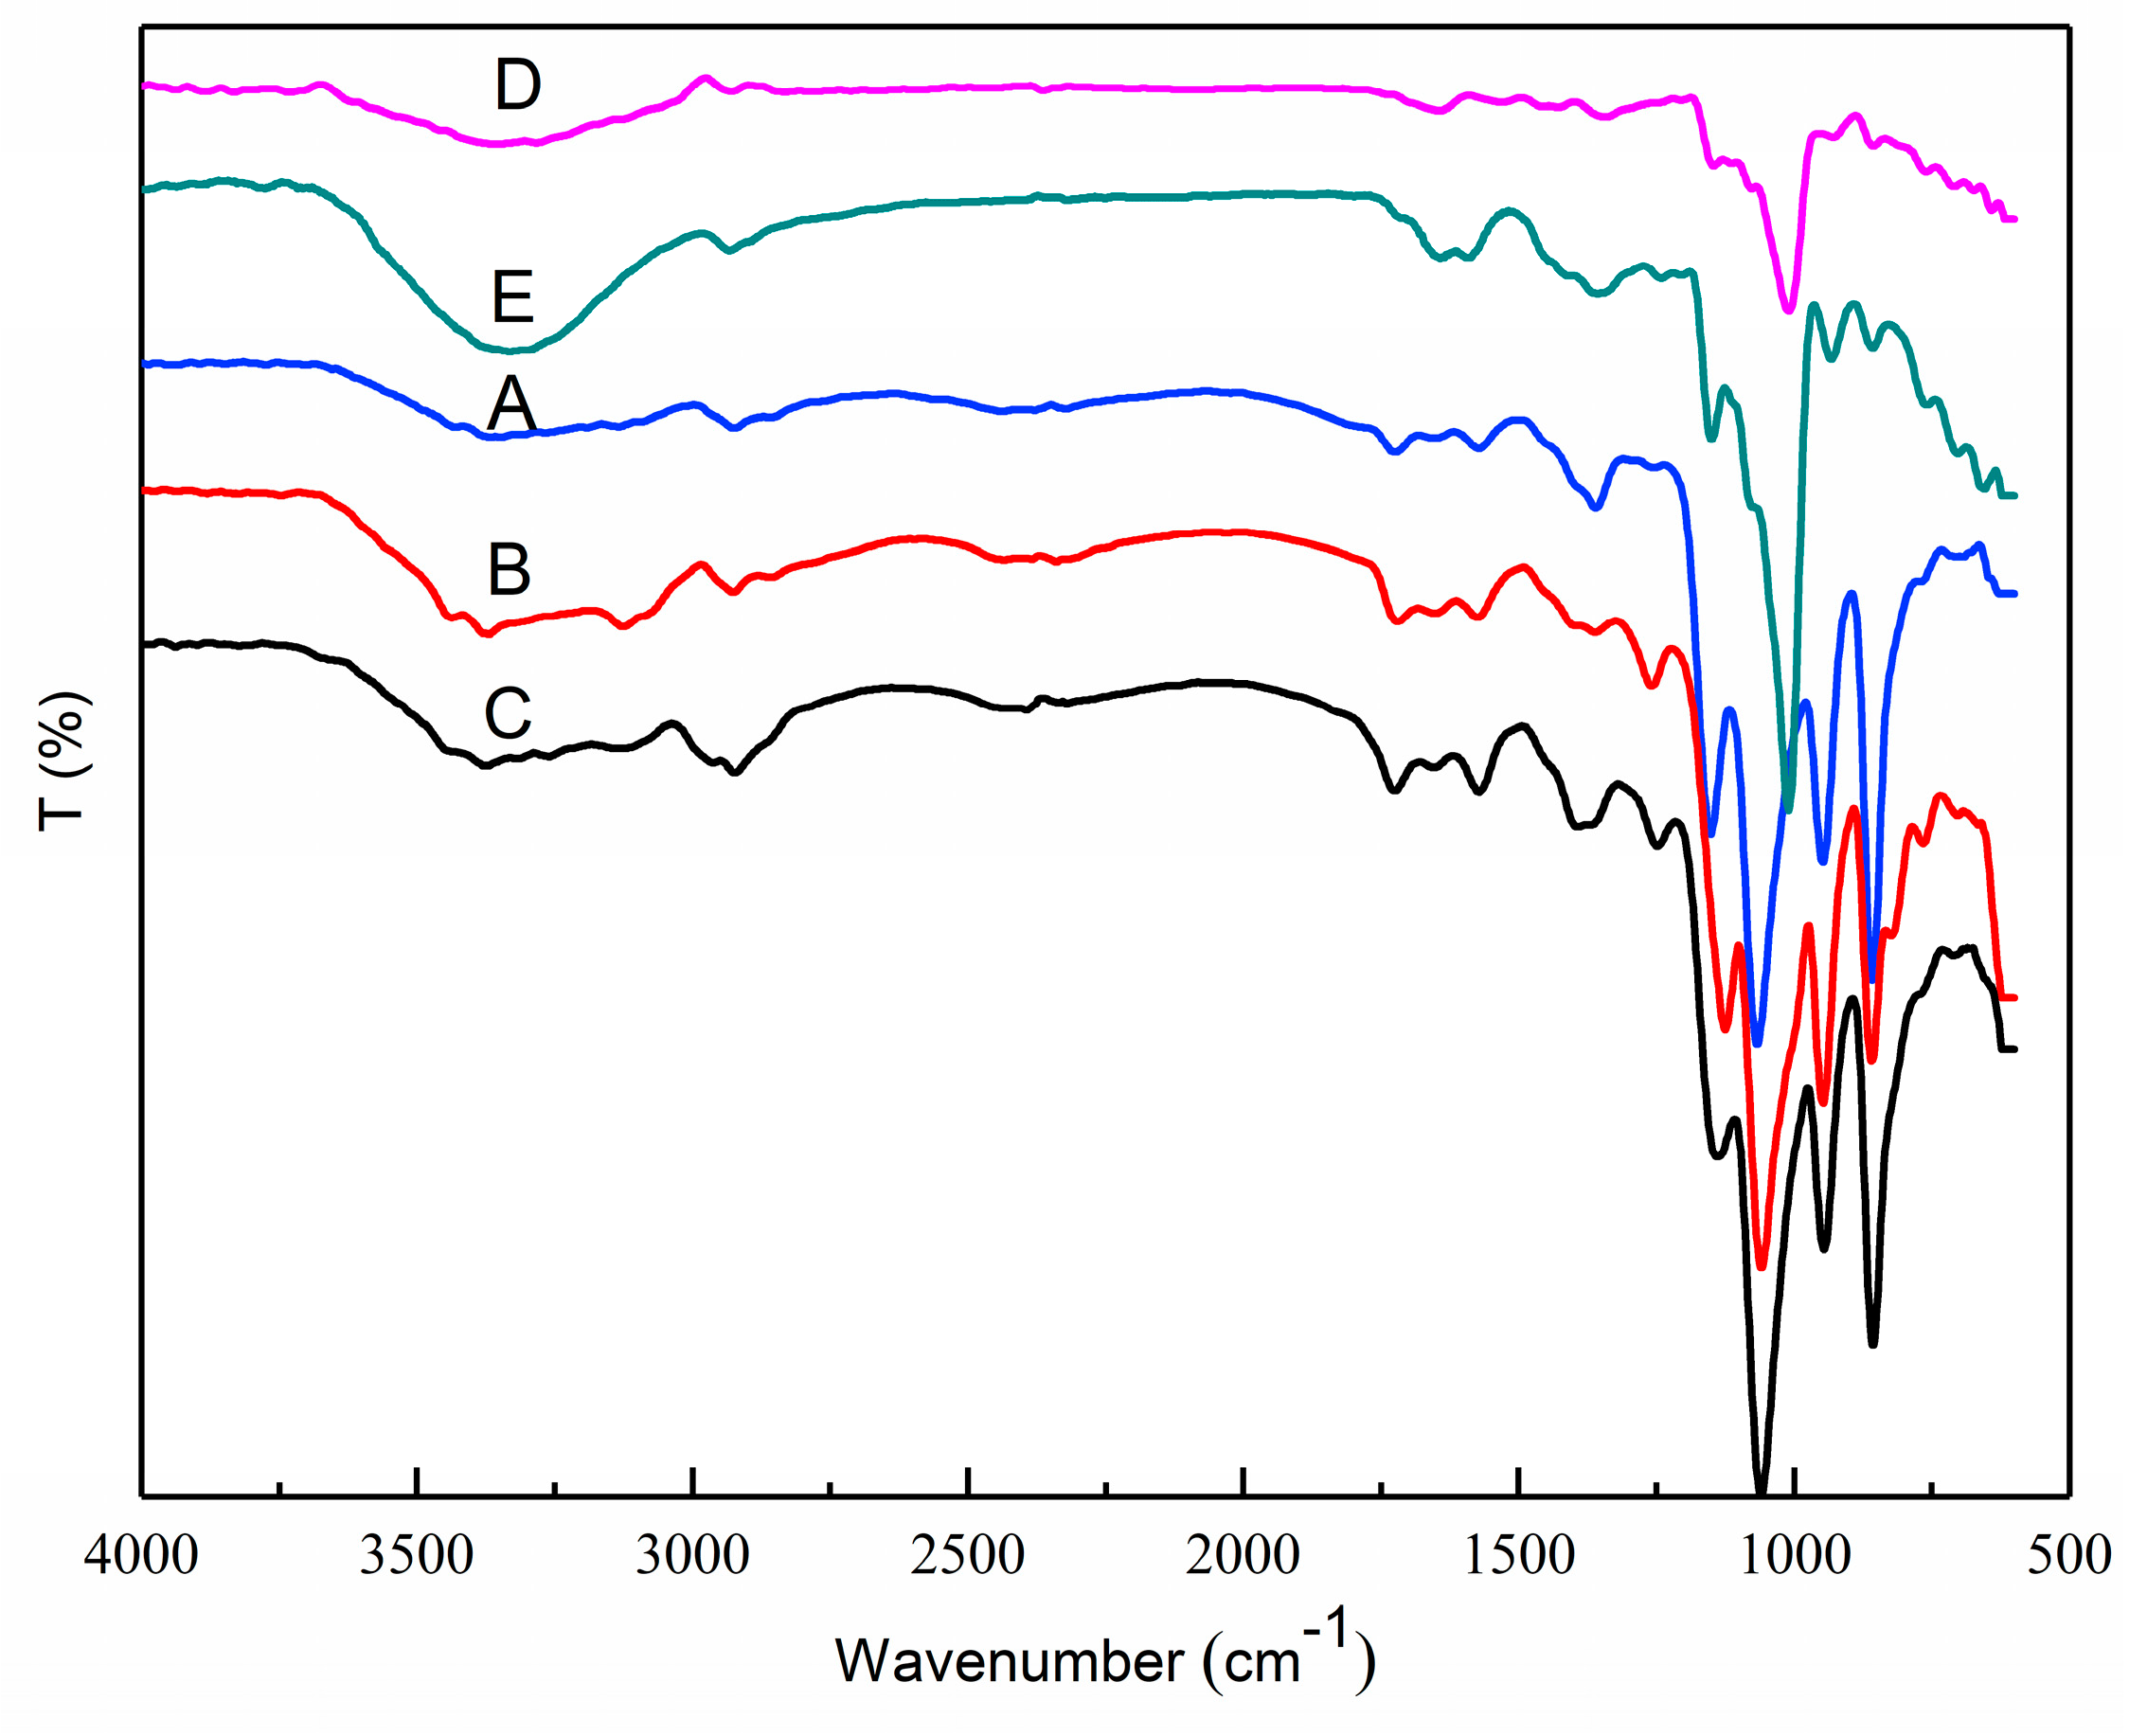
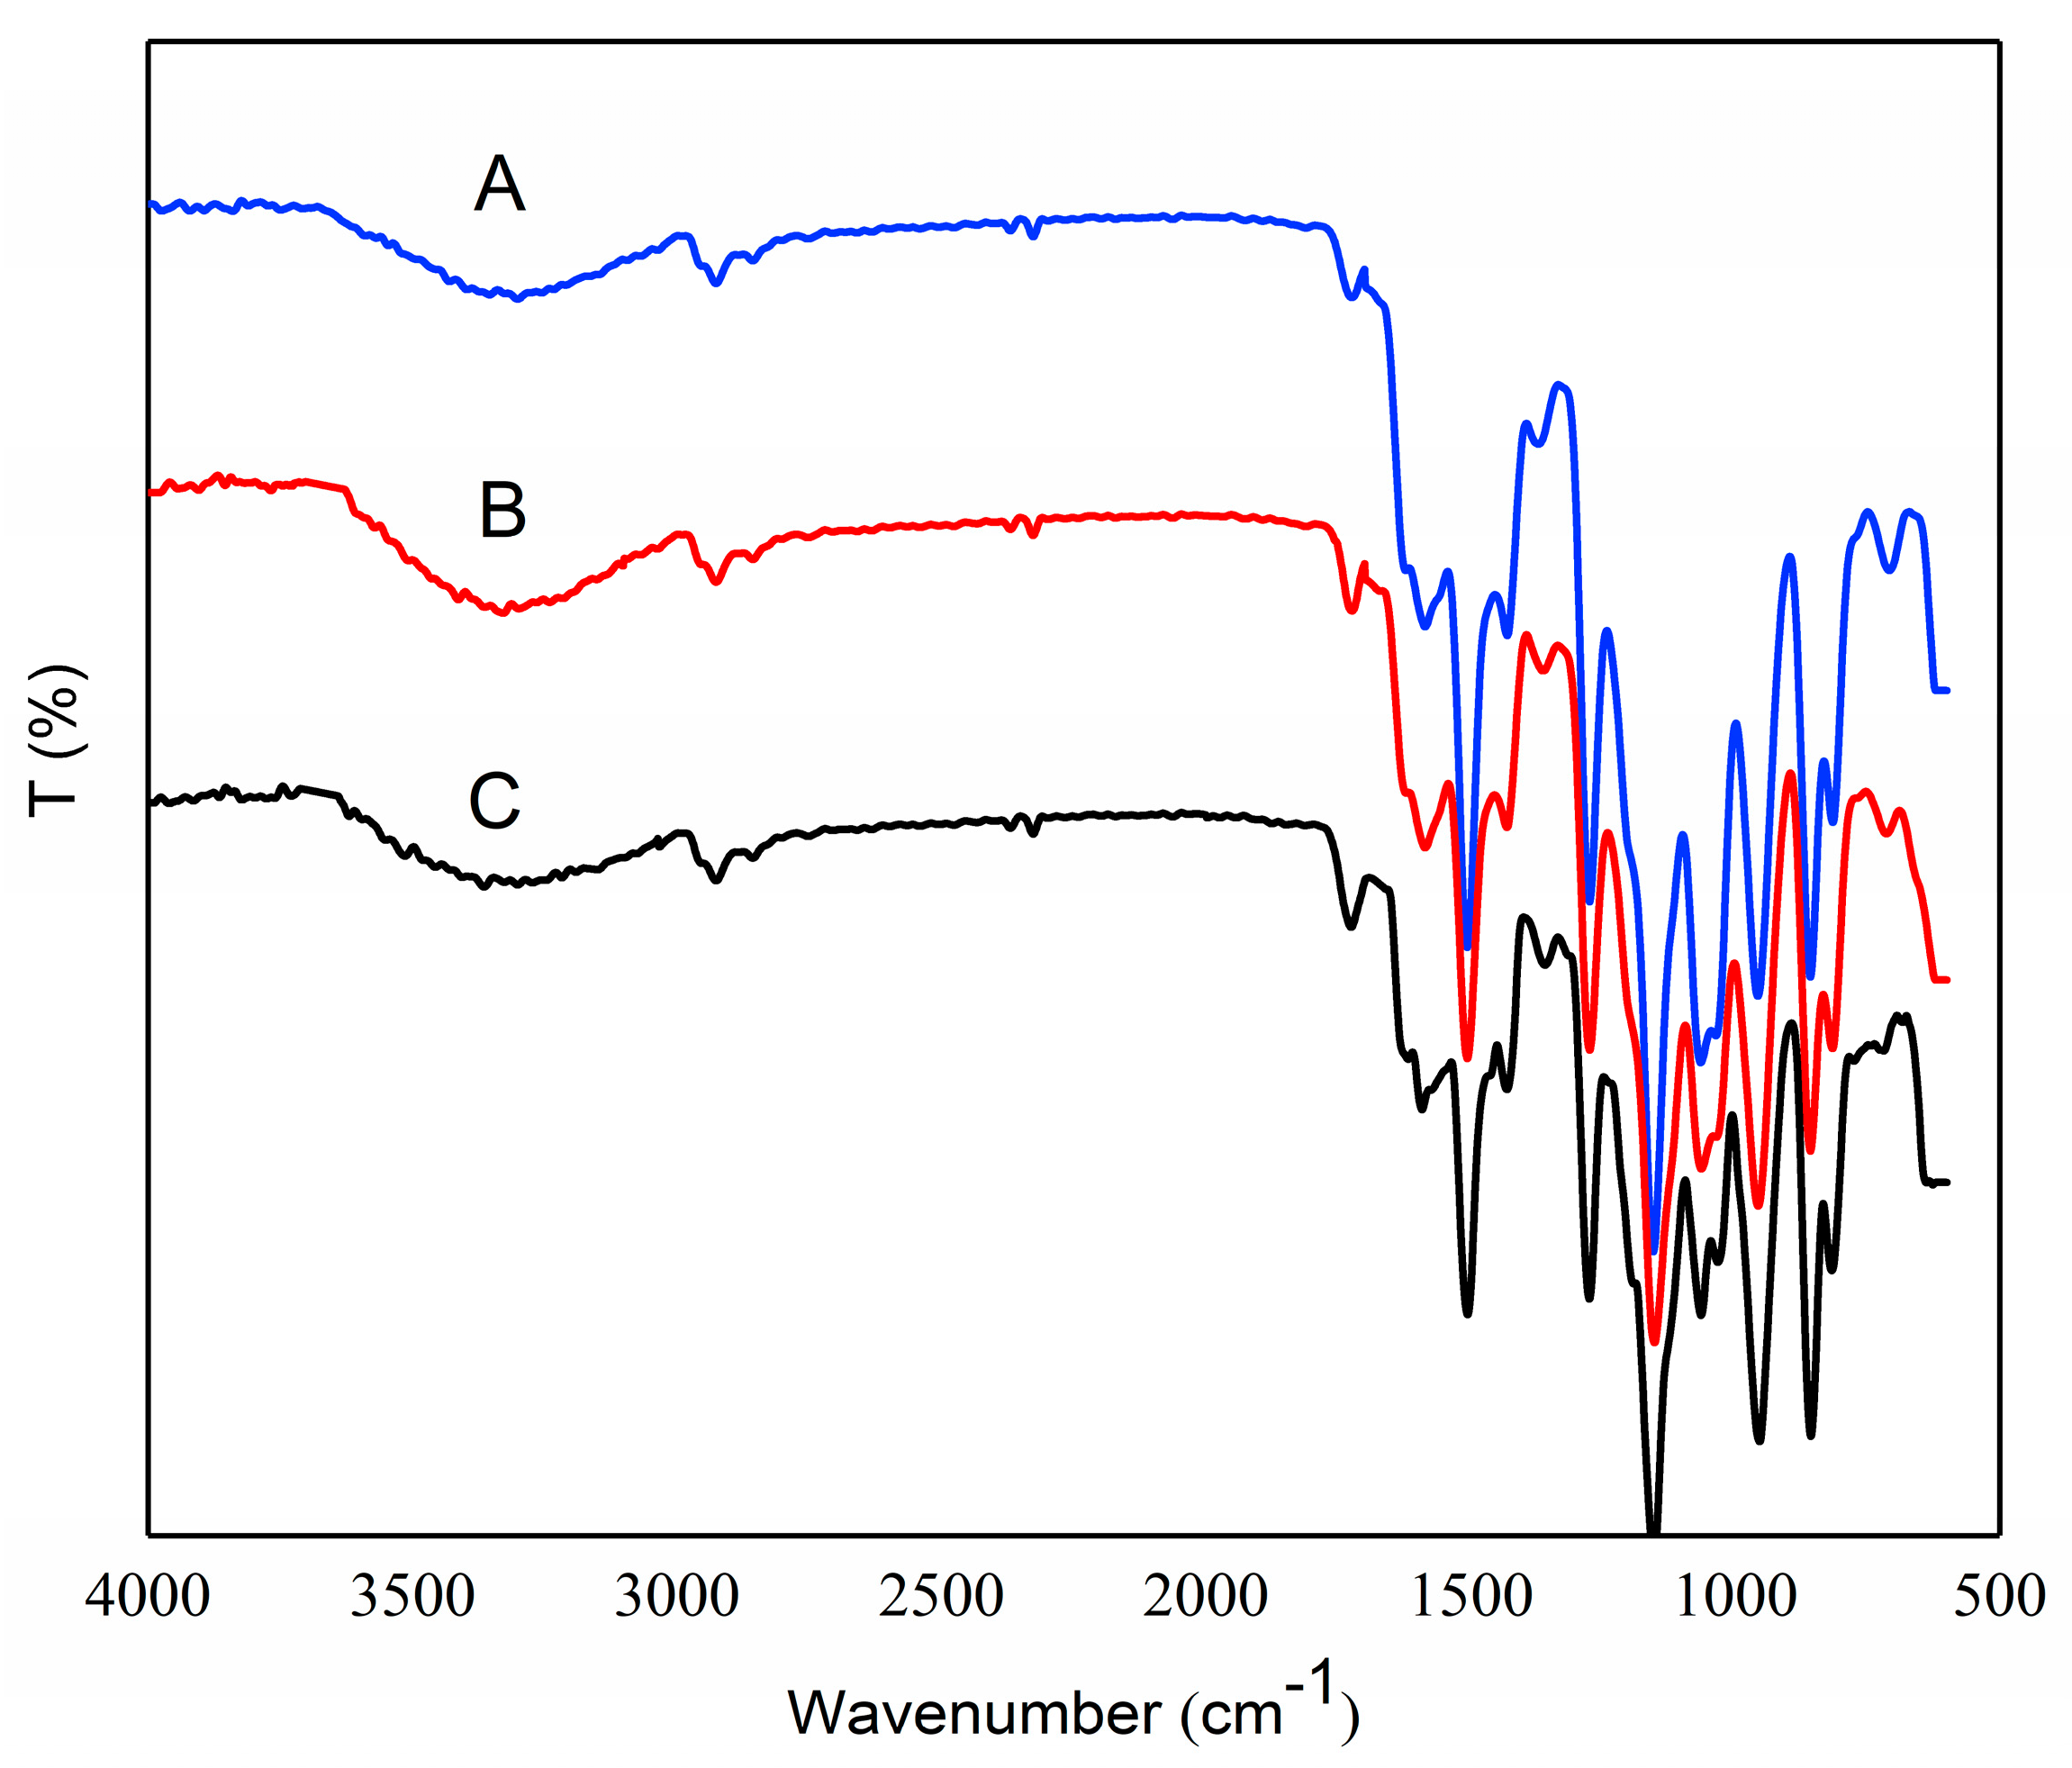
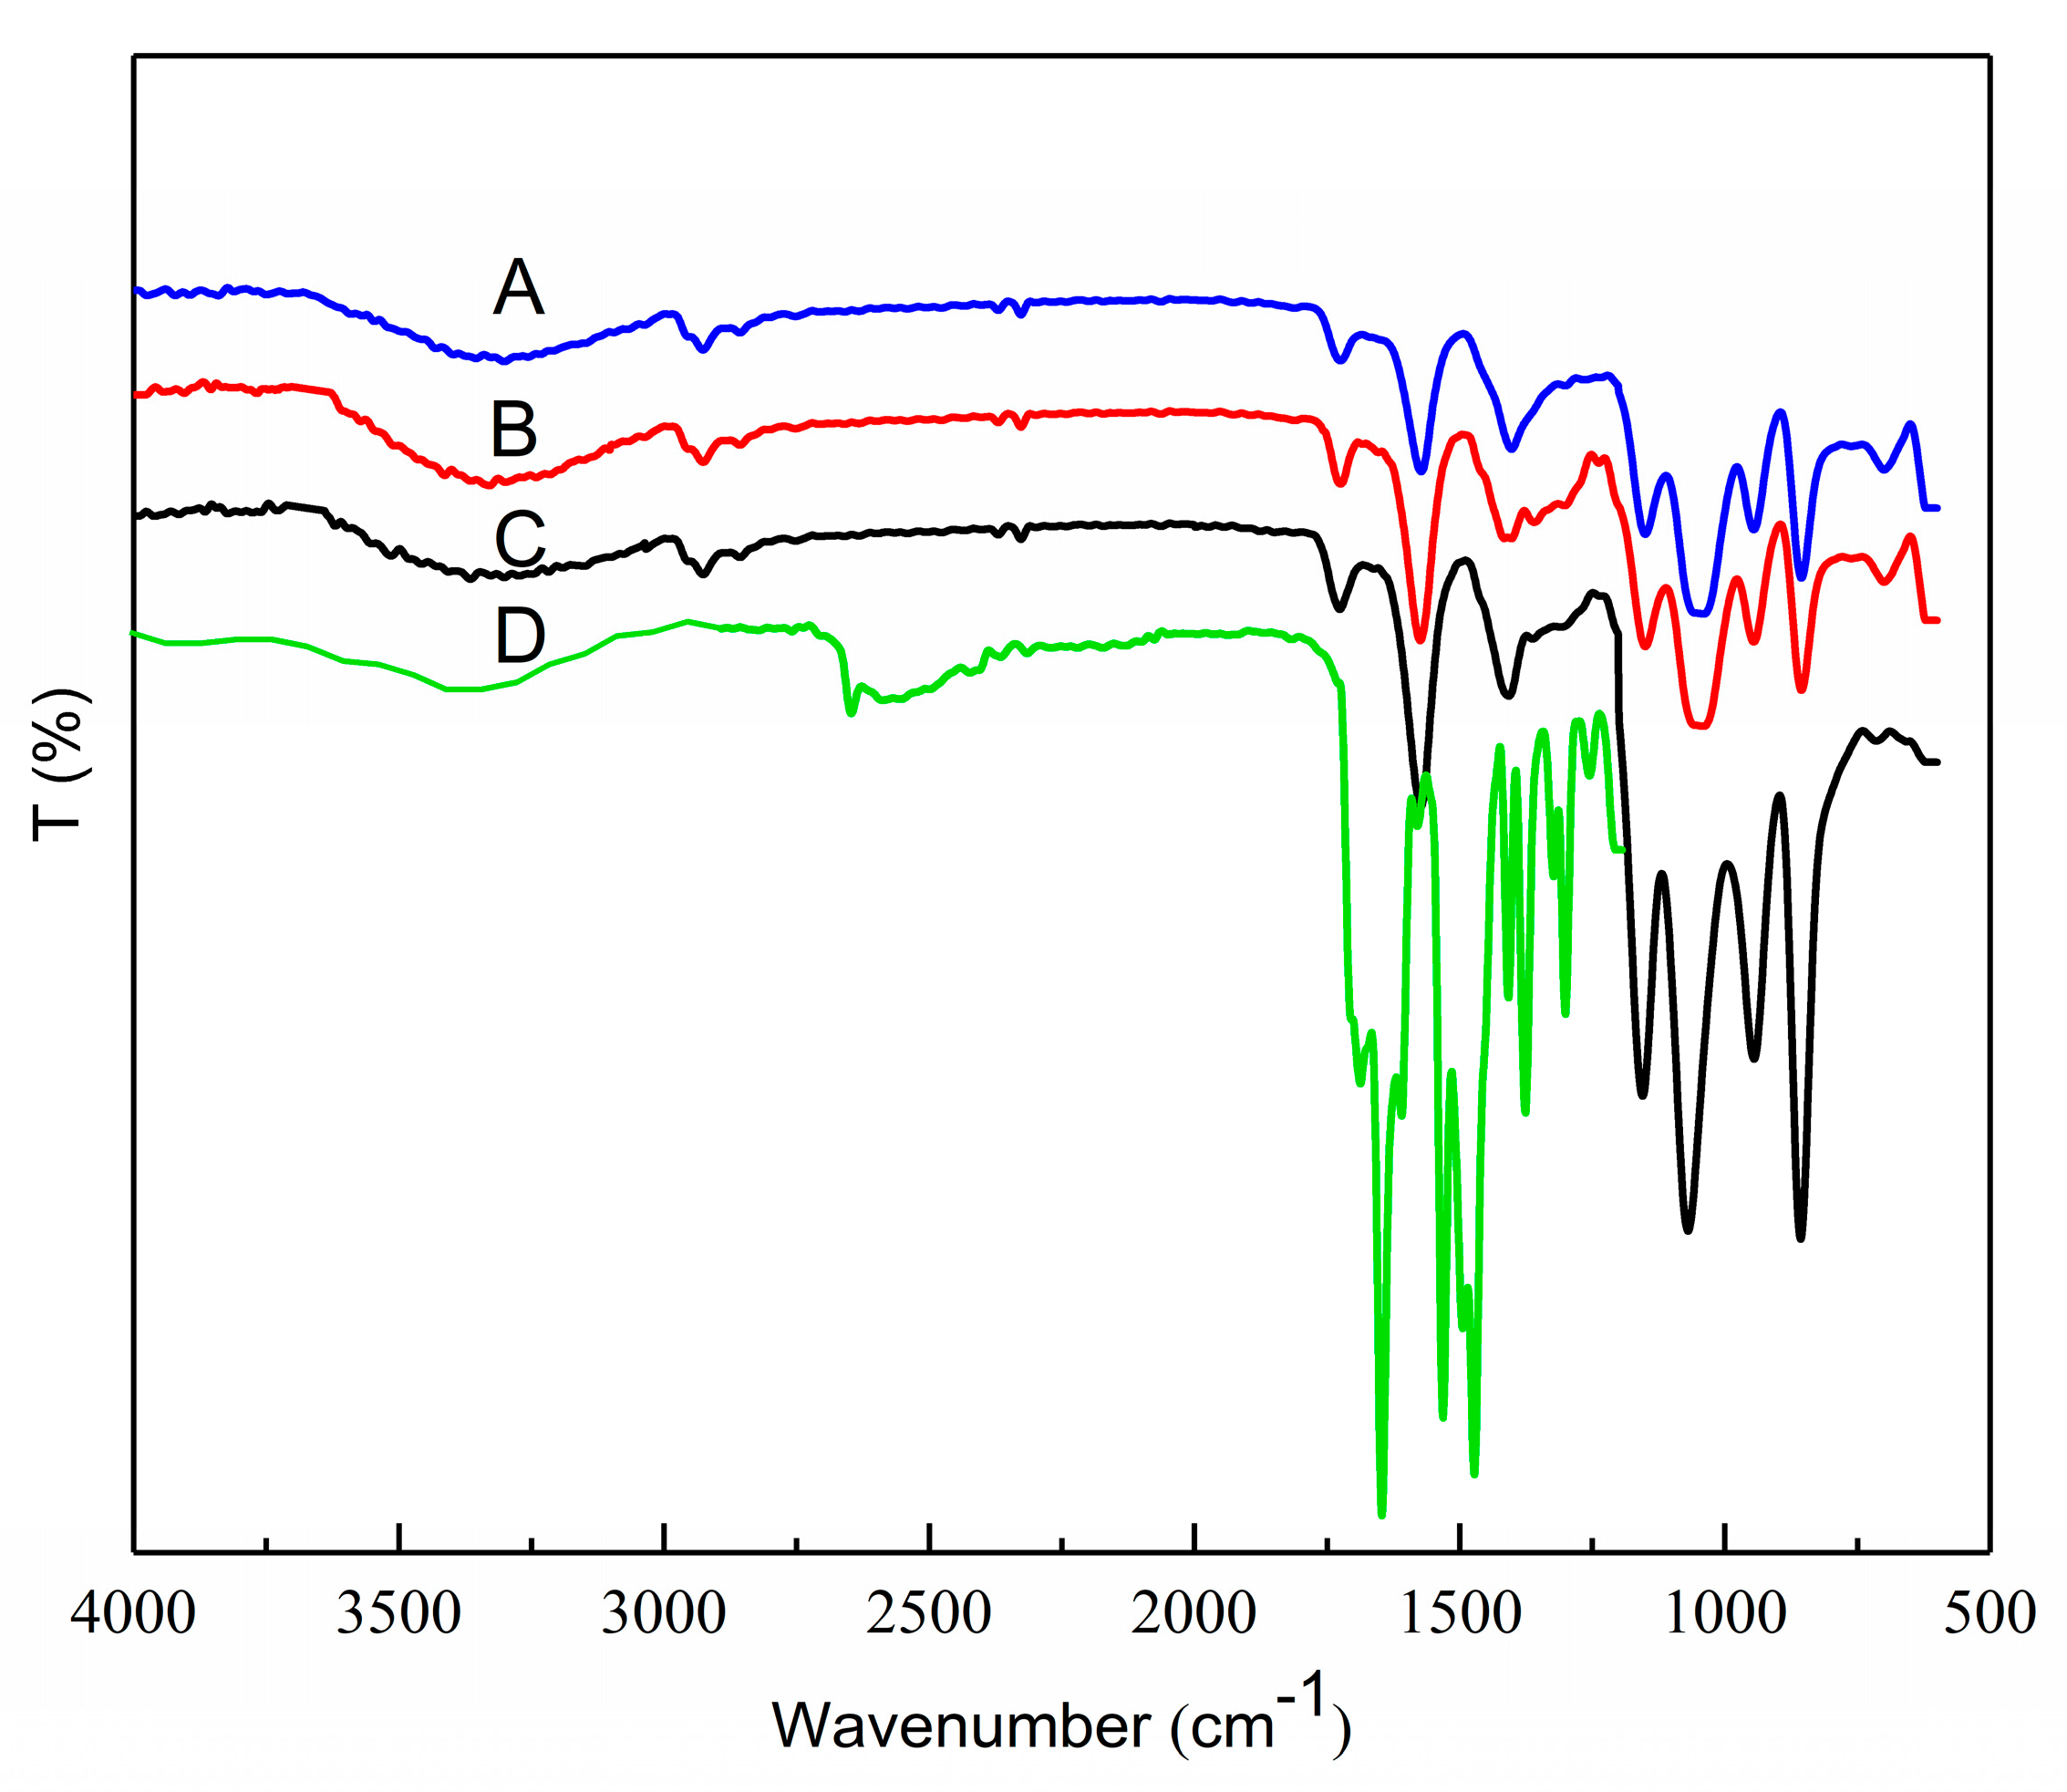
3.5. FTIR Analysis
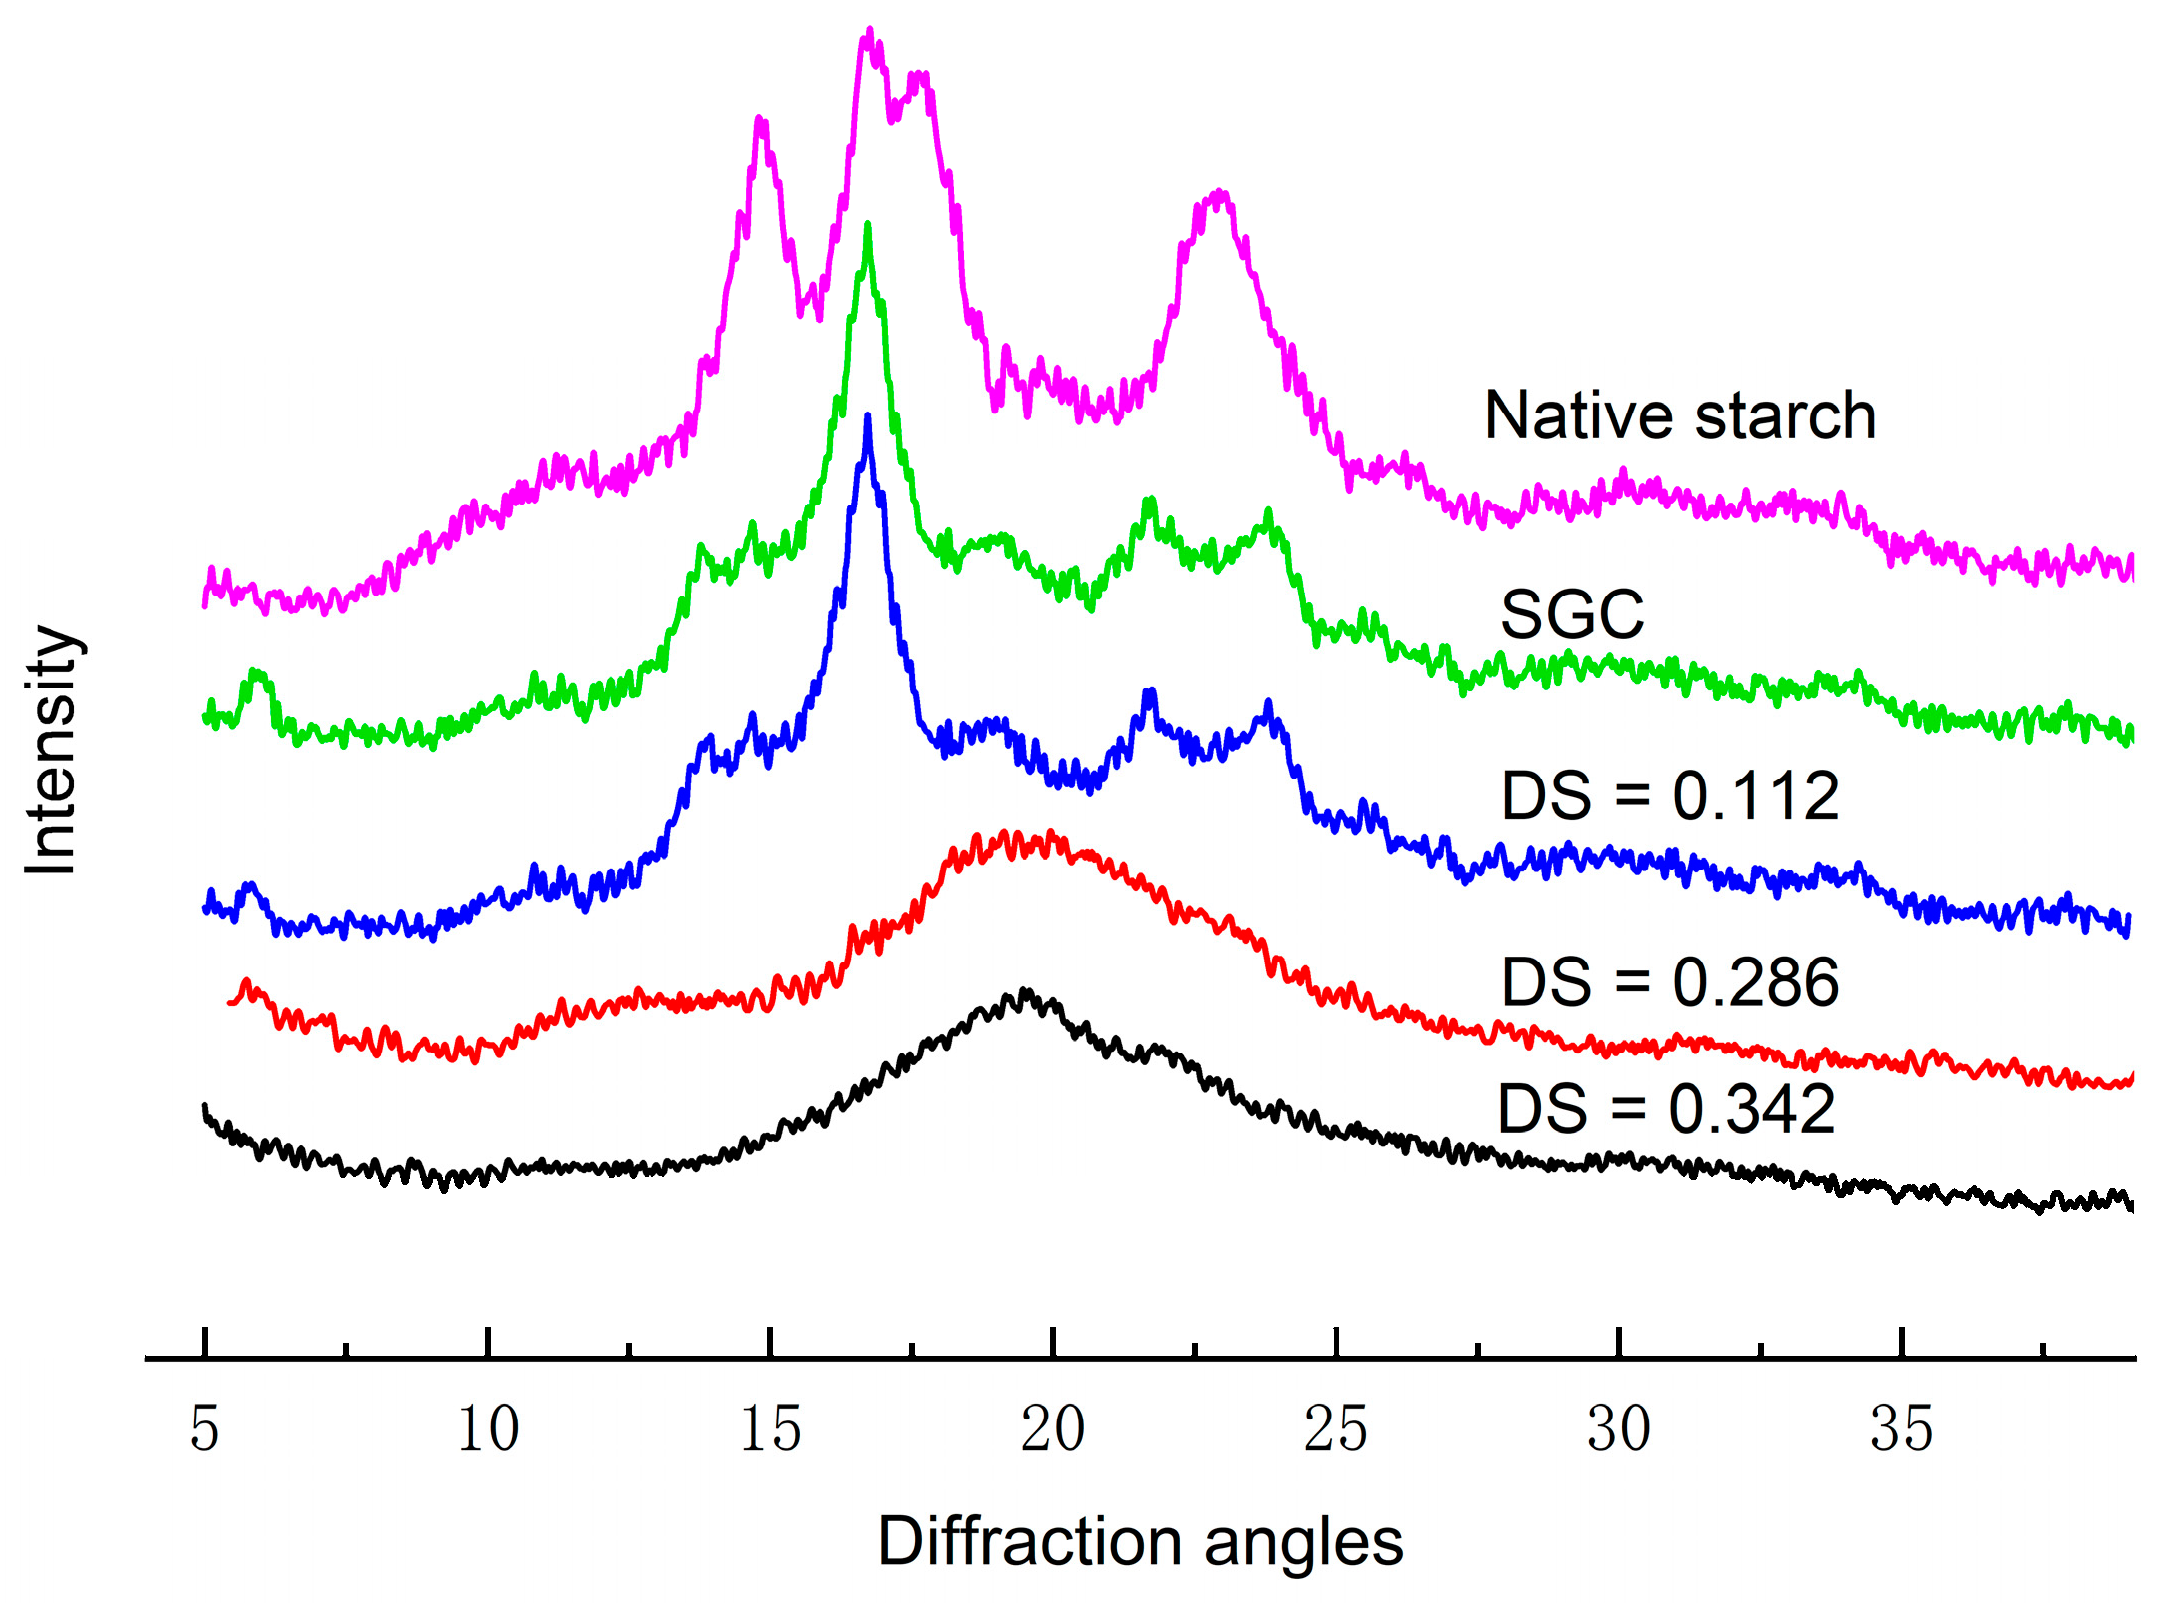
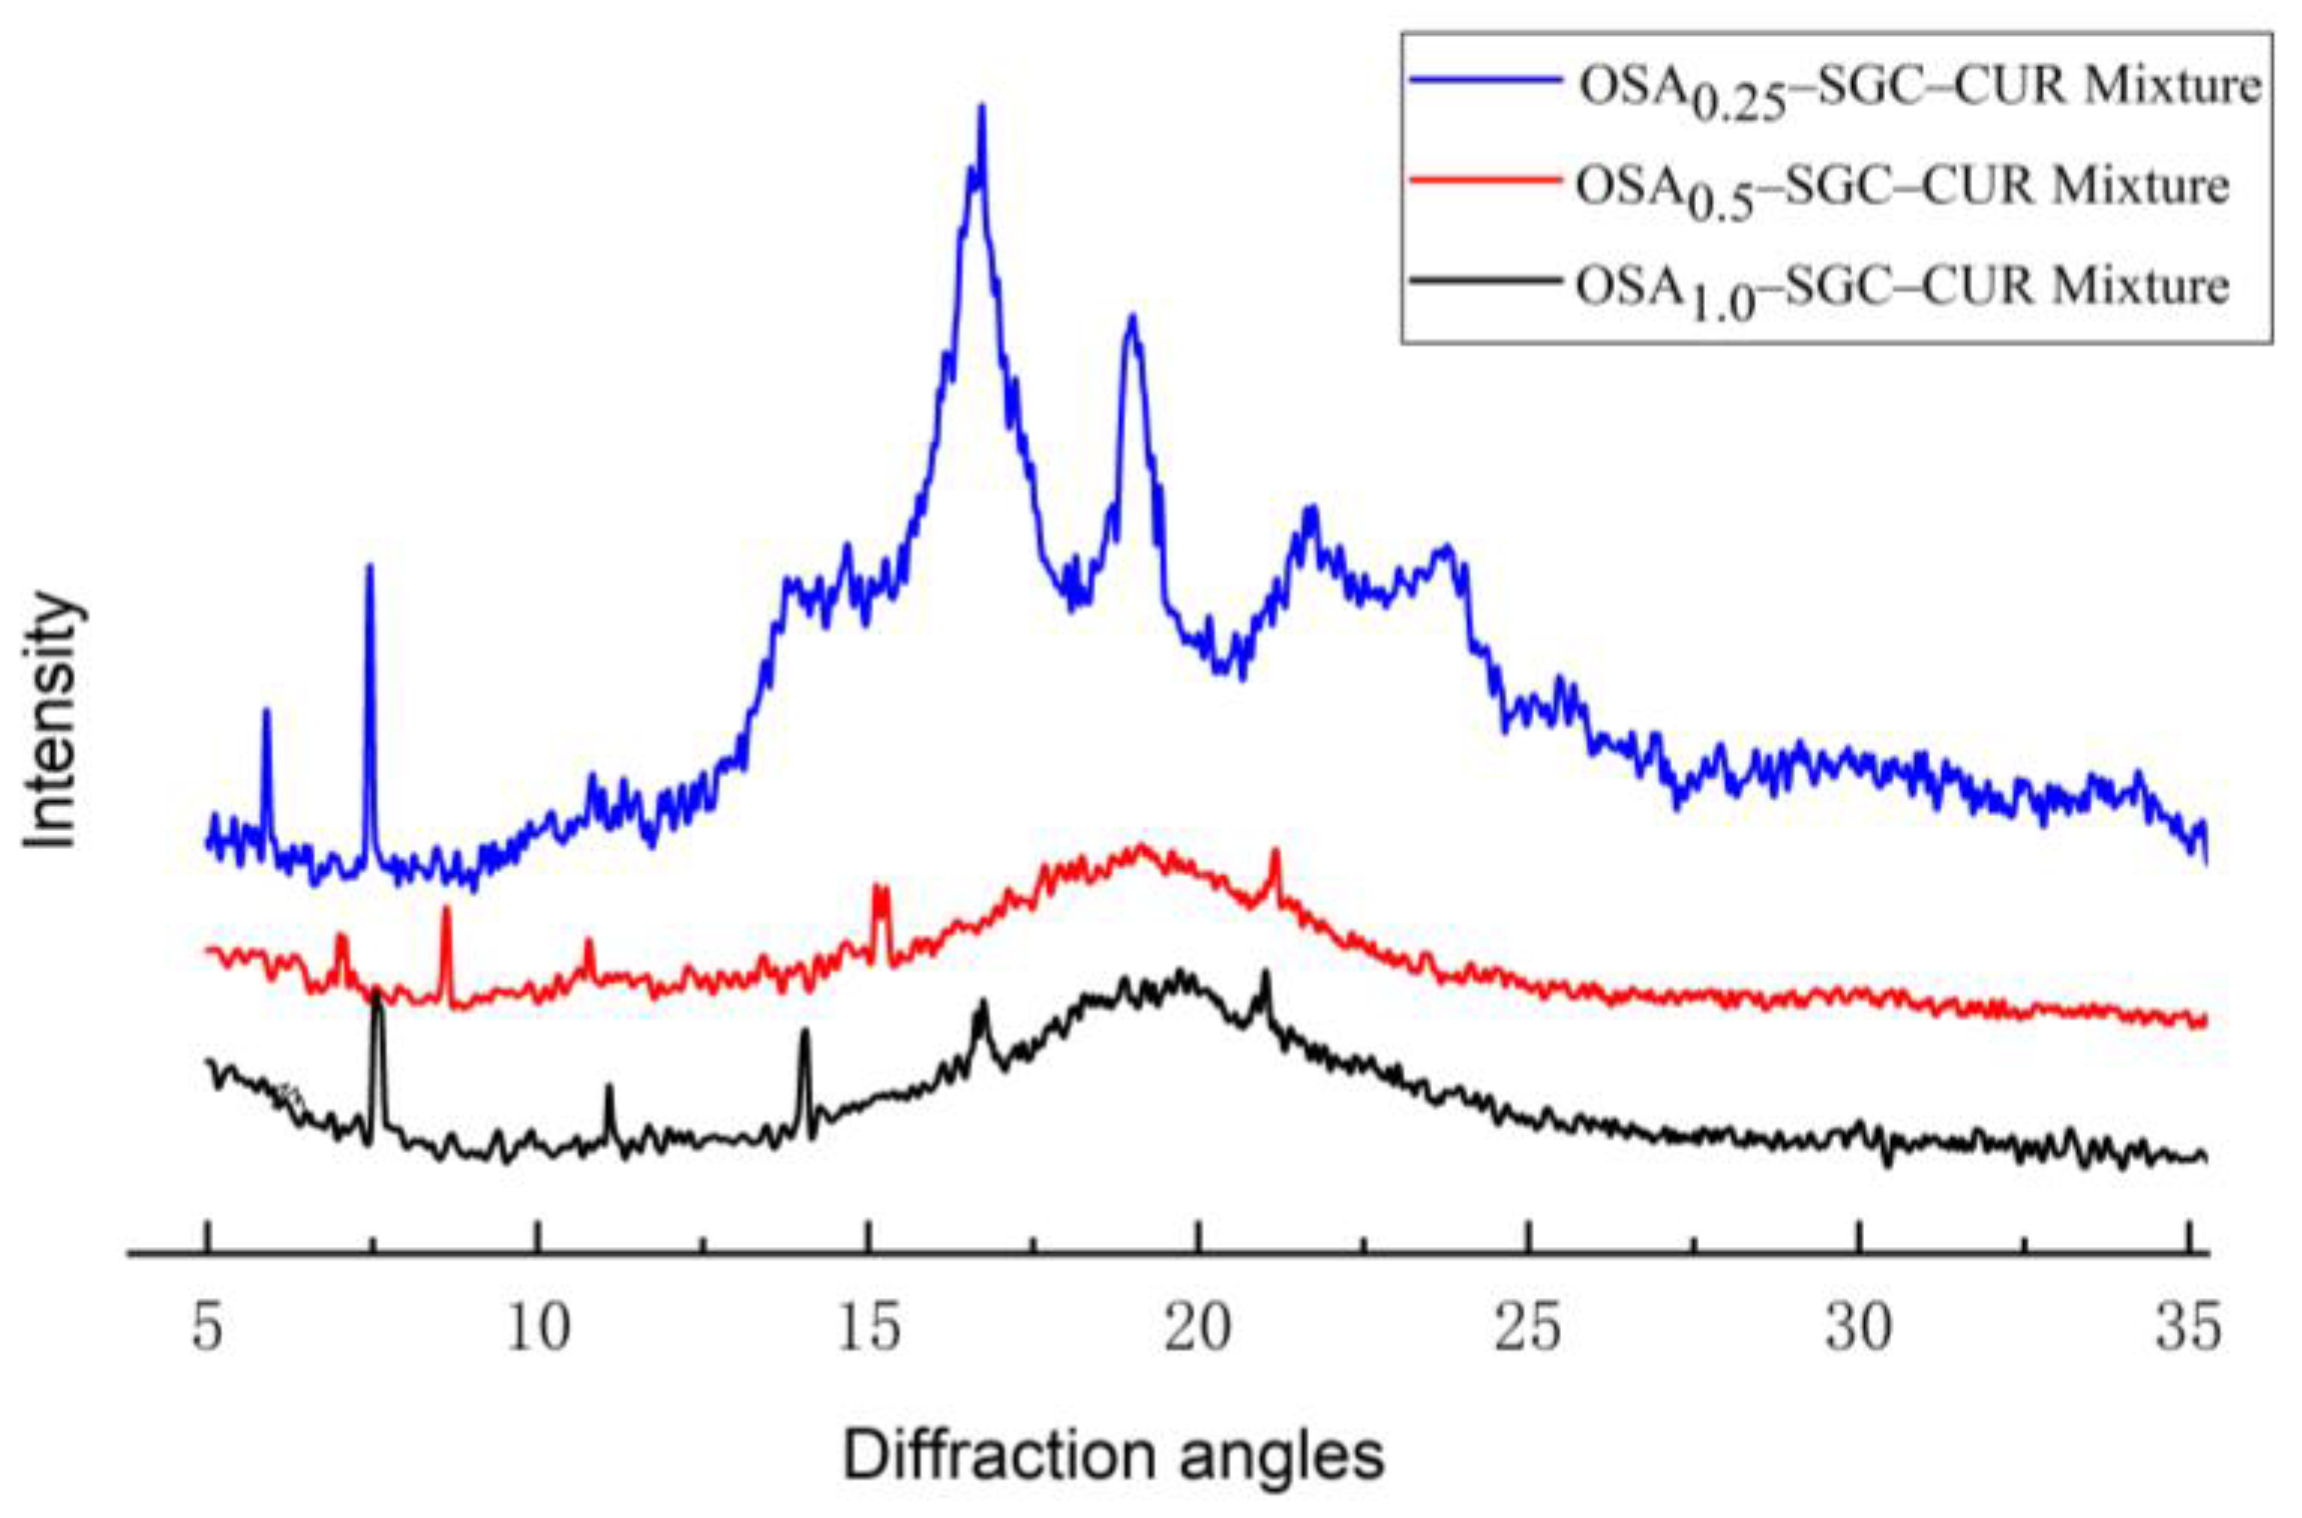
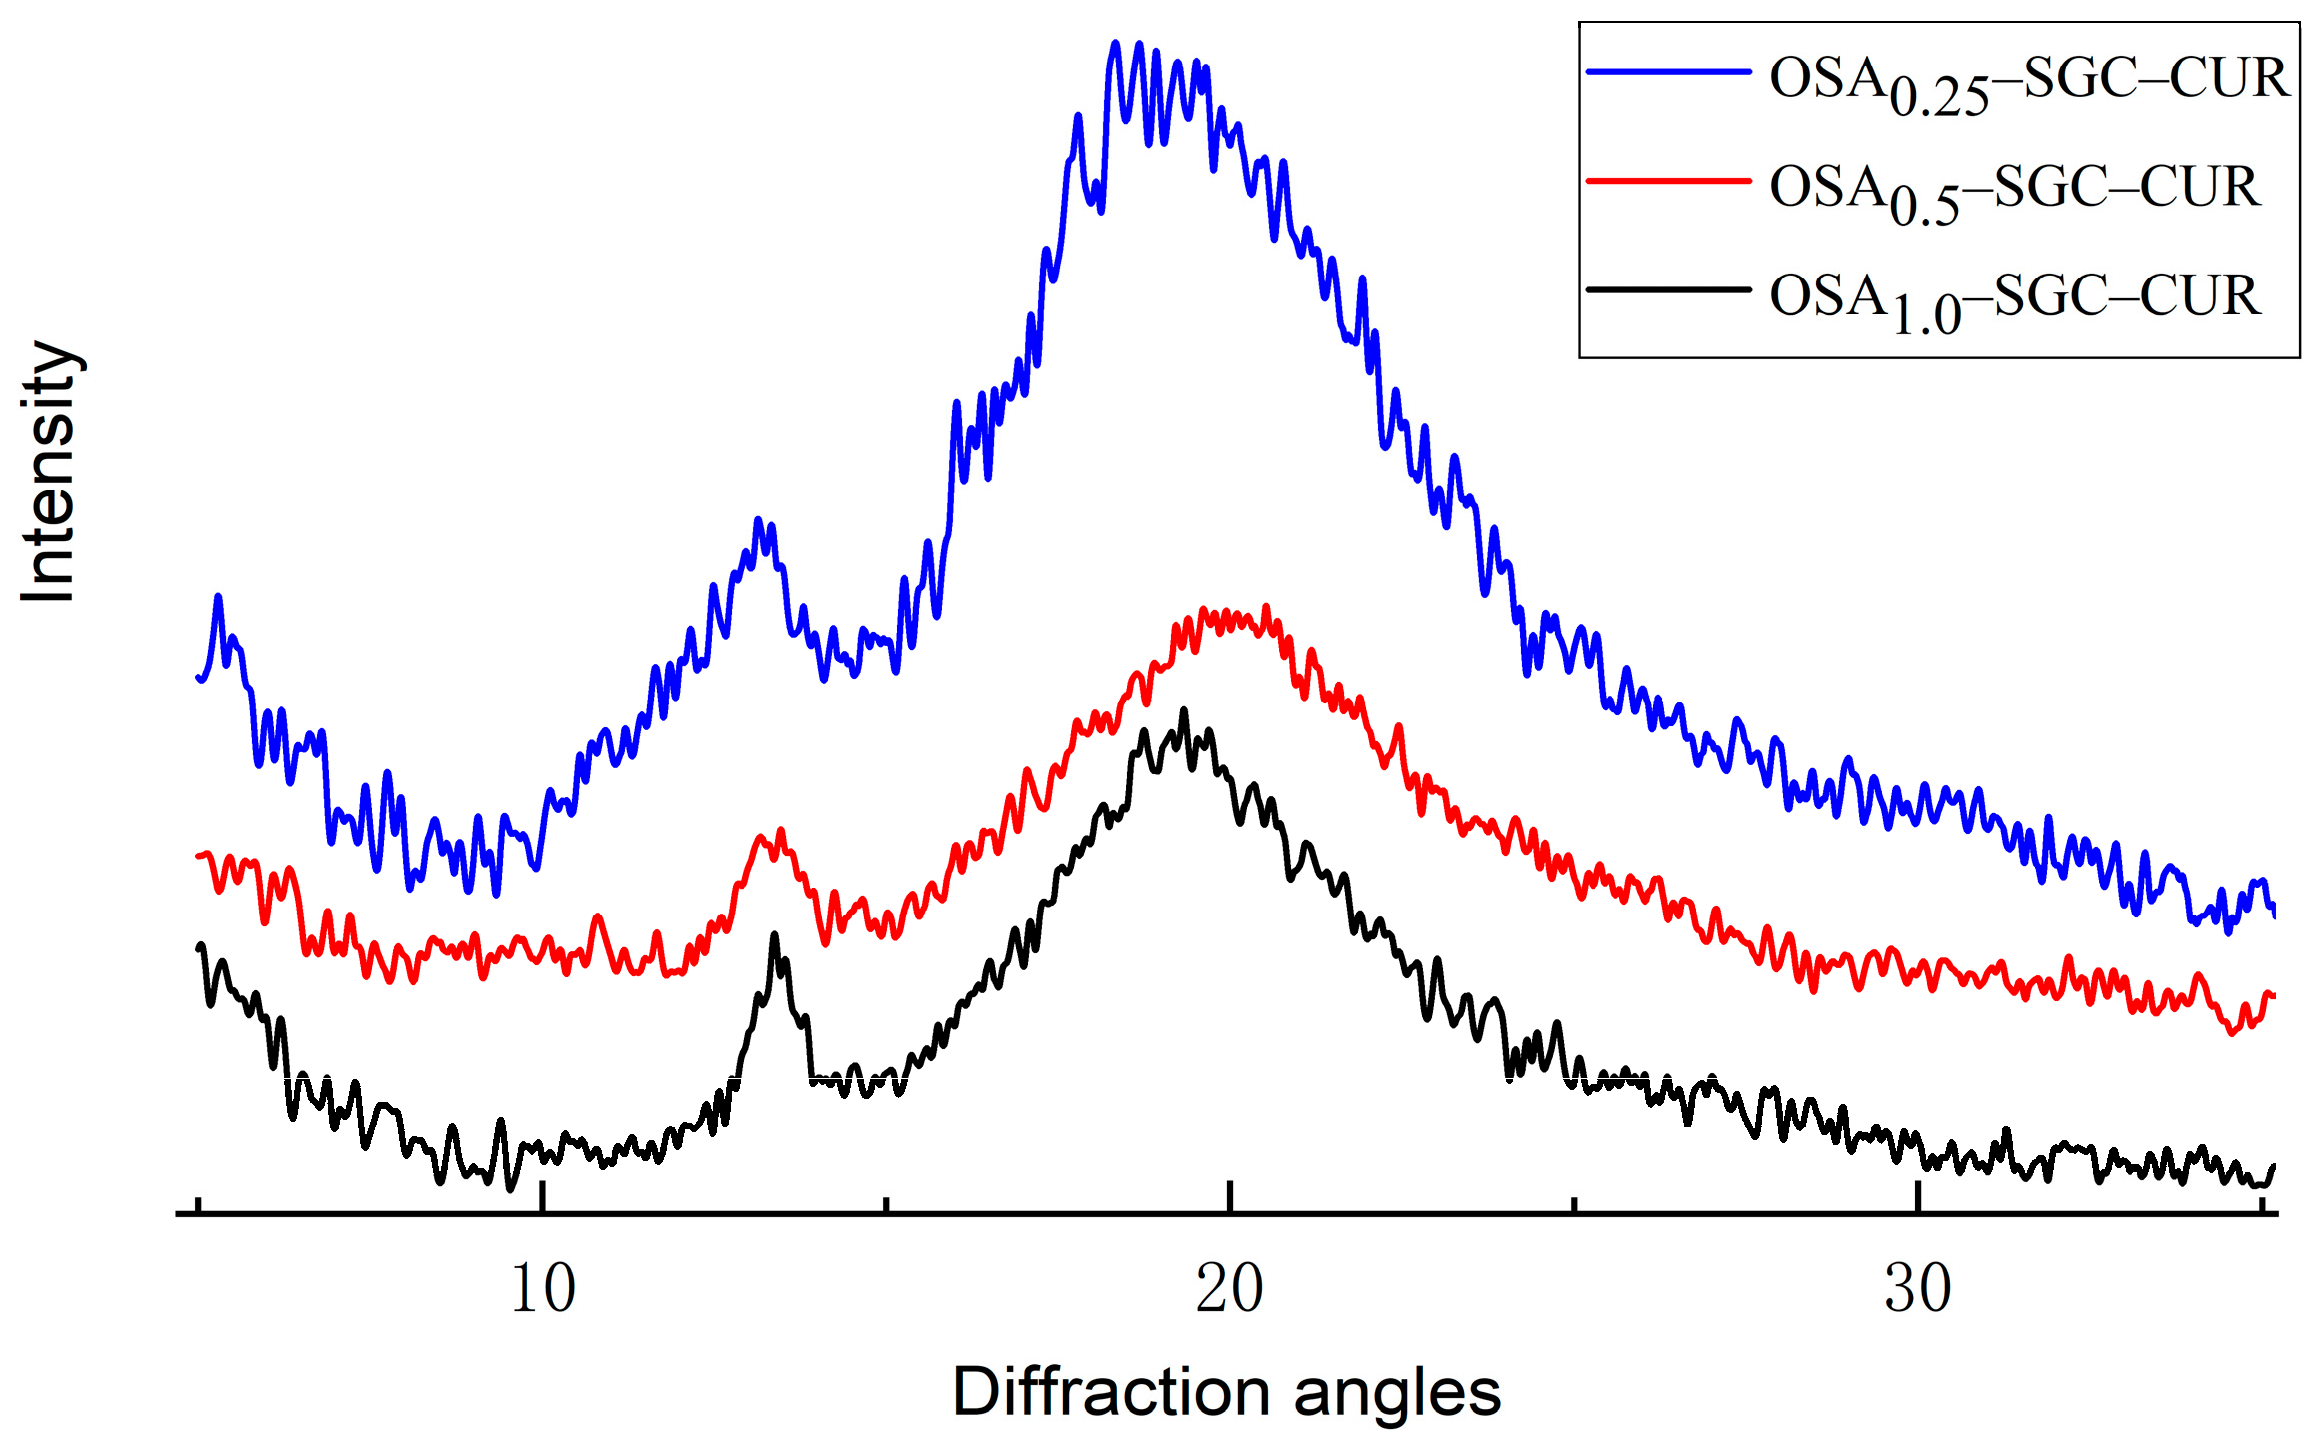
3.6. X-ray Diffraction Analysis
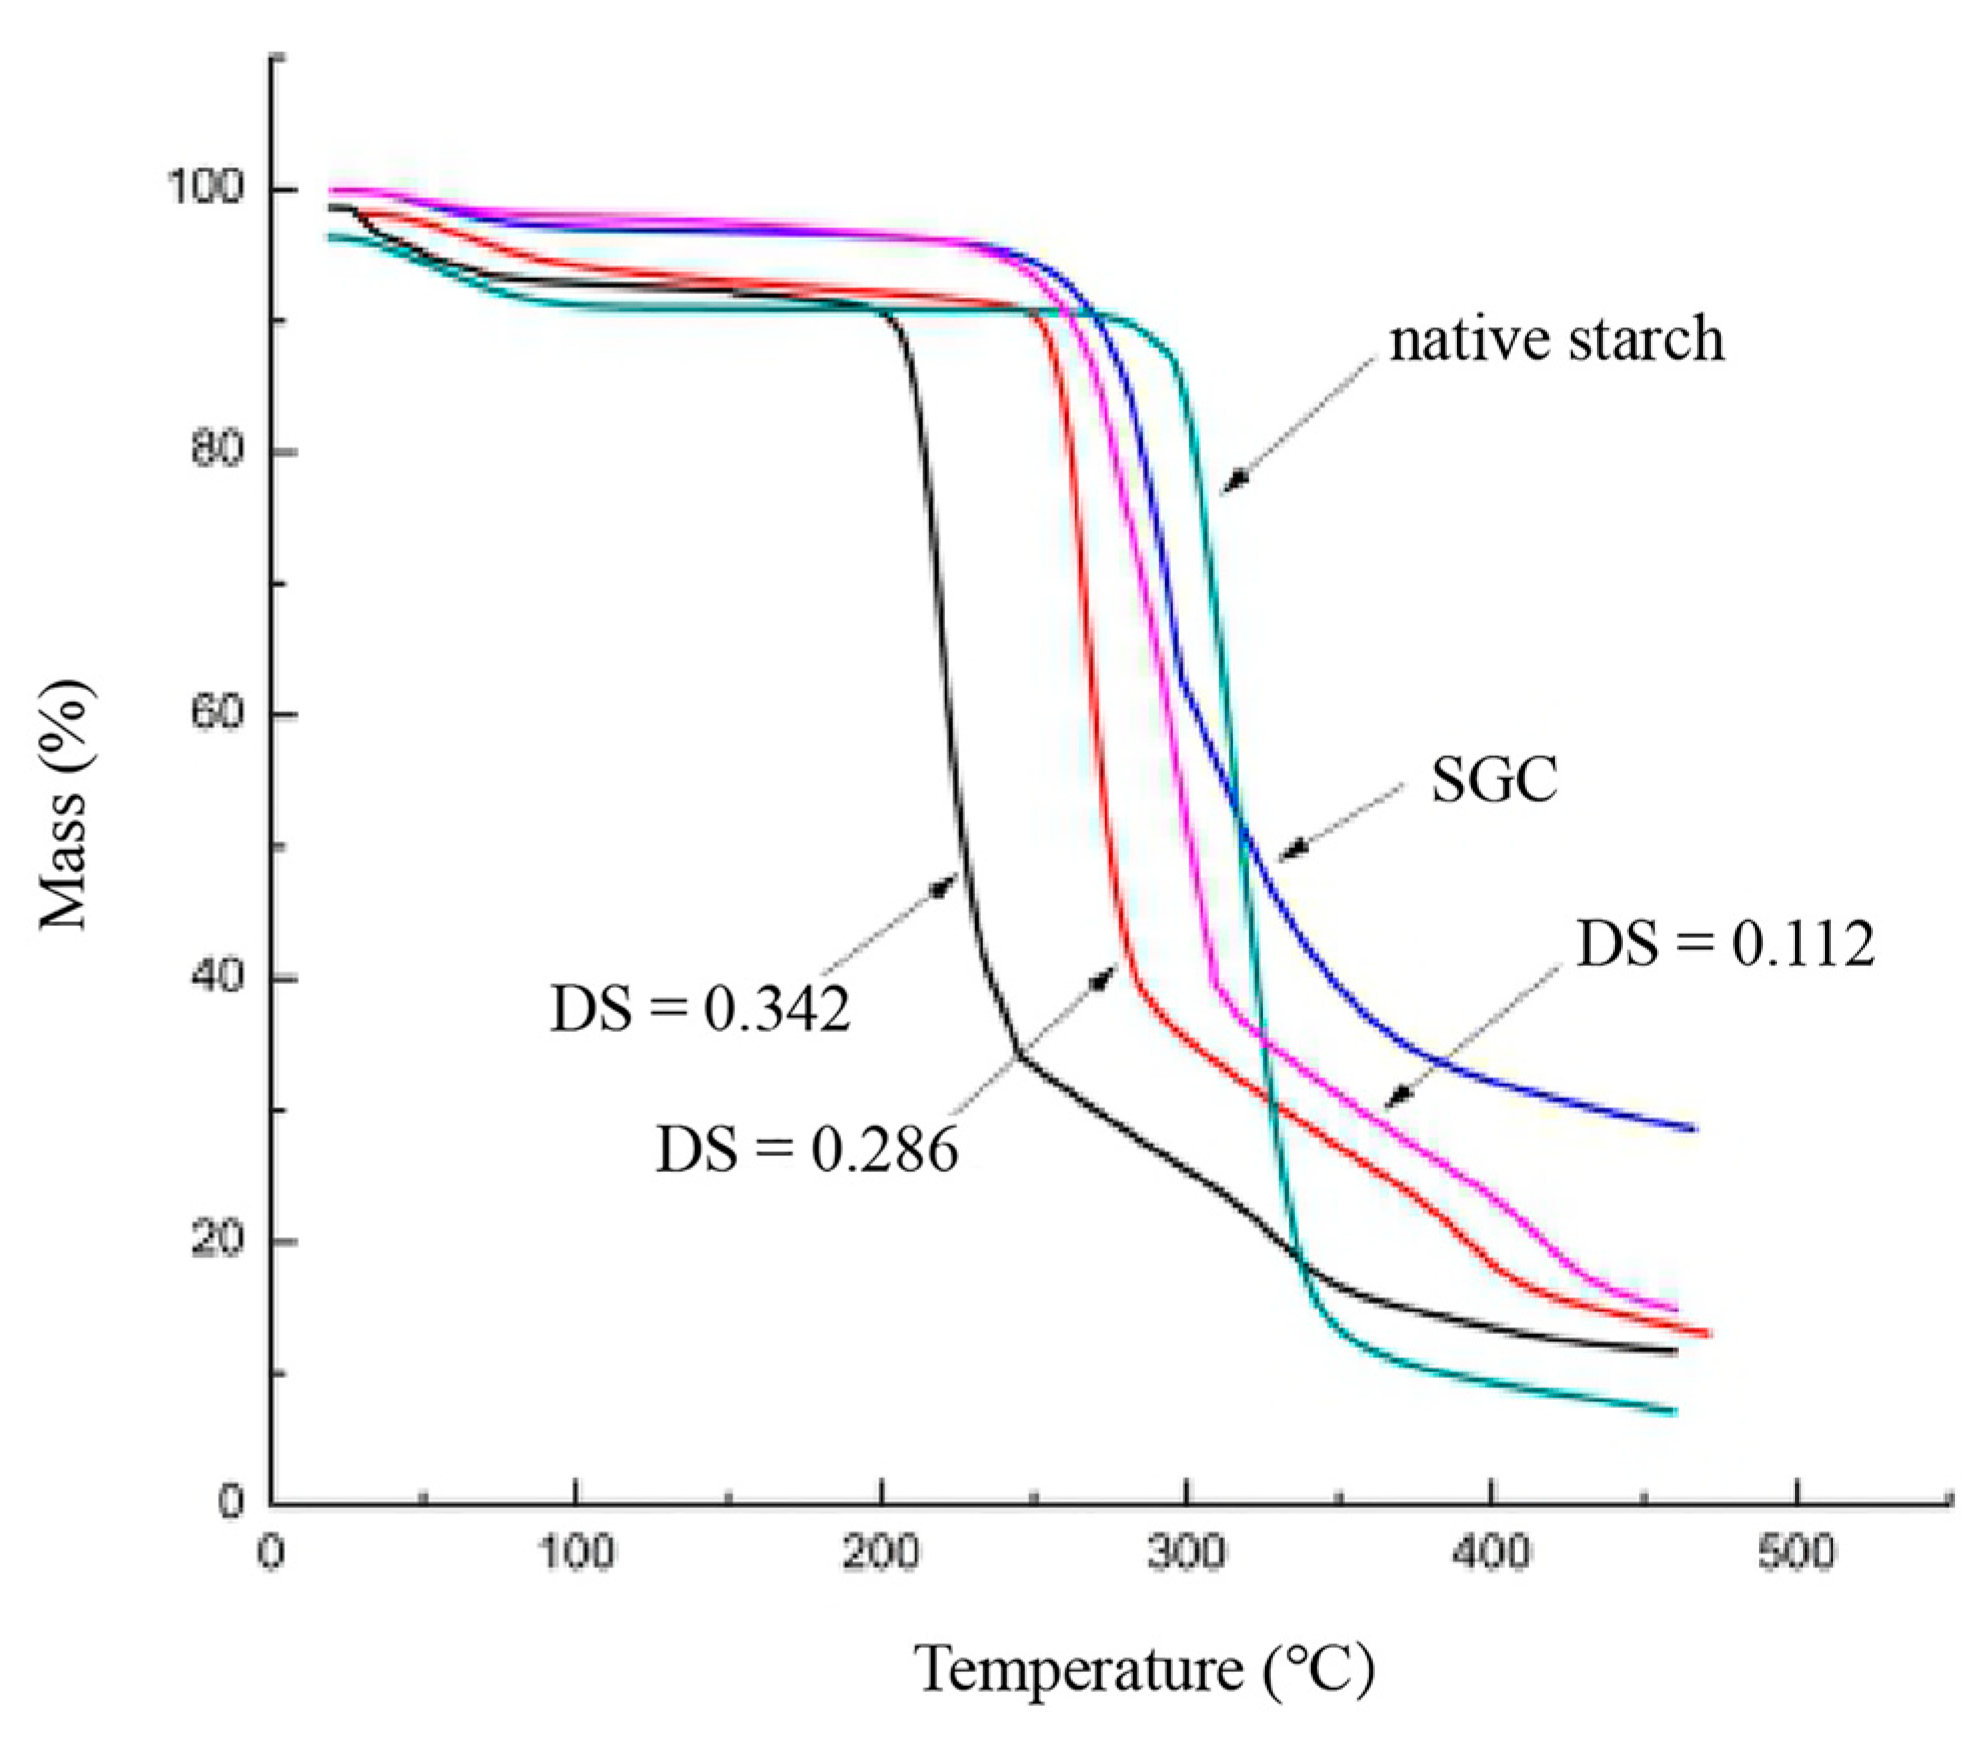
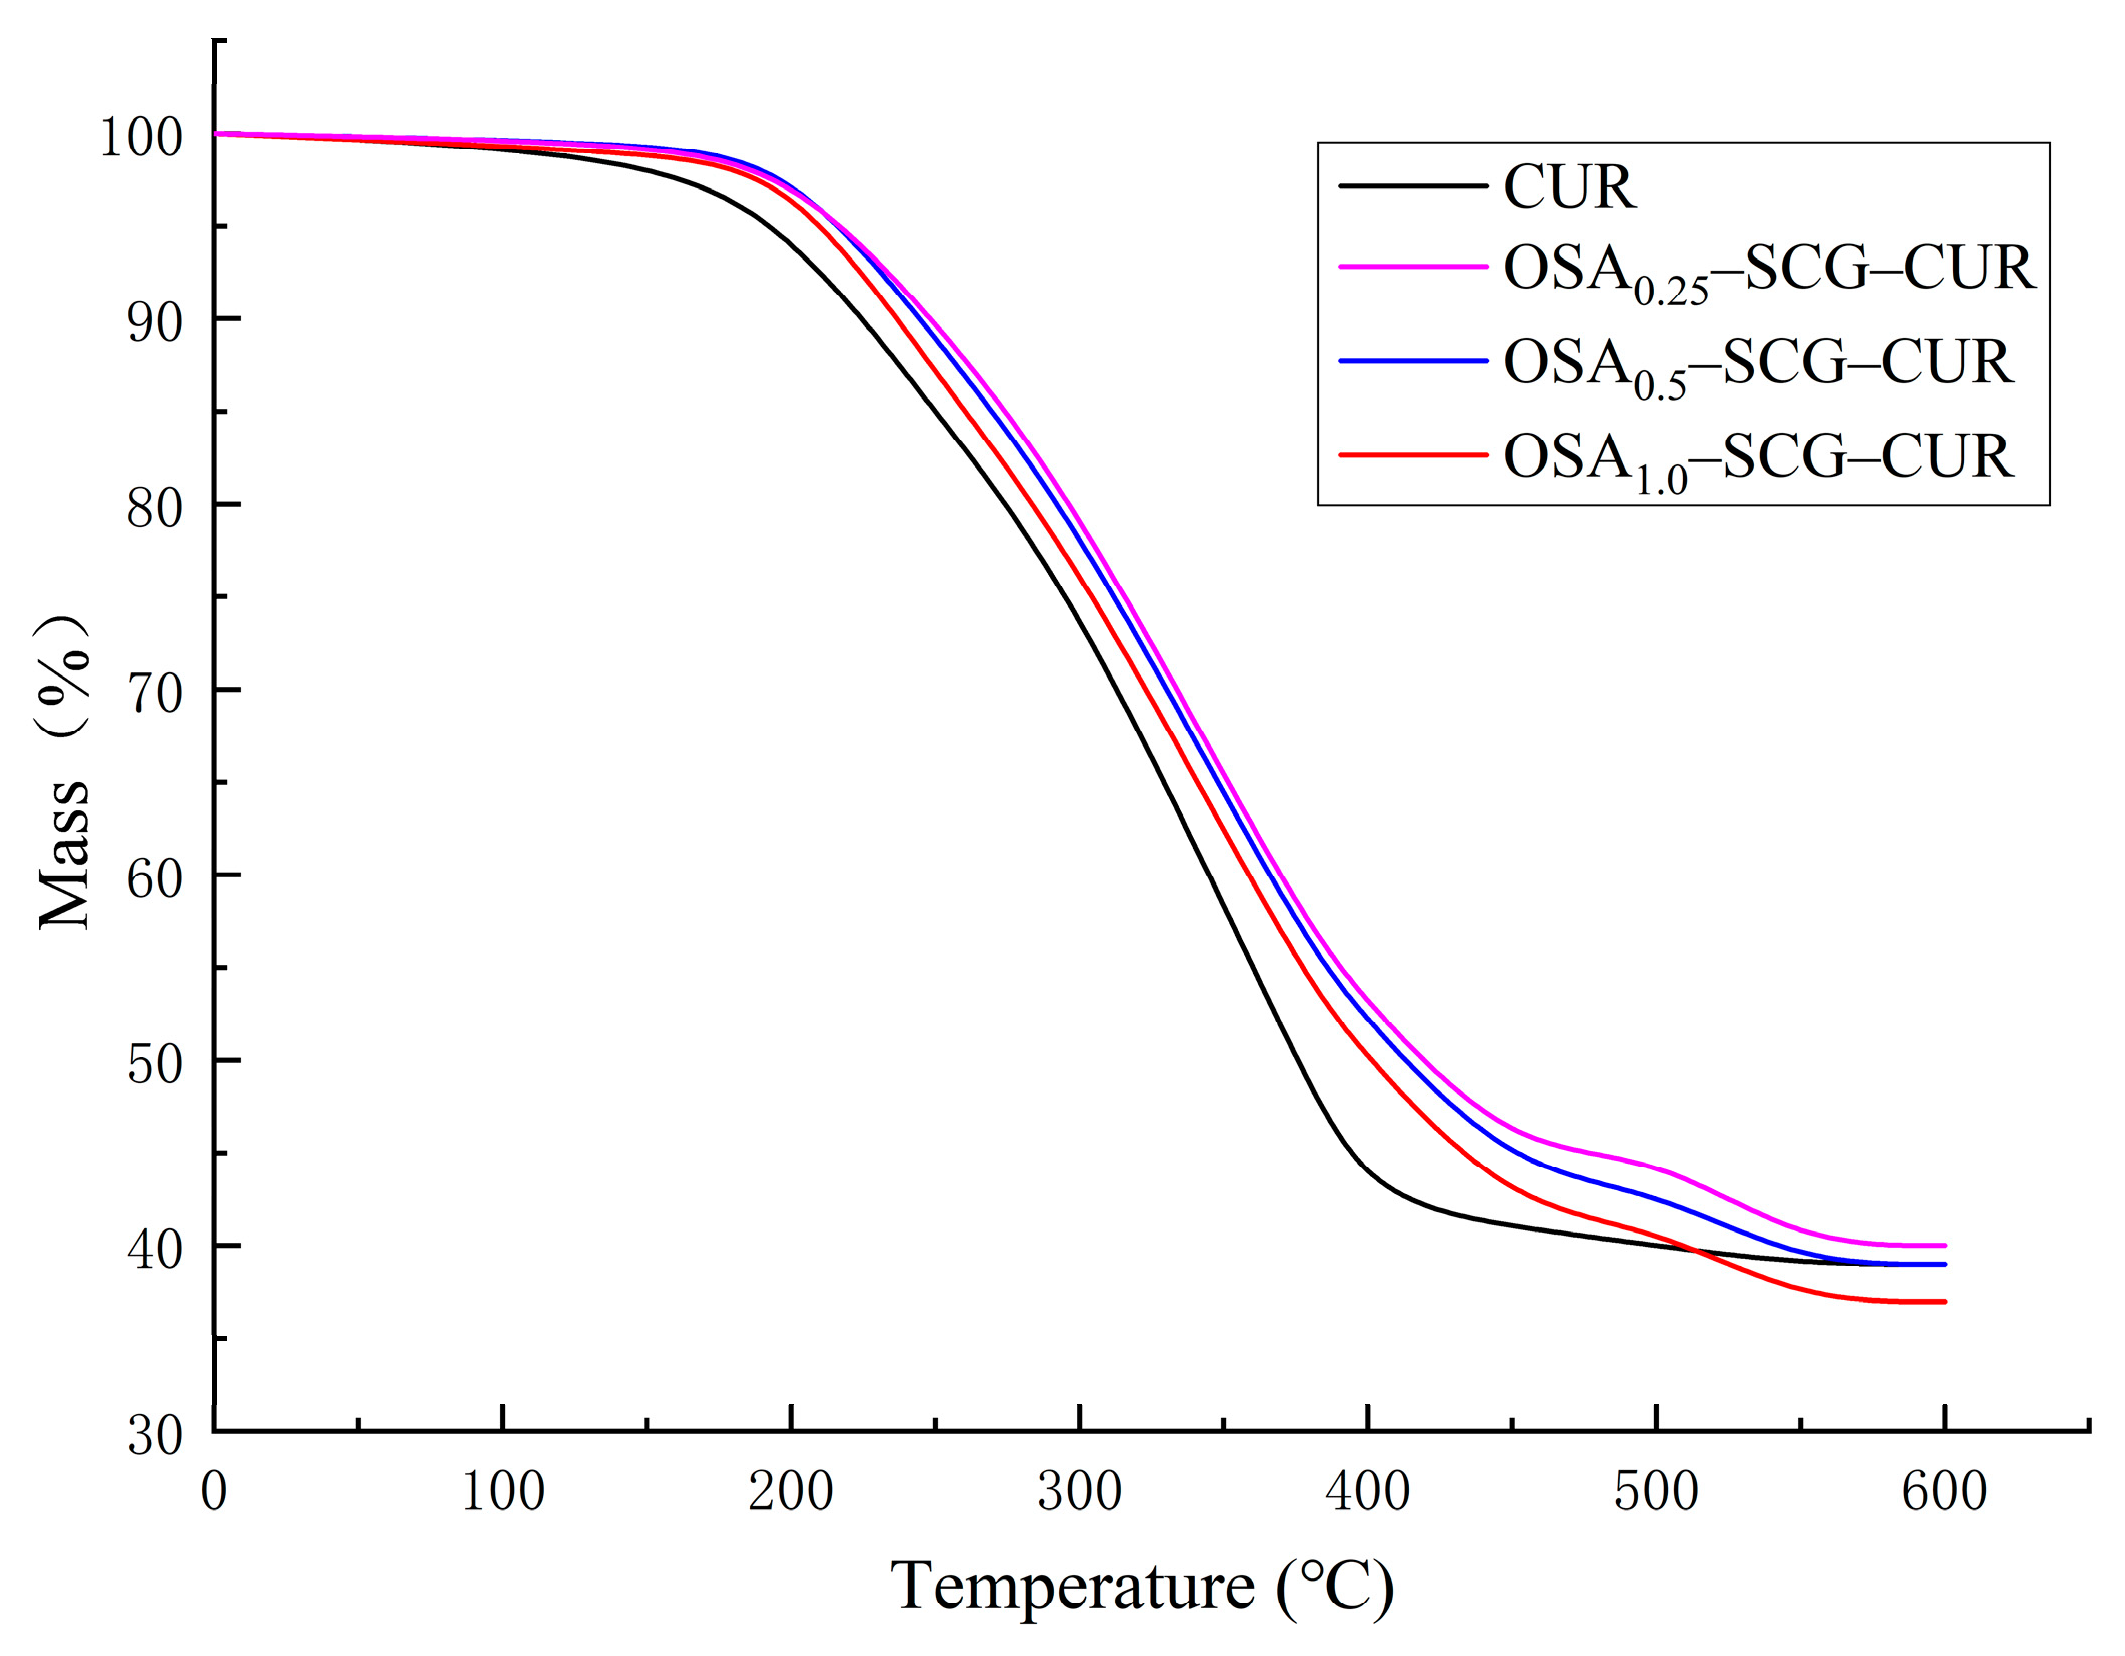
3.7. TGA Analysis
3.8. Transmission Electron Microscopy (TEM)
3.9. Curcumin Release: In Vitro Simulation
4. Conclusions
Author Contributions
Funding
Acknowledgments
Conflicts of Interest
References
- Zhang, B.; Chen, L.; Zhao, Y.; Li, X. Structure and enzymatic resistivity of debranched high temperature–pressure treated high-amylose corn starch. J. Cereal Sci. 2013, 57, 348–355. [Google Scholar] [CrossRef]
- Jobling, S. Improving starch for food and industrial applications. Curr. Opin. Plant Boil. 2004, 7, 210–218. [Google Scholar] [CrossRef] [PubMed]
- Cai, L.; Shi, Y.-C. Preparation, structure, and digestibility of crystalline A- and B-type aggregates from debranched waxy starches. Carbohydr. Polym. 2014, 105, 341–350. [Google Scholar] [CrossRef] [PubMed]
- Witt, T.; Doutch, J.; Gilbert, E.P.; Gilbert, R.G. Relations between Molecular, Crystalline, and Lamellar Structures of Amylopectin. Biomacromolecules 2012, 13, 4273–4282. [Google Scholar] [CrossRef] [PubMed]
- Sweedman, M.C.; Tizzotti, M.J.; Schäfer, C.; Gilbert, R.G. Structure and physicochemical properties of octenyl succinic anhydride modified starches: A review. Carbohydr. Polym. 2013, 92, 905–920. [Google Scholar] [CrossRef] [PubMed]
- Wang, X.; Yuan, Y.; Yue, T. The application of starch-based ingredients in flavor encapsulation. Starch Stärke 2015, 67, 225–236. [Google Scholar] [CrossRef]
- Liu, W.; Hong, Y.; Gu, Z.; Cheng, L.; Li, Z.; Li, C. In Structure and in- vitro digestibility of waxy corn starch debranched by pullulanase. Food Hydrocoll. 2016, 67, 104–110. [Google Scholar] [CrossRef]
- Reddy, C.K.; Lee, D.J.; Lim, S.T.; Park, E.Y. Enzymatic debranching of starches from different botanical sources for complex formation with stearic acid. Food Hydrocoll. 2019, 89, 856–863. [Google Scholar] [CrossRef]
- Pizzo, P.; Scapin, C.; Vitadello, M.; Florean, C.; Gorza, L. Grp94 acts as a mediator of curcumin-induced antioxidant defence in myogenic cells. J. Cell. Mol. Med. 2010, 14, 970–981. [Google Scholar] [CrossRef]
- Sugiyama, Y.; Kawakishi, S.; Osawa, T. Involvement of the beta-diketone moiety in the antioxidative mechanism of tetrahydrocurcumin. Biochem. Pharmacol. 1996, 52, 519–525. [Google Scholar] [CrossRef]
- Srimal, R.C.; Dhawan, B.N. Pharmacology of diferuloyl methane (curcumin), a non-steroidal anti-inflammatory agent. J. Pharm. Pharmacol. 2011, 25, 447–452. [Google Scholar] [CrossRef]
- Aggarwal, B.B.; Harikumar, K.B.; Altucci, L.; Stunneberg, H.G. Potential therapeutic effects of curcumin, the anti-inflammatory agent, against neurodegenerative, cardiovascular, pulmonary, metabolic, autoimmune and neoplastic diseases. Int. J. Biochem. Cell Biol. 2009, 41, 40–59. [Google Scholar] [CrossRef]
- Lee, Y.K.; Lee, W.S.; Hwang, J.T.; Kwon, D.Y.; Surh, Y.J.; Park, O.J. Curcumin exerts antidifferentiation effect through AMPKalpha-PPAR-gamma in 3T3-L1 adipocytes and antiproliferatory effect through AMPKalpha-COX-2 in cancer cells. J. Agric. Food Chem. 2009, 57, 305–310. [Google Scholar] [CrossRef]
- Jordan, W.C.; Drew, C.R. Curcumin—A natural herb with anti-HIV activity. J. Natl. Med Assoc. 1996, 88, 333. [Google Scholar]
- Wang, X.; Li, X.; Chen, L.; Xie, F.; Yu, L.; Li, B. Preparation and characterisation of octenyl succinate starch as a delivery carrier for bioactive food components. Food Chem. 2011, 126, 1218–1225. [Google Scholar] [CrossRef]
- Wang, L.; Xu, X.; Zhang, Y.; Zhang, Y.; Zhu, Y.; Shi, J.; Sun, Y.; Huang, Q. Encapsulation of curcumin within poly(amidoamine) dendrimers for delivery to cancer cells. J. Mater. Sci. Mater. Electron. 2013, 24, 2137–2144. [Google Scholar] [CrossRef]
- Gutierrez, J.K.T.; Zanatta, G.C.; Ortega, A.L.M.; Balastegui, M.I.C.; Sanitá, P.V.; Pavarina, A.C.; Barbugli, P.A.; Mima, E.G.D.O. Encapsulation of curcumin in polymeric nanoparticles for antimicrobial Photodynamic Therapy. PLoS ONE 2017, 12, e0187418. [Google Scholar] [CrossRef]
- Marefati, A.; Bertrand, M.; Sjöö, M.; Dejmek, P.; Rayner, M. Storage and digestion stability of encapsulated curcumin in emulsions based on starch granule Pickering stabilization. Food Hydrocoll. 2017, 63, 309–320. [Google Scholar] [CrossRef]
- Janaswamy, S.; Youngren, S.R. Hydrocolloid-based nutraceutical delivery systems. Food Funct. 2012, 3, 503–507. [Google Scholar] [CrossRef]
- Yu, H.L.; Huang, Q.R. Enhanced in vitro anti-cancer activity of curcumin encapsulated in hydrophobically modified starch. Food Chem. 2010, 119, 669–674. [Google Scholar] [CrossRef]
- Paramita, V.; Furuta, T.; Yoshii, H. High-Oil-Load Encapsulation of Medium-Chain Triglycerides and d-Limonene Mixture in Modified Starch by Spray Drying. J. Food Sci. 2012, 77, E38–E44. [Google Scholar] [CrossRef]
- Sun, Q.; Li, G.; Dai, L.; Ji, N.; Xiong, L. Green preparation and characterisation of waxy maize starch nanoparticles through enzymolysis and recrystallisation. Food Chem. 2014, 162, 223–228. [Google Scholar] [CrossRef]
- Tizzotti, M.J.; Sweedman, M.C.; Tang, D.; Schaefer, C.; Gilbert, R.G. New1H NMR Procedure for the Characterization of Native and Modified Food-Grade Starches. J. Agric. Food Chem. 2011, 59, 6913–6919. [Google Scholar] [CrossRef]
- Tizzotti, M.J.; Sweedman, M.C.; Schäfer, C.; Gilbert, R.G. The influence of macromolecular architecture on the critical aggregation concentration of large amphiphilic starch derivatives. Food Hydrocoll. 2013, 31, 365–374. [Google Scholar] [CrossRef]
- Chang, R.; Yang, J.; Ge, S.; Zhao, M.; Liang, C.; Xiong, L.; Sun, Q. Synthesis and self-assembly of octenyl succinic anhydride modified short glucan chains based amphiphilic biopolymer: Micelles, ultrasmall micelles, vesicles, and lutein encapsulation/release. Food Hydrocoll. 2017, 67, 14–26. [Google Scholar] [CrossRef]
- Bai, Y.; Shi, Y.; Herrera, A.I.; Prakash, O.M. Study of octenyl succinic anhydride-modified waxy maize starch by nuclear magnetic resonance spectroscopy. Carbohydr. Polym. 2011, 83, 407–413. [Google Scholar] [CrossRef]
- Hornig, S.; Heinze, T. Nanoscale structures of dextran esters. Carbohydr. Polym. 2007, 68, 280–286. [Google Scholar] [CrossRef]
- Lu, H.W.; Zhang, L.M.; Wang, C.; Chen, R.F. Preparation and properties of new micellar drug carriers based on hydrophobically modified amylopectin. Carbohydr. Polym. 2011, 83, 1499–1506. [Google Scholar] [CrossRef]
- Brannon-Peppas, L. Recent advances on the use of biodegradable microparticles and nanoparticles in controlled drug delivery. Int. J. Pharm. 1995, 116, 1–9. [Google Scholar] [CrossRef]
- Aditya, N.P.; Shim, M.; Lee, I.; Lee, Y.; Im, M.-H.; Ko, S. Curcumin and Genistein Coloaded Nanostructured Lipid Carriers: in Vitro Digestion and Antiprostate Cancer Activity. J. Agric. Food Chem. 2013, 61, 1878–1883. [Google Scholar] [CrossRef]
- Murúa-Pagola, B.; Beristain-Guevara, C.; Martínez-Bustos, F. Preparation of starch derivatives using reactive extrusion and evaluation of modified starches as shell materials for encapsulation of flavoring agents by spray drying. J. Food Eng. 2009, 91, 380–386. [Google Scholar] [CrossRef]
- Xu, Y.; Huang, Q.; Fu, X.; Jane, J.-L. Modification of starch octenylsuccinate by β-amylase hydrolysis in order to increase its emulsification properties. Food Hydrocoll. 2015, 48, 55–61. [Google Scholar] [CrossRef]
- Zhang, B.; Huang, Q.; Luo, F.-X.; Fu, X.; Jiang, H.; Jane, J.-L. Effects of octenylsuccinylation on the structure and properties of high-amylose maize starch. Carbohydr. Polym. 2011, 84, 1276–1281. [Google Scholar] [CrossRef]
- Liu, Z.; Li, Y.; Cui, F.; Ping, L.; Song, J.; Ravee, Y.; Jin, L.; Xue, Y.; Xu, J.; Li, G.; et al. Production of Octenyl Succinic Anhydride-Modified Waxy Corn Starch and Its Characterization. J. Agric. Food Chem. 2008, 56, 11499–11506. [Google Scholar] [CrossRef]
- Darandale, S.S.; Vavia, P. RCyclodextrin-based nanosponges of curcumin: formulation and;physicochemical characterization. J. Incl. Phenom. Macrocycl. Chem. 2013, 75, 315–322. [Google Scholar] [CrossRef]
- Čížová, A.; Sroková, I.; Sasinková, V.; Malovíková, A.; Ebringerová, A. Carboxymethyl Starch Octenylsuccinate: Microwave- and Ultrasound-assisted Synthesis and Properties. Starch Stärke 2010, 60, 389–397. [Google Scholar] [CrossRef]
- Yan-Rui, G.E.; Wang, K.T.; Feng, W. Study on the Preparation of β-cyclodextrin Microcapsulation of Rose Perfume. J. Hebei Univ. Sci. Technol. 2004, 25, 14–17. [Google Scholar]
- Bao, J.; Xing, J.; Phillips, D.L.; Corke, H. Physical Properties of Octenyl Succinic Anhydride Modified Rice, Wheat, and Potato Starches. J. Agric. Food Chem. 2003, 51, 2283–2287. [Google Scholar] [CrossRef]
- Park, I.; Kim, Y.K.; Kim, B.H.; Moon, T.W. Encapsulated amylosucrase-treated starch with enhanced thermal stability: Preparation and susceptibility to digestion. Starch Stärke 2014, 66, 216–224. [Google Scholar] [CrossRef]
- Saha, A.; Paira, T.K.; Biswas, M.; Jana, S.; Banerjee, S.; Mandal, T.K. Combined atom-transfer radical polymerization and ring-opening polymerization to design polymer-polypeptide copolymer conjugates toward self-aggregated hybrid micro/nanospheres for dye encapsulation. J. Polym. Sci. Part A Polym. Chem. 2015, 53, 2313–2319. [Google Scholar] [CrossRef]
- Liu, Q.; Yang, X.; Xu, H.; Pan, K.; Yang, Y. Novel nanomicelles originating from hydroxyethyl starch-g-polylactide and their release behavior of docetaxel modulated by the PLA chain length. Eur. Polym. J. 2013, 49, 3522–3529. [Google Scholar] [CrossRef]
- Wang, Y.-J.; Pan, M.-H.; Cheng, A.-L.; Lin, L.-I.; Ho, Y.-S.; Hsieh, C.-Y.; Lin, J.-K. Stability of curcumin in buffer solutions and characterization of its degradation products. J. Pharm. Biomed. Anal. 1997, 15, 1867–1876. [Google Scholar] [CrossRef]
- Tonnesen, H.H.; Karlsen, J.; Mostad, A. ChemInform Abstract: Structural Studies of Curcuminoids. Part 1. The Crystal Structure of Curcumin. Chem. Inf. 1982, 13, 13. [Google Scholar] [CrossRef]
- Han, X.Z.; Hamaker, B.R. Slowly Digestable Starch. U.S. Patent 2006257977, 28 1 2004. [Google Scholar]
- Lee, H.M.; Lee, C.C.; Cheng, P.Y. ChemInform Abstract: Recent Development of Functionalized N-Heterocyclic Carbene Ligands: Coordination Chemistry and Catalytic Applications. Curr. Org. Chem. 2010, 11, 1491–1524. [Google Scholar] [CrossRef]



| Sample | DS | RE |
|---|---|---|
| SGC | 0 | 0 |
| OSA0.25–SGC | 0.112 + 0.010 a | 57.93% + 0.20 b |
| OSA0.5–SGC | 0.286 + 0.020 b | 73.97% + 0.28 c |
| OSA1.0–SGC | 0.342 + 0.020 c | 44.22% + 0.26 a |
| Sample | CMC |
|---|---|
| OSA0.25–SGC | 0.128 mg/mL ± 0.0135 b |
| OSA0.5–SGC | 0.0746 mg/mL ± 0.0054 a |
| OSA1.0–SGC | 0.0576 mg/mL ± 0.0043 c |
| Sample | Encapsulation Efficiency (%) | Loading Content (%) |
|---|---|---|
| OSA0.25–SGC–CUR | 62.06 ± 1.31 | 6.21 ± 0.24 |
| OSA0.5–SGC–CUR | 64.14 ± 1.79 | 6.43 ± 0.13 |
| OSA1.0–SGC–CUR | 64.62 ± 1.52 | 6.57 ± 0.21 |
| Sample | Particle Size (nm) | PDI | Zeta (mV) |
|---|---|---|---|
| OSA0.25–SGC | 184.67 ± 17.25 a | 0.152 ± 0.054 c | −24.12 ± 1.23 bc |
| OSA0.5–SGC | 135.32 ± 10.35 a | 0.132 ± 0.041 a | −26.84 ± 1.45 c |
| OSA1.0–SGC | 116.34 ± 8.32 bc | 0.127 ± 0.032 b | −33.72 ± 2.01 a |
| OSA0.25–SGC–CUR | 287.64 ± 23.31 a | 0.210 ± 0.050 a | −15.87 ± 1.01 a |
| OSA0.5–SGC–CUR | 236.46 ± 20.12 ab | 0.330 ± 0.030 ab | −17.21 ± 1.32 b |
| OSA1.0–SGC–CUR | 192.35 ± 17.34 bc | 0.170 ± 0.030 ac | −20.49 ± 1.45 c |
| Sample | Type |
|---|---|
| Waxy corn starch | A type |
| SGC | B + V type |
| OSA0.25–SGC | B + V type |
| OSA0.5–SGC | V type single spiral |
| OSA1.0–SGC | V type single spiral |
| OSA0.25–SGC–CUR | B + V type |
| OSA0.5–SGC–CUR | V type |
| OSA1.0–SGC–CUR | V type |
© 2019 by the authors. Licensee MDPI, Basel, Switzerland. This article is an open access article distributed under the terms and conditions of the Creative Commons Attribution (CC BY) license (http://creativecommons.org/licenses/by/4.0/).
Share and Cite
Hu, Z.; Feng, T.; Zeng, X.; Janaswamy, S.; Wang, H.; Campanella, O. Structural Characterization and Digestibility of Curcumin Loaded Octenyl Succinic Nanoparticles. Nanomaterials 2019, 9, 1073. https://doi.org/10.3390/nano9081073
Hu Z, Feng T, Zeng X, Janaswamy S, Wang H, Campanella O. Structural Characterization and Digestibility of Curcumin Loaded Octenyl Succinic Nanoparticles. Nanomaterials. 2019; 9(8):1073. https://doi.org/10.3390/nano9081073
Chicago/Turabian StyleHu, Zhongshan, Tao Feng, Xiaolan Zeng, Srinivas Janaswamy, Hui Wang, and Osvaldo Campanella. 2019. "Structural Characterization and Digestibility of Curcumin Loaded Octenyl Succinic Nanoparticles" Nanomaterials 9, no. 8: 1073. https://doi.org/10.3390/nano9081073
APA StyleHu, Z., Feng, T., Zeng, X., Janaswamy, S., Wang, H., & Campanella, O. (2019). Structural Characterization and Digestibility of Curcumin Loaded Octenyl Succinic Nanoparticles. Nanomaterials, 9(8), 1073. https://doi.org/10.3390/nano9081073


