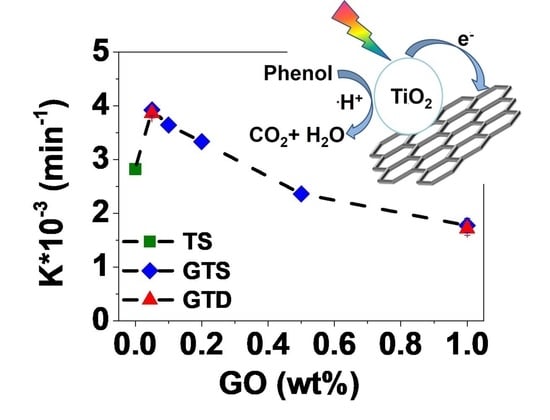
Phenol Abatement by Titanium Dioxide Photocatalysts: Effect of The Graphene Oxide Loading
Abstract
:1. Introduction
2. Experimental Section
2.1. Synthesis of the GT Composites
2.2. Characterization of the GT Composites
2.3. Photocatalytic Tests
3. Results and Discussion
3.1. Morphology of GT Nanocomposites
3.2. Photocatalytic Activity
4. Conclusions
Author Contributions
Funding
Acknowledgments
Conflicts of Interest
References
- WWAP (United Nations World Water Assessment Programme). The United Nations World Water Development Report 2017. Wastewater: The Untapped Resource; UNESCO: Paris, France, 2017. [Google Scholar]
- Anku, W.W.; Mamo, M.A.; Govender, P.P. Phenolic Compounds—Natural Sources, Importance and Applications; InTechOpen: London, UK, 2017. [Google Scholar]
- Rafiee, E.; Noori, E.; Zinatizadeh, A.A.; Zanganeh, H. Photocatalytic degradation of phenol using a new developed TiO2/Graphene/Heteropoly acid nanocomposite: Synthesis, characterization and process optimization. RSC Adv. 2016, 6, 96554–96562. [Google Scholar] [CrossRef]
- Villegas, L.G.C.; Mashhadi, N.; Chen, M.; Mukherjee, D.; Taylor, K.E.; Biswas, N. A short review of techniques for phenol removal from wastewater. Curr. Pollut. Rep. 2016, 2, 157–167. [Google Scholar] [CrossRef]
- Adamu, H.; Dubey, P.; Anderson, J.A. Probing the role of thermally reduced graphene oxide in enhancing performance of TiO2 in photocatalytic phenol removal from aqueous environments. Chem. Eng. J. 2016, 284, 380–388. [Google Scholar] [CrossRef]
- Faraldos, M.; Bahamonde, A. Environmental applications of titania-graphene photocatalysts. Catal. Today 2017, 285, 13–28. [Google Scholar] [CrossRef]
- Jiang, Y.; Wang, W.-N.; Liu, D.; Nie, Y.; Li, W.; Wu, J.; Zhang, F.; Biswas, P.; Fortner, J.D. Engineered crumpled graphene oxide nanocomposite membrane assemblies for advanced water treatment processes. Environ. Sci. Technol. 2015, 49, 6846–6854. [Google Scholar] [CrossRef] [PubMed]
- Ola, O.; Maroto-Valer, M.M. Review of material design and reactor engineering on TiO2 photocatalysis for CO2 reduction. J. Photochem. Photobiol. C Photochem. Rev. 2015, 24, 16–42. [Google Scholar] [CrossRef]
- Giovannetti, R.; Rommozzi, E.; Zannotti, M.; D’Amato, C.A. Recent advances in graphene based TiO2 nanocomposites (GTiO2Ns) for photocatalytic degradation of synthetic dyes. Catalysts 2017, 7, 305. [Google Scholar] [CrossRef]
- Naknikham, U.; Boffa, V.; Magnacca, G.; Qiao, A.; Jensen, L.R.; Yue, Y. Mutual-stabilization in chemically bonded graphene oxide–TiO2 heterostructures synthesized by a sol–gel approach. RSC Adv. 2017, 7, 41217–41227. [Google Scholar] [CrossRef]
- Li, X.; Yu, J.; Wageh, S.; Al-Ghamdi, A.A.; Xie, J. Graphene in photocatalysis: A review. Small 2016, 12, 6640–6696. [Google Scholar] [CrossRef] [PubMed]
- Atout, H.; Álvarez, M.G.; Chebli, D.; Bouguettoucha, A.; Tichit, D.; Llorca, J.; Medina, F. Enhanced photocatalytic degradation of methylene blue: Preparation of TiO2/Reduced graphene oxide nanocomposites by direct sol-gel and hydrothermal methods. Mater. Res. Bull. 2017, 95 (Suppl. C), 578–587. [Google Scholar] [CrossRef]
- Jing, J.; Zhang, Y.; Li, W.; Yu, W.W. Visible light driven photodegradation of quinoline over TiO2/Graphene oxide nanocomposites. J. Catal. 2014, 316, 174–181. [Google Scholar] [CrossRef]
- Min, Y.; Zhang, K.; Zhao, W.; Zheng, F.; Chen, Y.; Zhang, Y. Enhanced chemical interaction between TiO2 and graphene oxide for photocatalytic decolorization of methylene blue. Chem. Eng. J. 2012, 193–194, 203–210. [Google Scholar] [CrossRef]
- Huang, Q.; Tian, S.; Zeng, D.; Wang, X.; Song, W.; Li, Y.; Xiao, W.; Xie, C. Enhanced photocatalytic activity of chemically bonded TiO2/Graphene composites based on the effective interfacial charge transfer through the C–Ti Bond. ACS Catal. 2013, 3, 1477–1485. [Google Scholar] [CrossRef]
- Liu, Y. Hydrothermal synthesis of TiO2–RGO composites and their improved photocatalytic activity in visible light. RSC Adv. 2014, 4, 36040–36045. [Google Scholar] [CrossRef]
- Nawaz, M.; Miran, W.; Jang, J.; Lee, D.S. One-step hydrothermal synthesis of porous 3D reduced graphene Oxide/TiO2 aerogel for carbamazepine photodegradation in aqueous solution. Appl. Catal. B Environ. 2017, 203, 85–95. [Google Scholar] [CrossRef]
- Pan, D.; Jiao, J.; Li, Z.; Guo, Y.; Feng, C.; Liu, Y.; Wang, L.; Wu, M. Efficient separation of electron–hole pairs in graphene quantum dots by TiO2 heterojunctions for dye degradation. ACS Sustain. Chem. Eng. 2015, 3, 2405–2413. [Google Scholar] [CrossRef]
- Wang, P.; Wang, J.; Wang, X.; Yu, H.; Yu, J.; Lei, M.; Wang, Y. One-Step synthesis of easy-recycling TiO2-RGO nanocomposite photocatalysts with enhanced photocatalytic activity. Appl. Catal. B Environ. 2013, 132–133, 452–459. [Google Scholar] [CrossRef]
- Minella, M.; Sordello, F.; Minero, C. Photocatalytic process in TiO2/Graphene hybrid materials. Evidence of charge separation by electron transfer from reduced graphene oxide to TiO2. Catal. Today 2017, 281 Pt 1, 29–37. [Google Scholar] [CrossRef]
- El-Sheikh, S.M.; Khedr, T.M.; Hakki, A.; Ismail, A.A.; Badawy, W.A.; Bahnemann, D.W. Visible light activated carbon and nitrogen Co-Doped mesoporous TiO2 as efficient photocatalyst for degradation of ibuprofen. Sep. Purif. Technol. 2017, 173, 258–268. [Google Scholar] [CrossRef]
- Choina, J.; Kosslick, H.; Fischer, C.; Flechsig, G.-U.; Frunza, L.; Schulz, A. Photocatalytic decomposition of pharmaceutical ibuprofen pollutions in water over titania catalyst. Appl. Catal. B Environ. 2013, 129, 589–598. [Google Scholar] [CrossRef]
- Wang, T.; Xu, Z.; Wu, L.; Li, B.; Chen, M.; Xue, S.; Zhu, Y.; Cai, J. Enhanced photocatalytic activity for degrading phenol in seawater by TiO2-based catalysts under weak light irradiation. RSC Adv. 2017, 7, 31921–31929. [Google Scholar] [CrossRef]
- Zhang, H.; Banfield, J.F. Understanding polymorphic phase transformation behavior during growth of nanocrystalline aggregates: Insights from TiO2. J. Phys. Chem. B 2000, 104, 3481–3487. [Google Scholar] [CrossRef]
- Wang, W.-N.; Jiang, Y.; Biswas, P. Evaporation-induced crumpling of graphene oxide nanosheets in aerosolized droplets: Confinement force relationship. J. Phys. Chem. Lett. 2012, 3, 3228–3233. [Google Scholar] [CrossRef] [PubMed]
- Ünlü, H.; Horing, N.J.M.; Dabowski, J. Low-Dimensional and Nanostructured Materials and Devices: Properties, Synthesis, Characterization, Modelling and Applications; Springer: New York, NY, USA, 2015. [Google Scholar]
- Khannam, M.; Sharma, S.; Dolui, S.; Dolui, S.K. A graphene oxide incorporated TiO2 photoanode for high efficiency quasi solid state dye sensitized solar cells based on a poly-vinyl alcohol gel electrolyte. RSC Adv. 2016, 6, 55406–55414. [Google Scholar] [CrossRef]
- López, R.; Gómez, R. Band-Gap energy estimation from diffuse reflectance measurements on sol–gel and commercial TiO2: A comparative study. J. Sol-Gel Sci. Technol. 2012, 61, 1–7. [Google Scholar] [CrossRef]
- Malekshoar, G.; Pal, K.; He, Q.; Yu, A.; Ray, A.K. Enhanced solar photocatalytic degradation of phenol with coupled graphene-based titanium dioxide and zinc oxide. Ind. Eng. Chem. Res. 2014, 53, 18824–18832. [Google Scholar] [CrossRef]
- Zhang, Y.; Zhou, Z.; Chen, T.; Wang, H.; Lu, W. Graphene TiO2 nanocomposites with high photocatalytic activity for the degradation of sodium pentachlorophenol. J. Environ. Sci. 2014, 26, 2114–2122. [Google Scholar] [CrossRef]
- Azarang, M.; Shuhaimi, A.; Sookhakian, M. Crystalline quality assessment, photocurrent response and optical properties of reduced graphene oxide uniformly decorated zinc oxide nanoparticles based on the graphene oxide concentration. RSC Adv. 2015, 5, 53117–53128. [Google Scholar] [CrossRef]
- Zhang, X.; Kumar, P.S.; Aravindan, V.; Liu, H.H.; Sundaramurthy, J.; Mhaisalkar, S.G.; Duong, H.M.; Ramakrishna, S.; Madhavi, S. Electrospun TiO2–graphene composite nanofibers as a highly durable insertion anode for lithium ion batteries. J. Phys. Chem. C 2012, 116, 14780–14788. [Google Scholar] [CrossRef]
- Zhang, J.; Xiong, Z.; Zhao, X.S. Graphene–metal–oxide composites for the degradation of dyes under visible light irradiation. J. Mater. Chem. 2011, 21, 3634–3640. [Google Scholar] [CrossRef]
- Peng, D.; Qin, W.; Wu, X.; Wu, J.; Pan, Y. Improvement of the resistance performance of carbon/cyanate ester composites during vacuum electron radiation by reduced graphene oxide modified TiO2. RSC Adv. 2015, 5, 77138–77146. [Google Scholar] [CrossRef]
- Chen, P.; Wang, L.; Wang, P.; Kostka, A.; Wark, M.; Muhler, M.; Beranek, R. CNT-TiO2−δ composites for improved co-catalyst dispersion and stabilized photocatalytic hydrogen production. Catalysts 2015, 5, 270–285. [Google Scholar] [CrossRef]
- Štengl, V.; Bakardjieva, S.; Grygar, T.M.; Bludská, J.; Kormunda, M. TiO2-graphene oxide nanocomposite as advanced photocatalytic materials. Chem. Cent. J. 2013, 7, 41. [Google Scholar] [CrossRef] [PubMed]
- Pei, F.; Liu, Y.; Zhang, L.; Wang, S.; Xu, S.; Cao, S. TiO2 nanocomposite with reduced graphene oxide through facile blending and its photocatalytic behavior for hydrogen evolution. Mater. Res. Bull. 2013, 48, 2824–2831. [Google Scholar] [CrossRef]
- Wang, D.; Li, X.; Chen, J.; Tao, X. Enhanced photoelectrocatalytic activity of reduced graphene oxide/TiO2 composite films for dye degradation. Chem. Eng. J. 2012, 198–199, 547–554. [Google Scholar] [CrossRef]
- Xiang, Q.; Yu, J.; Jaroniec, M. Preparation and enhanced visible-light photocatalytic H2-production activity of graphene/C3N4 composites. J. Phys. Chem. C 2011, 115, 7355–7363. [Google Scholar] [CrossRef]
- Zhu, G.; Xu, T.; Lv, T.; Pan, L.; Zhao, Q.; Sun, Z. Graphene-incorporated nanocrystalline TiO2 films for CdS quantum dot-sensitized solar cells. J. Electroanal. Chem. 2011, 650, 248–251. [Google Scholar] [CrossRef]
- Ai, Z.; Ho, W.; Lee, S. Efficient visible light photocatalytic removal of NO with BiOBr-graphene nanocomposites. J. Phys. Chem. C 2011, 115, 25330–25337. [Google Scholar] [CrossRef]


© 2019 by the authors. Licensee MDPI, Basel, Switzerland. This article is an open access article distributed under the terms and conditions of the Creative Commons Attribution (CC BY) license (http://creativecommons.org/licenses/by/4.0/).
Share and Cite
Naknikham, U.; Magnacca, G.; Qiao, A.; Kristensen, P.K.; Boffa, V.; Yue, Y. Phenol Abatement by Titanium Dioxide Photocatalysts: Effect of The Graphene Oxide Loading. Nanomaterials 2019, 9, 947. https://doi.org/10.3390/nano9070947
Naknikham U, Magnacca G, Qiao A, Kristensen PK, Boffa V, Yue Y. Phenol Abatement by Titanium Dioxide Photocatalysts: Effect of The Graphene Oxide Loading. Nanomaterials. 2019; 9(7):947. https://doi.org/10.3390/nano9070947
Chicago/Turabian StyleNaknikham, Usuma, Giuliana Magnacca, Ang Qiao, Peter Kjær Kristensen, Vittorio Boffa, and Yuanzheng Yue. 2019. "Phenol Abatement by Titanium Dioxide Photocatalysts: Effect of The Graphene Oxide Loading" Nanomaterials 9, no. 7: 947. https://doi.org/10.3390/nano9070947
APA StyleNaknikham, U., Magnacca, G., Qiao, A., Kristensen, P. K., Boffa, V., & Yue, Y. (2019). Phenol Abatement by Titanium Dioxide Photocatalysts: Effect of The Graphene Oxide Loading. Nanomaterials, 9(7), 947. https://doi.org/10.3390/nano9070947


