Sustained Local Delivery of Diclofenac from Three-Dimensional Ultrafine Fibrous Protein Scaffolds with Ultrahigh Drug Loading Capacity

 ,
,  ,
, 
Abstract
1. Introduction
2. Materials and Methods
2.1. Materials
2.2. Fabrication of Gelatin 3D Ultrafine Fibers with and without Drug
2.3. Fabrication of Gelatin 2D Ultrafine Fibers with and without Drug
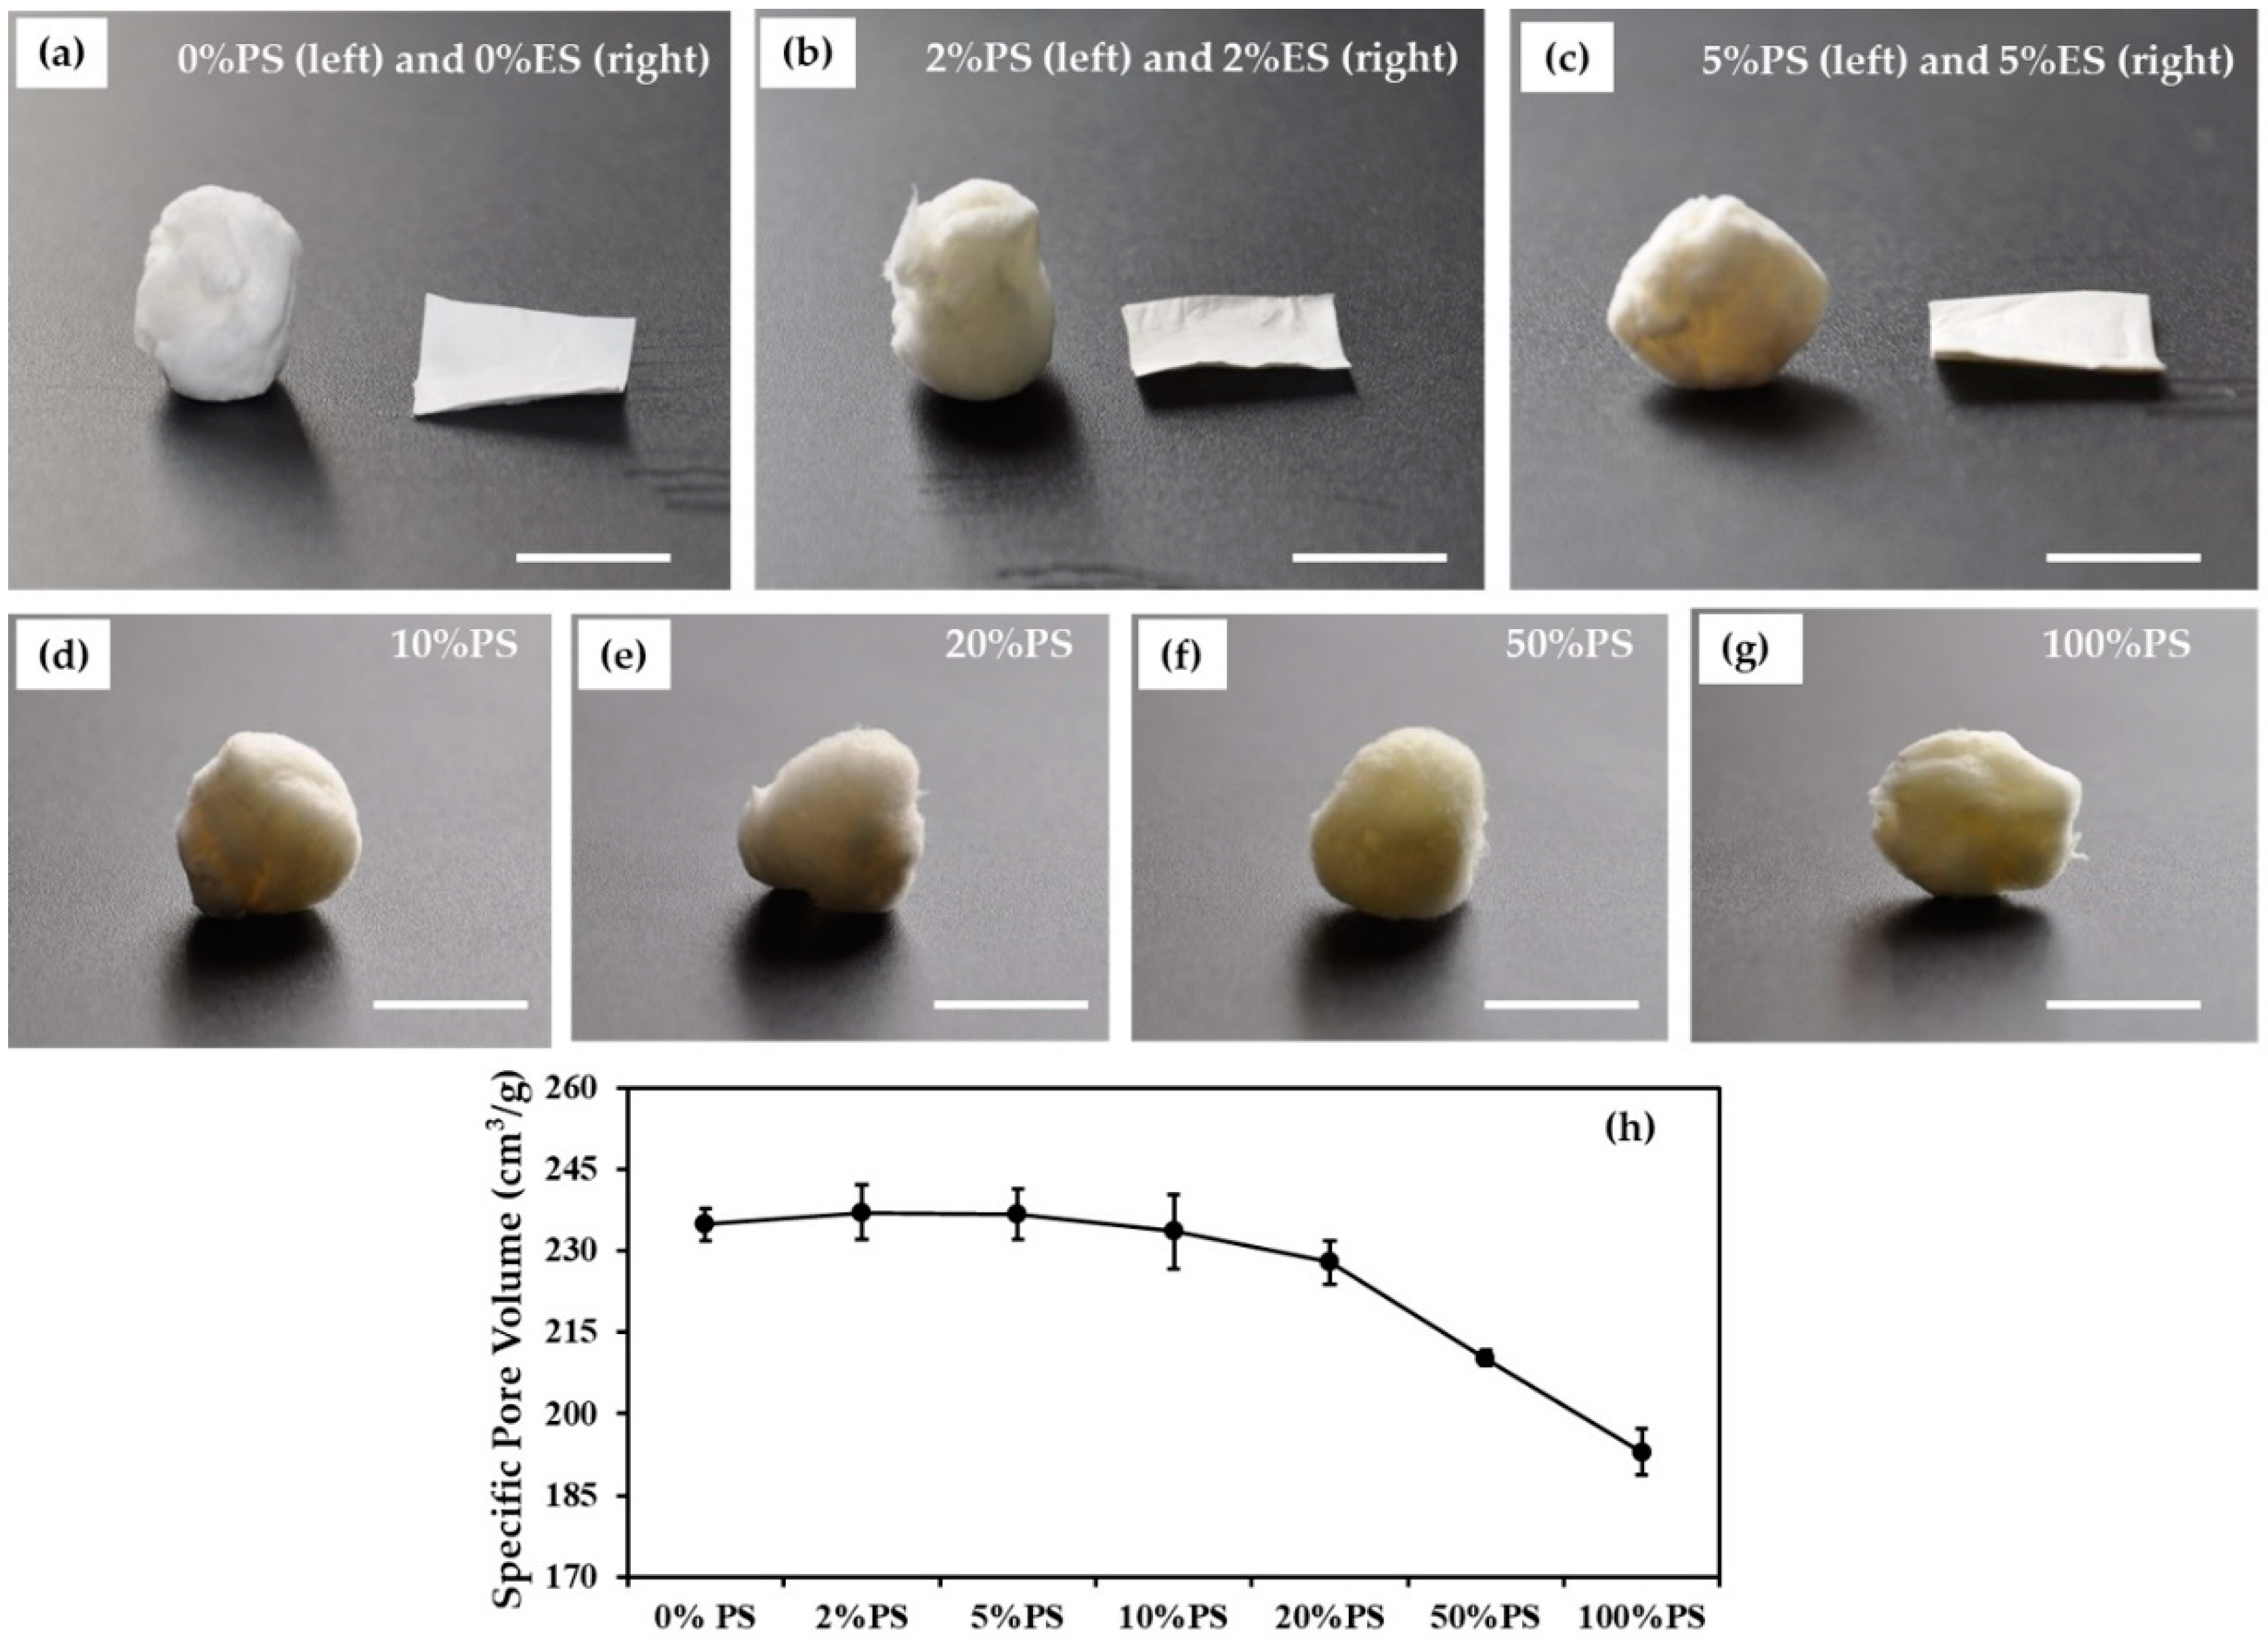
2.4. Morphological Observation
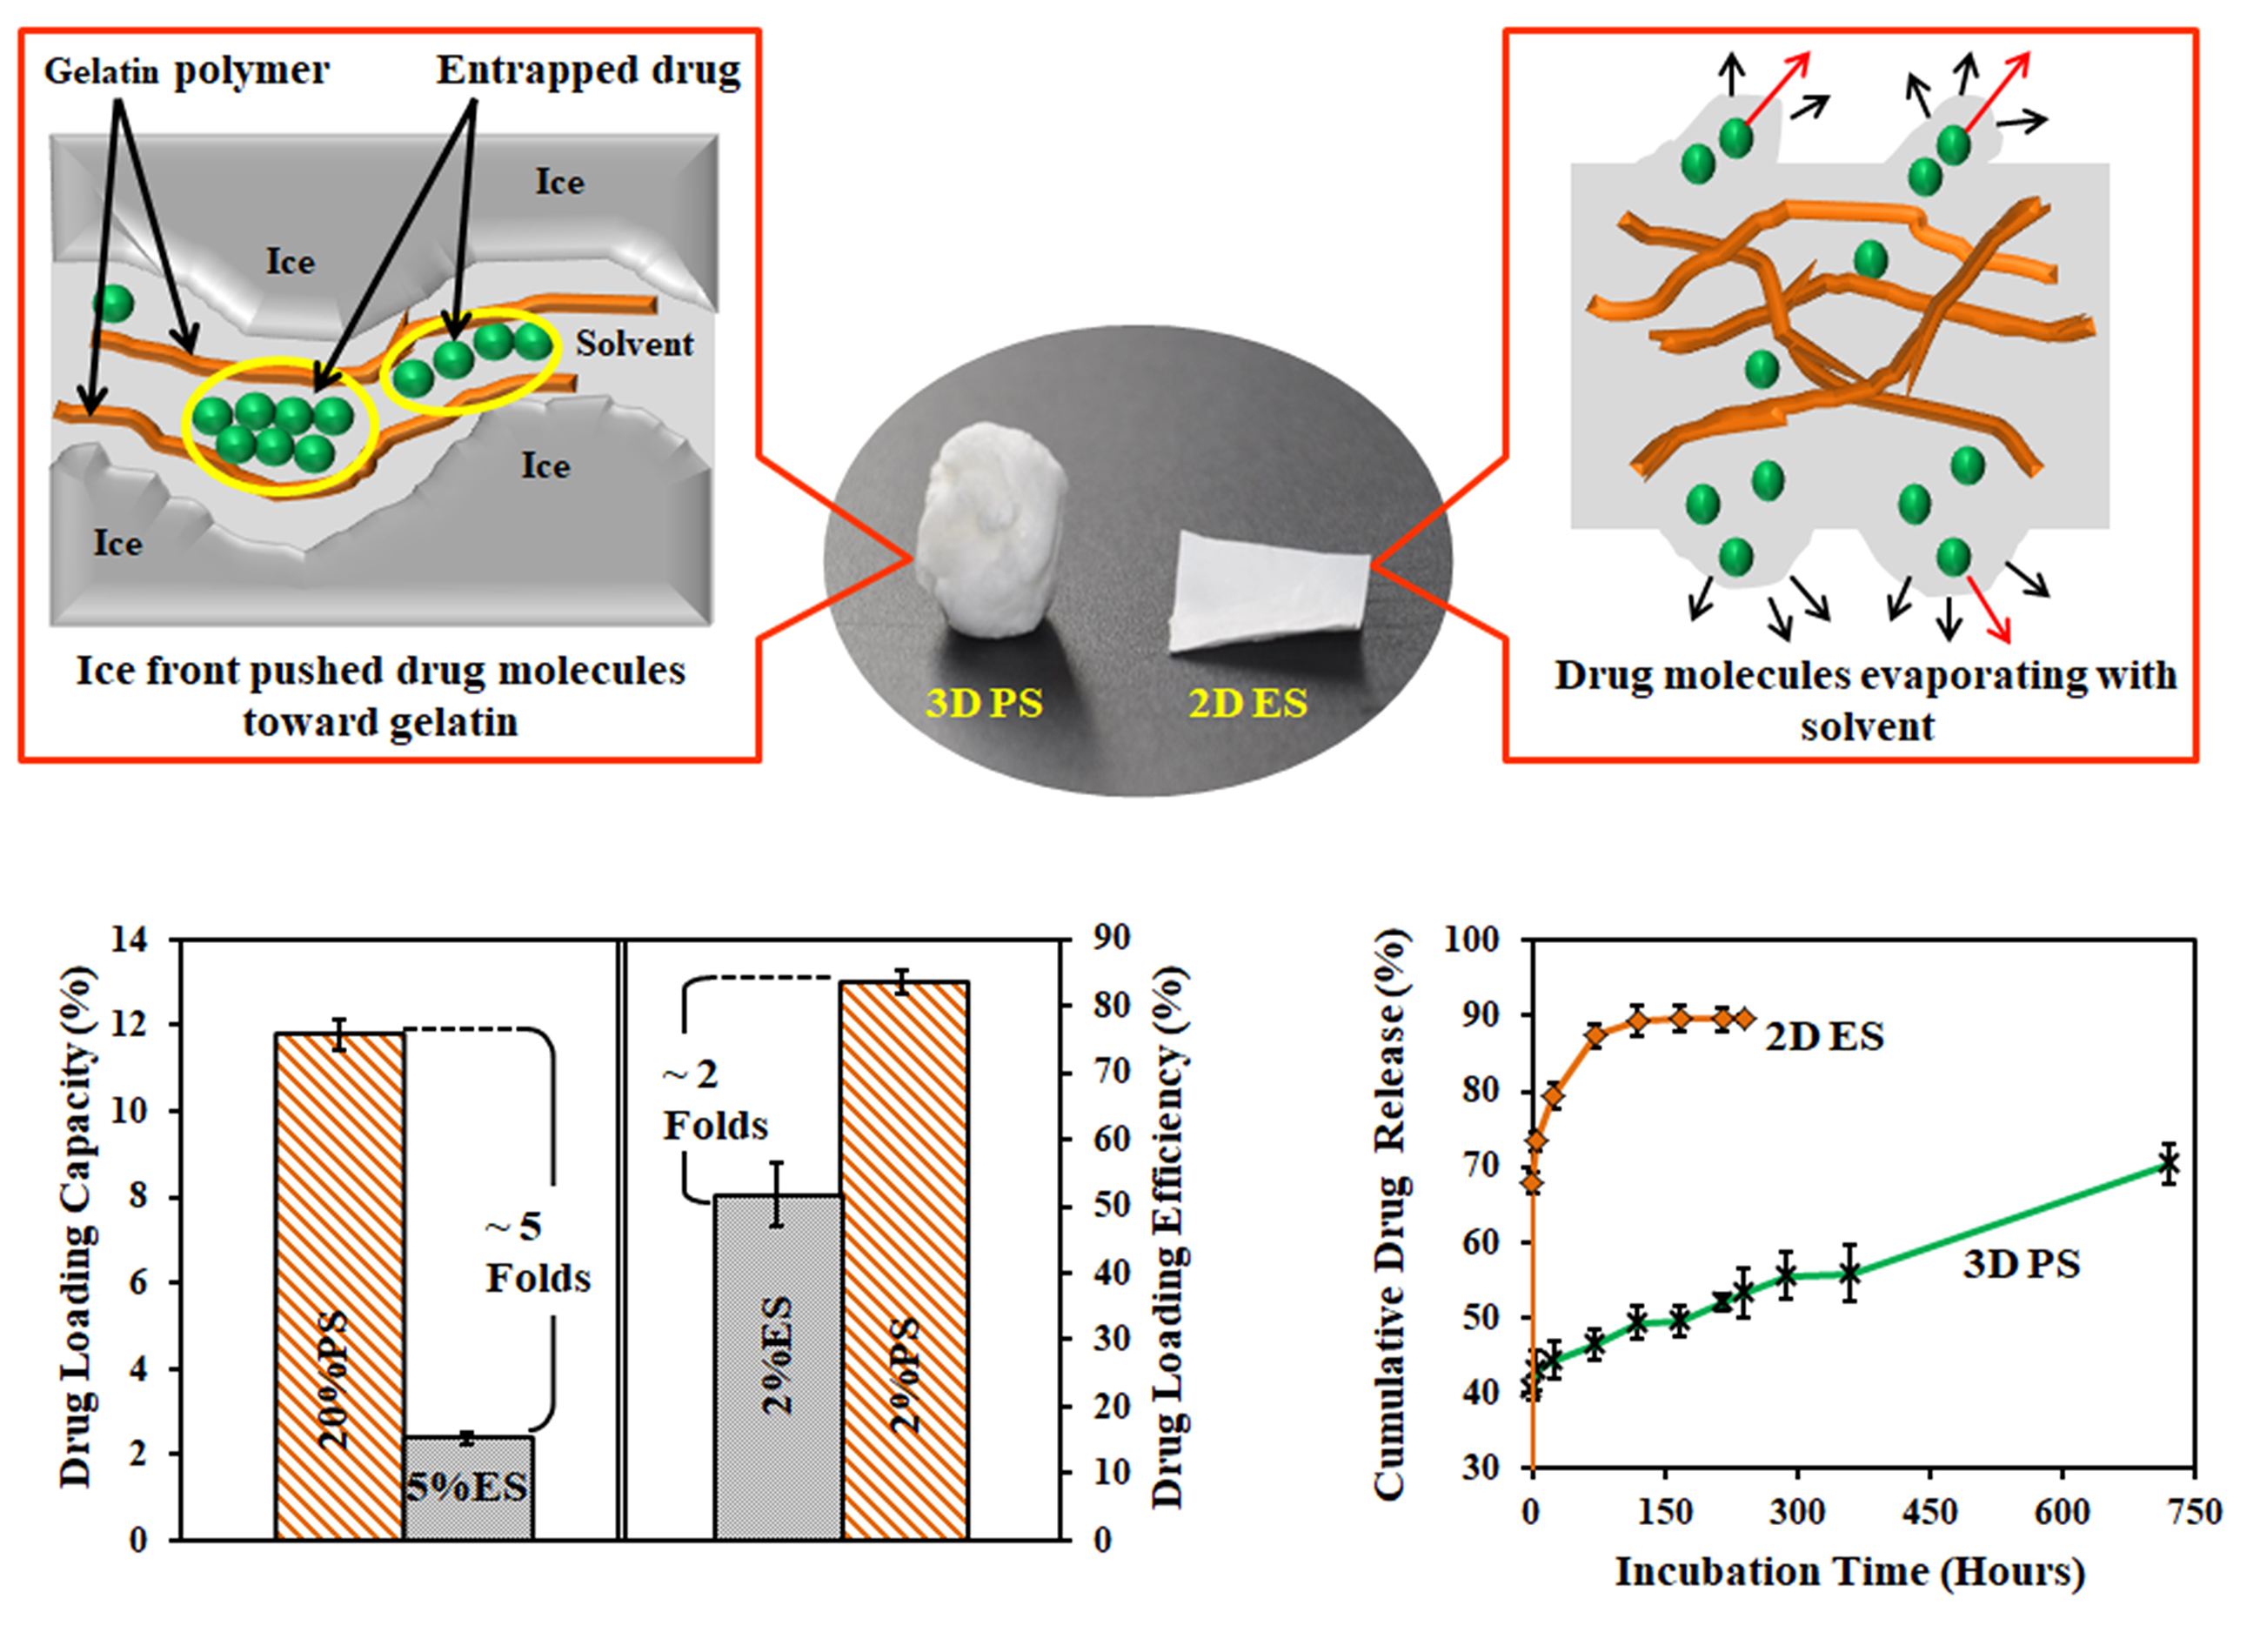
2.5. Specific Pore Volume
2.6. Fourier Transformation Infrared (FTIR) Spectra
2.7. NMR Analysis
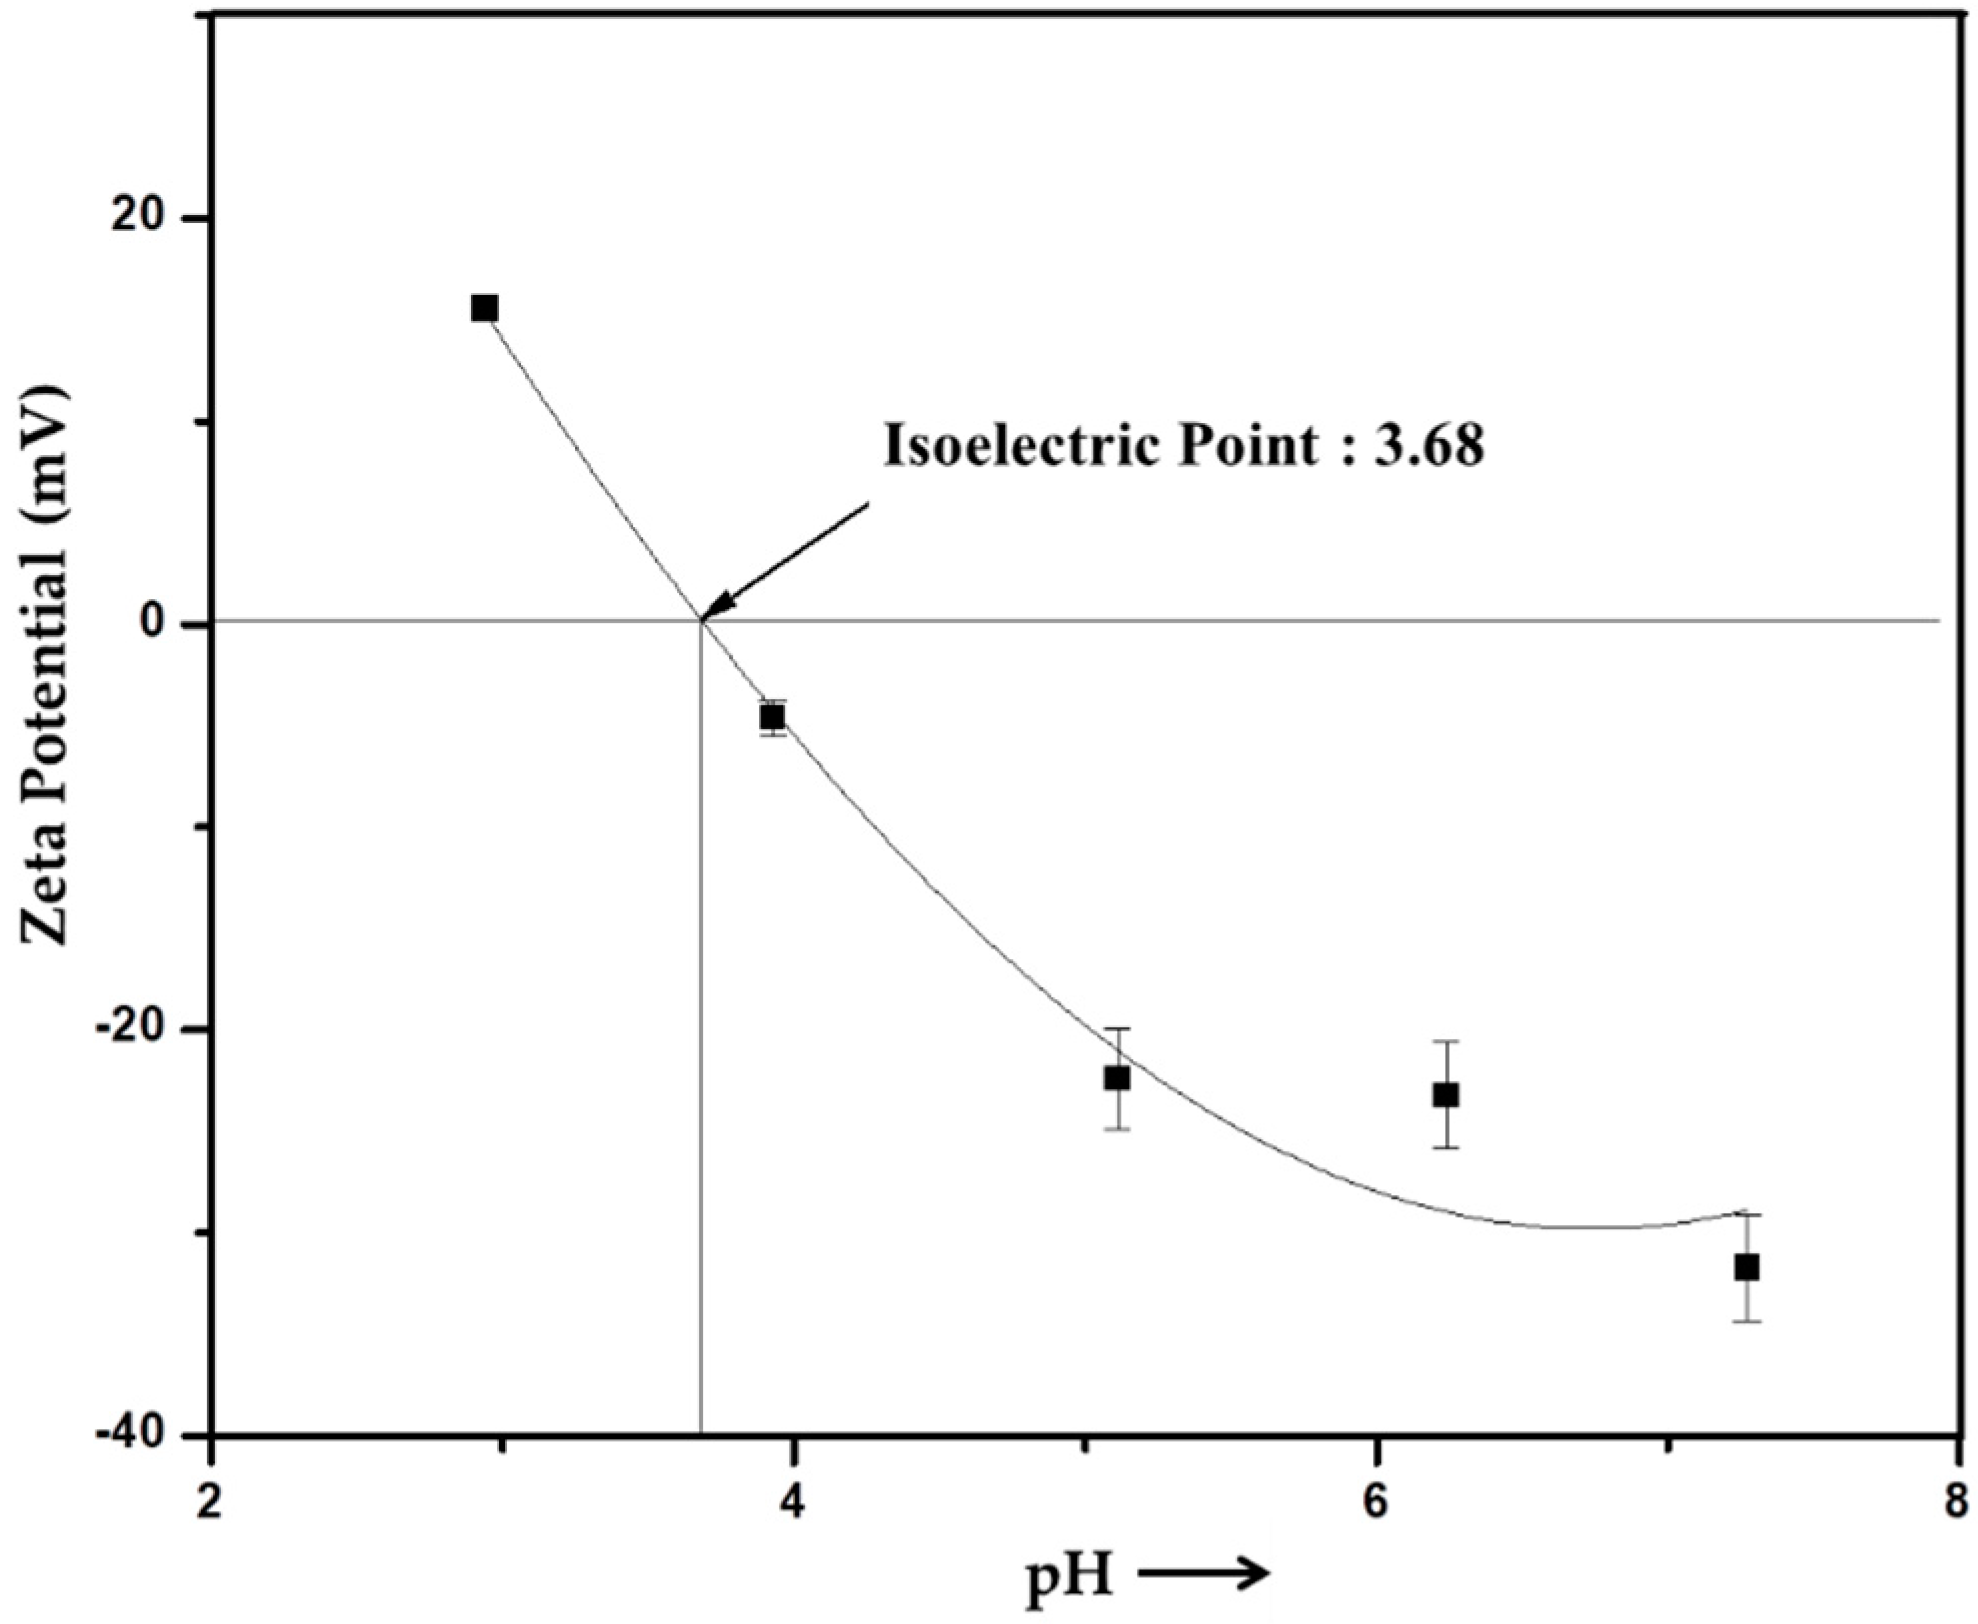
2.8. Zeta Potential
2.9. Determination of Drug Loaded
2.10. Drug Release
2.11. Degradation Evaluation
2.12. Cell Viability Evaluation
2.13. Statistical Analysis
3. Results and Discussion
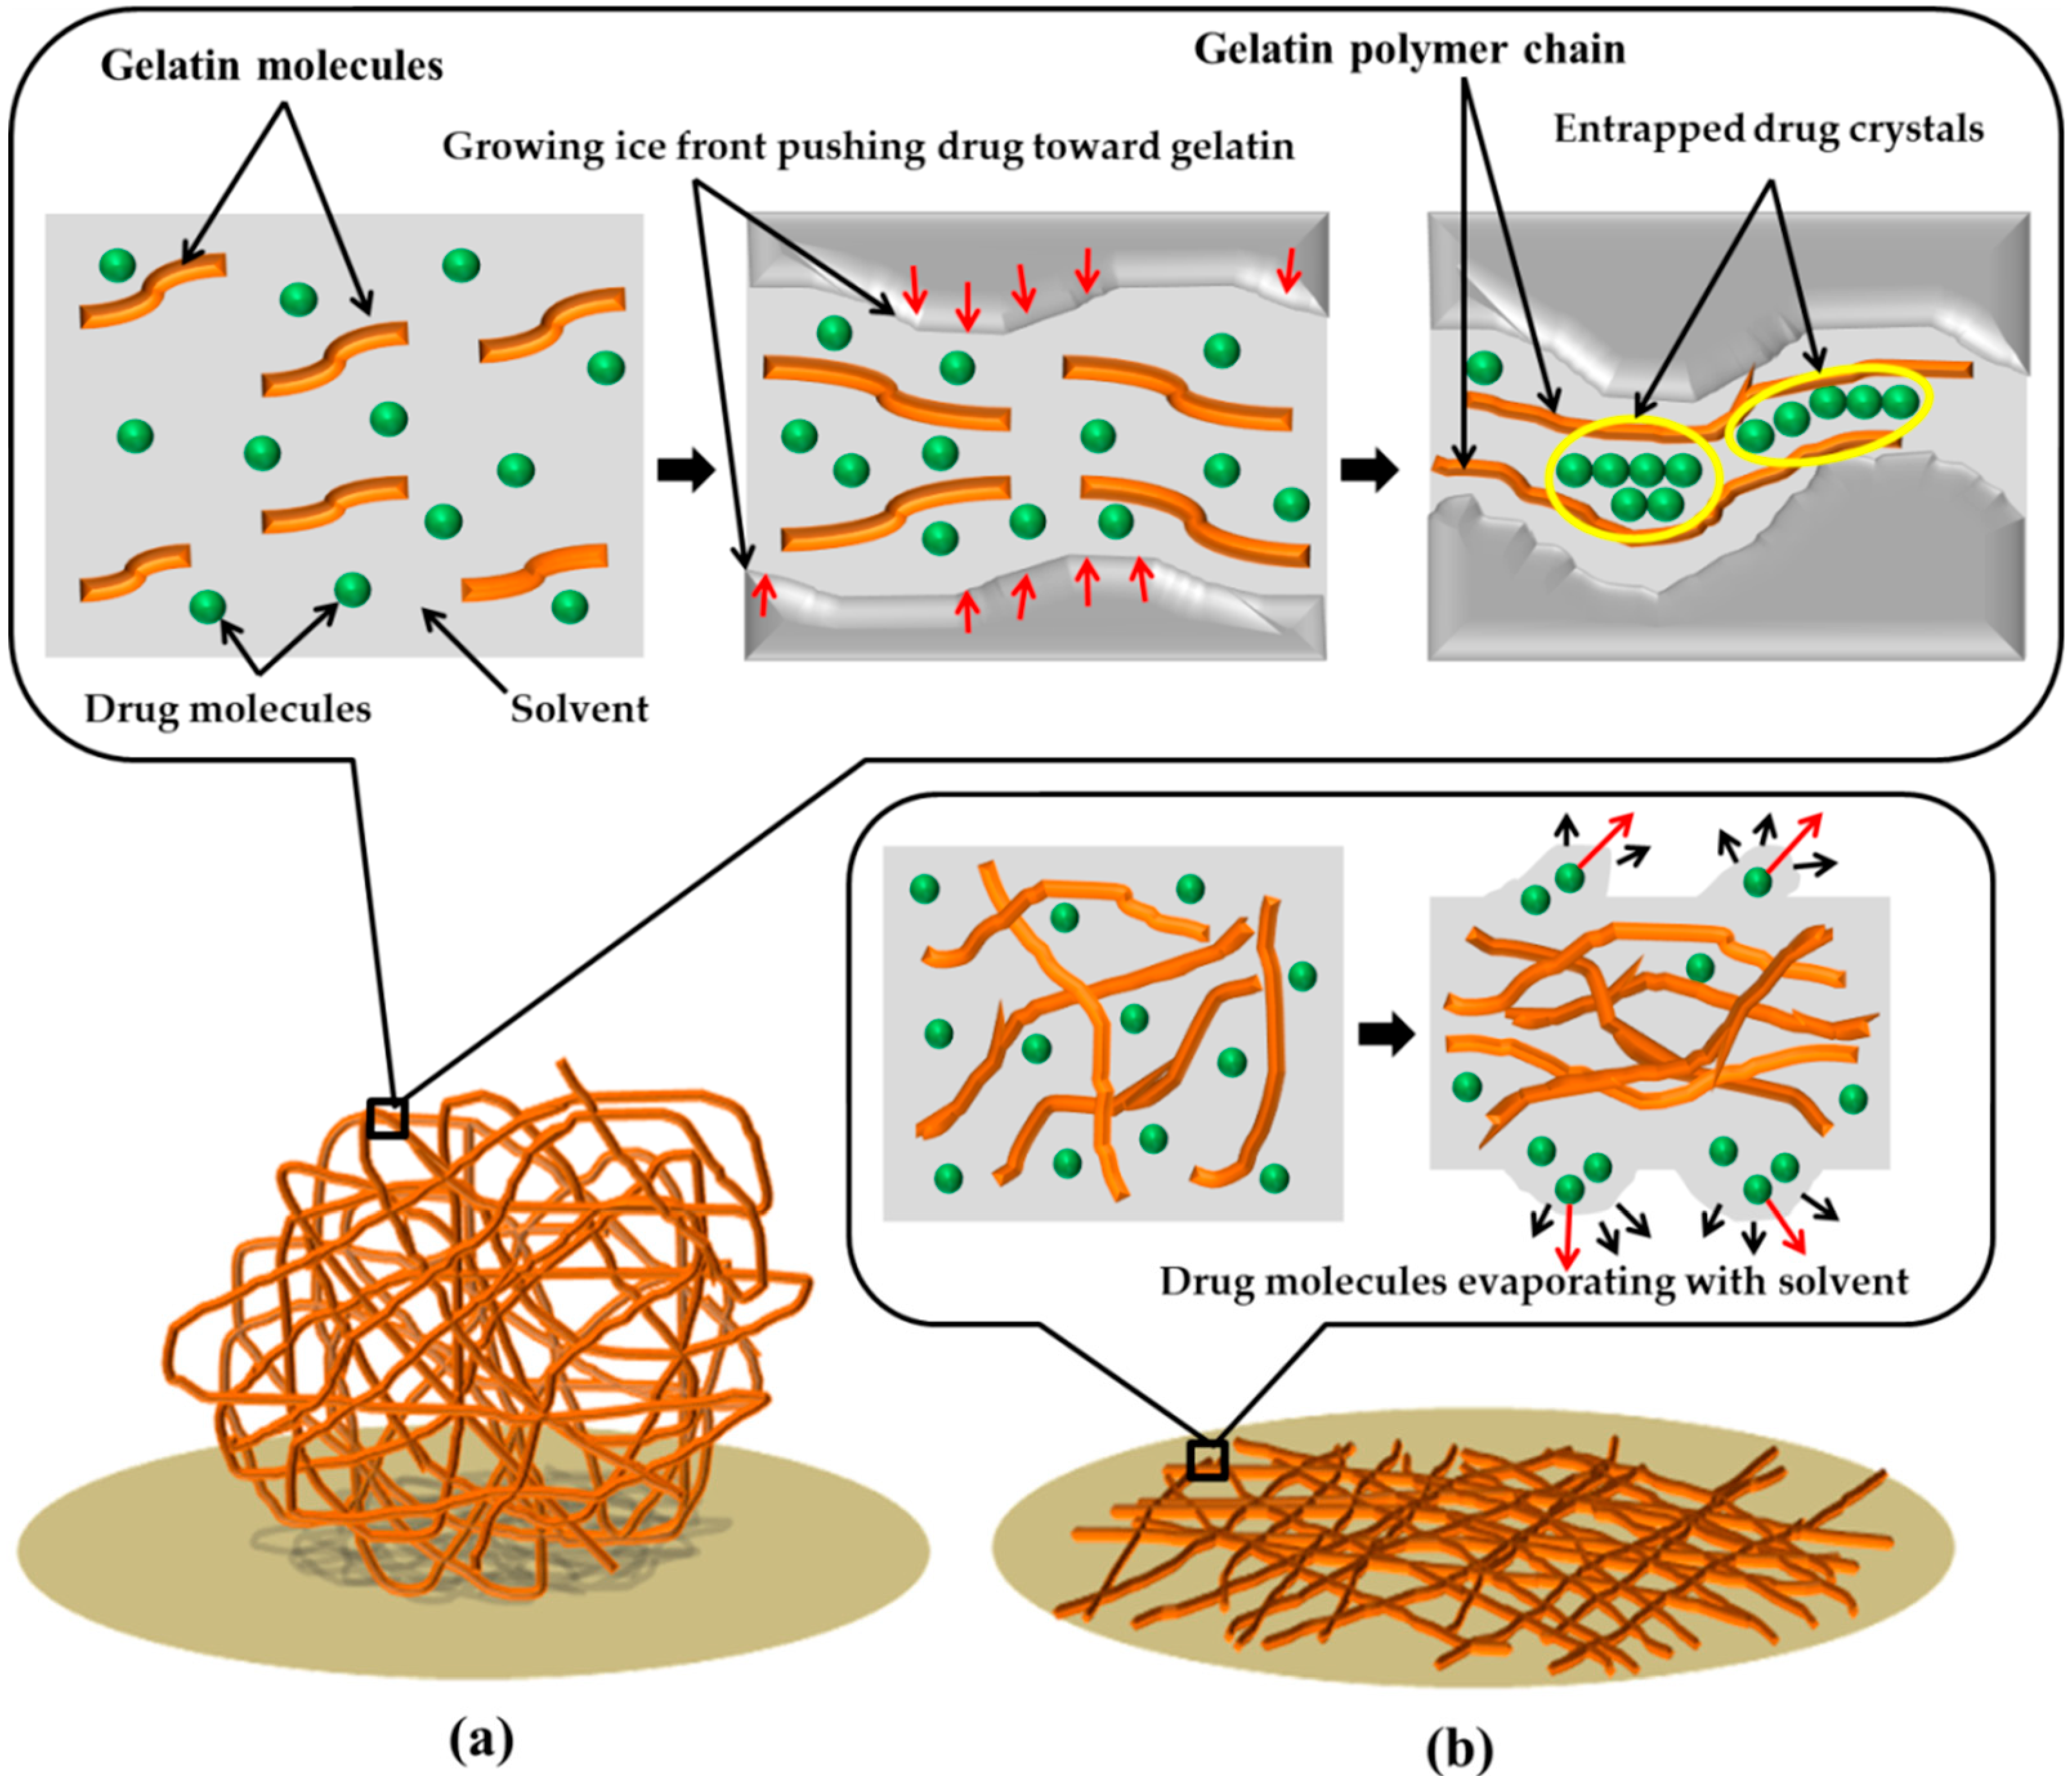
3.1. Morphologies of Scaffolds
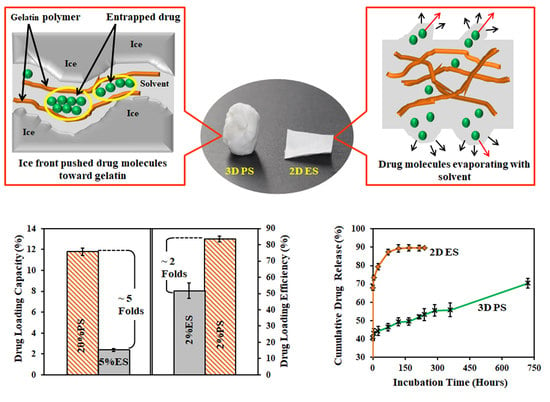
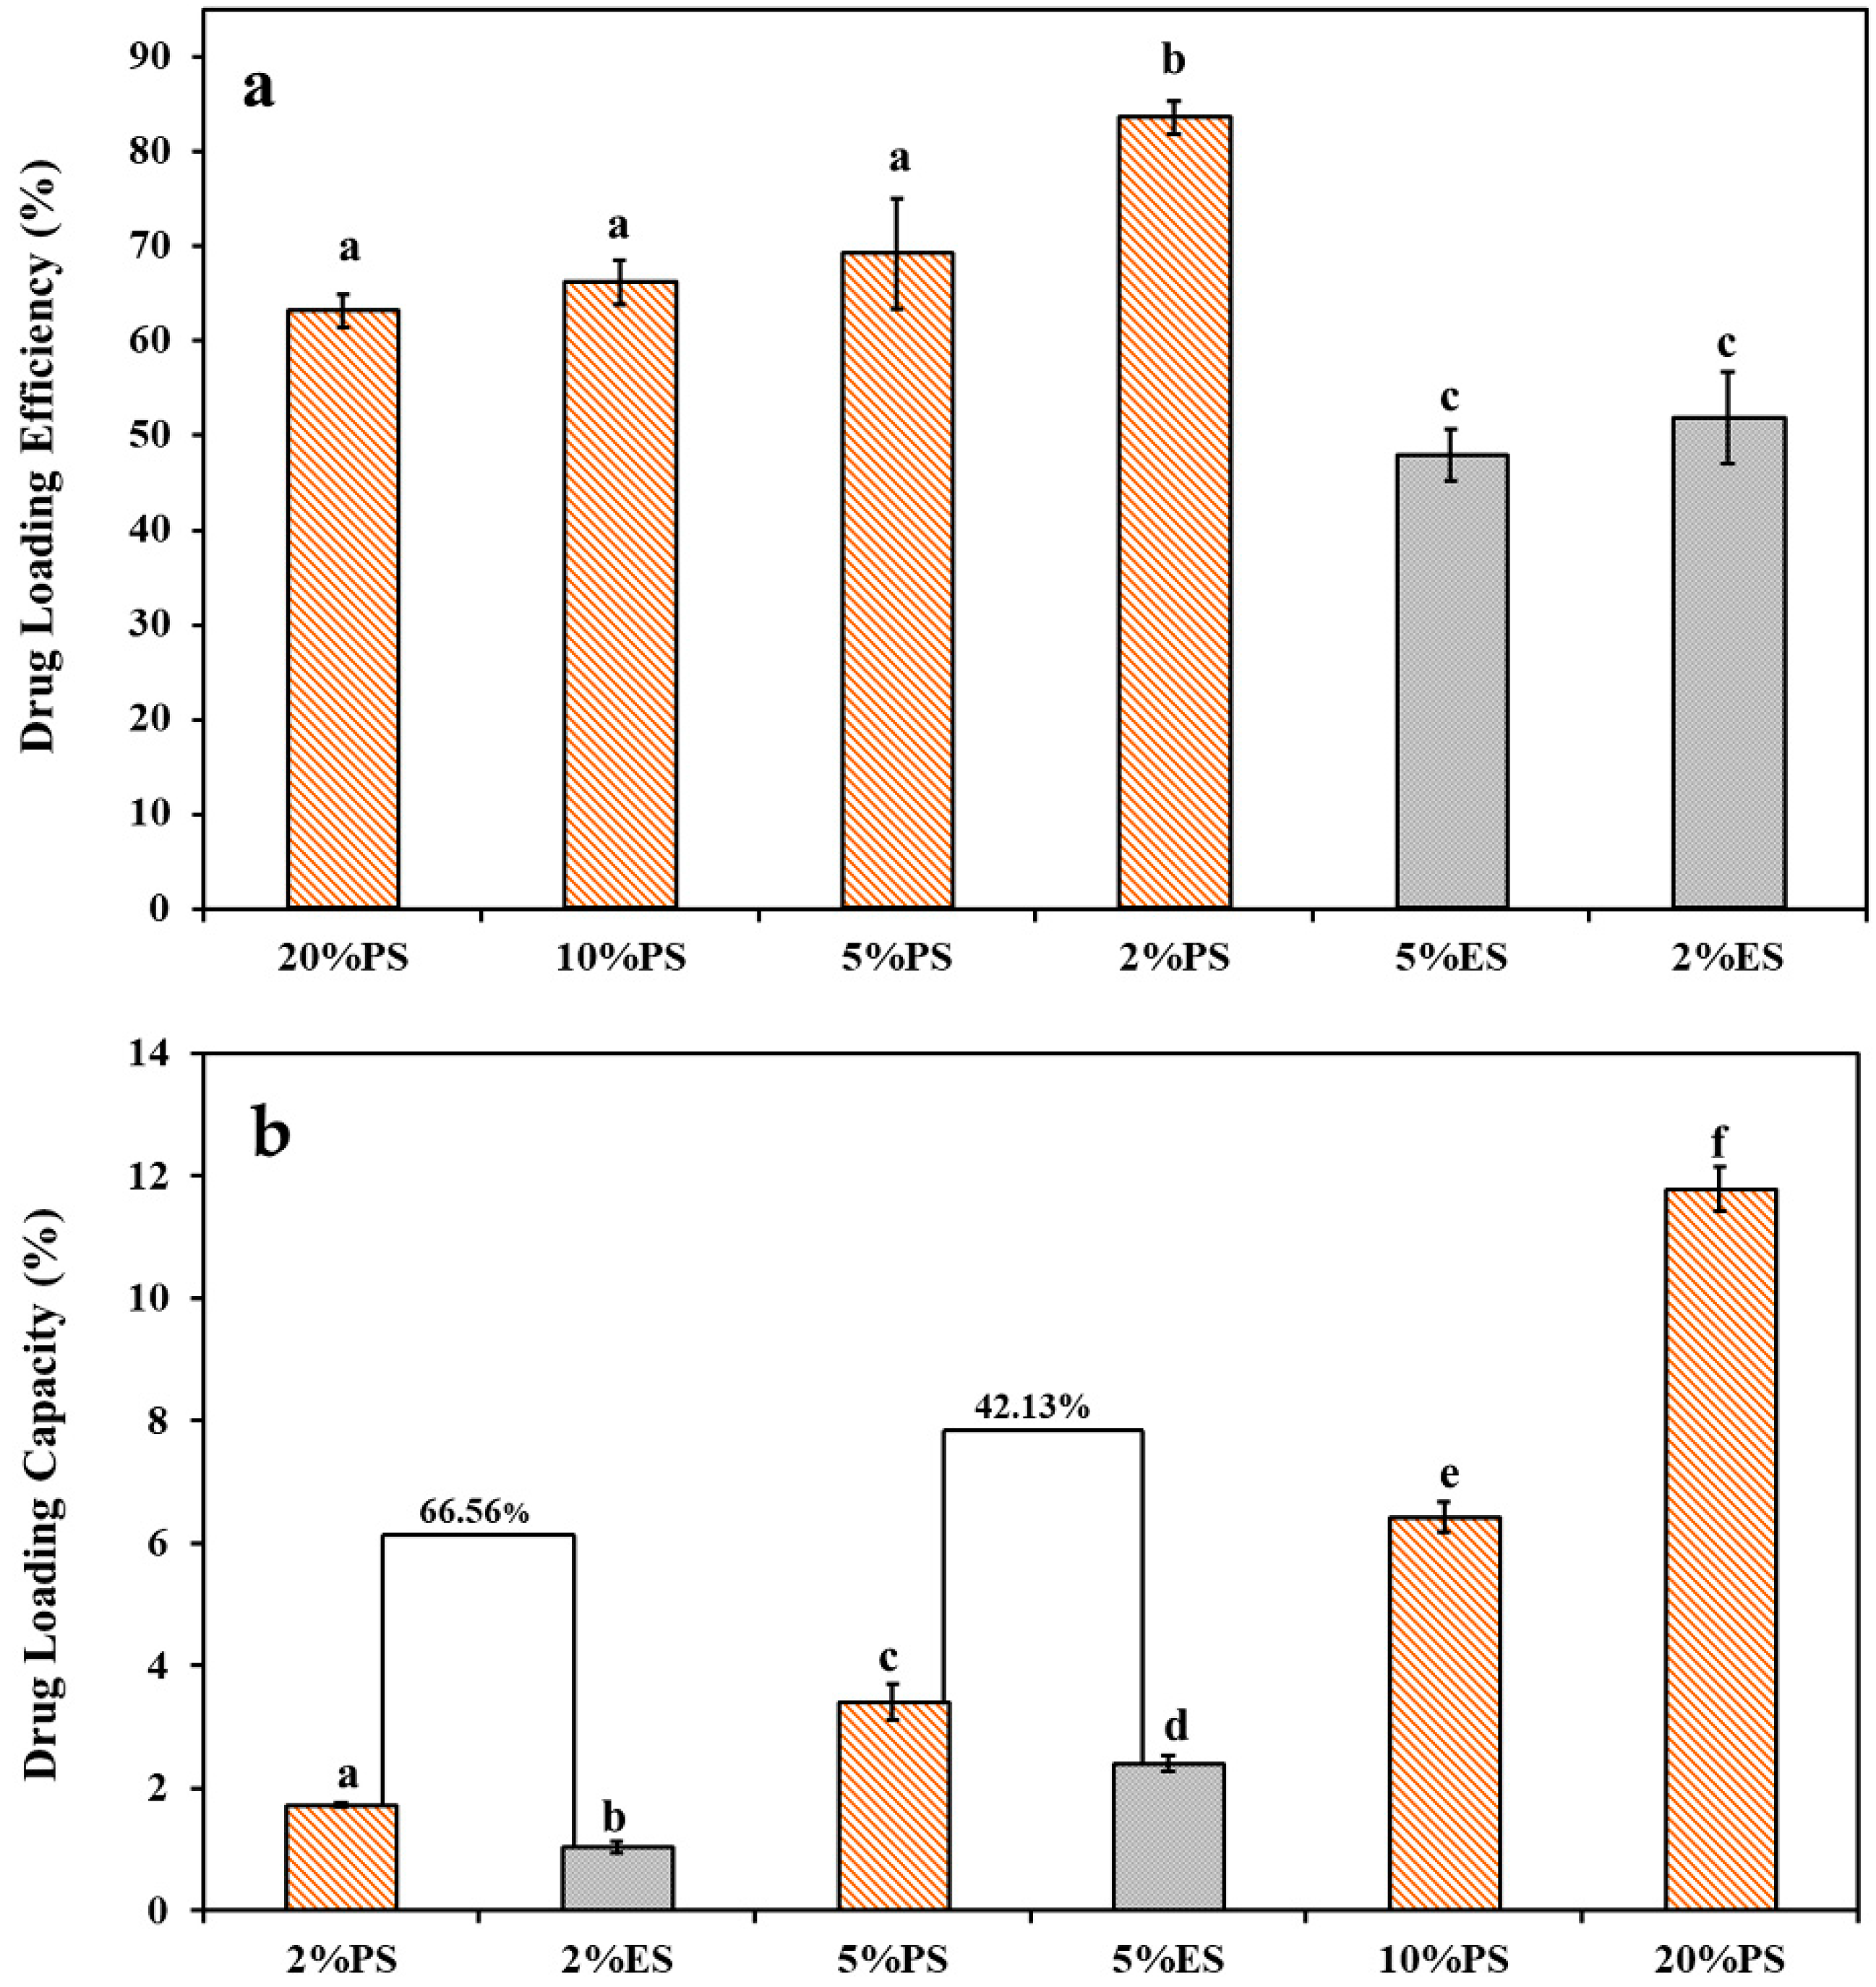
3.2. Drug Loading Performance
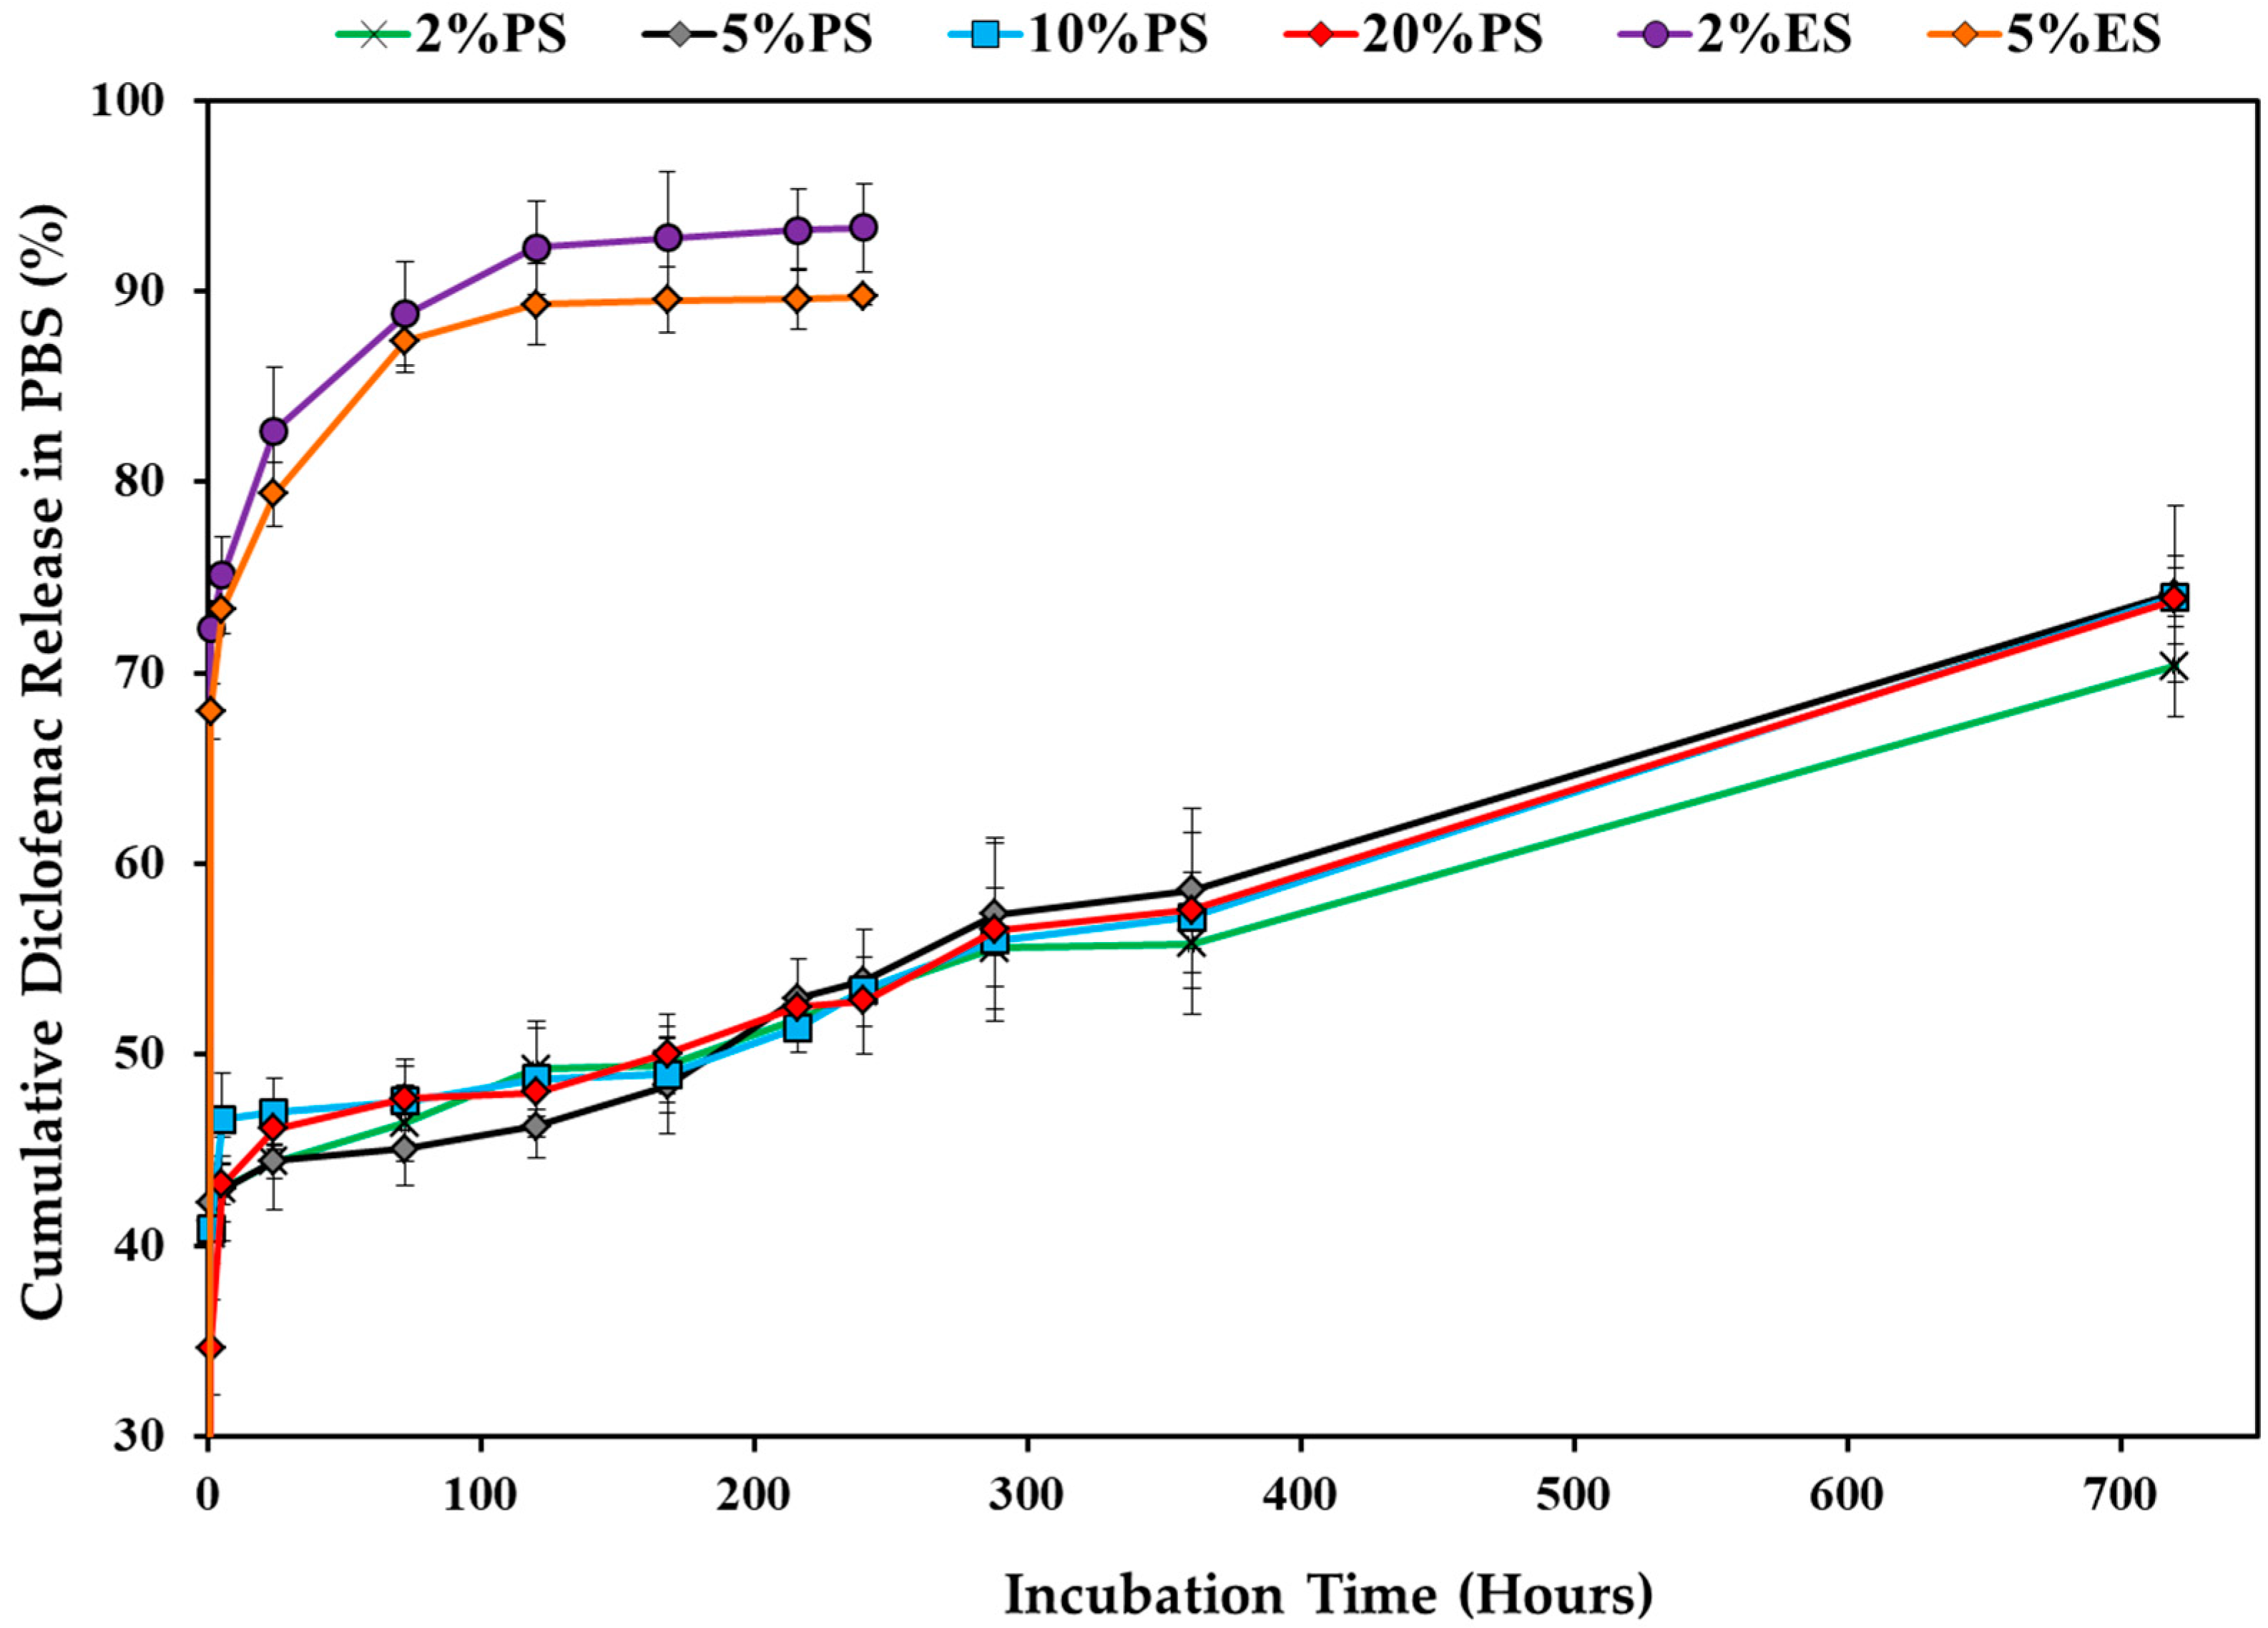
3.3. Drug Release Profile
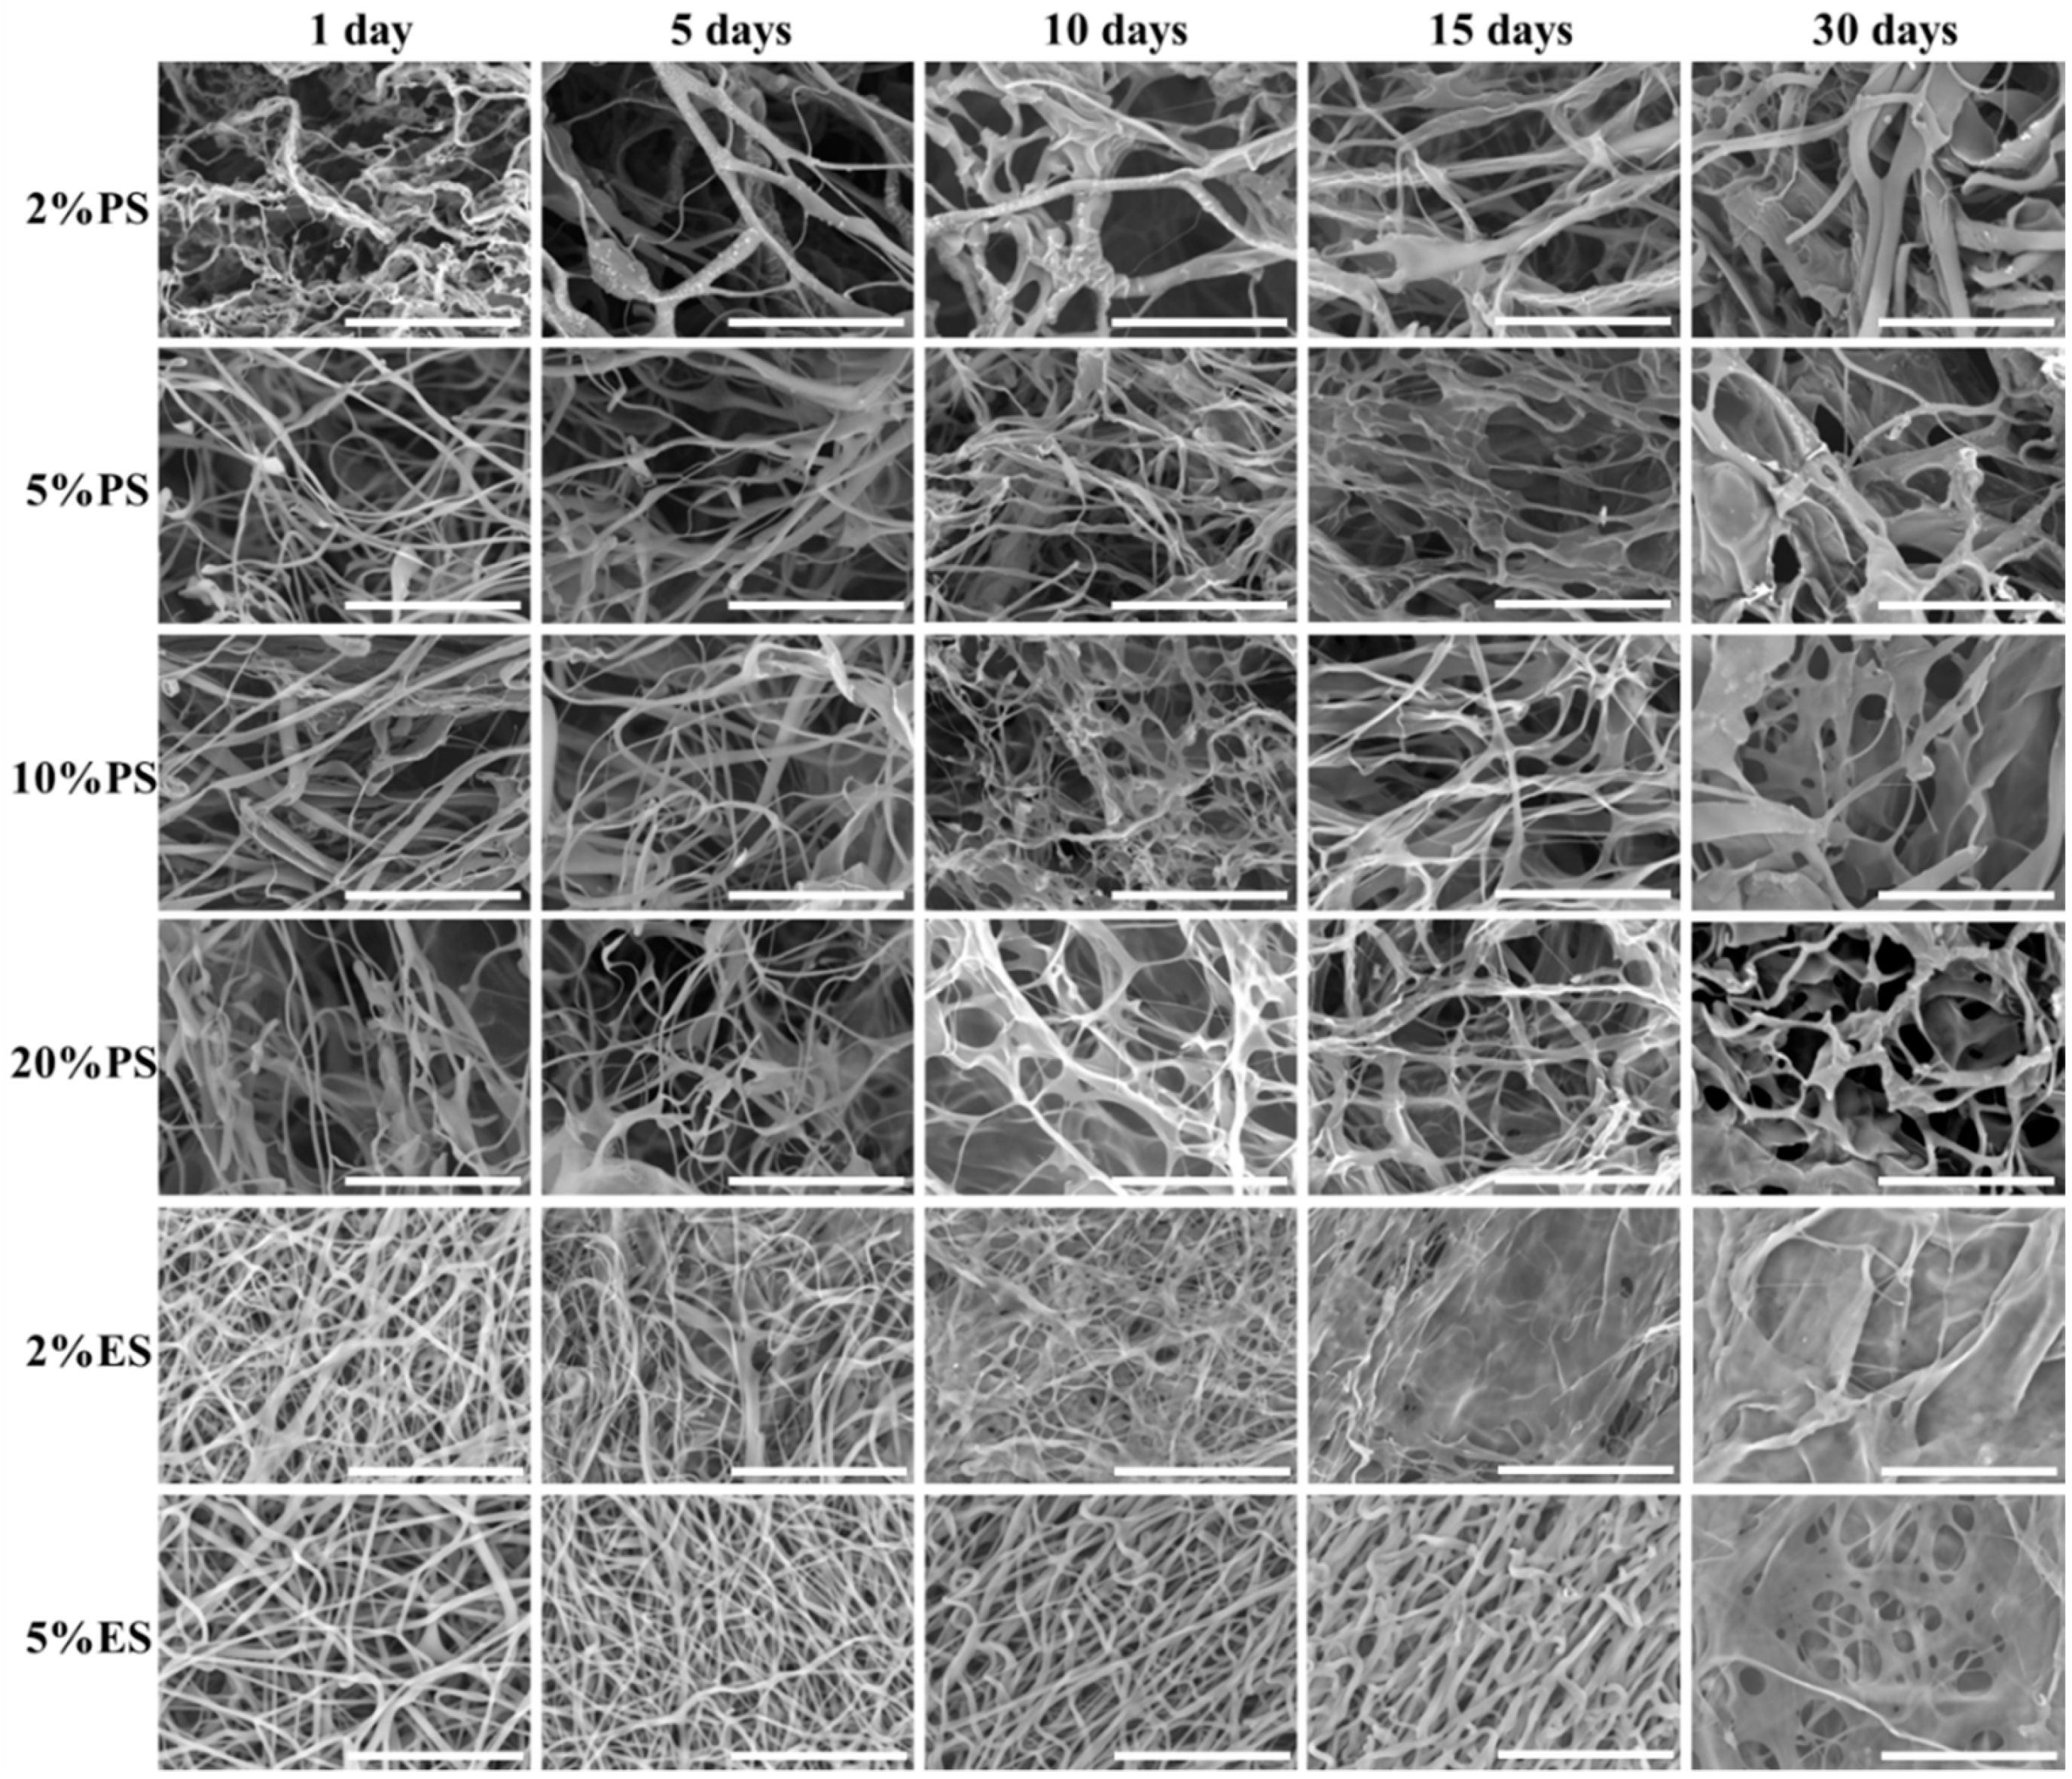
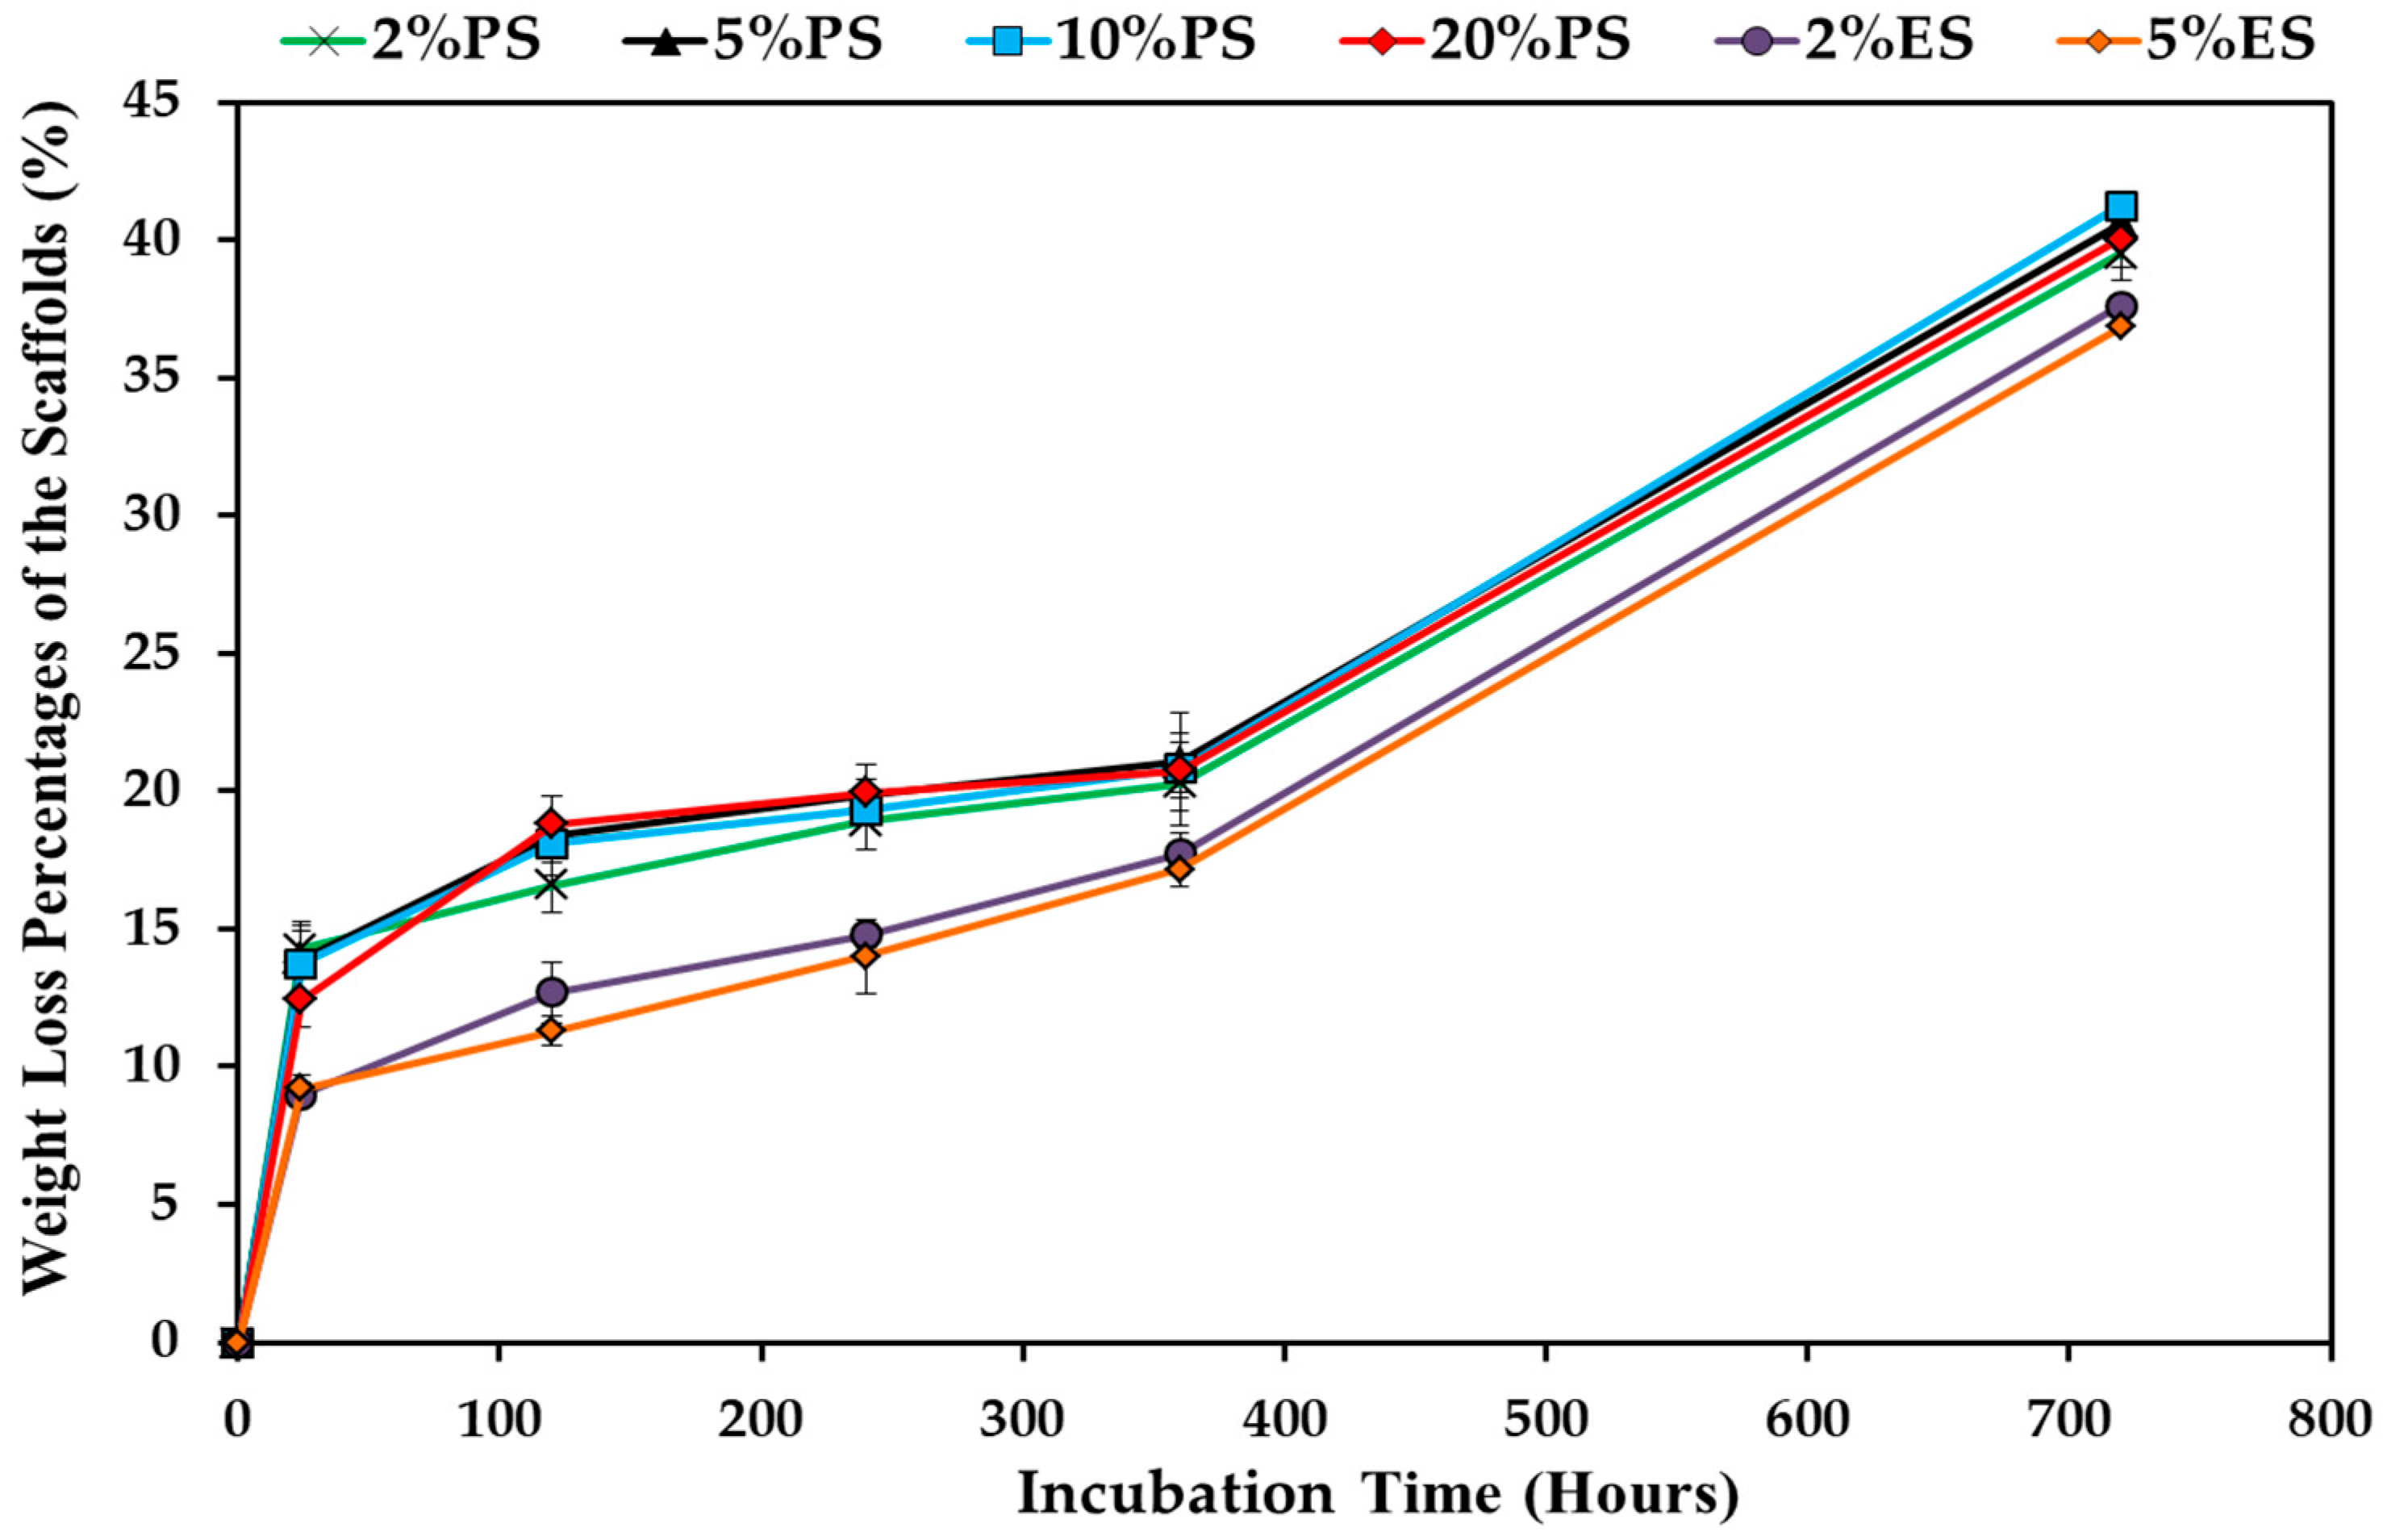
3.4. Degradation Behavior of the Drug Loaded Scaffolds
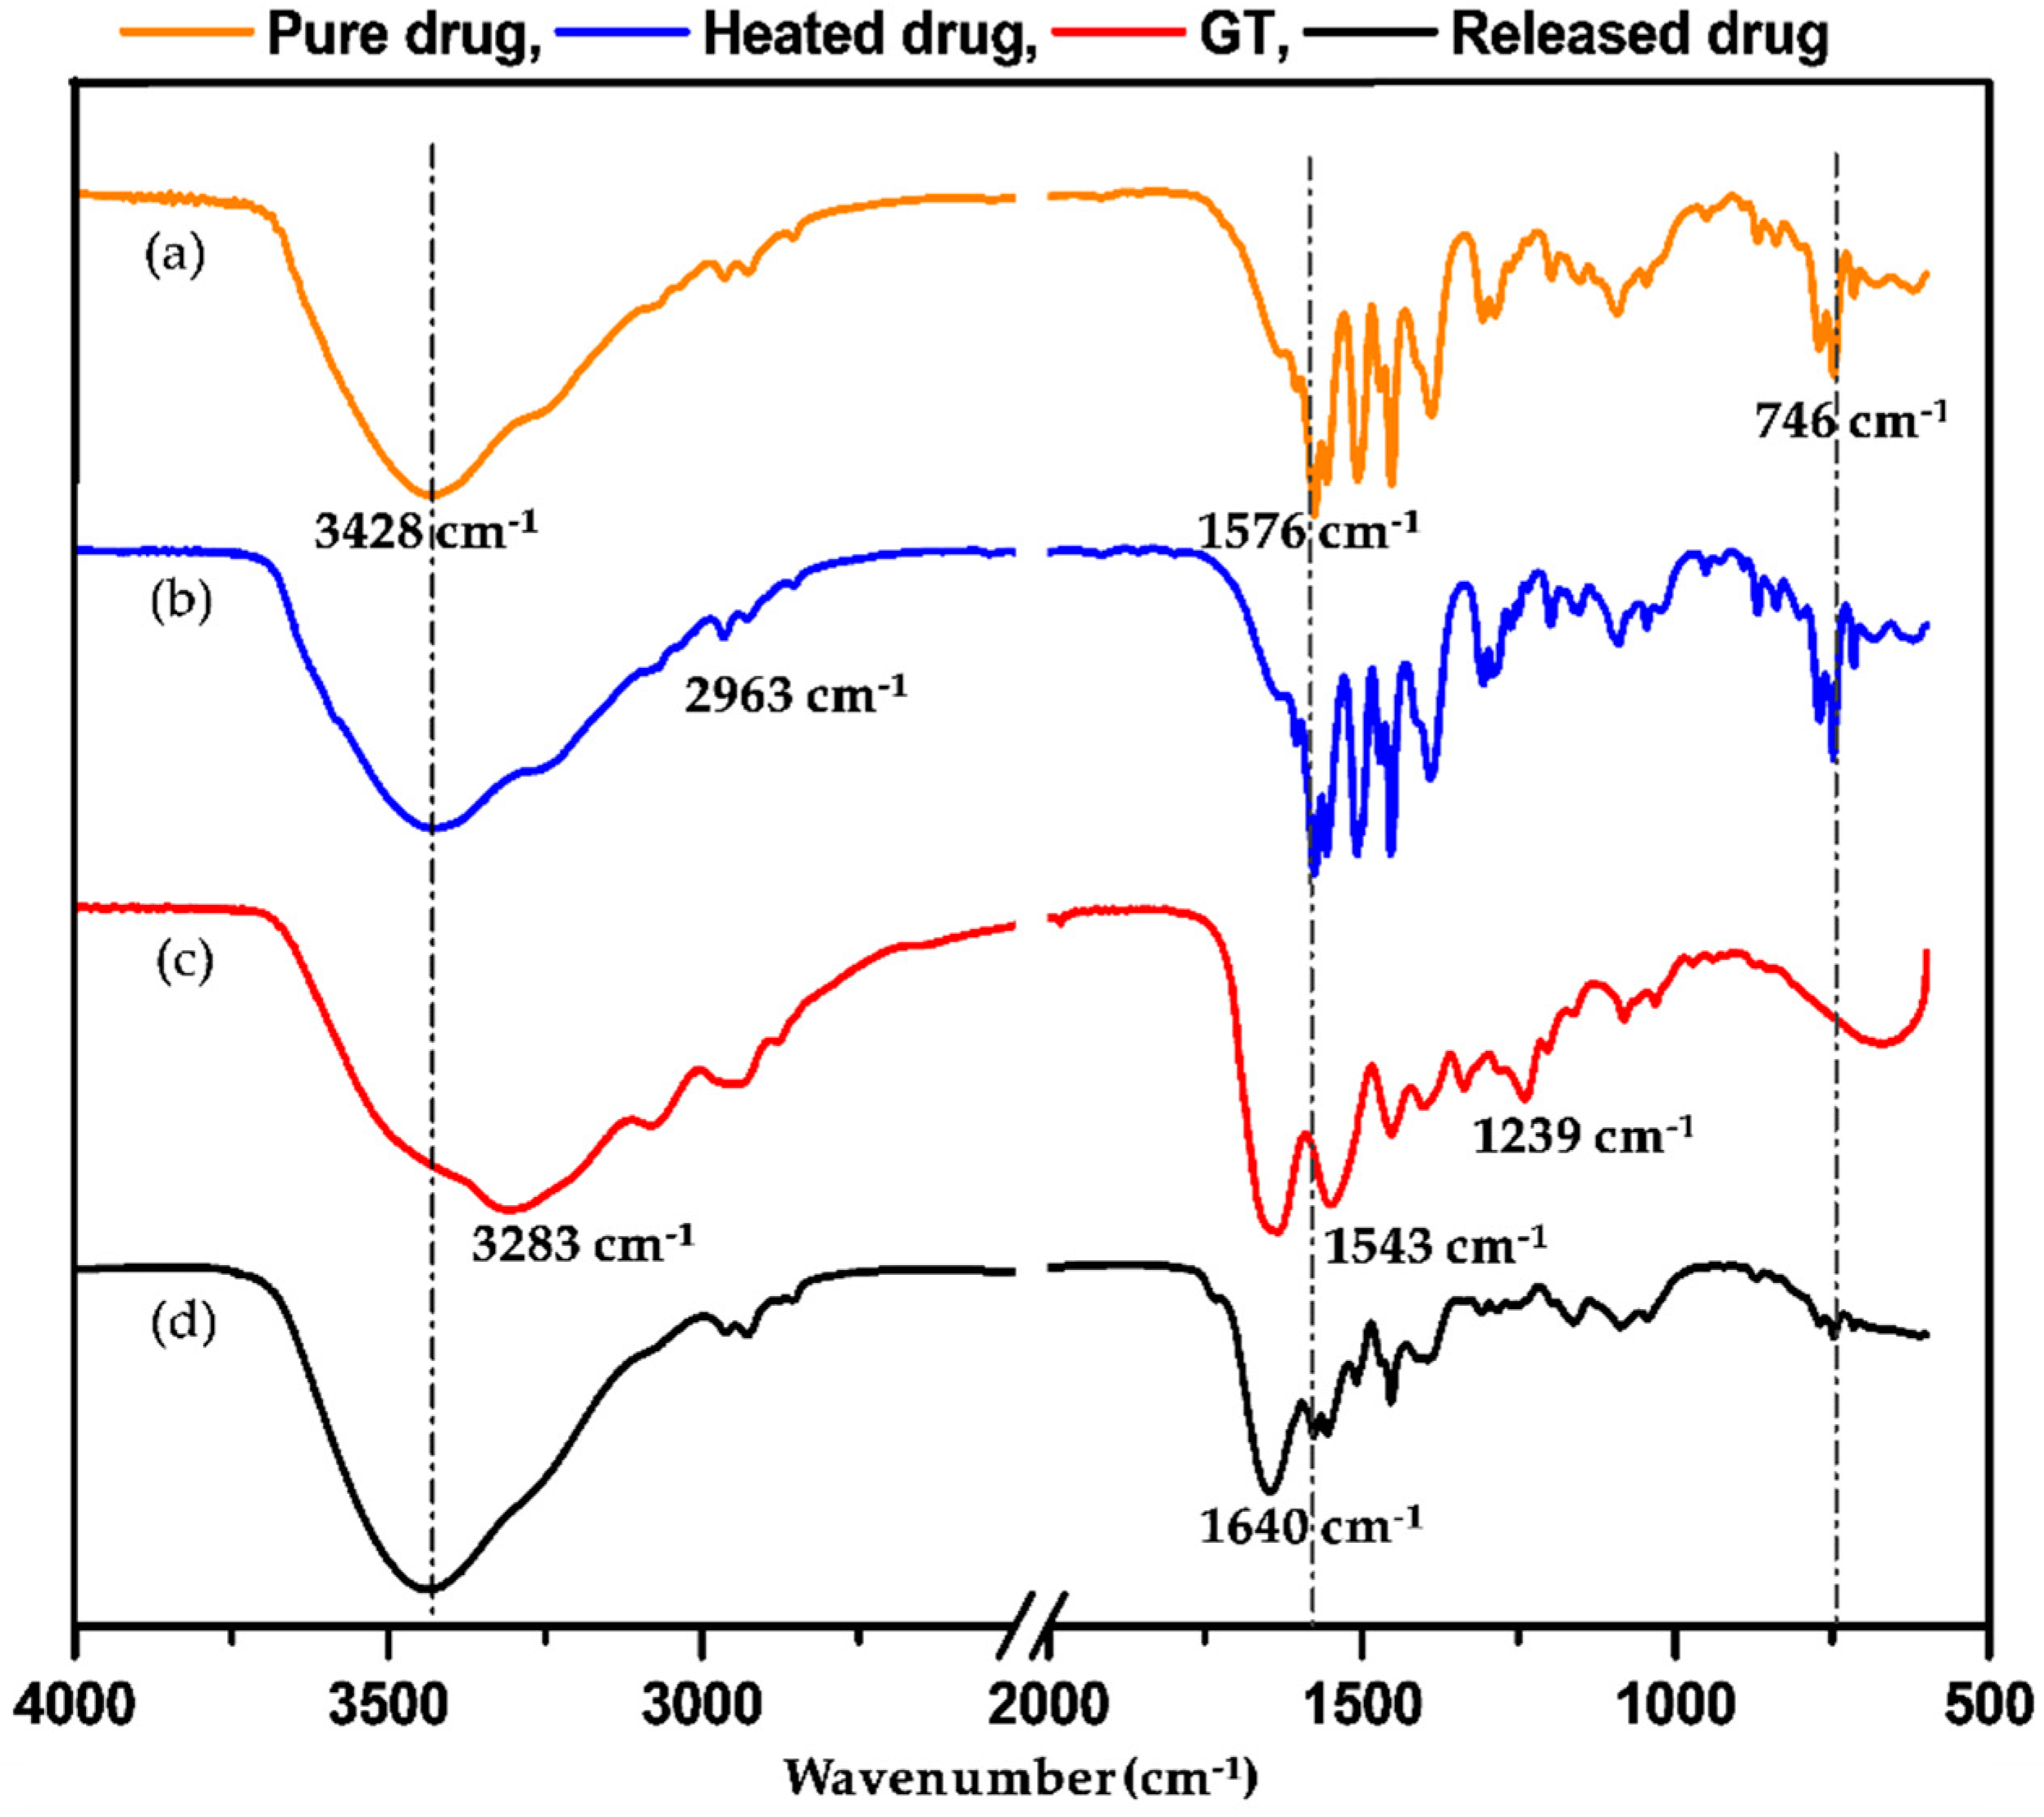
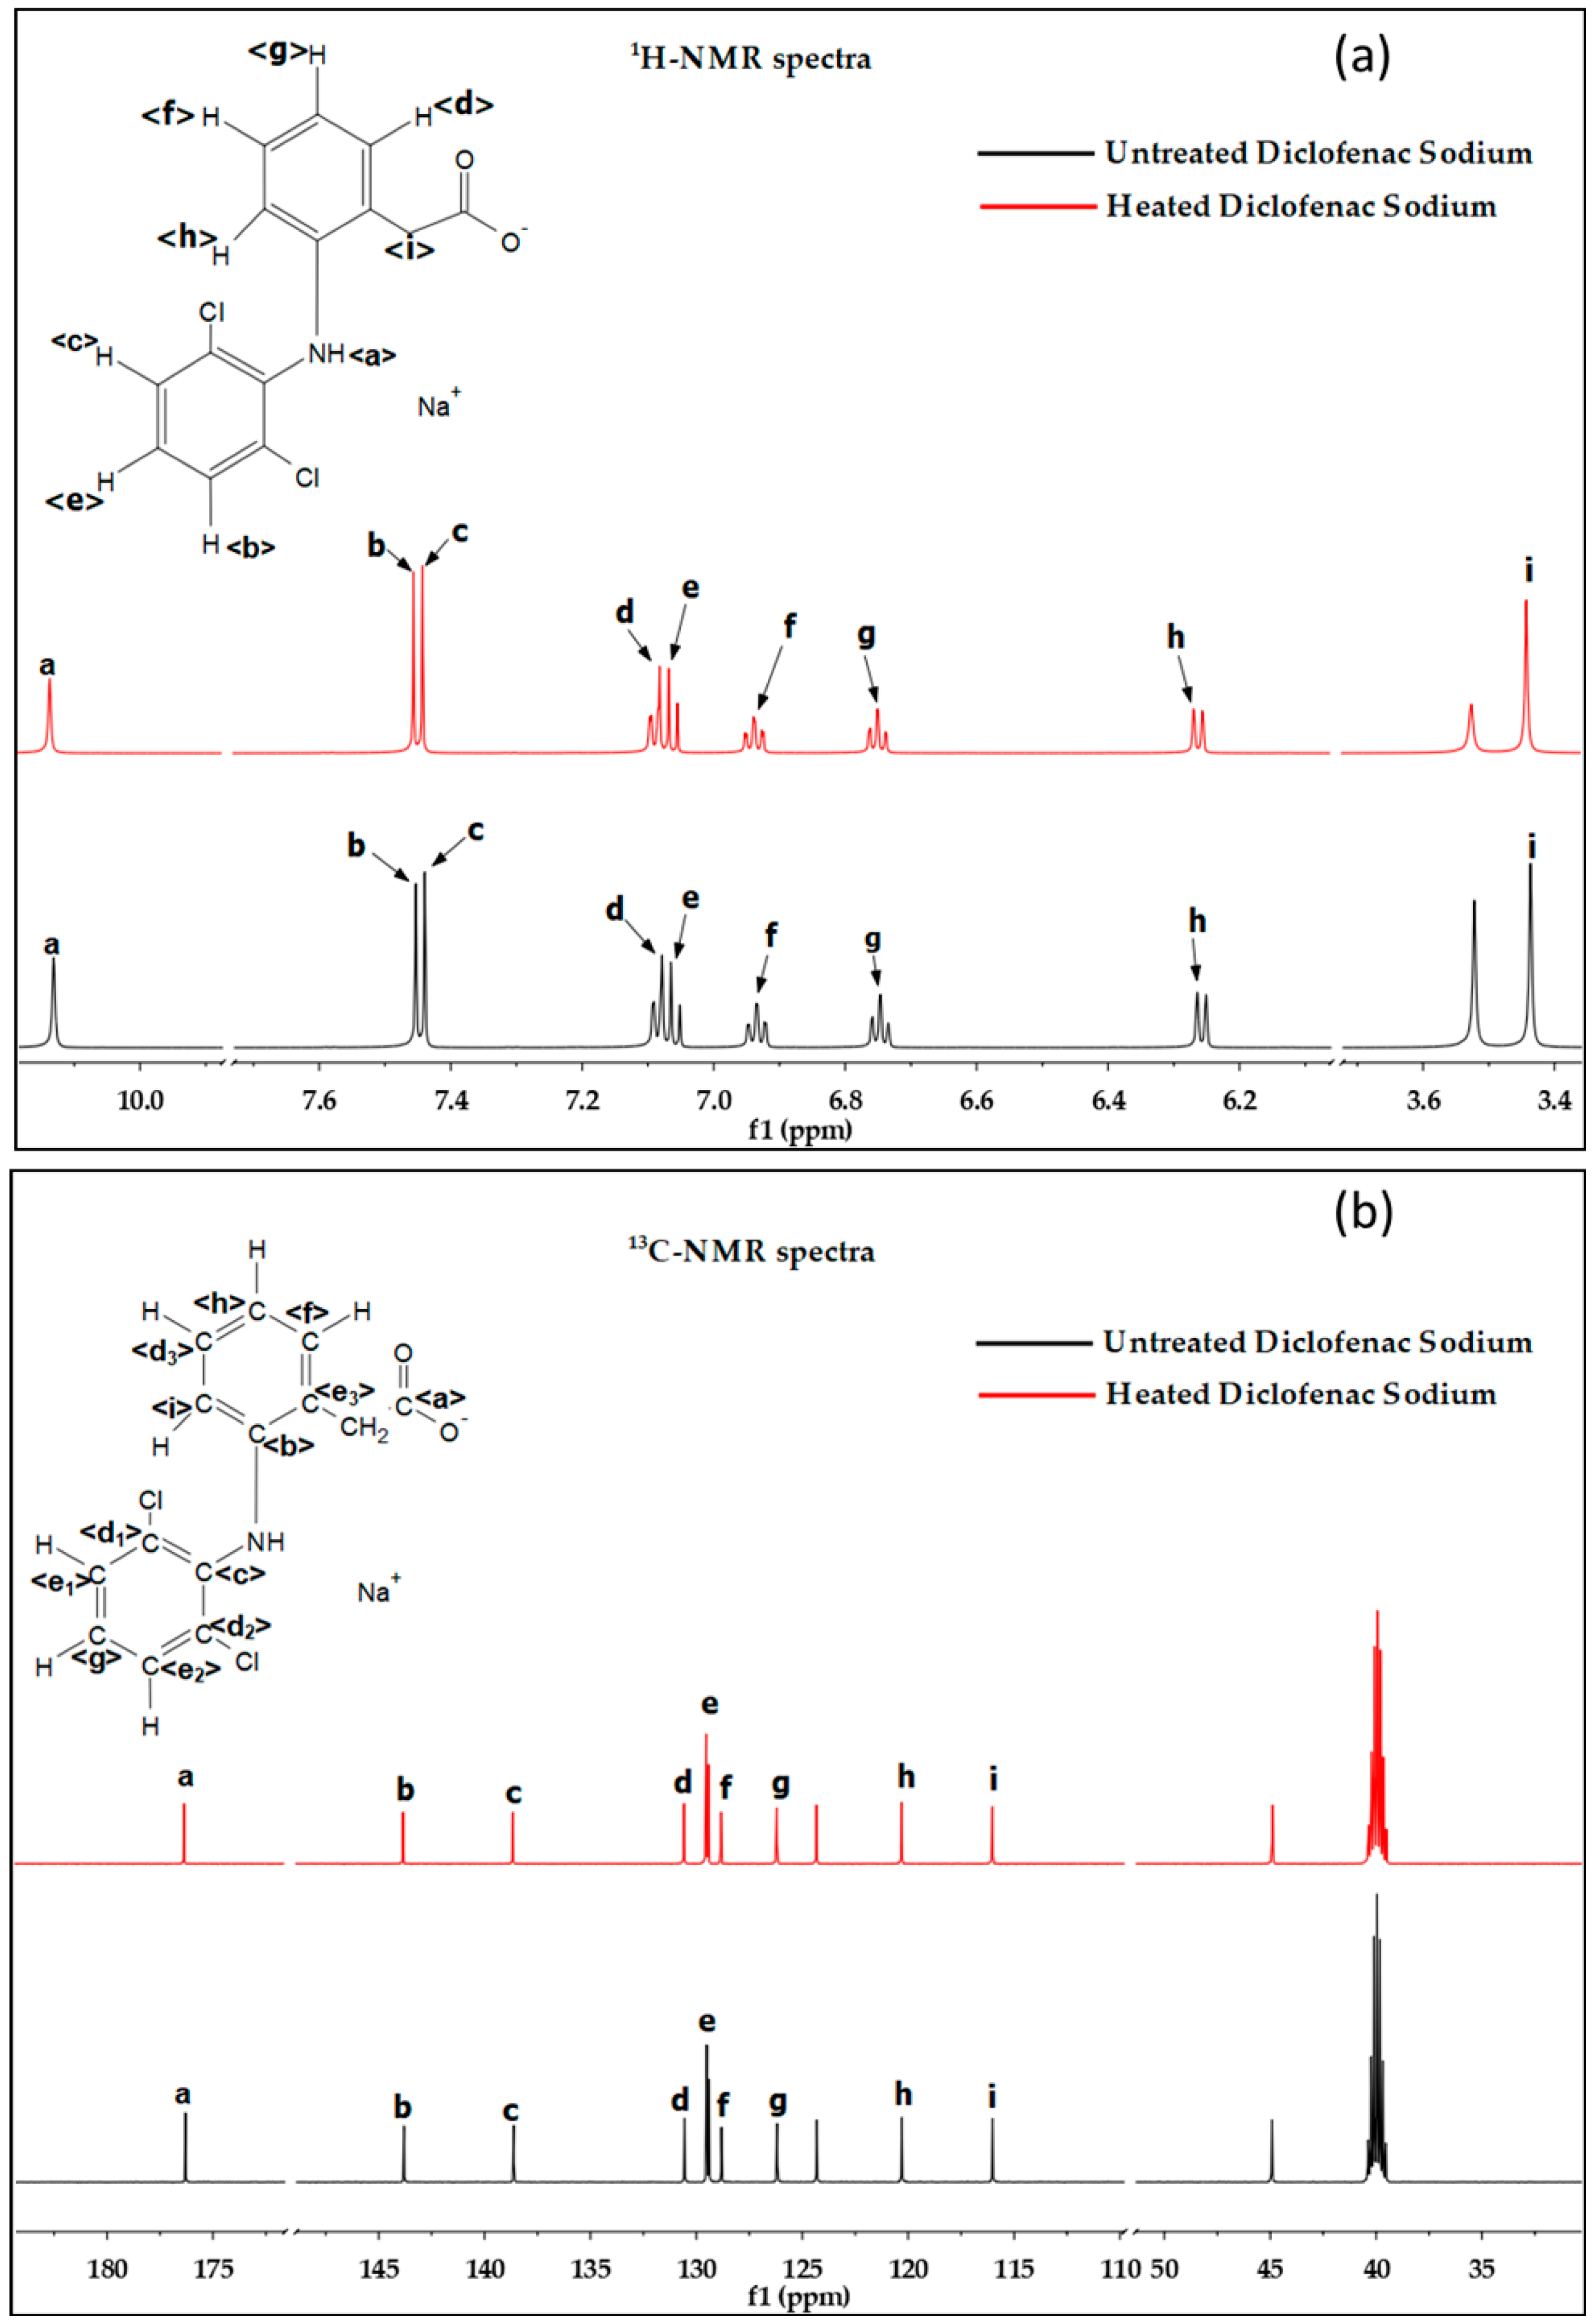
3.5. Chemical Structure Confirmation
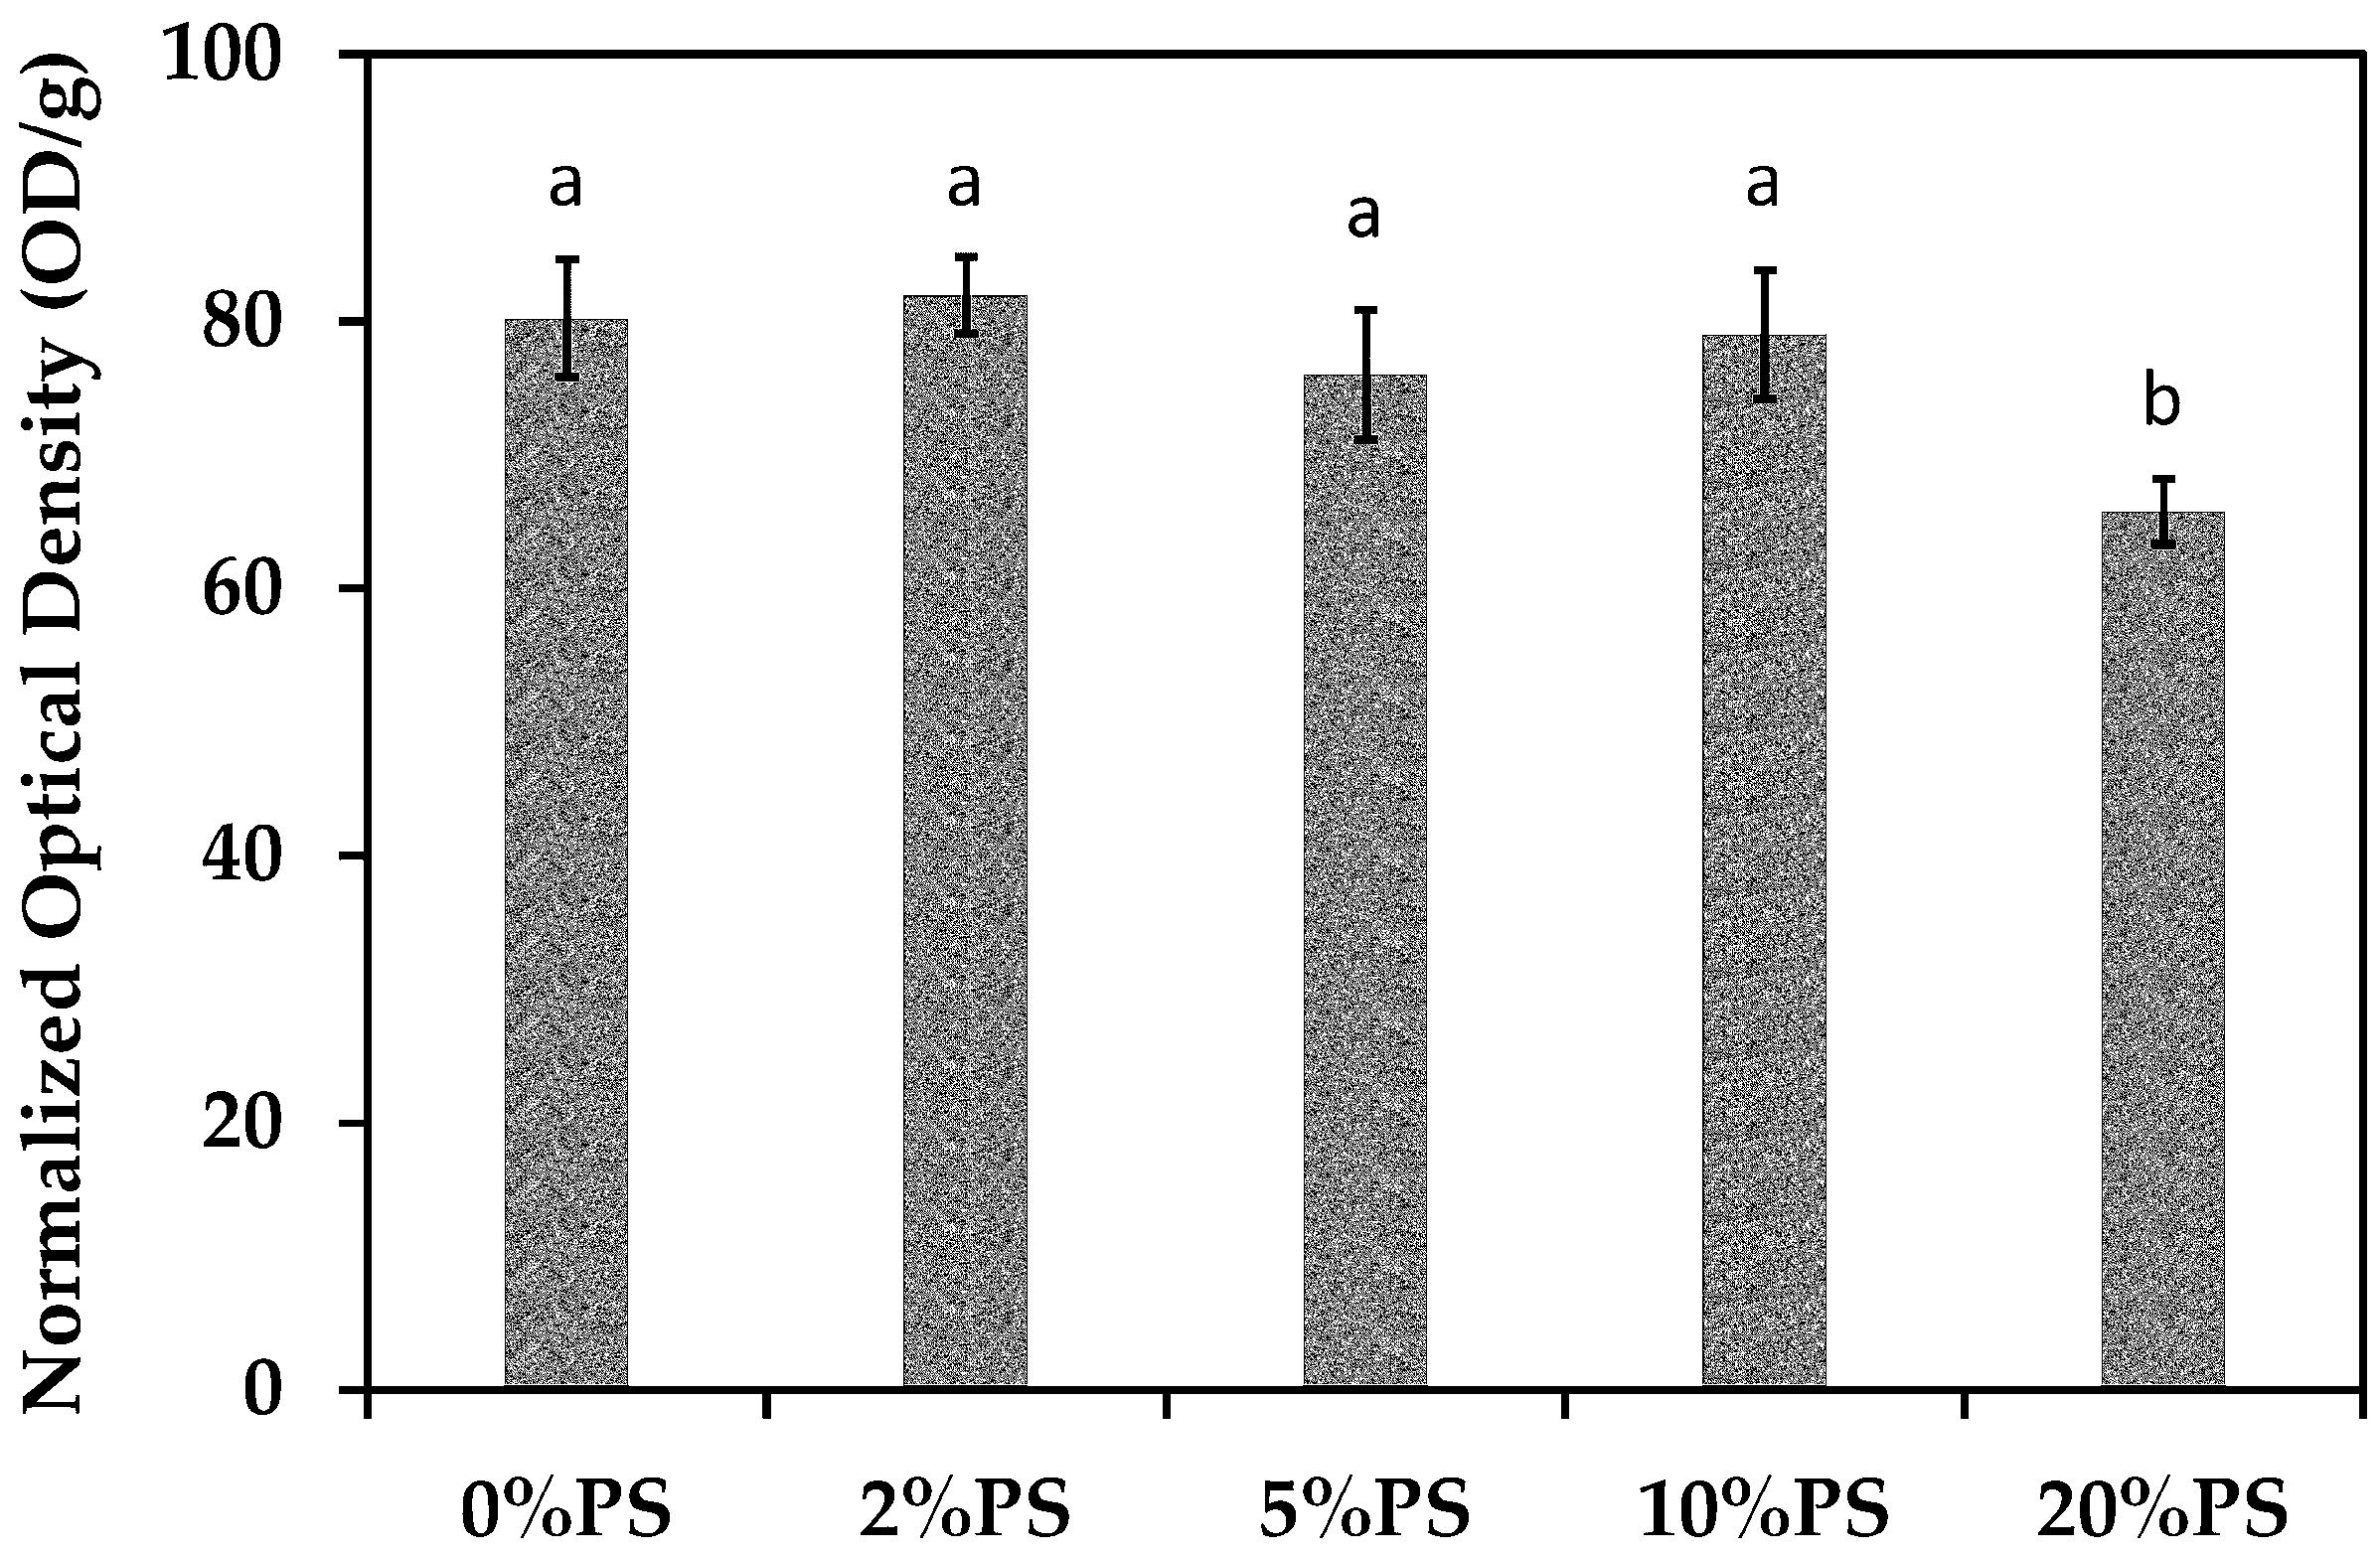
3.6. Cell Viability
4. Conclusions
Author Contributions
Funding
Acknowledgments
Conflicts of Interest
References
- Cai, S.; Xu, H.; Jiang, Q.; Yang, Y. Novel 3D electrospun scaffolds with fibers oriented randomly and evenly in three dimensions to closely mimic the unique architectures of extracellular matrices in soft tissues: Fabrication and mechanism study. Langmuir 2013, 29, 2311–2318. [Google Scholar] [CrossRef] [PubMed]
- Jiang, Q.; Xu, H.; Cai, S.; Yang, Y. Ultrafine fibrous gelatin scaffolds with deep cell infiltration mimicking 3D ECMs for soft tissue repair. J. Mater. Sci. Mater. Med. 2014, 25, 1789–1800. [Google Scholar] [CrossRef] [PubMed]
- Meka, S.R.K.; Chacko, L.A.; Ravi, A.; Chatterjee, K.; Ananthanarayanan, V. Role of Microtubules in Osteogenic Differentiation of Mesenchymal Stem Cells on 3D Nanofibrous Scaffolds. ACS Biomater. Sci. Eng. 2017, 3, 551–559. [Google Scholar] [CrossRef]
- Teo, W.E.; He, W.; Ramakrishna, S. Electrospun scaffold tailored for tissue-specific extracellular matrix. Biotechnol. J. 2006, 1, 918–929. [Google Scholar] [CrossRef] [PubMed]
- Aldana, A.A.; Malatto, L.; Rehman, M.A.U.; Boccaccini, A.R.; Abraham, G.A. Fabrication of Gelatin Methacrylate (GelMA) Scaffolds with Nano- and Micro-Topographical and Morphological Features. Nanomaterials 2019, 9, 120. [Google Scholar] [CrossRef] [PubMed]
- Maione, S.; Perez-Madrigal, M.M.; del Valle, L.J.; Diaz, A.; Franco, L.; Cativiela, C.; Puiggali, J.; Aleman, C. Biodegradable nanofibrous scaffolds as smart delivery vehicles for amino acids. J. Appl. Polym. Sci. 2017, 134. [Google Scholar] [CrossRef]
- Mirzaei, S.; Karkhaneh, A.; Soleimani, M.; Ardeshirylajimi, A.; Seyyed Zonouzi, H.; Hanaee-Ahvaz, H. Enhanced chondrogenic differentiation of stem cells using an optimized electrospun nanofibrous PLLA/PEG scaffolds loaded with glucosamine. J. Biomed. Mater. Res. Part A 2017, 105, 2461–2474. [Google Scholar] [CrossRef] [PubMed]
- Mohiti-Asli, M.; Saha, S.; Murphy, S.V.; Gracz, H.; Pourdeyhimi, B.; Atala, A.; Loboa, E.G. Ibuprofen loaded PLA nanofibrous scaffolds increase proliferation of human skin cells in vitro and promote healing of full thickness incision wounds in vivo. J. Biomed. Mater. Res. Part B 2017, 105, 327–339. [Google Scholar] [CrossRef] [PubMed]
- Rambhia, K.J.; Ma, P.X. Controlled drug release for tissue engineering. J. Control. Release 2015, 219 (Suppl. C), 119–128. [Google Scholar] [CrossRef]
- Alavarse, A.C.; de Oliveira Silva, F.W.; Colque, J.T.; da Silva, V.M.; Prieto, T.; Venancio, E.C.; Bonvent, J.-J. Tetracycline hydrochloride-loaded electrospun nanofibers mats based on PVA and chitosan for wound dressing. Mater. Sci. Eng. C 2017, 77, 271–281. [Google Scholar] [CrossRef] [PubMed]
- Balakrishnan, P.; Gardella, L.; Forouharshad, M.; Pellegrino, T.; Monticelli, O. Star poly(epsilon-caprolactone)-based electrospun fibers as biocompatible scaffold for doxorubicin with prolonged drug release activity. Colloids Surf. B 2017, 161, 488–496. [Google Scholar] [CrossRef] [PubMed]
- Azhar, A.; Ahmad, E.; Zia, Q.; Rauf, M.A.; Owais, M.; Ashraf, G.M. Recent advances in the development of novel protein scaffolds based therapeutics. Int. J. Biol. Macromol. 2017, 102, 630–641. [Google Scholar] [CrossRef] [PubMed]
- Pannier, A.K.; Shea, L.D. Controlled release systems for DNA delivery. Mol. Ther. 2004, 10, 19–26. [Google Scholar] [CrossRef] [PubMed]
- Hong, M.-H.; Hong, H.J.; Pang, H.; Lee, H.-J.; Yi, S.; Koh, W.-G. Controlled Release of Growth Factors from Multilayered Fibrous Scaffold for Functional Recoveries in Crushed Sciatic Nerve. ACS Biomater. Sci. Eng. 2018, 4, 576–586. [Google Scholar] [CrossRef]
- Prabhath, A.; Vernekar, V.N.; Sanchez, E.; Laurencin, C.T. Growth factor delivery strategies for rotator cuff repair and regeneration. Int. J. Pharm. 2018, 544, 358–371. [Google Scholar] [CrossRef] [PubMed]
- Kuttappan, S.; Mathew, D.; Jo, J.-I.; Tanaka, R.; Menon, D.; Ishimoto, T.; Nakano, T.; Nair, S.V.; Nair, M.B.; Tabata, Y. Dual release of growth factor from nanocomposite fibrous scaffold promotes vascularisation and bone regeneration in rat critical sized calvarial defect. Acta Biomater. 2018, 78, 36–47. [Google Scholar] [CrossRef] [PubMed]
- Zhang, Q.; Li, Y.; Lin, Z.Y.; Wong, K.K.Y.; Lin, M.; Yildirimer, L.; Zhao, X. Electrospun polymeric micro/nanofibrous scaffolds for long-term drug release and their biomedical applications. Drug Discov. Today 2017, 22, 1351–1366. [Google Scholar] [CrossRef] [PubMed]
- Kwak, H.W.; Woo, H.; Kim, I.-C.; Lee, K.H. Fish gelatin nanofibers prevent drug crystallization and enable ultrafast delivery. RSC Adv. 2017, 7, 40411–40417. [Google Scholar] [CrossRef]
- Bacelo, E.; Alves da Silva, M.; Cunha, C.; Faria, S.; Carvalho, A.; Reis, R.L.; Martins, A.; Neves, N.M. Biofunctional Nanofibrous Substrate for Local TNF-Capturing as a Strategy to Control Inflammation in Arthritic Joints. Nanomaterials 2019, 9, 567. [Google Scholar] [CrossRef]
- Contreras-Cáceres, R.; Cabeza, L.; Perazzoli, G.; Díaz, A.; López-Romero, J.M.; Melguizo, C.; Prados, J. Electrospun Nanofibers: Recent Applications in Drug Delivery and Cancer Therapy. Nanomaterials 2019, 9, 656. [Google Scholar] [CrossRef]
- Jiang, Q.; Hasan, S.M.K. Phase Separated Fibrous Structures: Mechanism Study and Applications. In Lightweight Materials from Biopolymers and Biofibers; Yang, Y., Xu, H., Yu, X., Eds.; American Chemical Society: Washington, DC, USA, 2014; Volume 1175, pp. 127–141. ISBN 9780841229976. [Google Scholar]
- Brown, B.N.; Badylak, S.F. Expanded applications, shifting paradigms and an improved understanding of host-biomaterial interactions. Acta Biomater. 2013, 9, 4948–4955. [Google Scholar] [CrossRef] [PubMed]
- Crupi, A.; Costa, A.; Tarnok, A.; Melzer, S.; Teodori, L. Inflammation in tissue engineering: The Janus between engraftment and rejection. Eur. J. Immunol. 2015, 45, 3222–3236. [Google Scholar] [CrossRef] [PubMed]
- Qian, L.; Zhang, H. Controlled freezing and freeze drying: A versatile route for porous and micro-/nano-structured materials. J. Chem. Technol. Biotechnol. 2011, 86, 172–184. [Google Scholar] [CrossRef]
- Ryu, B.H.; Ulrich, J. Controlled Nucleation and Growth of Protein Crystals by Solvent Freeze-Out. Cryst. Growth Des. 2012, 12, 6126–6133. [Google Scholar] [CrossRef]
- Zuo, J.-H.; Li, Z.-K.; Wei, C.; Yan, X.; Chen, Y.; Lang, W.-Z. Fine tuning the pore size and permeation performances of thermally induced phase separation (TIPS) -prepared PVDF membranes with saline water as quenching bath. J. Membr. Sci. 2019, 577, 79–90. [Google Scholar] [CrossRef]
- Beachley, V.; Wen, X. Effect of electrospinning parameters on the nanofiber diameter and length. Mater. Sci. Eng. C 2009, 29, 663–668. [Google Scholar] [CrossRef] [PubMed]
- Shen, X.; Yu, D.; Zhu, L.; Branford-White, C.; White, K.; Chatterton, N.P. Electrospun diclofenac sodium loaded Eudragit® L 100-55 nanofibers for colon-targeted drug delivery. Int. J. Pharm. 2011, 408, 200–207. [Google Scholar] [CrossRef] [PubMed]
- Shivakumar, H.N.; Desai, B.G.; Deshmukh, G. Design and Optimization of Diclofenac Sodium Controlled Release Solid Dispersions by Response Surface Methodology. Indian J. Pharm. Sci. 2008, 70, 22–30. [Google Scholar] [CrossRef] [PubMed]
- Ohyama, K.; Murayama, N.; Shimizu, M.; Yamazaki, H. Drug interactions of diclofenac and its oxidative metabolite with human liver microsomal cytochrome P450 1A2-dependent drug oxidation. Xenobiotica 2014, 44, 10–16. [Google Scholar] [CrossRef] [PubMed]
- Seibert, K.; Zhang, Y.; Leahy, K.; Hauser, S.; Masferrer, J.; Perkins, W.; Lee, L.; Isakson, P. The Role of Cyclooxygenase-2 in Inflammation. Proc. Natl. Acad. Sci. USA 1994, 91, 12013–12017. [Google Scholar] [CrossRef]


© 2019 by the authors. Licensee MDPI, Basel, Switzerland. This article is an open access article distributed under the terms and conditions of the Creative Commons Attribution (CC BY) license (http://creativecommons.org/licenses/by/4.0/).
Share and Cite
Hasan, S.M.K.; Li, R.; Wang, Y.; Reddy, N.; Liu, W.; Qiu, Y.; Jiang, Q. Sustained Local Delivery of Diclofenac from Three-Dimensional Ultrafine Fibrous Protein Scaffolds with Ultrahigh Drug Loading Capacity. Nanomaterials 2019, 9, 918. https://doi.org/10.3390/nano9070918
Hasan SMK, Li R, Wang Y, Reddy N, Liu W, Qiu Y, Jiang Q. Sustained Local Delivery of Diclofenac from Three-Dimensional Ultrafine Fibrous Protein Scaffolds with Ultrahigh Drug Loading Capacity. Nanomaterials. 2019; 9(7):918. https://doi.org/10.3390/nano9070918
Chicago/Turabian StyleHasan, S. M. Kamrul, Ran Li, Yichao Wang, Narendra Reddy, Wanshuang Liu, Yiping Qiu, and Qiuran Jiang. 2019. "Sustained Local Delivery of Diclofenac from Three-Dimensional Ultrafine Fibrous Protein Scaffolds with Ultrahigh Drug Loading Capacity" Nanomaterials 9, no. 7: 918. https://doi.org/10.3390/nano9070918
APA StyleHasan, S. M. K., Li, R., Wang, Y., Reddy, N., Liu, W., Qiu, Y., & Jiang, Q. (2019). Sustained Local Delivery of Diclofenac from Three-Dimensional Ultrafine Fibrous Protein Scaffolds with Ultrahigh Drug Loading Capacity. Nanomaterials, 9(7), 918. https://doi.org/10.3390/nano9070918