Electrical Conductivity and Dielectric Properties of Ethylene Glycol-Based Nanofluids Containing Silicon Oxide–Lignin Hybrid Particles


Abstract
:1. Introduction
2. Materials and Methods
2.1. Nanoparticles
2.2. Sample Preparation
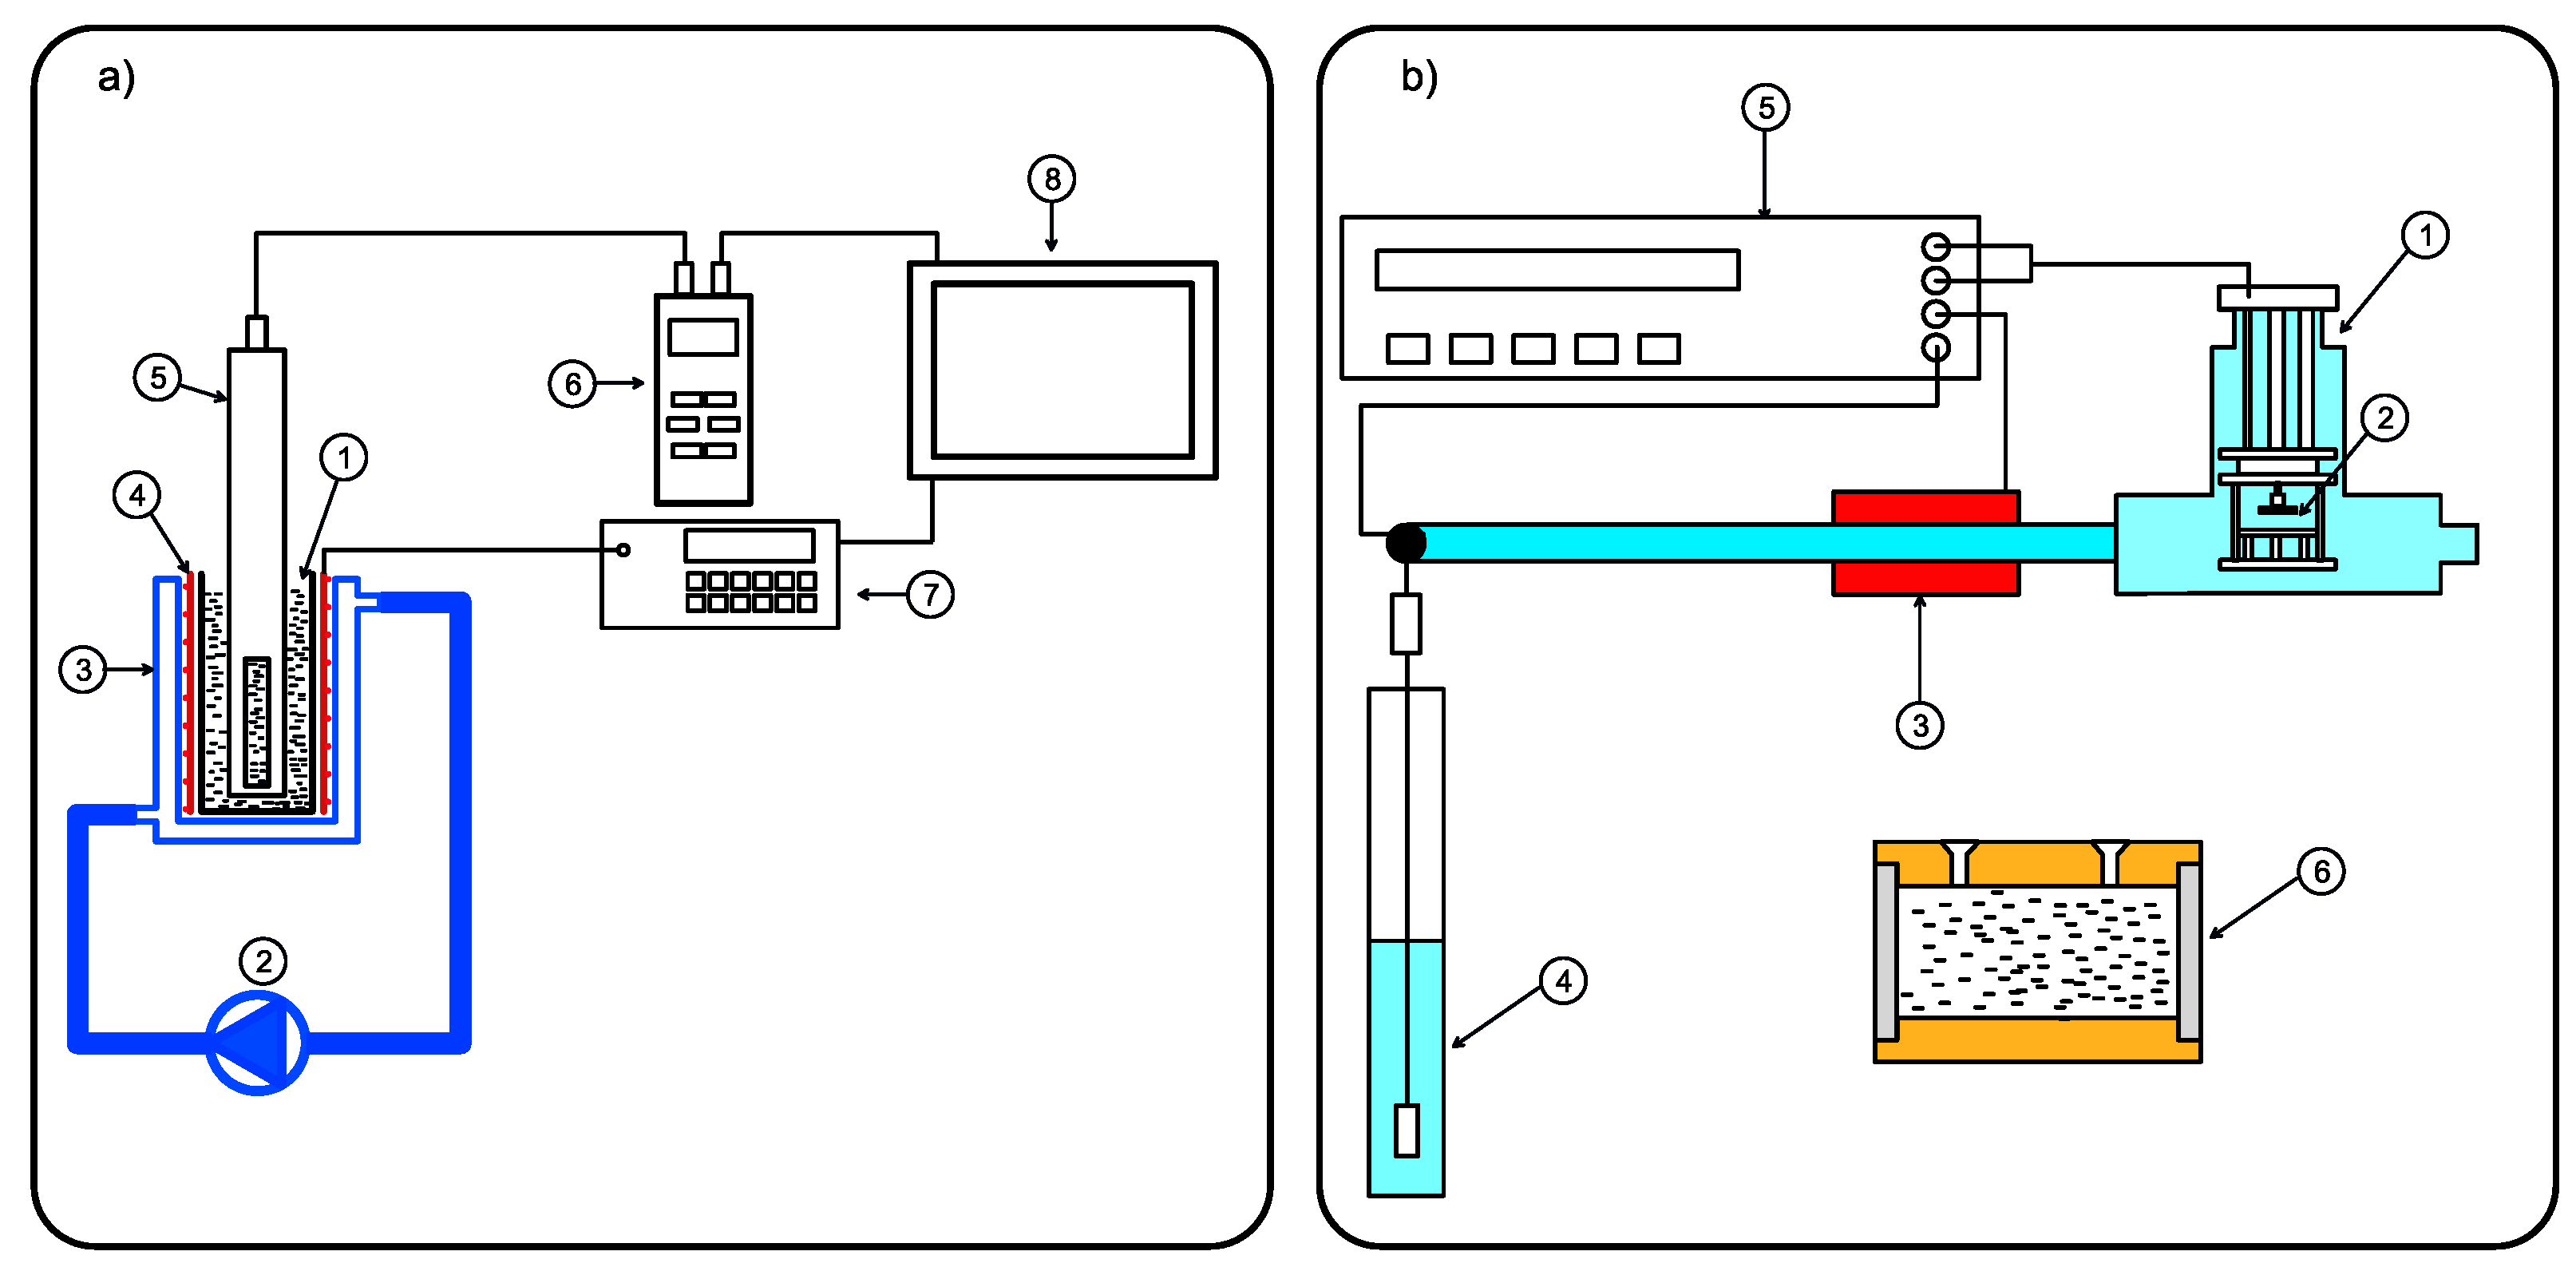
2.3. Measuring Methods
3. Results and Discussion
4. Conclusions
Author Contributions
Funding
Conflicts of Interest
Abbreviations
| bf | base fluid |
| nf | nanofluid |
| np | nanoparticles |
| EG | ethylene glycol |
| L | lignin |
| SiO | silicon dioxide |
| DC | direct current |
| AC | alternating current |
References
- Lu, A.H.; Salabas, E.E.; Schüth, F. Magnetic nanoparticles: Synthesis, protection, functionalization, and application. Angew. Chem. Int. Ed. 2007, 46, 1222–1244. [Google Scholar] [CrossRef] [PubMed]
- Luo, X.; Morrin, A.; Killard, A.J.; Smyth, M.R. Application of nanoparticles in electrochemical sensors and biosensors. Electroanal. Int. J. Devoted Fundam. Pract. Asp. Electroanal. 2006, 18, 319–326. [Google Scholar] [CrossRef]
- Esakkimuthu, T.; Sivakumar, D.; Akila, S. Application of nanoparticles in wastewater treatment. Pollut. Res. 2014, 33, 567–571. [Google Scholar]
- Shen, Y.; Tang, J.; Nie, Z.; Wang, Y.; Ren, Y.; Zuo, L. Preparation and application of magnetic Fe3O4 nanoparticles for wastewater purification. Sep. Purif. Technol. 2009, 68, 312–319. [Google Scholar] [CrossRef]
- Salata, O.V. Applications of nanoparticles in biology and medicine. J. Nanobiotechnol. 2004, 2, 3. [Google Scholar] [CrossRef] [PubMed]
- Couvreur, P. Nanoparticles in drug delivery: Past, present and future. Adv. Drug Deliv. Rev. 2013, 65, 21–23. [Google Scholar] [CrossRef] [PubMed]
- Orringer, D.A.; Koo, Y.; Chen, T.; Kopelman, R.; Sagher, O.; Philbert, M. Small solutions for big problems: The application of nanoparticles to brain tumor diagnosis and therapy. Clin. Pharmacol. Ther. 2009, 85, 531–534. [Google Scholar] [CrossRef] [PubMed]
- Sametband, M.; Shweky, I.; Banin, U.; Mandler, D.; Almog, J. Application of nanoparticles for the enhancement of latent fingerprints. Chem. Commun. 2007, 1142–1144. [Google Scholar] [CrossRef]
- Bi, S.S.; Shi, L.; Zhang, L.L. Application of nanoparticles in domestic refrigerators. Appl. Therm. Eng. 2008, 28, 1834–1843. [Google Scholar] [CrossRef]
- Sun, X.; Zhang, Y.; Chen, G.; Gai, Z. Application of nanoparticles in enhanced oil recovery: A critical review of recent progress. Energies 2017, 10, 345. [Google Scholar] [CrossRef]
- Choi, S.; Eastman, J.A. Enhancing thermal conductivity of fluids with nanoparticles. Dev. Appl. Non-Newton. Flow 1995, 231, 99–105. [Google Scholar]
- Angayarkanni, S.; Philip, J. Review on thermal properties of nanofluids: Recent developments. Adv. Colloid Interface Sci. 2015, 225, 146–176. [Google Scholar] [CrossRef] [PubMed]
- Özerinç, S.; Kakaç, S.; Yazıcıoğlu, A.G. Enhanced thermal conductivity of nanofluids: A state-of-the-art review. Microfluid. Nanofluidics 2010, 8, 145–170. [Google Scholar] [CrossRef]
- Bashirnezhad, K.; Rashidi, M.M.; Yang, Z.; Bazri, S.; Yan, W.M. A comprehensive review of last experimental studies on thermal conductivity of nanofluids. J. Therm. Anal. Calorim. 2015, 122, 863–884. [Google Scholar] [CrossRef]
- Murshed, S.S.; de Castro, C.N. Conduction and convection heat transfer characteristics of ethylene glycol based nanofluids—A review. Appl. Energy 2016, 184, 681–695. [Google Scholar] [CrossRef]
- Bashirnezhad, K.; Bazri, S.; Safaei, M.R.; Goodarzi, M.; Dahari, M.; Mahian, O.; Dalkılıça, A.S.; Wongwises, S. Viscosity of nanofluids: A review of recent experimental studies. Int. Commun. Heat Mass Transf. 2016, 73, 114–123. [Google Scholar] [CrossRef]
- Sharma, A.K.; Tiwari, A.K.; Dixit, A.R. Rheological behaviour of nanofluids: A review. Renew. Sustain. Energy Rev. 2016, 53, 779–791. [Google Scholar] [CrossRef]
- Murshed, S.S.; Estellé, P. A state of the art review on viscosity of nanofluids. Renew. Sustain. Energy Rev. 2017, 76, 1134–1152. [Google Scholar] [CrossRef]
- Gorji, T.B.; Ranjbar, A. A review on optical properties and application of nanofluids in direct absorption solar collectors (DASCs). Renew. Sustain. Energy Rev. 2017, 72, 10–32. [Google Scholar] [CrossRef]
- Kasaeian, A.; Eshghi, A.T.; Sameti, M. A review on the applications of nanofluids in solar energy systems. Renew. Sustain. Energy Rev. 2015, 43, 584–598. [Google Scholar] [CrossRef]
- Mahian, O.; Kianifar, A.; Kalogirou, S.A.; Pop, I.; Wongwises, S. A review of the applications of nanofluids in solar energy. Int. J. Heat Mass Transf. 2013, 57, 582–594. [Google Scholar] [CrossRef]
- Fal, J.; Mahian, O.; Żyła, G. Nanofluids in the Service of High Voltage Transformers: Breakdown Properties of Transformer Oils with Nanoparticles, a Review. Energies 2018, 11, 2942. [Google Scholar] [CrossRef]
- Estellé, P.; Cabaleiro, D.; Żyła, G.; Lugo, L.; Murshed, S.S. Current trends in surface tension and wetting behavior of nanofluids. Renew. Sustain. Energy Rev. 2018, 94, 931–944. [Google Scholar] [CrossRef]
- Żyła, G.; Fal, J. Experimental studies on viscosity, thermal and electrical conductivity of aluminum nitride–ethylene glycol (AlN–EG) nanofluids. Thermochim. Acta 2016, 637, 11–16. [Google Scholar] [CrossRef]
- Sarojini, K.K.; Manoj, S.V.; Singh, P.K.; Pradeep, T.; Das, S.K. Electrical conductivity of ceramic and metallic nanofluids. Colloids Surfaces A 2013, 417, 39–46. [Google Scholar] [CrossRef]
- Żyła, G.; Fal, J.; Bikić, S.; Wanic, M. Ethylene glycol based silicon nitride nanofluids: An experimental study on their thermophysical, electrical and optical properties. Phys. E 2018, 104, 82–90. [Google Scholar] [CrossRef]
- Klapiszewski, Ł.; Bula, K.; Sobczak, M.; Jesionowski, T. Influence of processing conditions on the thermal stability and mechanical properties of PP/silica-lignin composites. Int. J. Polym. Sci. 2016, 2016. [Google Scholar] [CrossRef]
- Klapiszewski, Ł.; Oliwa, R.; Oleksy, M.; Jesionowski, T. Calcium lignosulfonate as eco-friendly additive for crosslinking fibrous composites with phenol-formaldehyde resin matrix. Polimery-W 2018, 63. [Google Scholar] [CrossRef]
- Bula, K.; Klapiszewski, Ł.; Jesionowski, T. A novel functional silica/lignin hybrid material as a potential bio-based polypropylene filler. Polym. Compos. 2015, 36, 913–922. [Google Scholar] [CrossRef]
- Fal, J.; Żyła, G. Effect of Temperature and Mass Concentration of SiO2 Nanoparticles on Electrical Conductivity of Ethylene Glycol. Acta Phys. Pol. A 2017, 132. [Google Scholar] [CrossRef]
- Hwang, Y.j.; Lee, J.; Lee, C.; Jung, Y.; Cheong, S.; Lee, C.; Ku, B.; Jang, S. Stability and thermal conductivity characteristics of nanofluids. Thermochim. Acta 2007, 455, 70–74. [Google Scholar] [CrossRef]
- Namburu, P.; Kulkarni, D.; Dandekar, A.; Das, D. Experimental investigation of viscosity and specific heat of silicon dioxide nanofluids. Micro Nano Lett. 2007, 2, 67–71. [Google Scholar] [CrossRef]
- Talib, S.; Azmi, W.; Zakaria, I.; Mohamed, W.; Mamat, A.; Ismail, H.; Daud, W. Thermophysical Properties of Silicon Dioxide (SiO2) in Ethylene Glycol/Water Mixture for Proton Exchange Membrane Fuel Cell Cooling Application. Energy Procedia 2015, 79, 366–371. [Google Scholar] [CrossRef]
- Żyła, G.; Fal, J. Viscosity, thermal and electrical conductivity of silicon dioxide–ethylene glycol transparent nanofluids: An experimental studies. Thermochim. Acta 2017, 650, 106–113. [Google Scholar] [CrossRef]
- Parveen, B.; Hassan, M.; Atiq, S.; Riaz, S.; Naseem, S.; Zaman, S. Structural, dielectric and ferromagnetic properties of nano-crystalline Co-doped SnS. J. Mater. Sci. 2017, 52, 7369–7381. [Google Scholar] [CrossRef]
- Sengwa, R.; Choudhary, S.; Sankhla, S. Low frequency dielectric relaxation processes and ionic conductivity of montmorillonite clay nanoparticles colloidal suspension in poly (vinyl pyrrolidone)-ethylene glycol blends. Express Polym. Lett. 2008, 2, 800–809. [Google Scholar] [CrossRef]


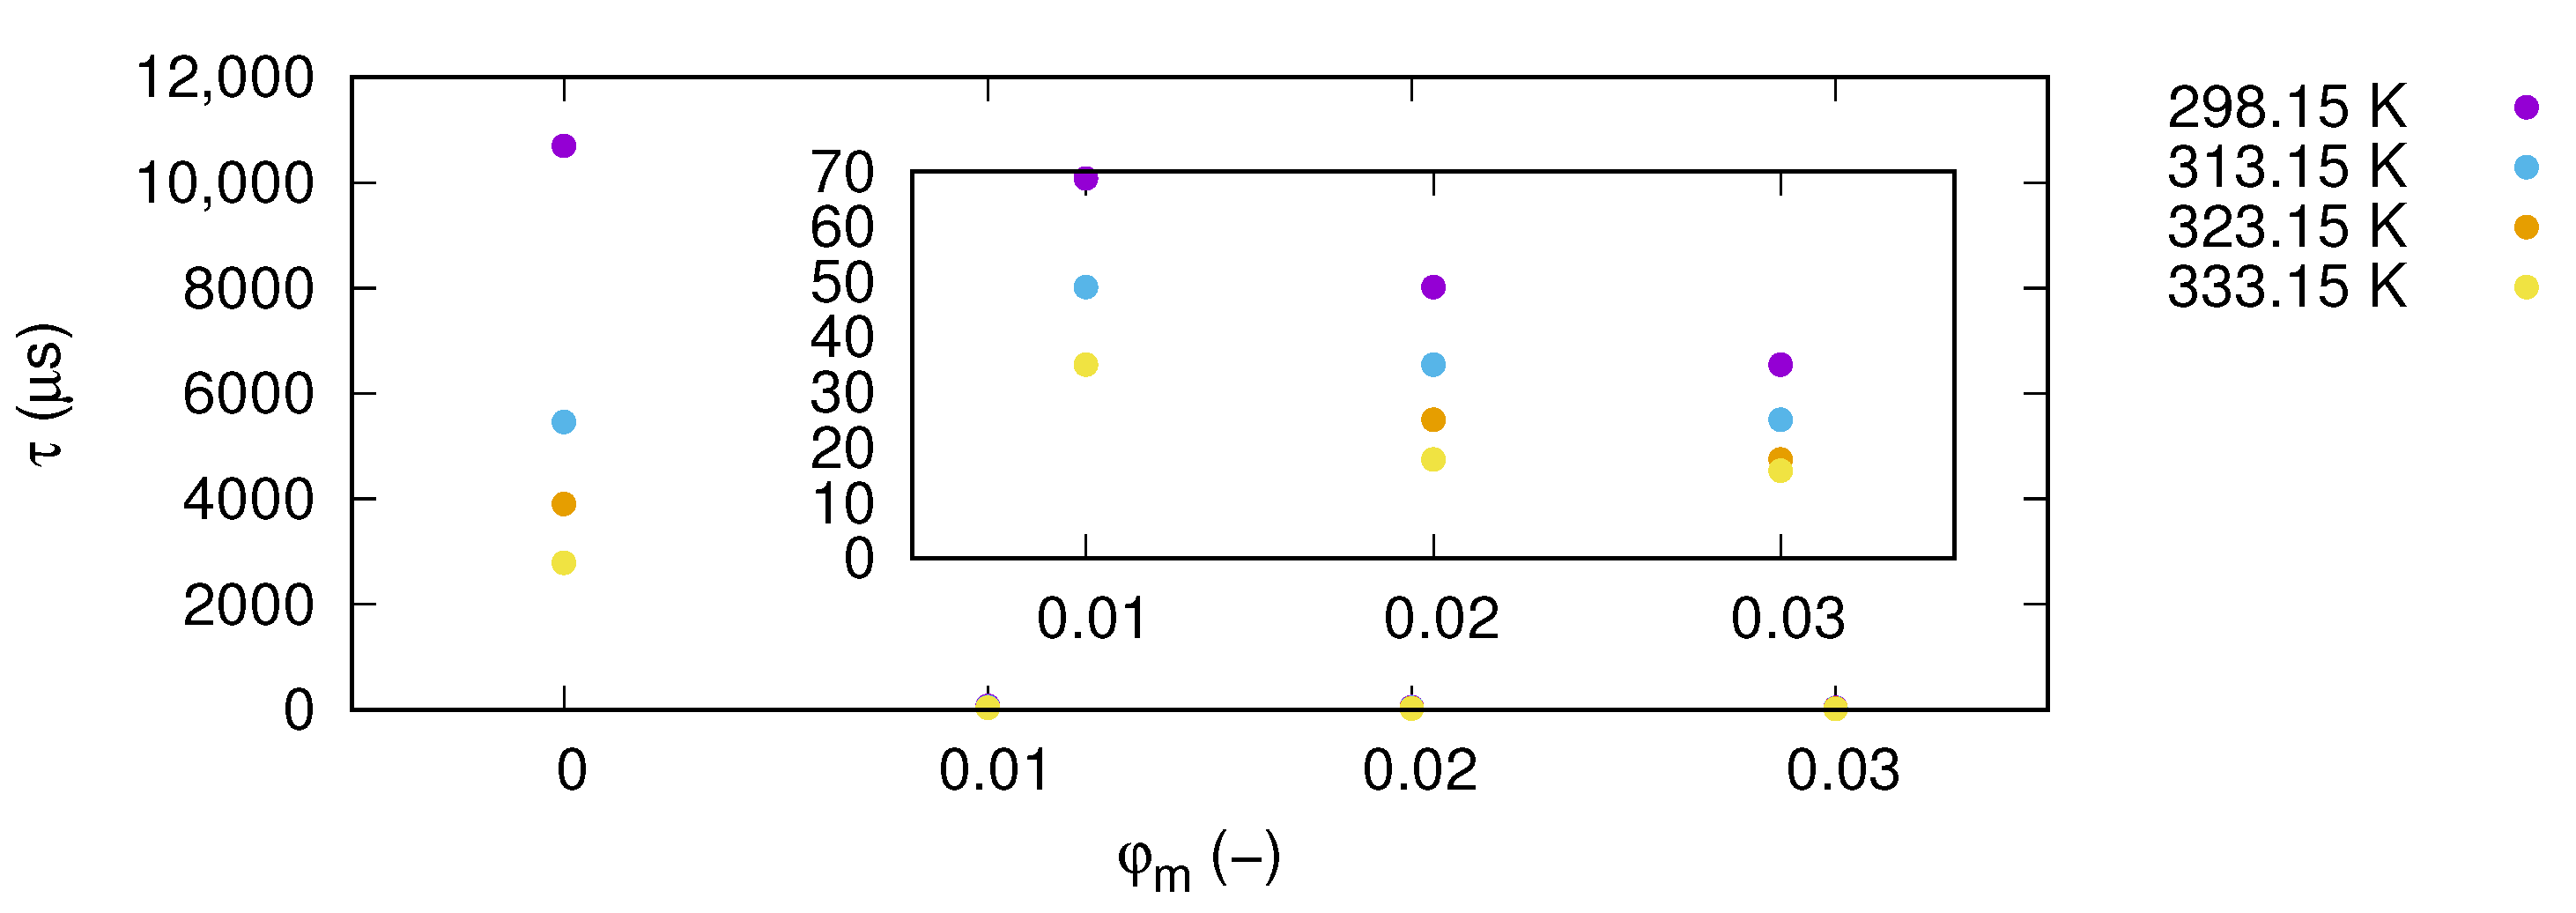
| , (s) | ||||
|---|---|---|---|---|
| 298.15 K | 313.15 K | 323.15 K | 333.15 K | |
| 0 | 10,700.2 | 5459.3 | 3899.5 | 2785.4 |
| 0.01 | 68.8 | 49.1 | 35.1 | 35.1 |
| 0.02 | 49.1 | 35.1 | 25.1 | 17.9 |
| 0.03 | 35.1 | 25.1 | 17.9 | 15.9 |
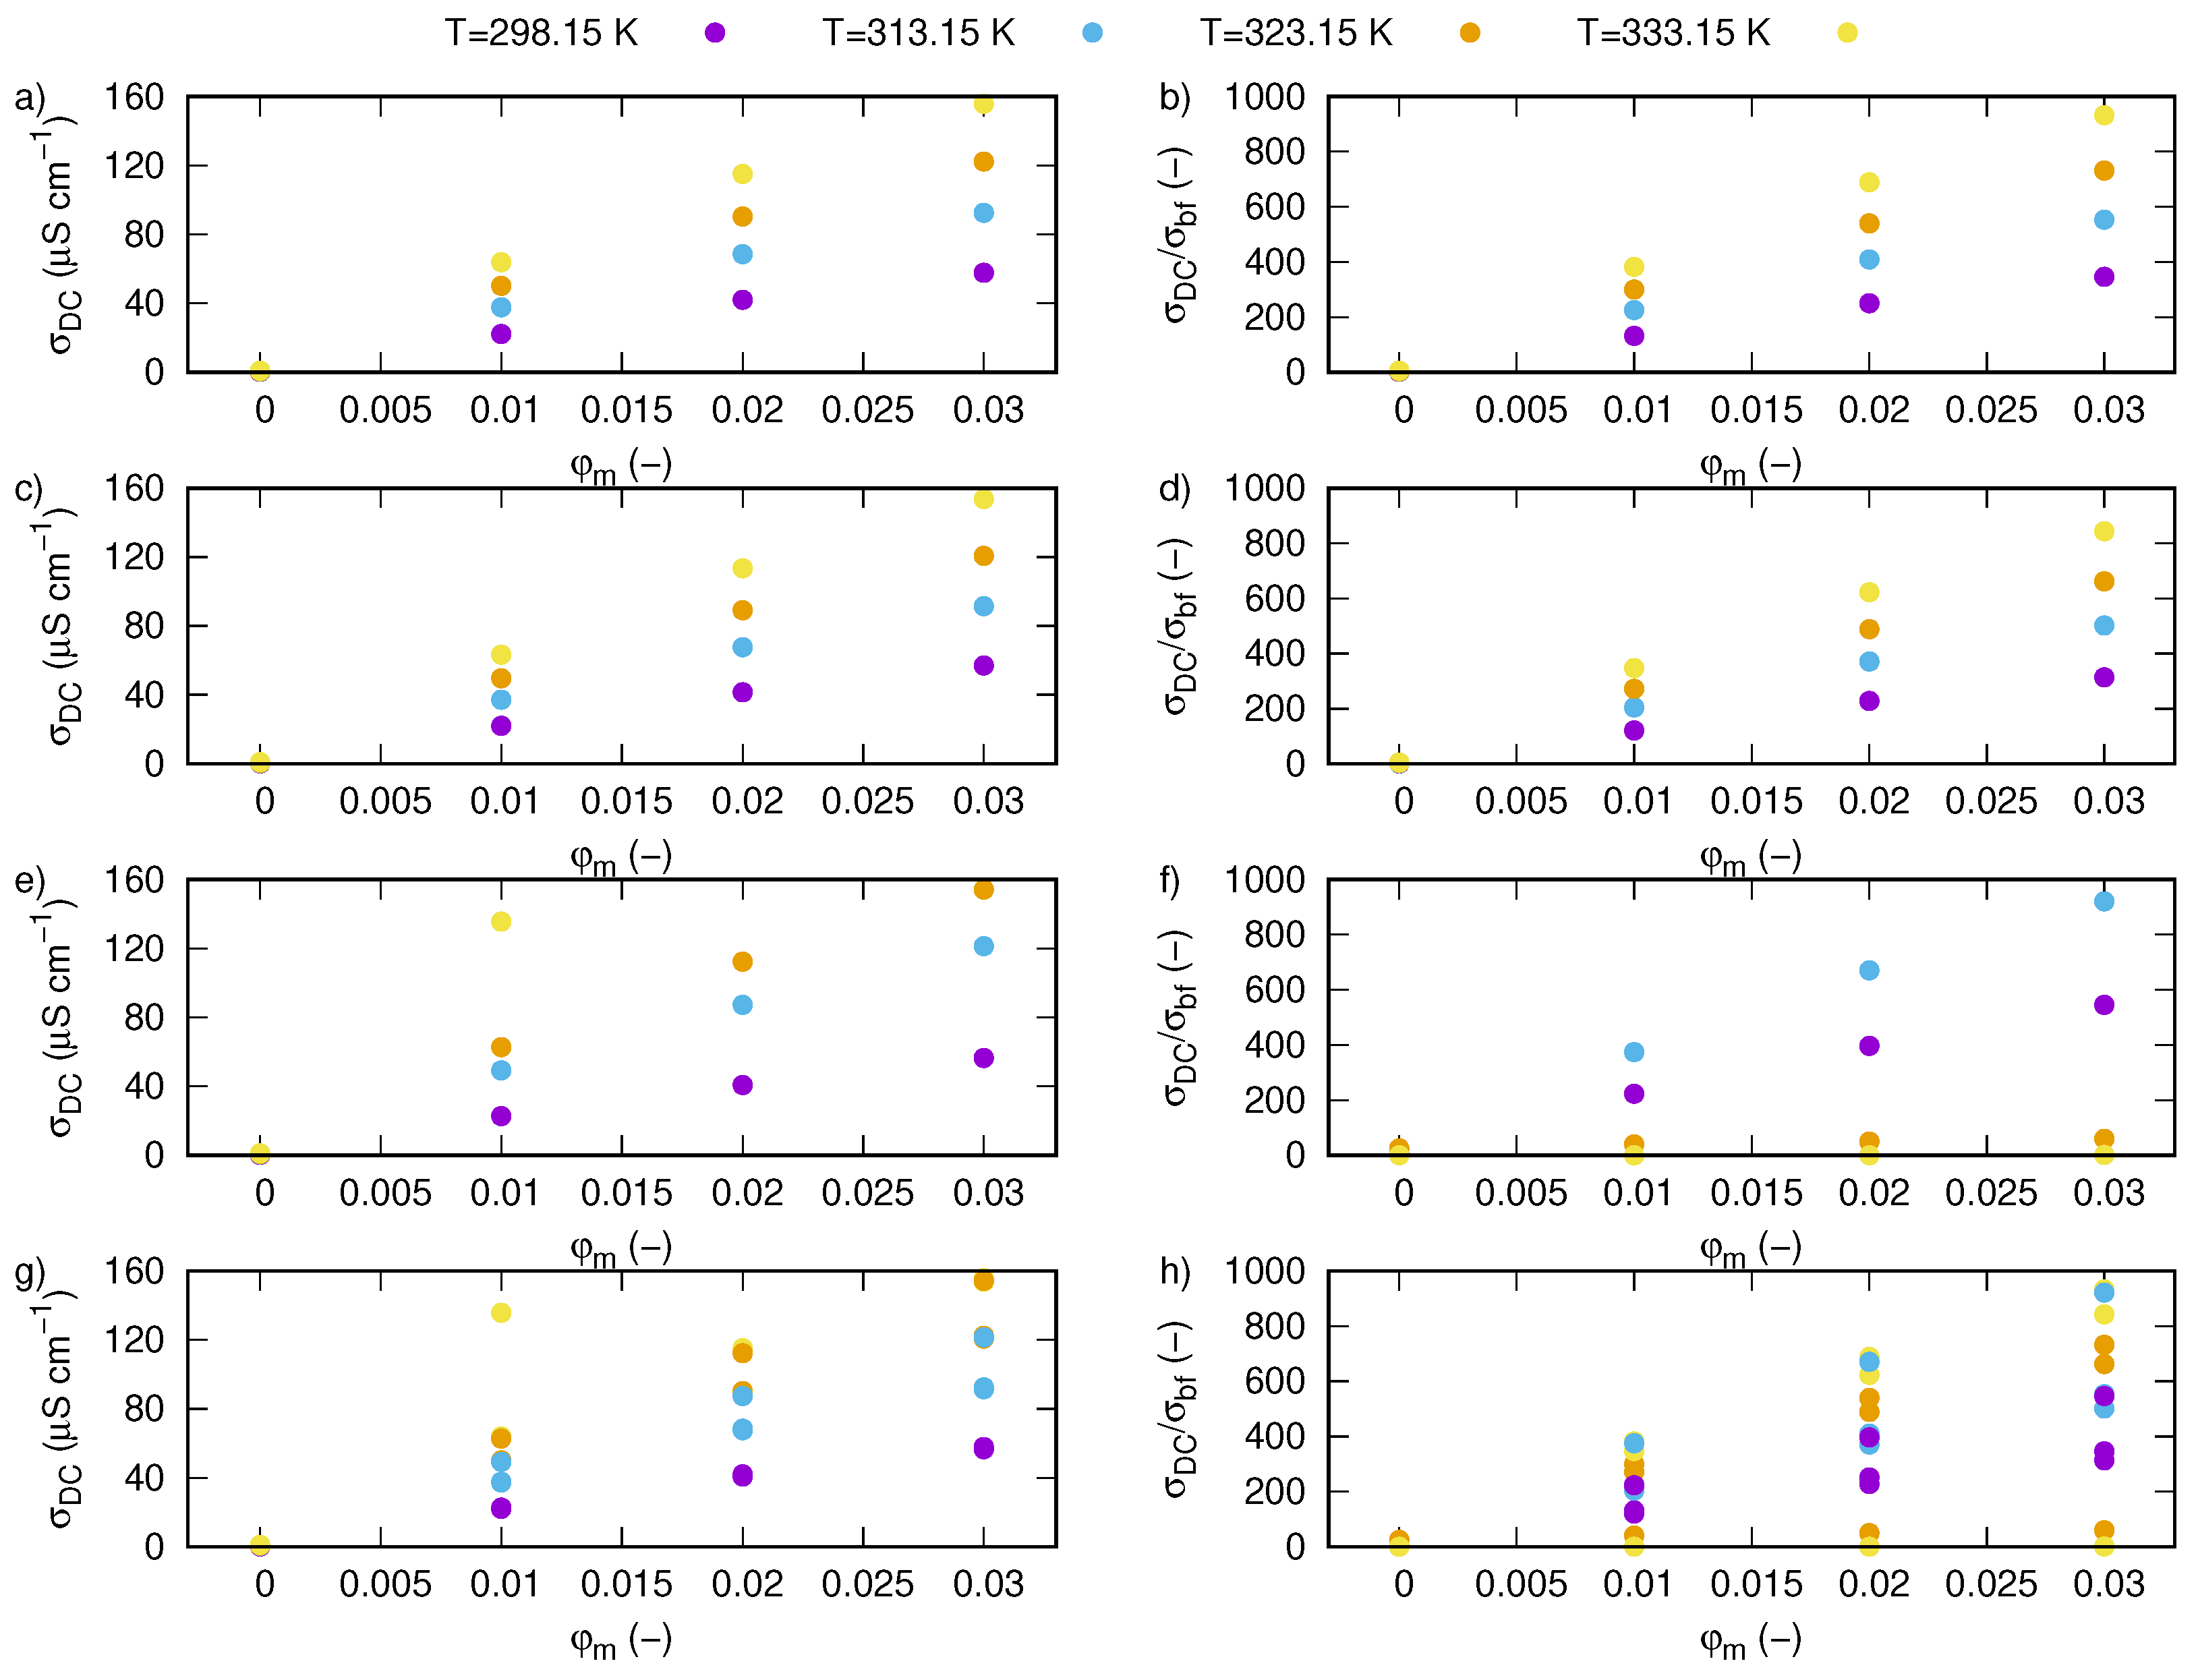
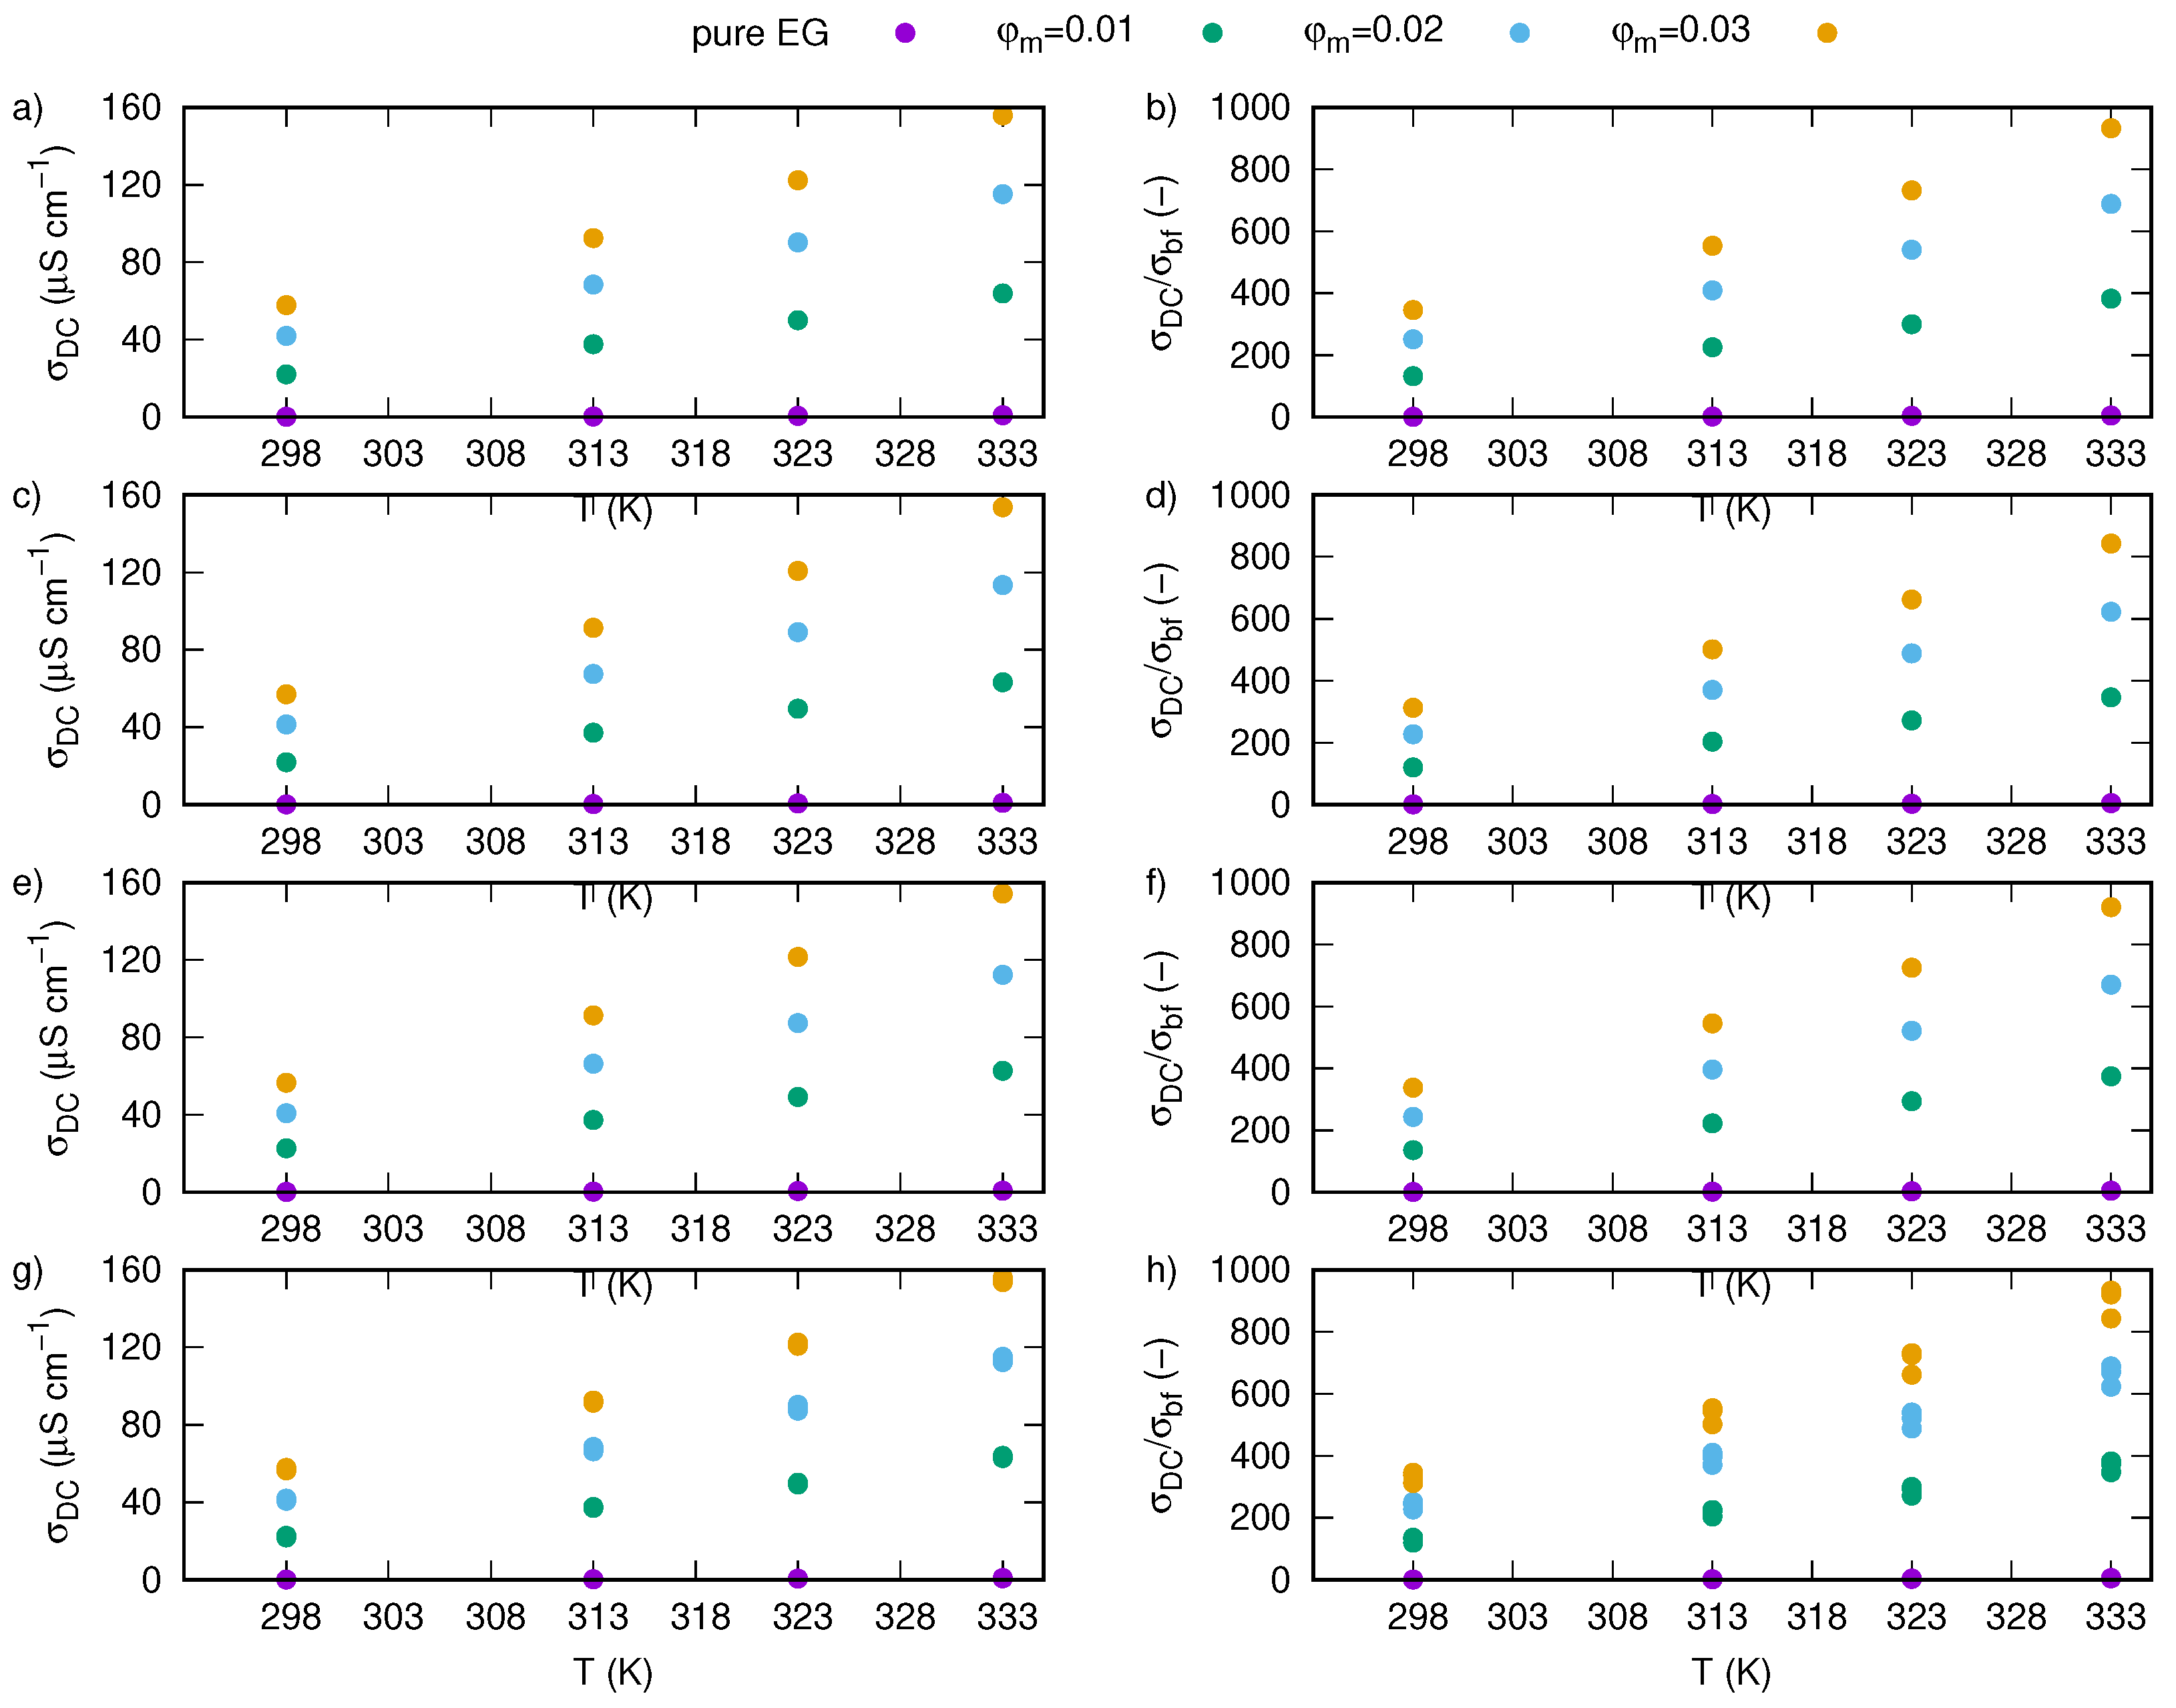
| , () | /, (–) | |||||||
|---|---|---|---|---|---|---|---|---|
| 298.15 K | 313.15 K | 323.15 K | 333.15 K | 298.15 K | 313.15 K | 323.15 K | 333.15 K | |
| 0.00 | 0.17 | 0.37 | 0.59 | 0.91 | 1.00 | 2.23 | 3.53 | 5.46 |
| 0.01 | 22.11 | 37.66 | 50.11 | 63.93 | 132.21 | 225.13 | 299.56 | 382.21 |
| 0.02 | 41.95 | 68.50 | 90.30 | 115.15 | 250.78 | 409.54 | 539.86 | 688.40 |
| 0.03 | 57.81 | 92.52 | 122.34 | 155.92 | 345.61 | 553.16 | 731.43 | 932.18 |
| , () | /, (–) | |||||||
|---|---|---|---|---|---|---|---|---|
| 298.15 K | 313.15 K | 323.15 K | 333.15 K | 298.15 K | 313.15 K | 323.15 K | 333.15 K | |
| 0.00 | 0.18 | 0.39 | 0.60 | 0.92 | 1.00 | 2.11 | 3.29 | 5.02 |
| 0.01 | 21.92 | 37.21 | 49.54 | 63.27 | 120.21 | 204.07 | 271.75 | 347.04 |
| 0.02 | 41.46 | 67.58 | 89.06 | 113.51 | 227.43 | 370.66 | 488.46 | 622.58 |
| 0.03 | 57.06 | 91.43 | 120.73 | 153.66 | 312.98 | 501.49 | 662.19 | 842.80 |
| , () | /, (–) | |||||||
|---|---|---|---|---|---|---|---|---|
| 298.15 K | 313.15 K | 323.15 K | 333.15 K | 298.15 K | 313.15 K | 323.15 K | 333.15 K | |
| 0.00 | 0.17 | 0.38 | 0.56 | 0.77 | 1.00 | 2.27 | 3.37 | 4.58 |
| 0.01 | 22.72 | 37.30 | 49.21 | 62.79 | 135.61 | 222.69 | 293.76 | 374.85 |
| 0.02 | 40.79 | 66.41 | 87.33 | 112.31 | 243.53 | 396.49 | 521.35 | 670.51 |
| 0.03 | 56.52 | 91.39 | 121.47 | 154.24 | 337.41 | 545.63 | 725.20 | 920.82 |
© 2019 by the authors. Licensee MDPI, Basel, Switzerland. This article is an open access article distributed under the terms and conditions of the Creative Commons Attribution (CC BY) license (http://creativecommons.org/licenses/by/4.0/).
Share and Cite
Fal, J.; Wanic, M.; Budzik, G.; Oleksy, M.; Żyła, G. Electrical Conductivity and Dielectric Properties of Ethylene Glycol-Based Nanofluids Containing Silicon Oxide–Lignin Hybrid Particles. Nanomaterials 2019, 9, 1008. https://doi.org/10.3390/nano9071008
Fal J, Wanic M, Budzik G, Oleksy M, Żyła G. Electrical Conductivity and Dielectric Properties of Ethylene Glycol-Based Nanofluids Containing Silicon Oxide–Lignin Hybrid Particles. Nanomaterials. 2019; 9(7):1008. https://doi.org/10.3390/nano9071008
Chicago/Turabian StyleFal, Jacek, Michał Wanic, Grzegorz Budzik, Mariusz Oleksy, and Gaweł Żyła. 2019. "Electrical Conductivity and Dielectric Properties of Ethylene Glycol-Based Nanofluids Containing Silicon Oxide–Lignin Hybrid Particles" Nanomaterials 9, no. 7: 1008. https://doi.org/10.3390/nano9071008
APA StyleFal, J., Wanic, M., Budzik, G., Oleksy, M., & Żyła, G. (2019). Electrical Conductivity and Dielectric Properties of Ethylene Glycol-Based Nanofluids Containing Silicon Oxide–Lignin Hybrid Particles. Nanomaterials, 9(7), 1008. https://doi.org/10.3390/nano9071008