Article

The Fluorescent Quenching Mechanism of N and S Co-Doped Graphene Quantum Dots with Fe3+ and Hg2+ Ions and Their Application as a Novel Fluorescent Sensor

1
Department of Physics, Yunnan University, Kunming 650091, China
2
School of Materials Science and Engineering, Yunnan University, Kunming 650091, China
3
Key Lab of Quantum Information of Yunnan Province, Yunnan University, Kunming 650091, China
*
Author to whom correspondence should be addressed.
Nanomaterials 2019, 9(5), 738; https://doi.org/10.3390/nano9050738
Submission received: 22 April 2019 / Revised: 8 May 2019 / Accepted: 9 May 2019 / Published: 13 May 2019

Abstract

:
The fluorescence intensity of N, S co-doped graphene quantum dots (N, S-GQDs) can be quenched by Fe3+ and Hg2+. Density functional theory (DFT) simulation and experimental studies indicate that the fluorescence quenching mechanisms for Fe3+ and Hg2+ detection are mainly attributed to the inner filter effect (IFE) and dynamic quenching process, respectively. The electronegativity difference between C and doped atoms (N, S) in favor to introduce negative charge sites on the surface of N, S-GQDs leads to charge redistribution. Those negative charge sites facilitate the adsorption of cations on the N, S-GQDs’ surface. Atomic population analysis results show that some charge transfer from Fe3+ and Hg2+ to N, S-GQDs, which relate to the fluorescent quenching of N, S-GQDs. In addition, negative adsorption energy indicates the adsorption of Hg2+ and Fe2+ is energetically favorable, which also contributes to the adsorption of quencher ions. Blue fluorescent N, S-GQDs were synthesized by a facile one-pot hydrothermal treatment. Fluorescent lifetime and UV-vis measurements further validate the fluorescent quenching mechanism is related to the electron transfer dynamic quenching and IFE quenching. The as-synthesized N, S-GQDs were applied as a fluorescent probe for Fe3+ and Hg2+ detection. Results indicate that N, S-GQDs have good sensitivity and selectivity on Fe3+ and Hg2+ with a detection limit as low as 2.88 and 0.27 nM, respectively.

Graphical Abstract

1. Introduction

Graphene quantum dots (GQDs) have drawn research interest by reasons of their excellent photoluminescence, low toxicity, and good biocompatibility [1]. They have been applied in various fields, such as solar cells, light-emitting diodes, bioimaging, and fluorescent sensors [2]. Some reports have shown that the fluorescence intensity of GQDs can be quenched by Ag+ and Hg2+ ions [3,4,5]. According to the interaction between quantum dots and a quencher, the main quenching mechanism can be divided into Förster resonance energy transfer (FRET), the inner filter effect (IFE), and the dynamic and static quenching process [6,7]. The quenching process requires sufficient contact between quantum dots and a quencher. Diffusive encounters collision contact can be attributed to the dynamic quenching process, while new complex forms can be assigned to the static quenching process [8]. In a typical static quenching process, the interaction between a quencher and quantum dots can form a non-fluorescent complex. While in the dynamic quenching process, energy or charge transfer between a quencher and the excited states of quantum dots can lead to fluorescence quenching. For IFE quenching, the fluorescence quenching requires the absorption spectra of quantum dots overlapping with the excitation or emission spectra of quantum dots in the presence of a quencher. However, for FRET quenching, it requires the emission spectra of fluorescent quantum dots overlapping with the absorption spectrum of a quencher [7]. Some reports have indicated that the good affinity between metal ions and heteroatom doped GQDs is conductive to the electron transfer between quantum dots and a quencher. However, the contribution of doped atoms for fluorescence quenching is less detailed [9,10]. On the other hand, it is difficult for experimental research to give the atomic interaction details between a quencher and GQDs. Density functional theory (DFT) simulation has been applied to study the atomic and electronic properties of materials [11,12]. It can give more detail about the atomic information of materials. Hence, to understand the contribution of doped atoms for fluorescent quenching, the DFT simulations can be applied to investigate the relationship between a quencher and N, S-GQDs.
Based on the fluorescent quenching properties of GQDs, it can be served as a novel fluorescence probe for metal ion detection [5]. Iron is one of the essential metal elements for many physiological and pathological processes, including oxygen transport, enzyme catalysis, and hemopoiesis [1,13]. Although the Fe3+ ion plays an important role in the human body, overload and deficiency of ferric ions in the body can cause health problems like cancer, Parkinson’s disease, and dysfunction of organs [13,14,15]. After years of investigation of the relationship between Fe3+ and certain diseases, people have understood the essential role of iron in the human body [16,17,18]. Thus, it is critical to detect traces of Fe3+. Unlike ferric ions, mercury ions are well-known as one of the extremely toxic substances. Mercury ions can bioaccumulate in the human body from the environment through the food chain causing serious health problems, such as renal failure and nervous system damage [19,20]. The emissions of mercury are mainly due to the heavy use of fossil fuels [21,22]. Some studies have shown that even 5 ppb of mercury ions can lead to serious damage of organs [20,21]. Given this fact, it is significant to track the amount of ferric and mercuric ions. Fluorescent sensor have been applied to detect heavy metal ions and it is characterized by simple preparation, rapid response, and high sensitivity [9,23].
Therefore, in this study, DFT simulations were used to investigate the interaction between a quencher (Fe3+ and Hg2+) and N, S-GQDs. The relationship between the fluorescent quenching mechanism and doped heteroatoms were carried out by DFT simulations and experimental studies. According to our DFT and experimental studies, the quenching mechanism can be assigned to the dynamic quenching by Hg2+ and the IFE quenching by Fe3+. Due to the electronegativity difference of doped N and S atoms, the charge distribution of surrounding C atoms can be changed. The charge redistribution of N, S-GQDs is conducive to the adsorption of cation, resulting in the effective electron transfer between N, S-GQDs and Fe3+ or Hg2+. The adsorption of Fe3+ or Hg2+ on the surface of N, S-GQDs can lower the system total energy, which also can facilitate the adsorption of cation. N, S-GQDs were synthesized by the one-pot hydrothermal method to further validate the fluorescent quenching mechanism. The results show that N, S-GQDs have excellent sensitivity and selectivity to Fe3+ and Hg2+ ions. The good affinity between the quencher (Fe3+ and Hg2+) and the surface functional groups of N, S-GQDs has a contribution to the special recognition toward Fe3+ and Hg2+, respectively. Significantly, the as-synthesized N, S-GQDs fluorescence sensor presented a good detection limit as low as 2.88 and 0.27 nM for Fe3+ and Hg2+ detection, respectively.

2. Materials and Methods

2.1. Computational Details

Density functional theory was applied to investigate the interaction of Fe3+ or Hg2+ with N, S-GQDs, respectively. The theoretical simulations were based on CASTEP code with generalized gradient approximation (GGA) and Perdew–Burke–Enzerh (PBE) of exchange-correlation functional [23,24,25,26,27]. Core electrons were modeled with the fully-relativistic ultra-soft pseudo-potentials [28]. The energy cut-off of the graphene lattice was set to 400 eV. The number of k points for the Brillouin zone integration was chosen according to a Monkhorst–Pack grid of 0.03 Å−1 with a convergence criterion of 1 × 10⁻⁶ eV [29]. The structures were geometrically optimized using the Broyden–Fletcher–Goldfarb­–Shanno (BFGS) method before lattice dynamical property calculation [30]. Their constituent atoms were allowed to relax until the interatomic forces became below the value of 0.03 eVÅ−1. The total energy convergence criterion was set to be 10−5 eV.

2.2. Materials

The chemical reagents citric acid, thioacetamide, sodium hydroxide, and phosphoric acid were provided by Aladdin Chemistry Co. Ltd. (Shanghai, China). The disodium hydrogen phosphate, sodium dihydrogen phosphate, and metal salts were purchased from Tianjin Zhiyuan Chemical Reagent Co. Ltd. (Tianjin, China). All the reagents are analytical grade and used as received.

2.3. Synthesis of N-GQDs

The synthesis of N, S-GQDs was through a hydrothermal process using critic acid and thioacetamide as the initial carbon, nitrogen, and sulfur source, respectively. Briefly, 0.5 g critic acid and 0.0267 g thioacetamide were dissolved into 60 mL purified water by ultrasonic treatment for 5 min. Then the mixture was transferred into 100 mL Teflon-lined autoclave and heated at 180 °C for 10 h. After being cooled down to room temperature, the suspension was centrifuged at 10,000 rpms for 15 min. The obtained N, S-GQDs solution was collected after being further purified through dialysis (cutoff molecular weight: 300 Da) for 10 h.

2.4. Characterization

The morphology of as-synthesized N, S-GQDs was recorded on a JEOL-JEM 2100 transmission electron microscope (TEM) and Seiko SPA-400 SPM atomic force microscope (AFM). The optical properties of N, S-GQDs were carried out by UV-vis-1800 spectrophotometer (Jinghua Instrument, Shanghai, China). The Fourier transformed infrared spectra (FTIR) were recorded by an Avatar-360 spectrometer. K-Alpha + X-ray electron spectrometer was used to record the X-ray photoelectron spectroscopy (XPS) of N, S-GQDs. The photoluminescence spectra were conducted on a Horiba Fluorolog-3 fluorescence spectrophotometer. Fluorescence lifetime decays were acquired on a Quantaurus-Tau fluorescence lifetime spectrometer (Hamamatsu, Japan).

2.5. Detection of Metal Ions

The detection of Fe3+ or Hg2+ was performed by measuring the fluorescence spectra in the presence and absence of metal ions. In a typical analysis process, 200 µL N, S-GQDs (0.08 mg/mL) were dispersed into 1 mL PBS (phosphate buffered saline) buffer (0.1 M, pH 7), followed by the addition of a certain amount of Fe3+ or Hg2+, respectively. The schematic diagram of detection process and device are shown in Figure S1 in Supplementary Materials. Then the solution was diluted to 5 mL with PBS buffer and incubated for 10 min at room temperature. The detection of Fe3+ or Hg2+ was assessed by the fluorescence quenching ratio (I/I0) with various metal ion concentrations, where I and I0 were corresponding to the fluorescence intensity in the presence and absence of metal ions, respectively. The selectivity of N, S-GQDs was investigated by adding various certain concentrations of interfering ions (50 µM).

2.6. Detection of Fe3+ and Hg2+ in Real Samples

To evaluate the potential application of N, S-GQDs in real water samples detection, bottled drinking water (Nongfu Spring Co. Ltd., Hangzhou, China) were chosen as real samples. The Hg2+ ions were diluted to 50, 100, and 300 nM by drinking water, while the Fe3+ ions were diluted to 700 nM, 1 μM, and 3 μM, respectively. Then, the appropriate volume of cation solutions were skipped into the fluorescence solution, and diluted to 5 mL with PBS buffer.

3. Results and Discussion

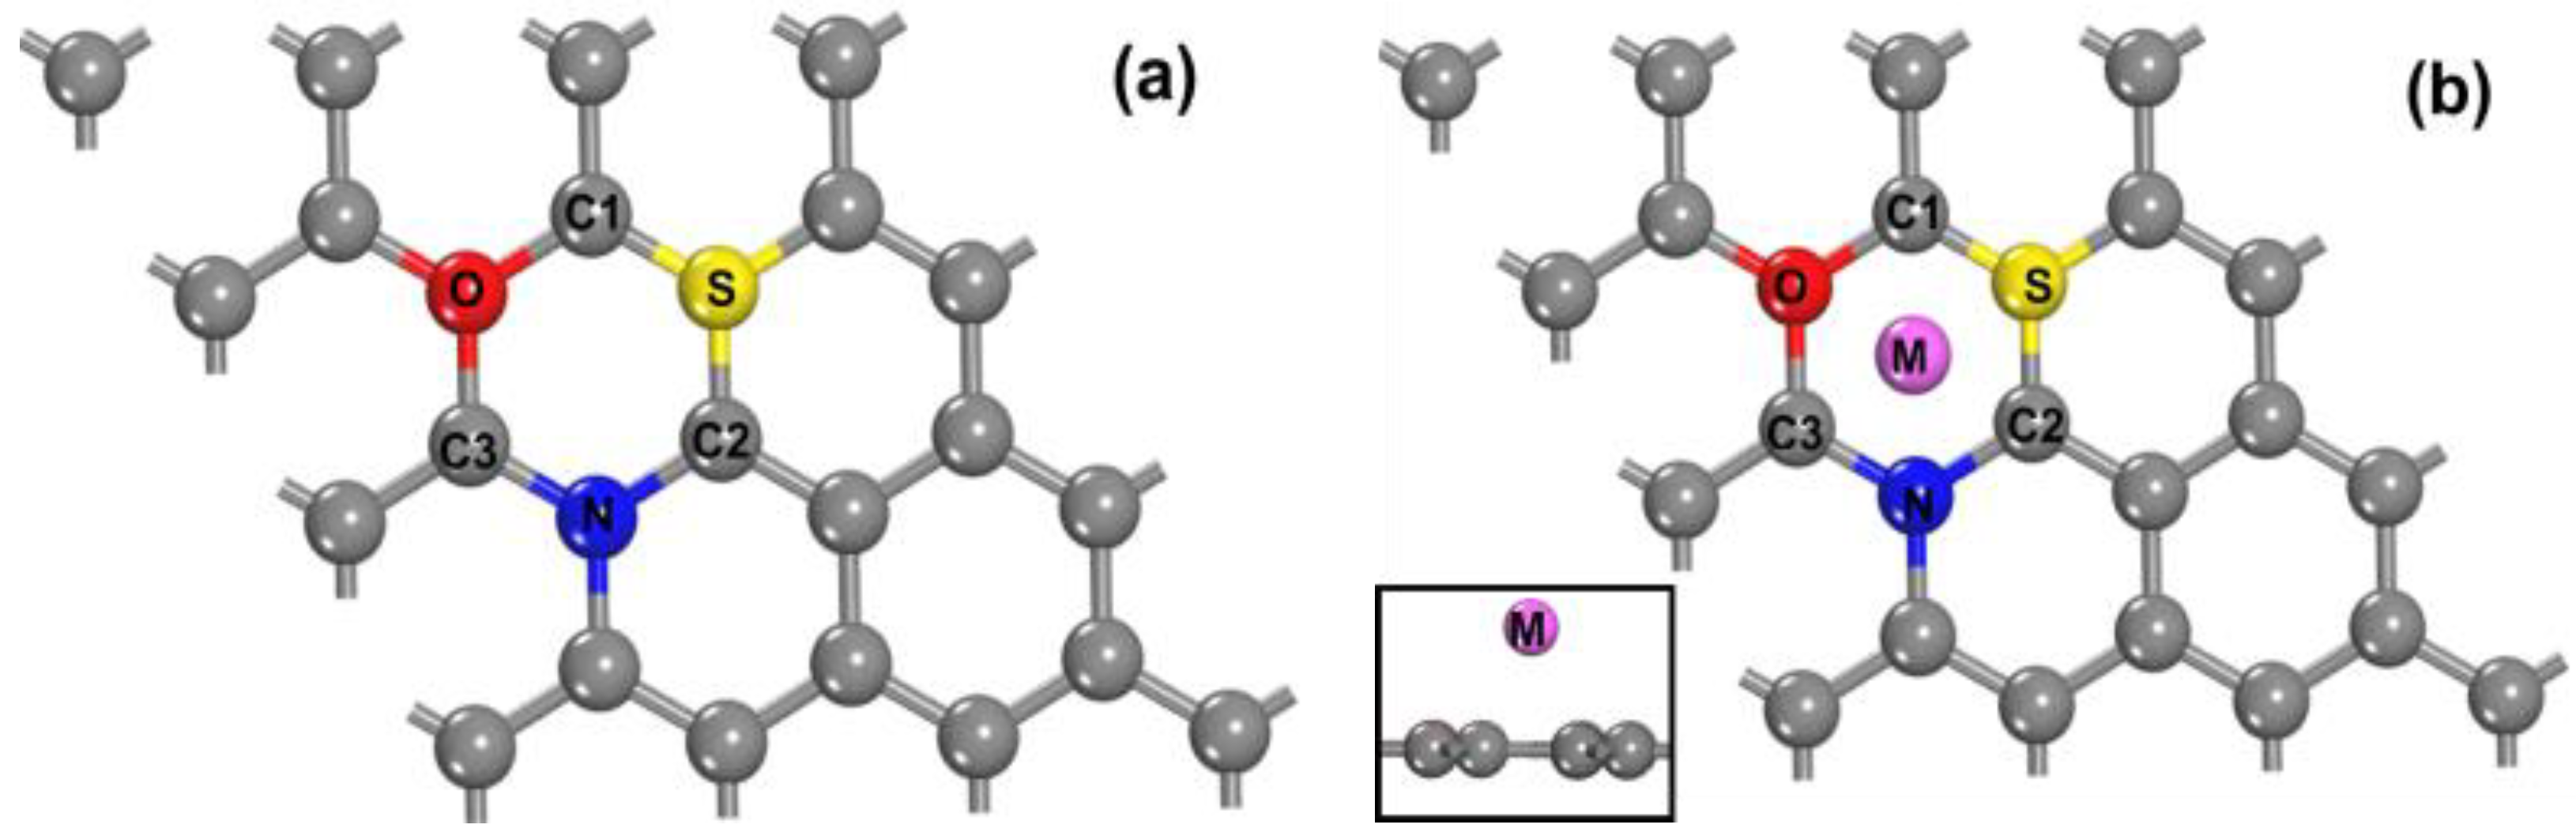
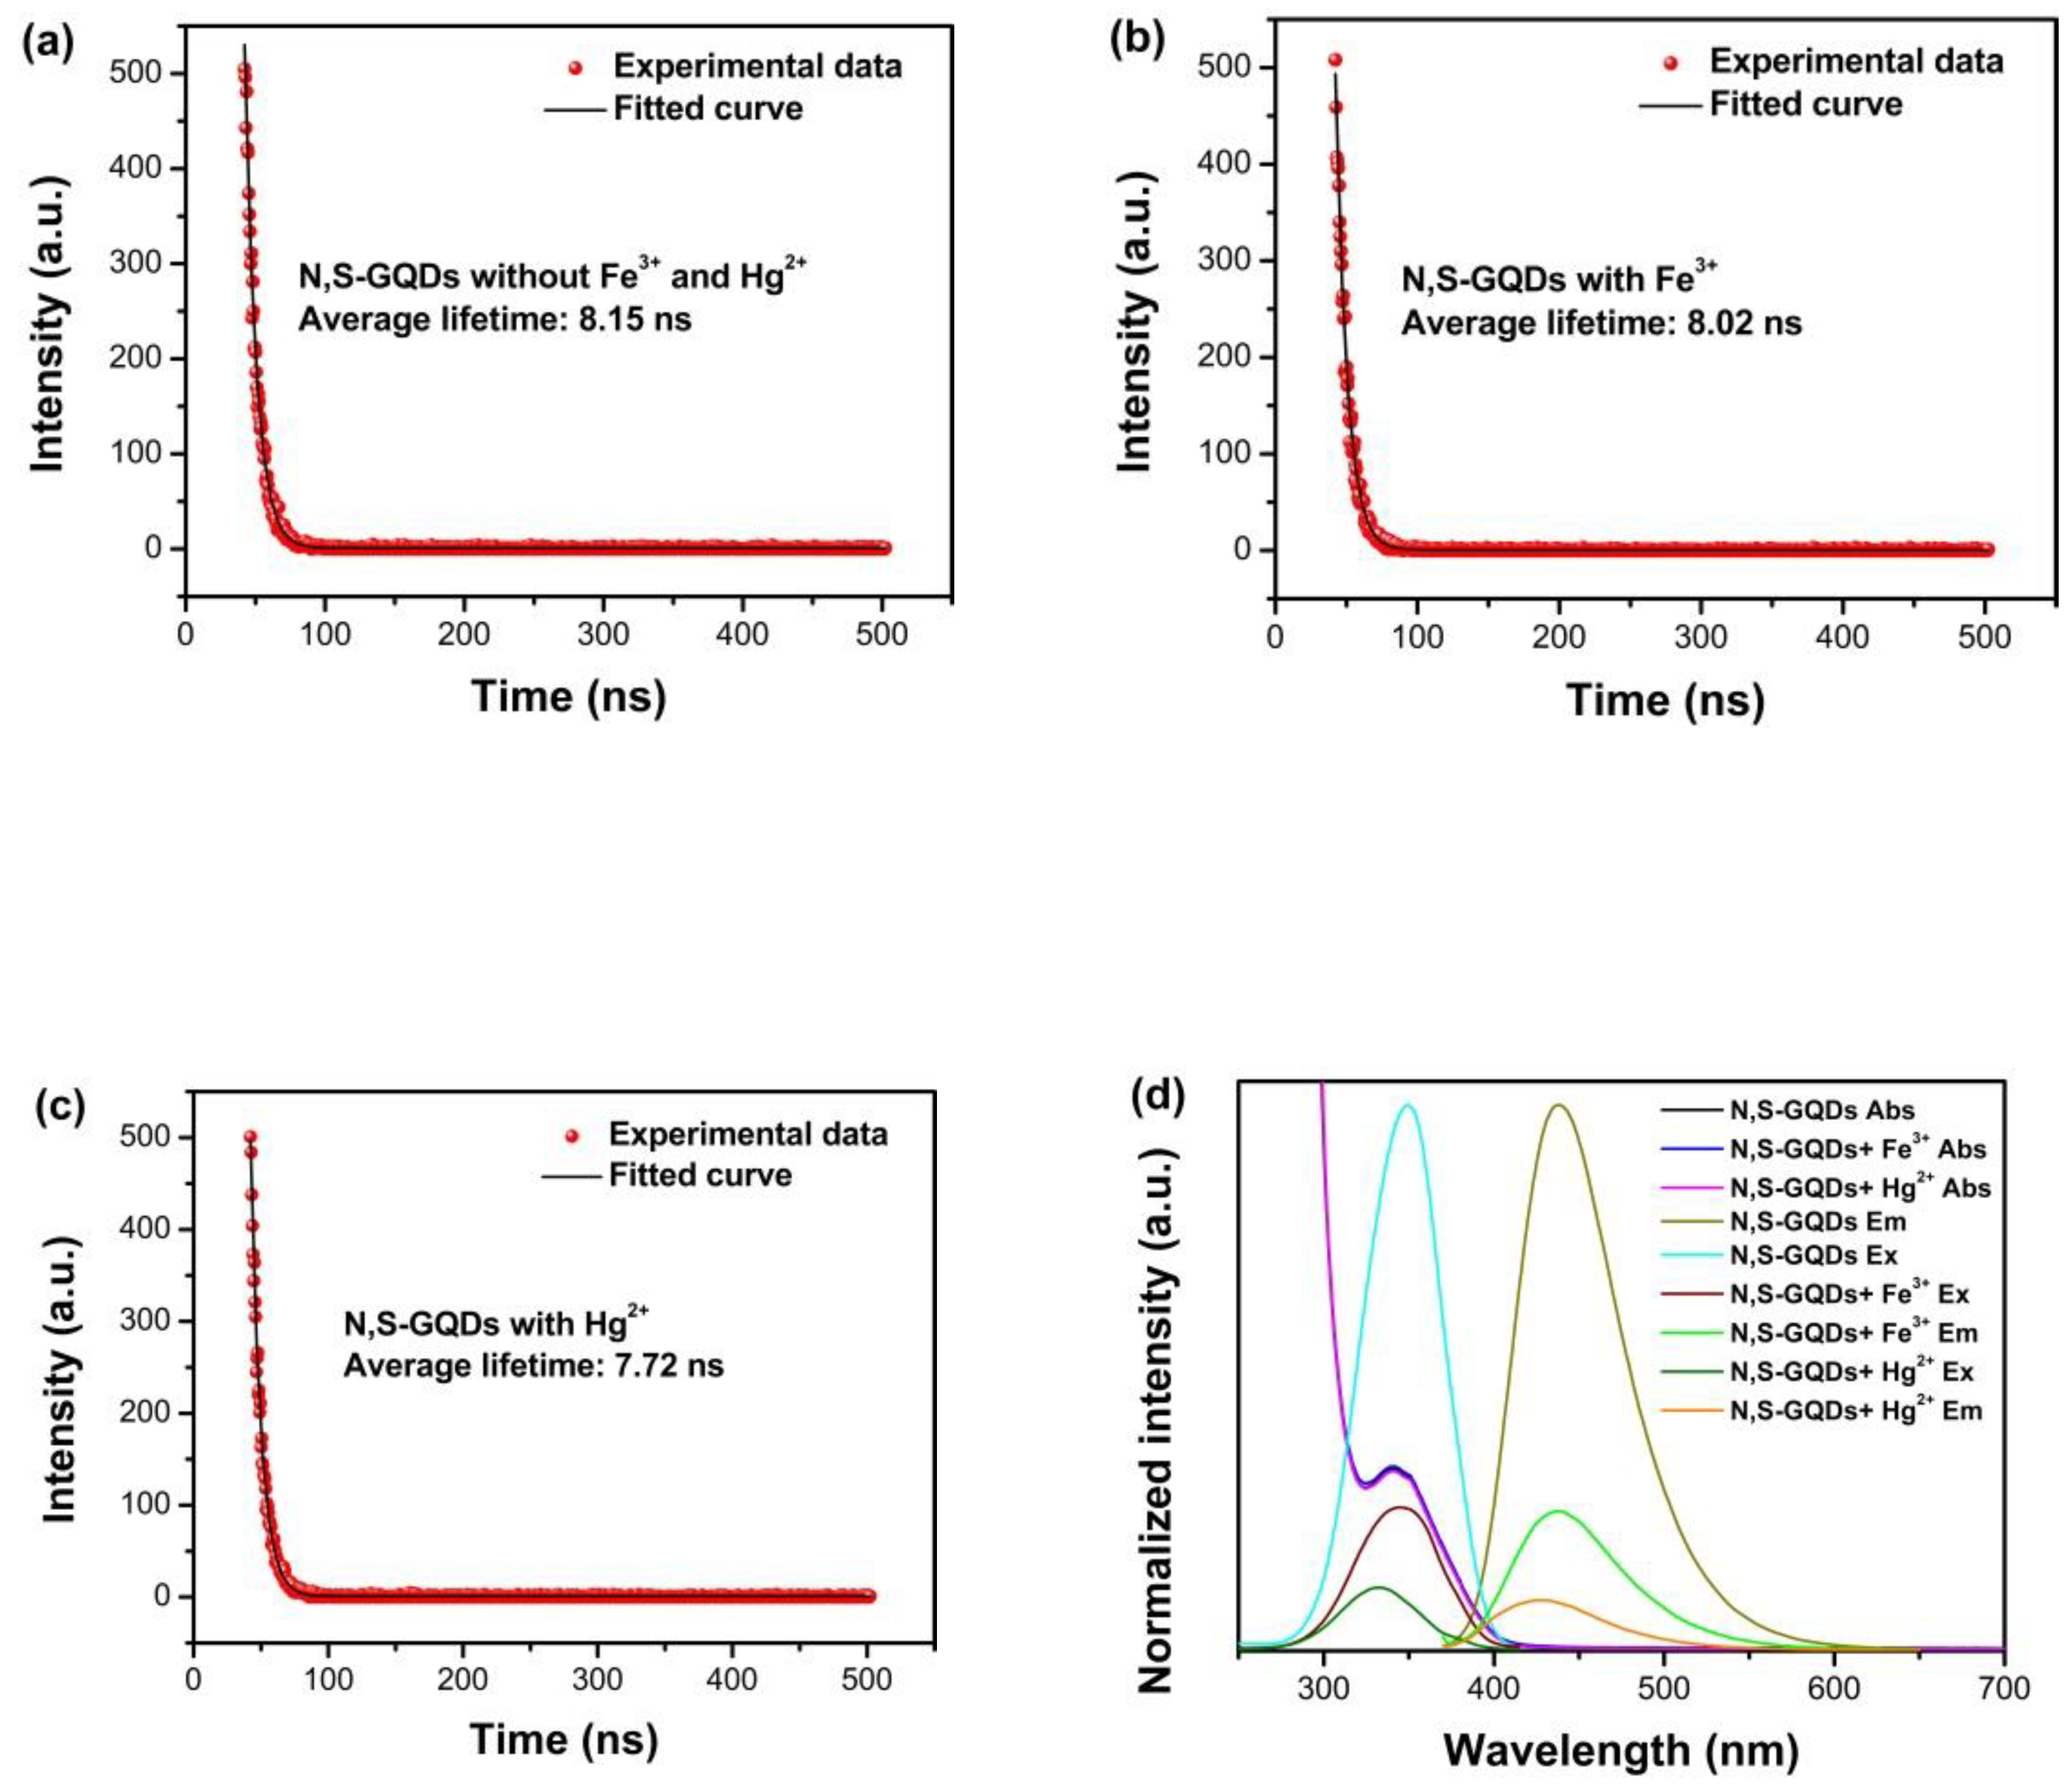
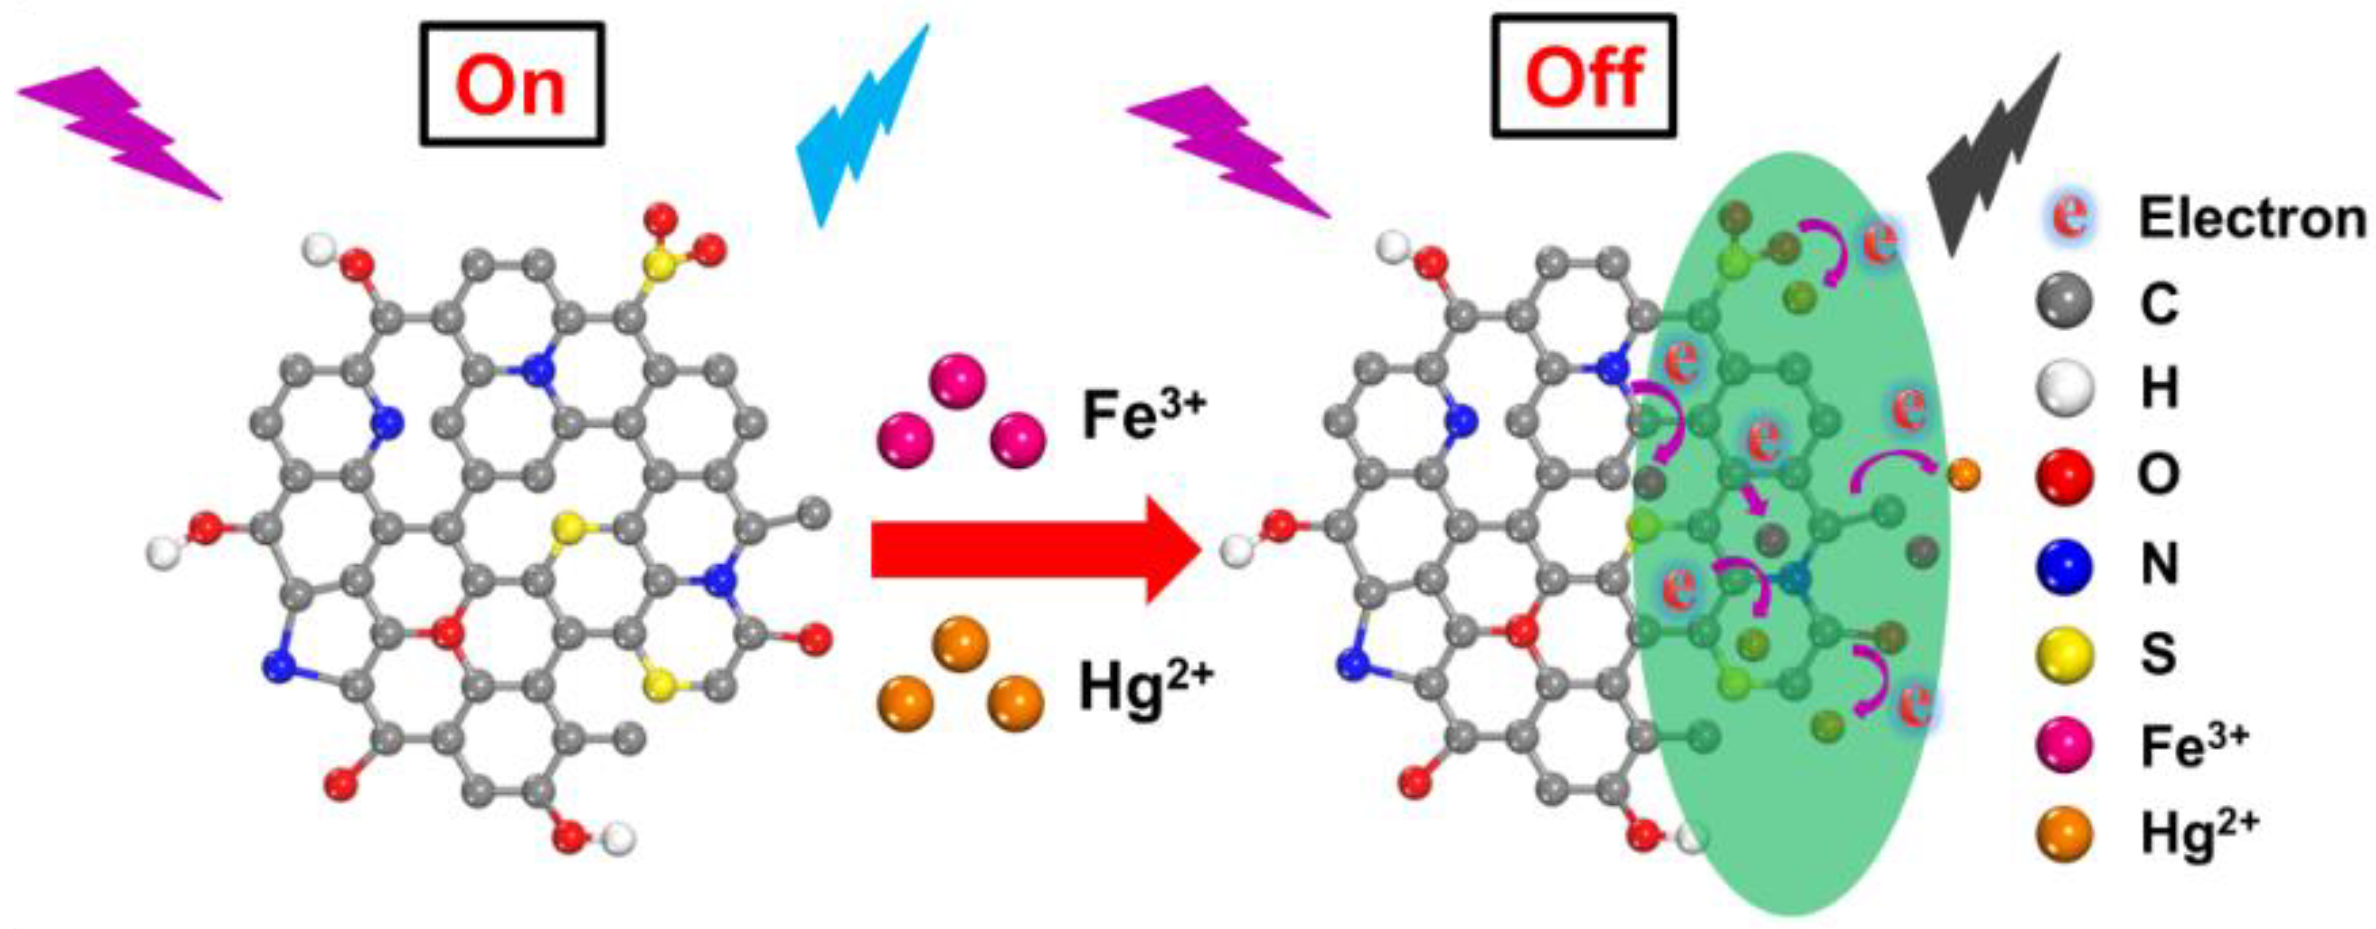
3.1. Fluorescent Quenching Mechanisms of N, S-GQDs with Fe3+ or Hg2+

DFT simulations were carried out to investigate the quenching mechanism of N, S-GQDs on Fe3+ or Hg2+. The adsorption energy (Ead) and Mulliken populations were calculated to investigate the interaction between N, S-GQDs and a quencher. For the simulations, 18 atoms’ hexagonal configurations were applied, as shown in Figure 1. Atomic population (Mulliken) analysis indicates that carbon atoms in pure graphene are neutral, as shown in Table 1. As set out in Table 1, the S atoms have a positive charge, while the negative charges are located on N and O atoms. This can be ascribed to the electronegativity difference of N, S, and O atoms. N and O atoms have larger electronegativity and stronger charge-accepting ability than S. The positively charged S atom breaks the electro-neutral situation of surrounding C atoms, and that is conductive to the generation of charge favorable sites for the interaction of cations and N, S-GQDs [31]. The atomic populations of Fe3+ @N, S-GQDs and Hg2+ @N, S-GQDs are listed in Supplementary Materials, Table S1. The adsorption energy can be defined as the energy difference between N, S-GQDs and the adsorption system. The Ead of Fe3+ and Hg2+ were calculated as −2.43 and −3.27 eV, respectively, which indicate the adsorption of Hg2+ and Fe2+ are energetically favorable. According to the DFT calculations, the adsorption of Fe3+ or Hg2+ change the charge distribution on N, S-GQDs as shown in Table S1. Atomic population calculations reveal that the amount of charge transfer between N, S-GQDs and adsorbed Fe3+ is 0.66 e and the charge transfer for Hg2+ is 0.13 e, respectively, implying the interaction existence between N, S-GQDs and a quencher (Fe3+ or Hg2+). Based on the DFT simulations, the quenching mechanism of N, S-GQDs by Fe3+ and Hg2+ might be attributed to the dynamic quenching.
In order to further investigate the fluorescent quenching mechanism of N, S-GQDs by Fe3+ or Hg2+, N, S-GQDs were synthesized by a hydrothermal method. In the following, the fluorescence lifetime and UV-vis spectra were measured to determine the fluorescence quenching mechanism of N, S-GQDs, as shown in Figure 2. As shown in Figure 2, the average fluorescence lifetime of N, S-GQDs without metal ions (Fe3+ or Hg2+) is 8.15 ns. While the average fluorescence lifetime of N, S-GQDs in the presence of Fe3+ and Hg2+ can be determined as 8.02 and 7.72 ns, respectively. The average fluorescence lifetime of N, S-GQDs decay after the addition of Hg2+, indicating the fluorescence quenching is probably attributed to the non-radiative electron transfer between N, S-GQDs and a quencher [6,32]. However, the average fluorescence lifetime in the presence of Fe3+ only changes slightly, which indicates the quenching process is probably related to other quenching mechanisms [33,34,35]. Figure 2d depicts the UV-vis spectra and fluorescence spectra of N, S-GQDs in the absence and presence of Fe3+ or Hg2+, respectively. The absorption threshold and peak position change cannot be observed, which indicates that no stable metal complexes form [36]. It is noticeable that the absorption spectra of N, S-GQDs with Fe3+ have overlaps with the emission and excitation spectra of N, S-GQDs, which is related to the characteristic of IFE quenching [7,33]. The fluorescence lifetime of N, S-GQDs changed in the presence of Hg2+ but no changes in the absorption spectra of N, S-GQDs can be observed. Therefore, based on the DFT and experimental analyses, the fluorescence quenching mechanism of N, S-GQDs by Fe3+ is mainly attributed to the IFE, while the fluorescence quenching by Hg2+ is related to the dynamic quenching process, as shown in Figure 3.

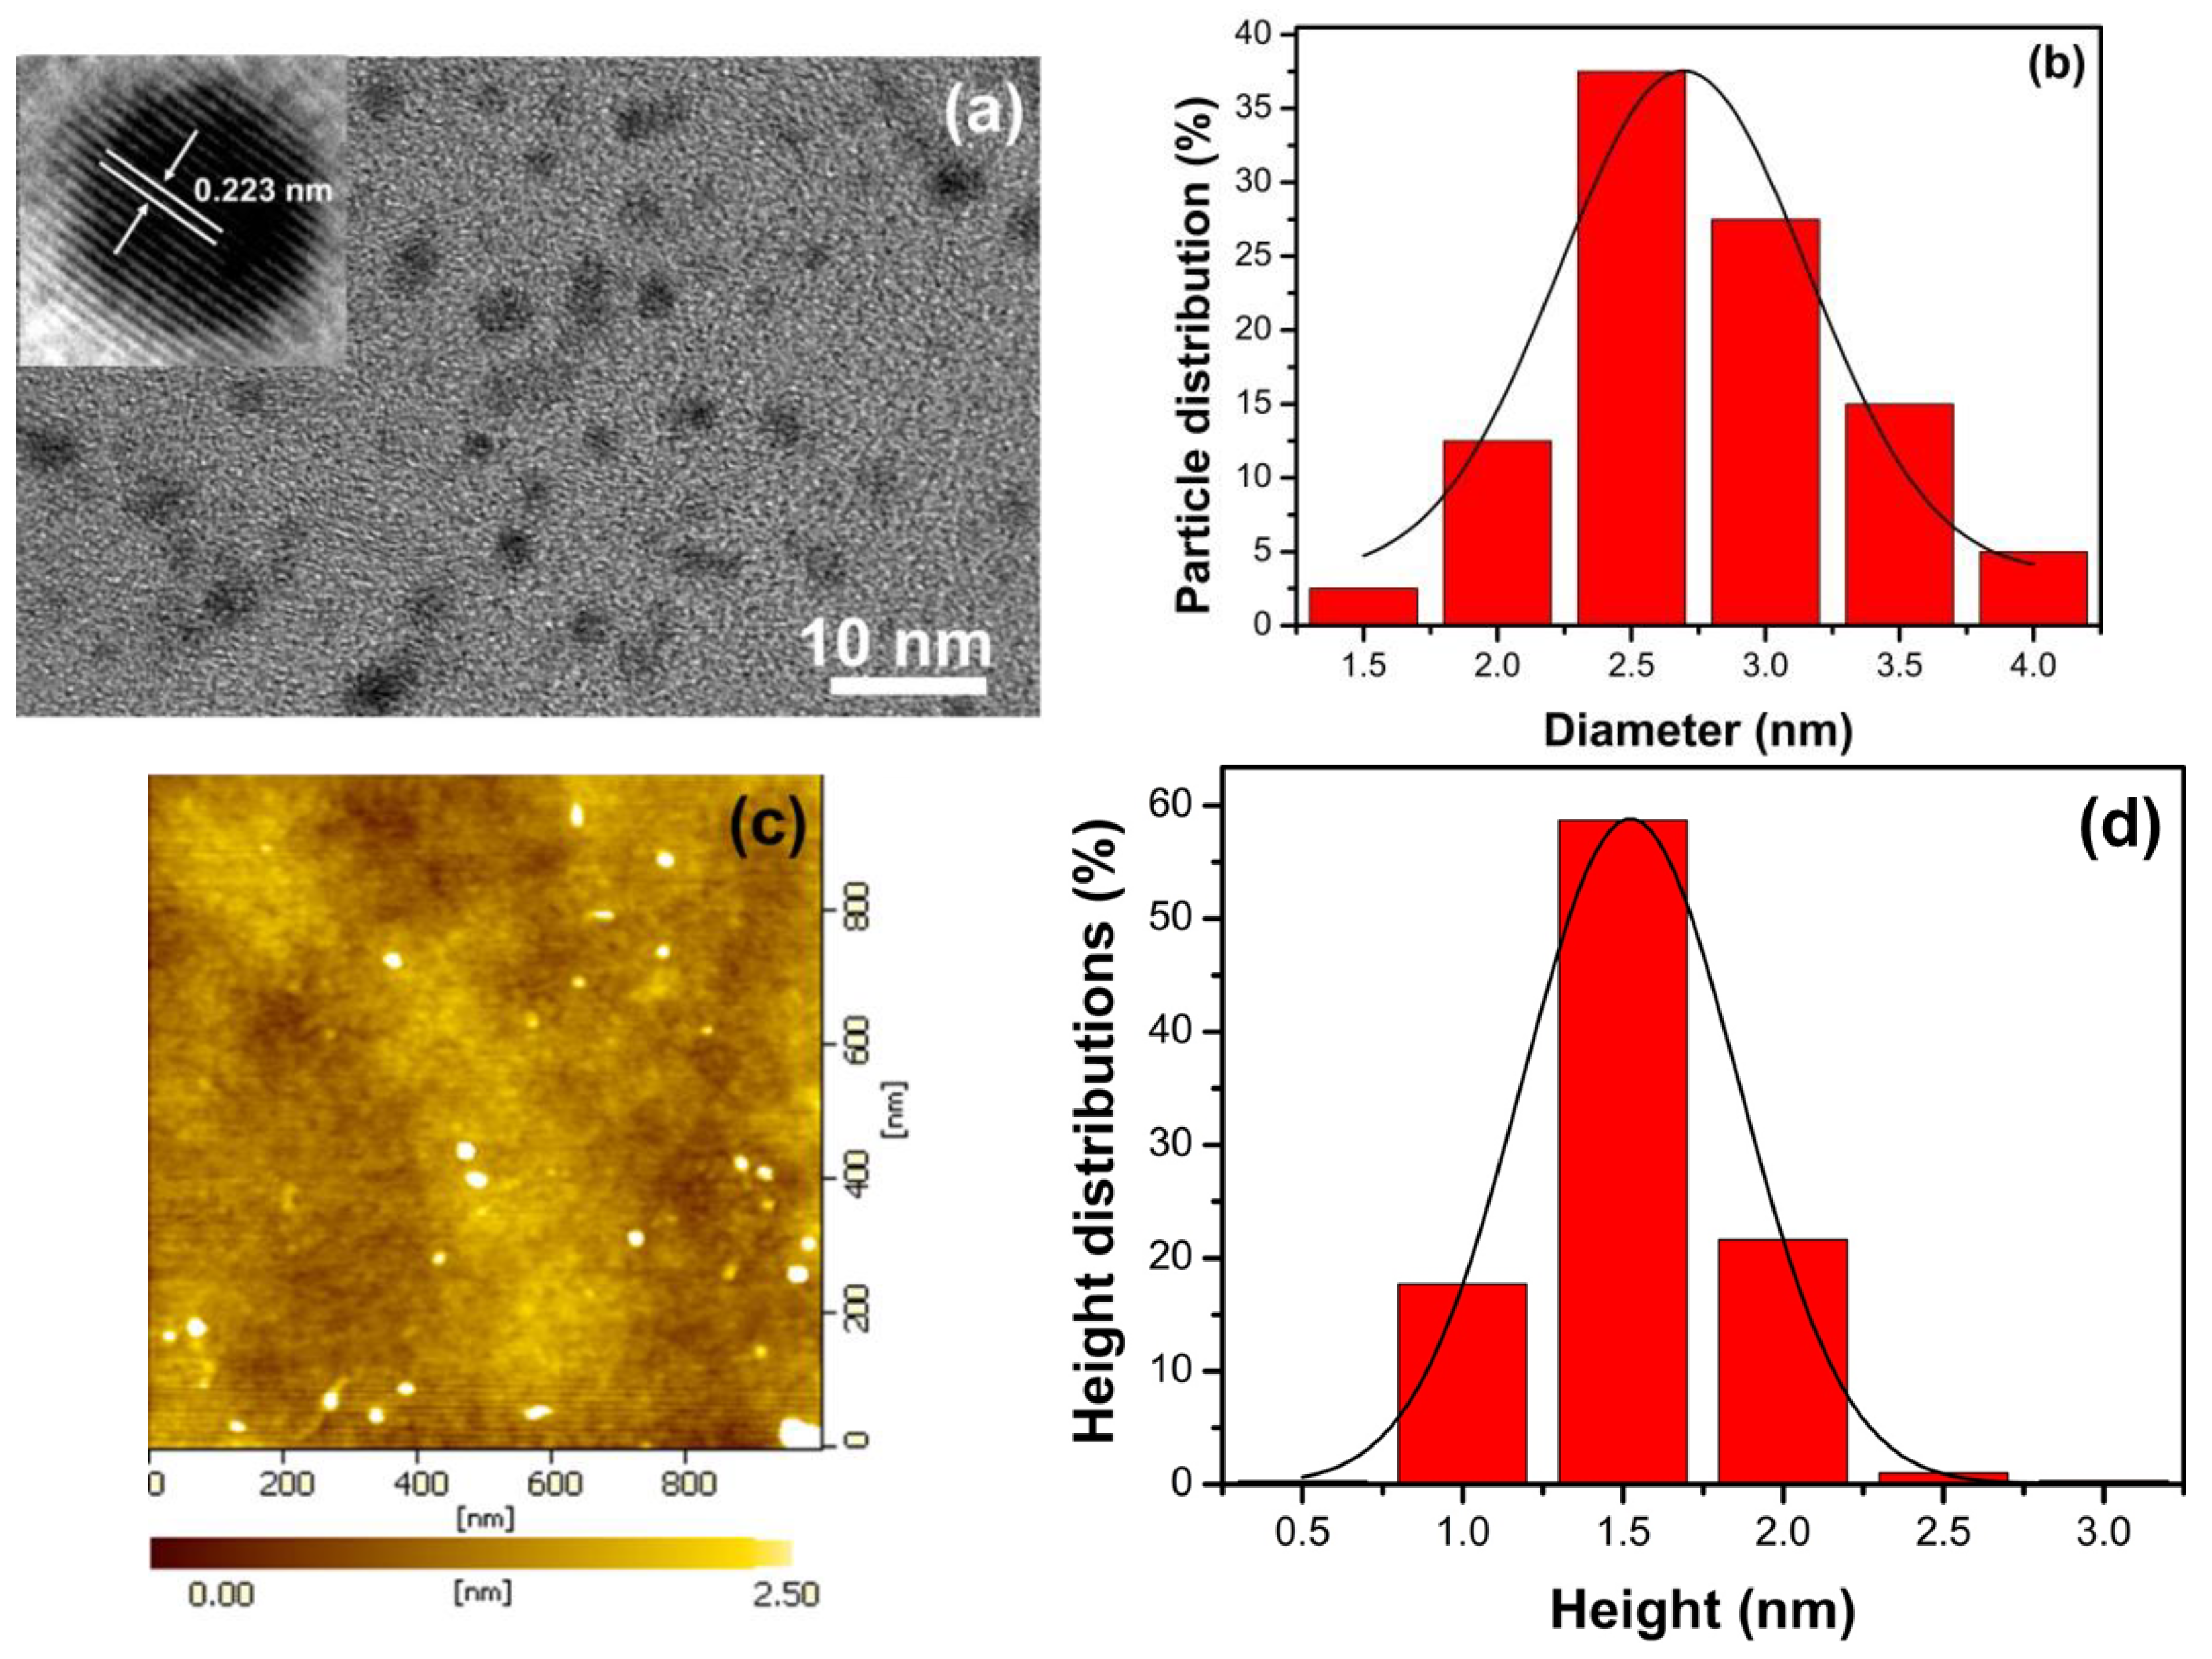
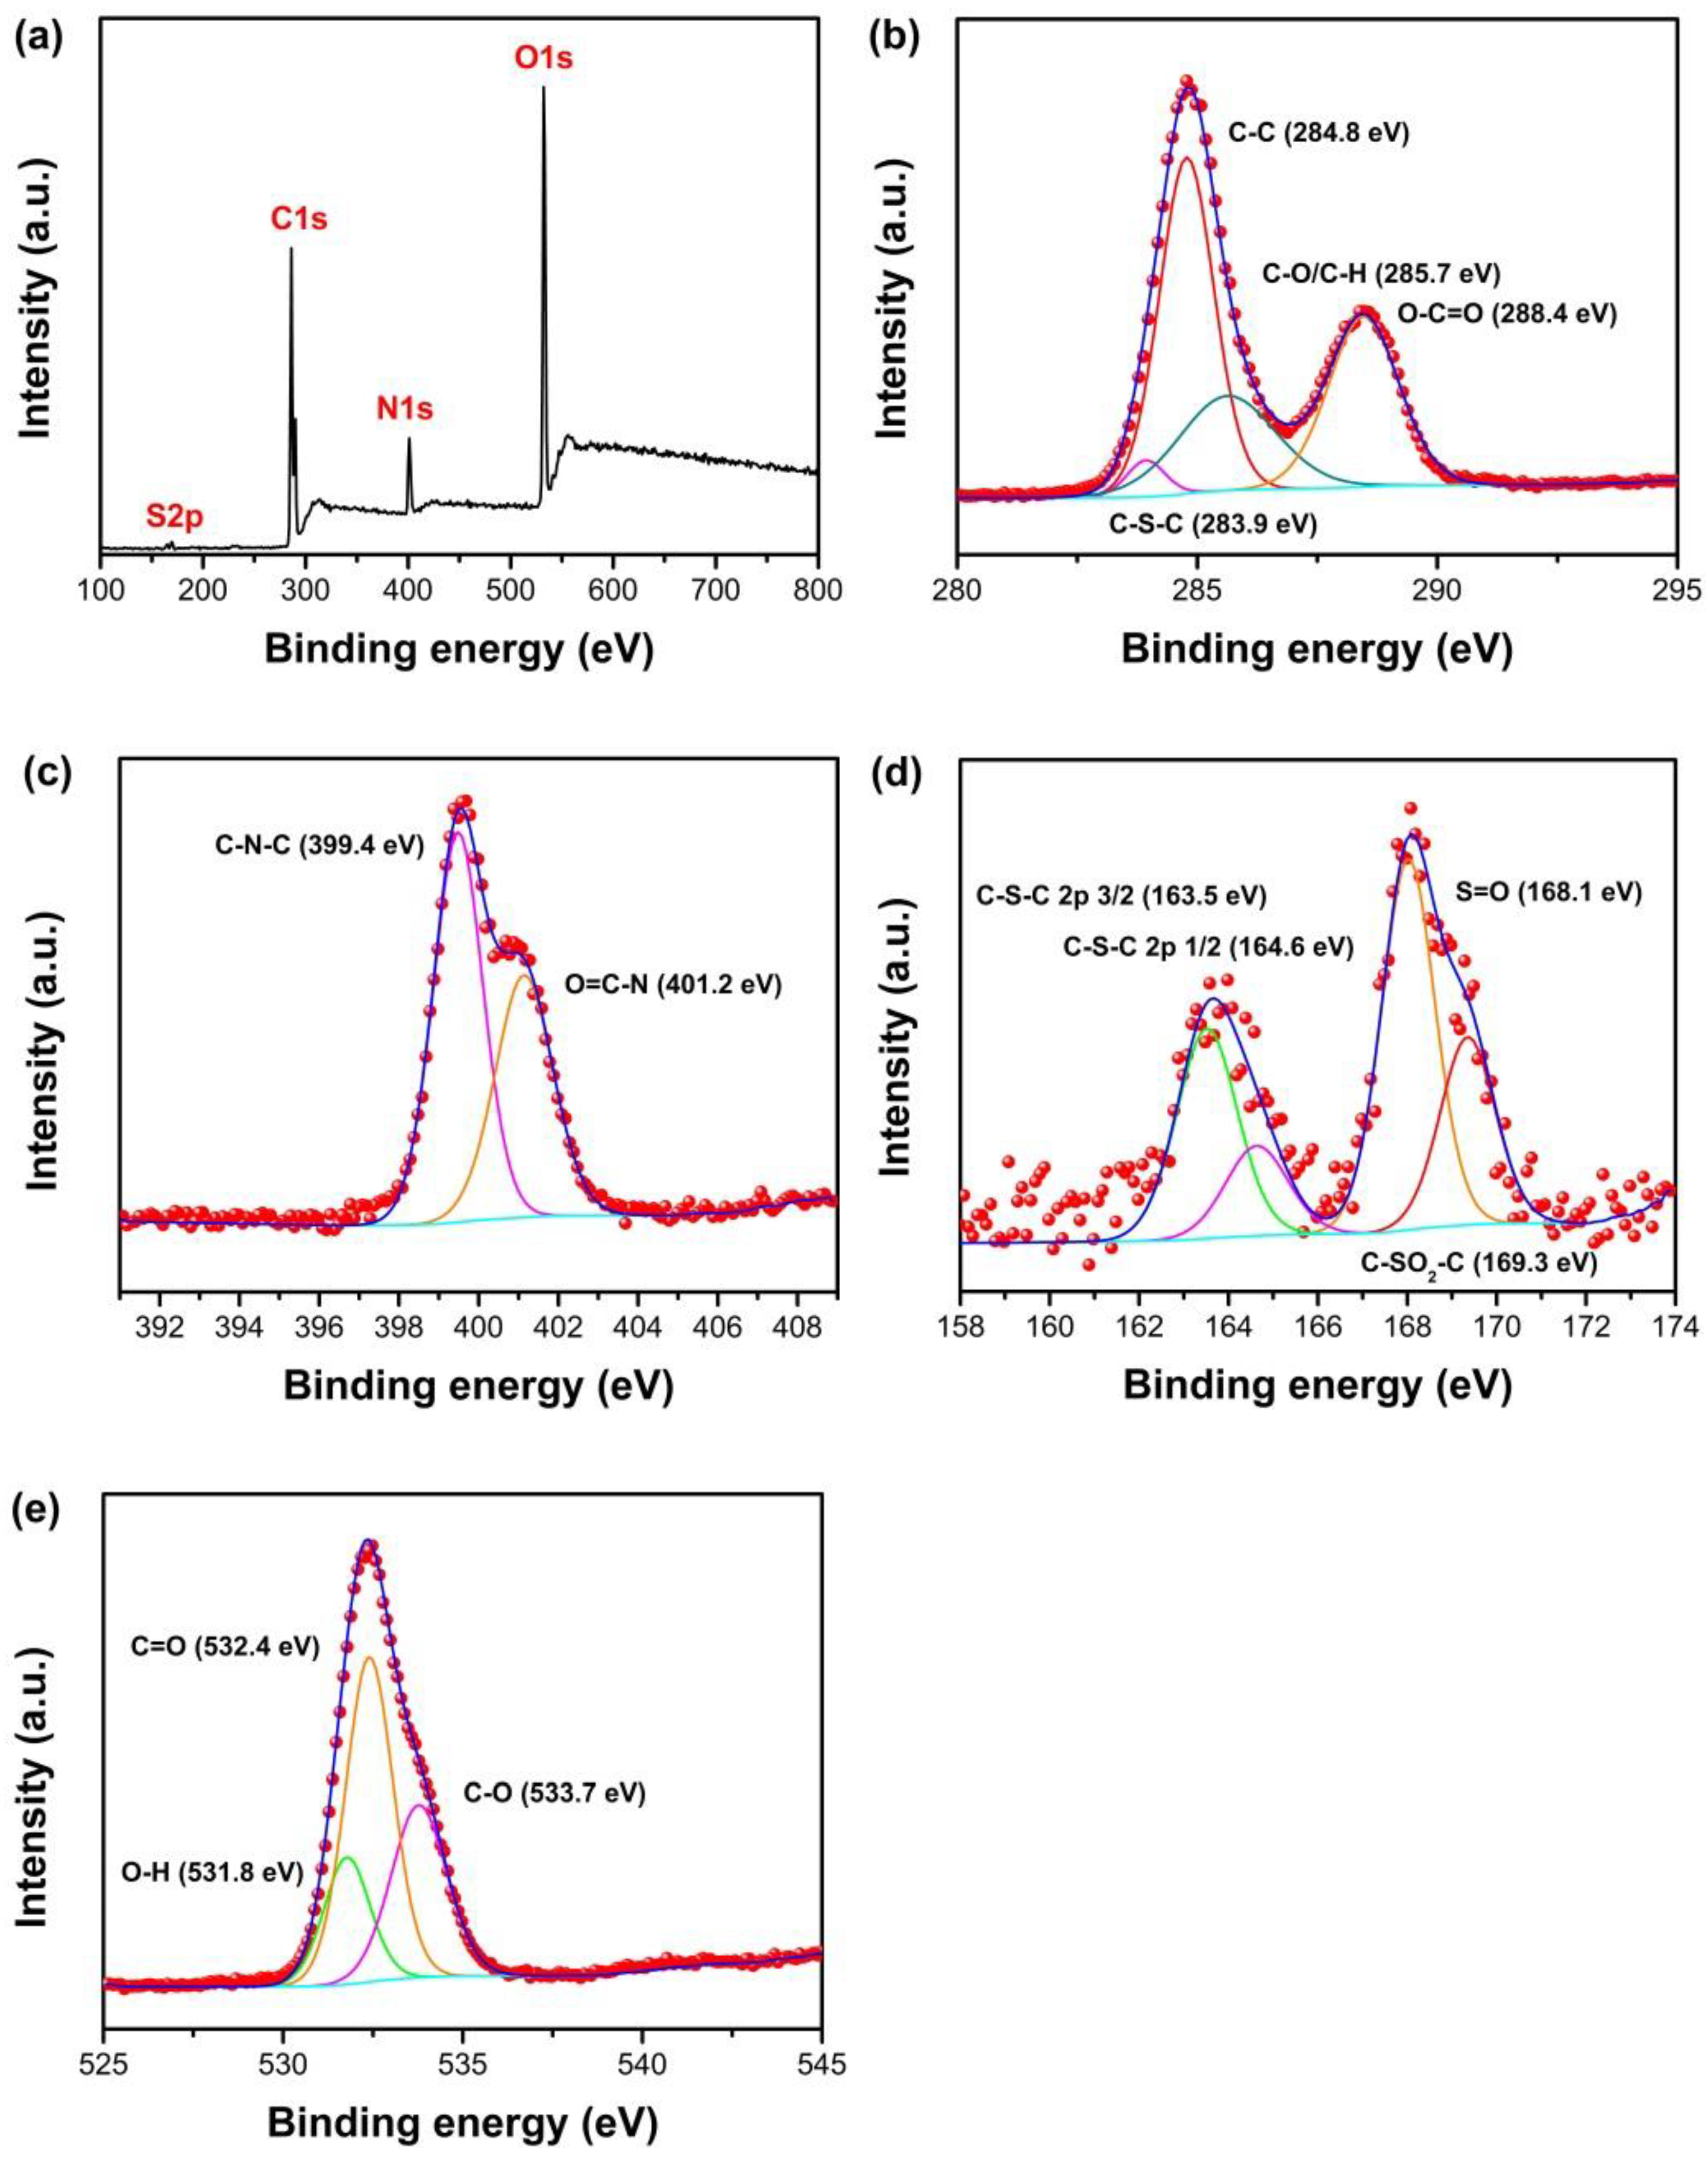
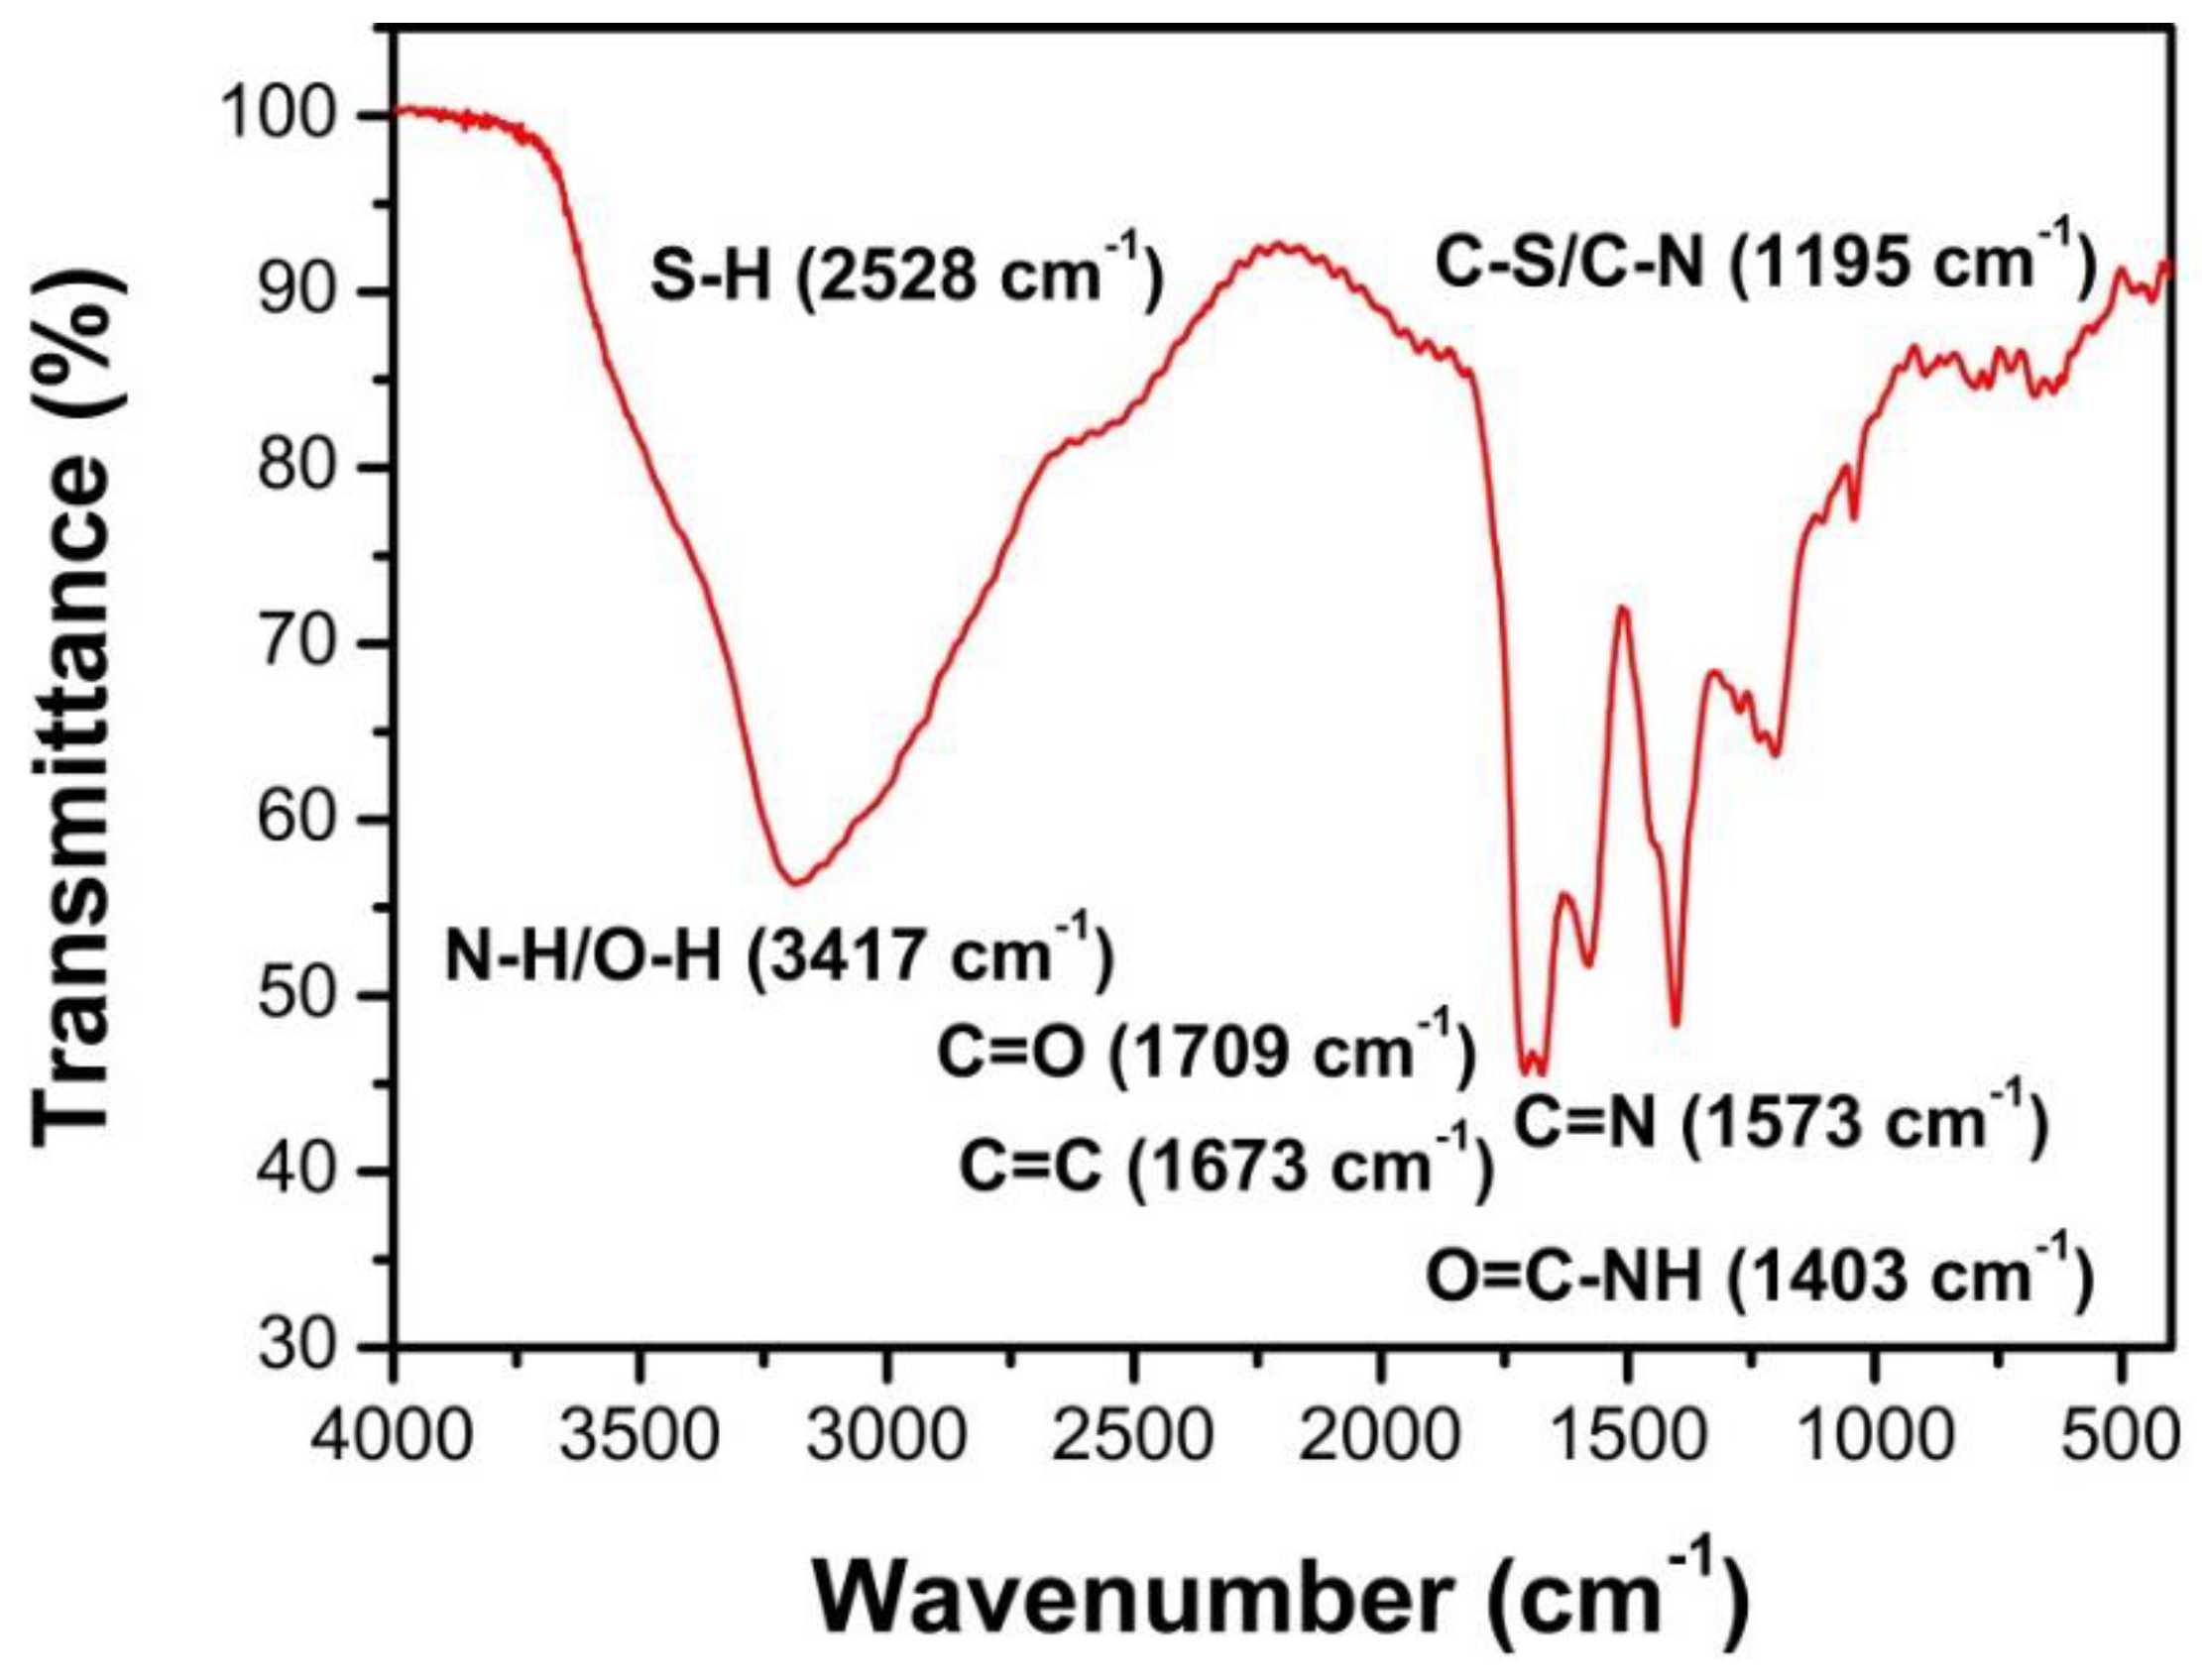
3.2. Characterization of N, S-GQDS

After the quenching mechanism analysis of N, S-GQDs, the as-synthesized N, S-GQDs were applied to detect Fe3+ and Hg2+, respectively. The morphological properties of as-synthesized N, S-GQDs were carried out by TEM and AFM images as shown in Figure 4. The high-resolution transmission electron microscopy (HRTEM) image, as shown in the inset of Figure 4a, displays the crystal lattice of N, S-GQDs with a lattice spacing distance of 2.23 Å, which corresponds to the (1120) plane of graphite [5]. The TEM image shows that the as-synthesized N, S-GQDs are well-dispersed and have a narrow sized distribution ranging from 1.5 to 4 nm with an average size of 2.5 nm, as shown in Figure 4b. AFM images reveal the thickness of N, S-GQDs, as shown in Figure 4c. The topographic height of 1.0–2.5 nm can be seen in Figure 4d with an average height of 1.5 nm. The thickness of single layered graphene is 0.34 nm, which suggests that most N, S-GQDs are single or bilayered. Therefore, it can be concluded that the as-synthesized quantum dots are graphene quantum dots.
XPS measurements were performed to characterize the elemental composition properties of as-synthesized N, S-GQDs, as shown in Figure 5. Figure 5a shows the survey spectra of N, S-GQDs. Four dominant peaks at 168.8, 285.2, 401.7, and 533.4 eV can be identified as S 2p, C 1s, N1s, and O1s, respectively. The C, S, O, and N configuration in N, S-GQDs were investigated by the deconvolution of S 2p, C 1s, N1s, and O1s peaks, as shown in Figure 5b–e. As shown in Figure 5b, the high-resolution spectrum of C 1S can be deconvoluted into four peaks at 283.9, 284.8, 285.7, and 288.4 eV, which can be assigned to C–S–C, C–C, C–O/C–H, and O–C=O, respectively [37,38]. The covalent bond of C–S–C at 283.9 eV confirms the presence of S doping in N, S-GQDs. Figure 5c represents the high-resolution spectrum of N 1s. The binding energy peaks located at 399.4 and 401.2 eV are the contributions of pyrrolic N (C–N–C) and O=C–N, respectively [39,40]. The S 2p spectrum, as shown in Figure 5d, can be deconvoluted into four distinct peaks at 163.5, 164.6, 168.1, and 169.3 eV. The peaks at 163.5 and 164.6 eV are related to the covalent bond of thiophene–S C–S–C 2p 3/2 and C–S–C 2p 1/2. The latter peaks agree with S=O (168.1 eV) and sulfone bridges C-SO2-C (169.3 eV) [41,42]. The appearance of pyrrolic N and C–S–C bond peaks indicates that S and N atoms have been successfully doped into GQDs. The spectrum of O 1s, as shown in Figure 5e, can be fitted with three peaks at 531.8, 532.4, and 533.7 eV, which are related to the contribution of O–H (531.8 eV), C=O/COOH (532.4 eV), and C–O (533.7 eV) bonds, respectively [43].
Figure 6 shows the FTIR spectrum of as-synthesized N, S-GQDs. The bands appearing around 3417 cm−1 are related to the stretching vibration of O–H or N–H bonds. The broad absorption band at 2528 cm−1 is assigned to the vibration of S–H. The absorption peaks at 1709 and 1403 cm−1, which are ascribed to the contribution of carboxyl groups (C=O) and the amide linkage (O=C–NH) bending vibration, indicate that there are abundant oxygen-contained groups on the surface of as-synthesized N, S-GQDs [40,44]. It is worthy to notice that the absorption bands at 1195 cm−1 are assigned to the vibration of C–S or C–N bonds, indicating that S and N atoms have been doped into the graphene configuration. Peaks at 1573 and 1673 cm−1 are corresponding to C=N and C=C stretching.

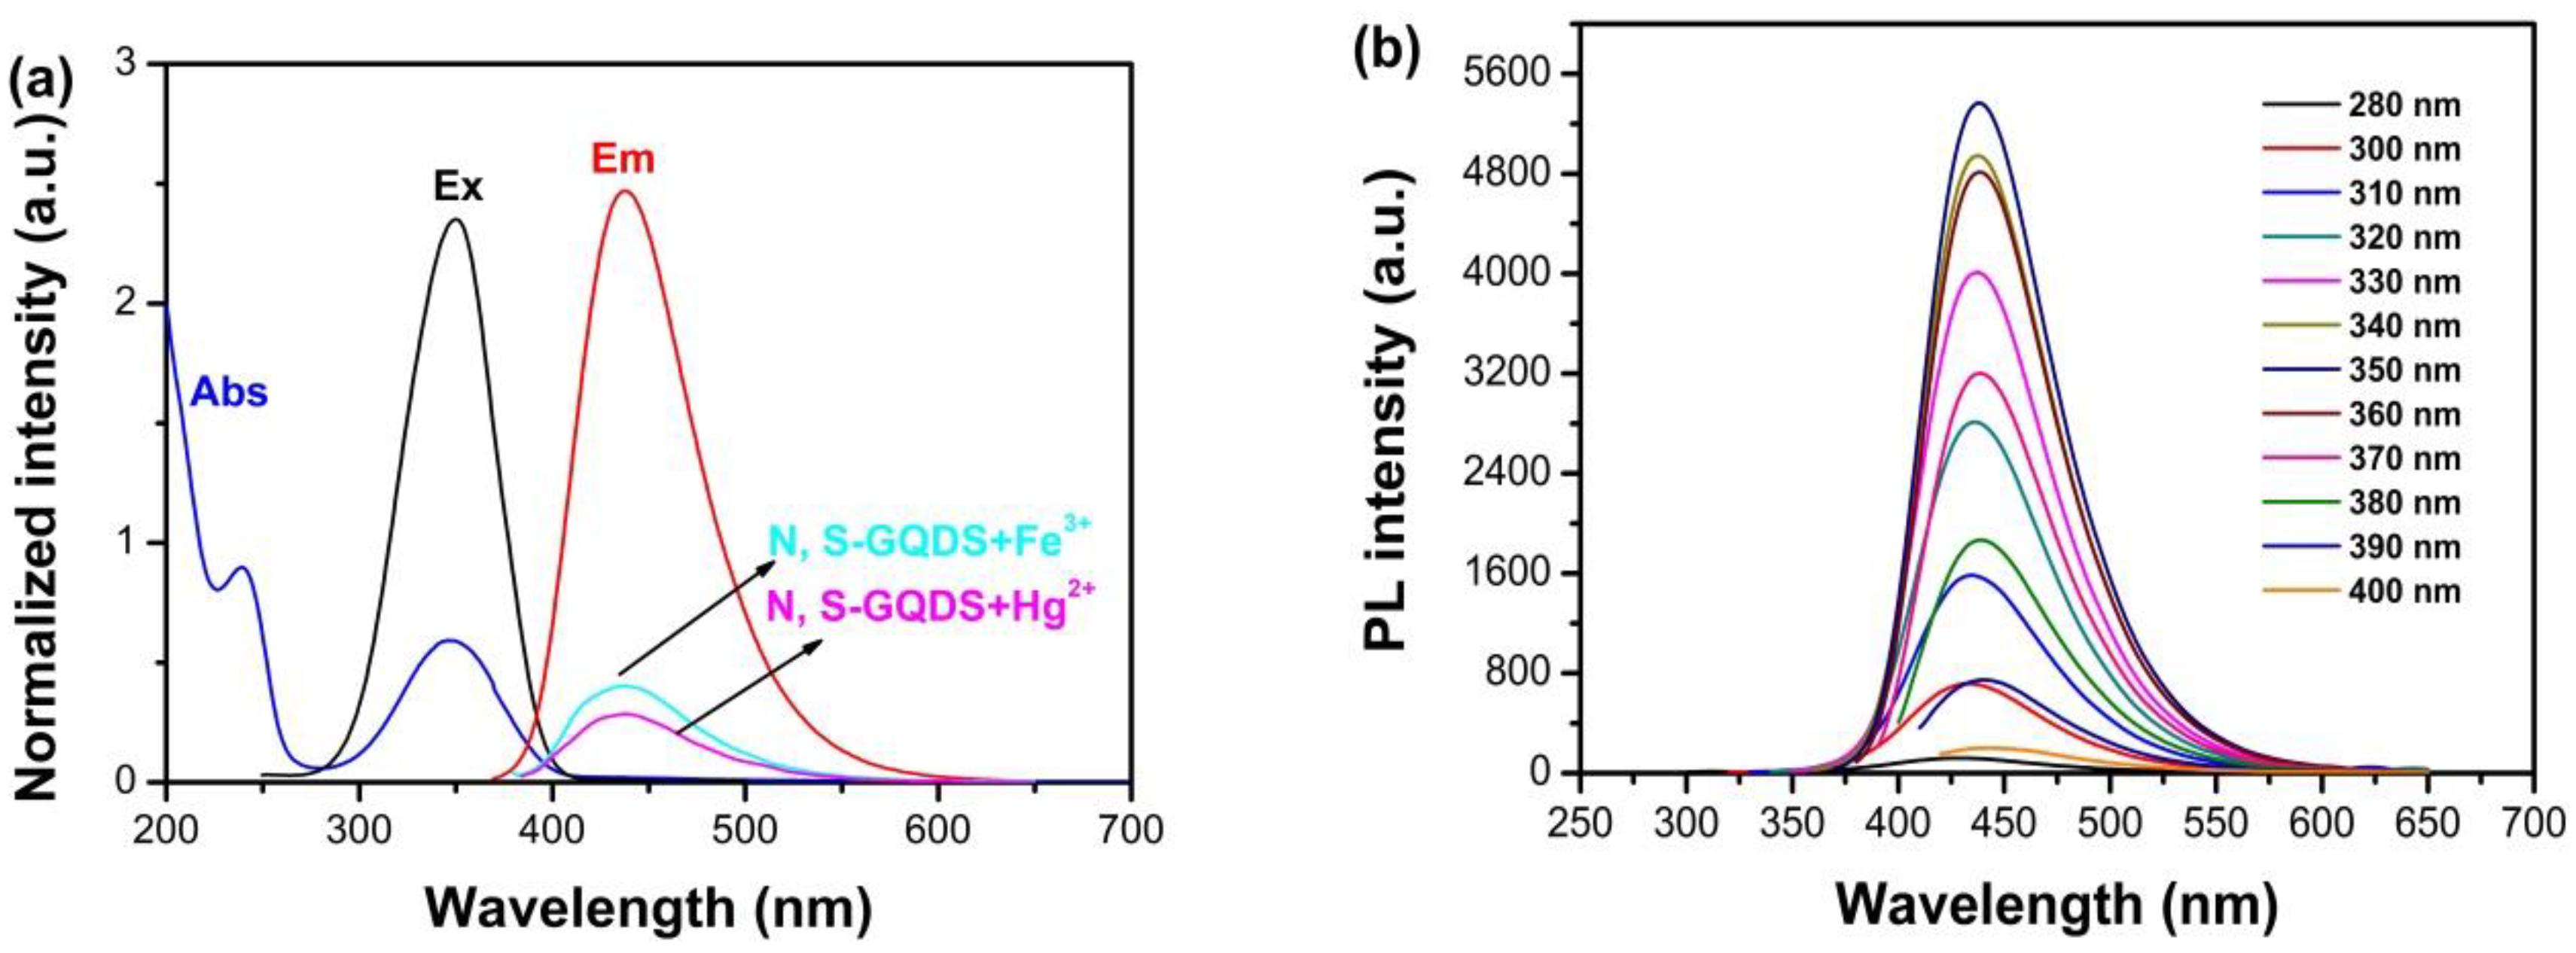
3.3. Optical Analyses of N, S-GQDS

UV-vis and fluorescence spectrum were applied to investigate the optical properties of N, S-GQDs, as shown in Figure 7. As shown in Figure 7a (blue curve), two clear characteristic absorption peaks at 230 and 350 nm can be observed, respectively. The absorption peak at 230 nm is contributed from the π–π* transition [40,45]. Typical n–π* transition absorption bands of C=O and C=N are plotted at 350 nm [5]. The fluorescence excitation wavelength of N, S-GQDs is 350 nm, as given by the photoluminescence excitation spectrum of Figure 7a (black curve), indicating that the n–π* transition is the domain excitation mode in the photoluminescence progress of N, S-GQDs [46]. The maximum wavelength of photoluminescence is 438 nm (red curve), which further proves N, S-GQDs aqueous solution emits strong blue fluorescence under UV lamp irradiation. It can be seen in Figure 7a that the fluorescence intensities of N, S-GQDs are quenched by Hg2+ and Fe3+ ions, respectively. Furthermore, the photoluminescence wavelength reveals nearly excitation-dependence properties, as shown in Figure 7b. Excitation dependent properties of N, S-GQDs are the result of surface defect and particle size variation. The emission wavelength changes slightly and is attributed to the narrow particle distribution of as-synthesized N, S-GQDs. The stabilities of as-synthesized N, S-GQDs were evaluated by recording the fluorescence intensity of N, S-GQDs for 60 days, as shown in Figure S2. The results indicate that N, S-GQDs have good fluorescent stability. Besides that, heteroatom N and S doping into graphene quantum dots’ lattice also contributes the excitation-dependence properties of N, S-GQDs [37].

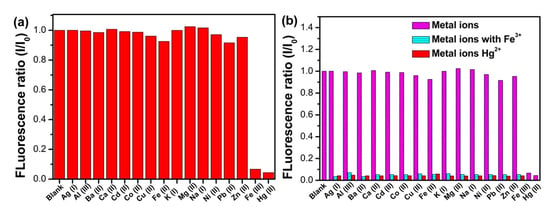
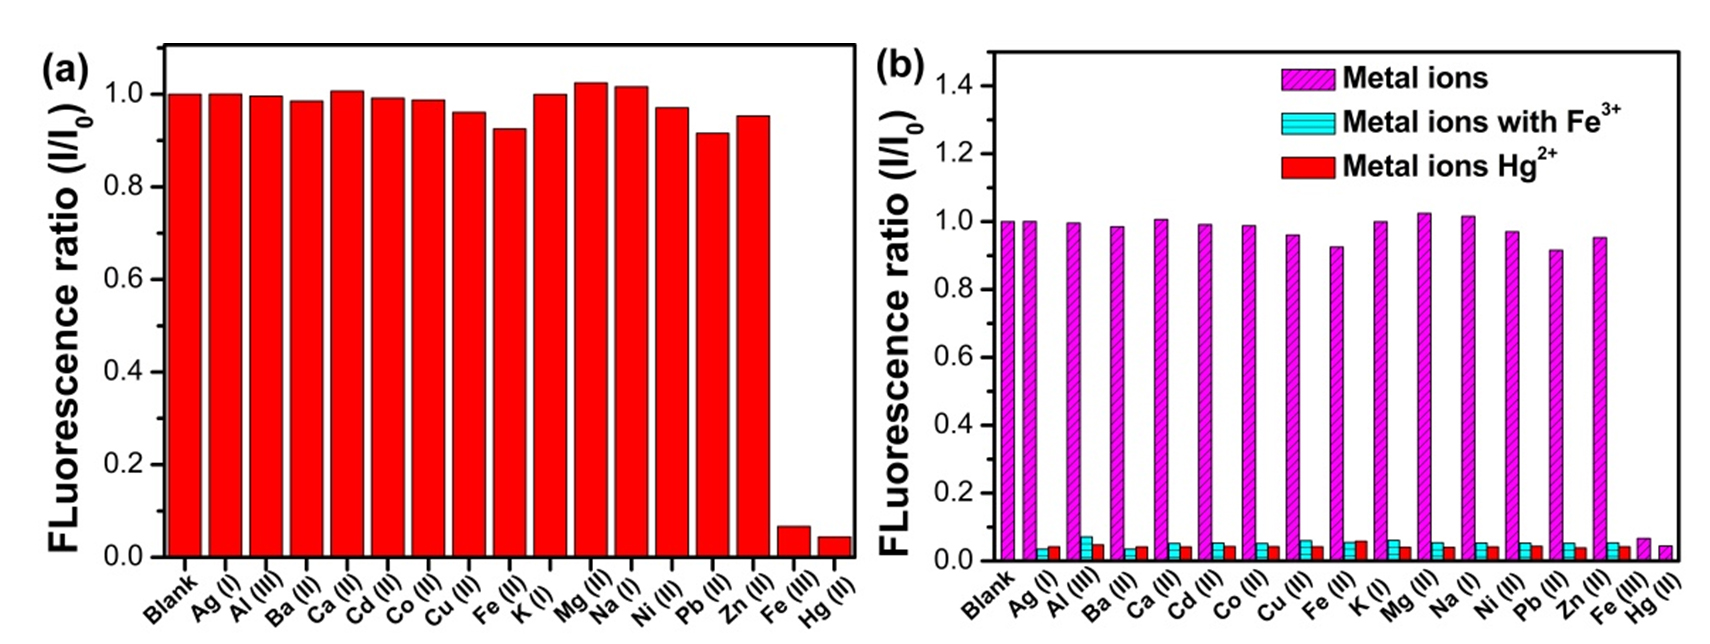
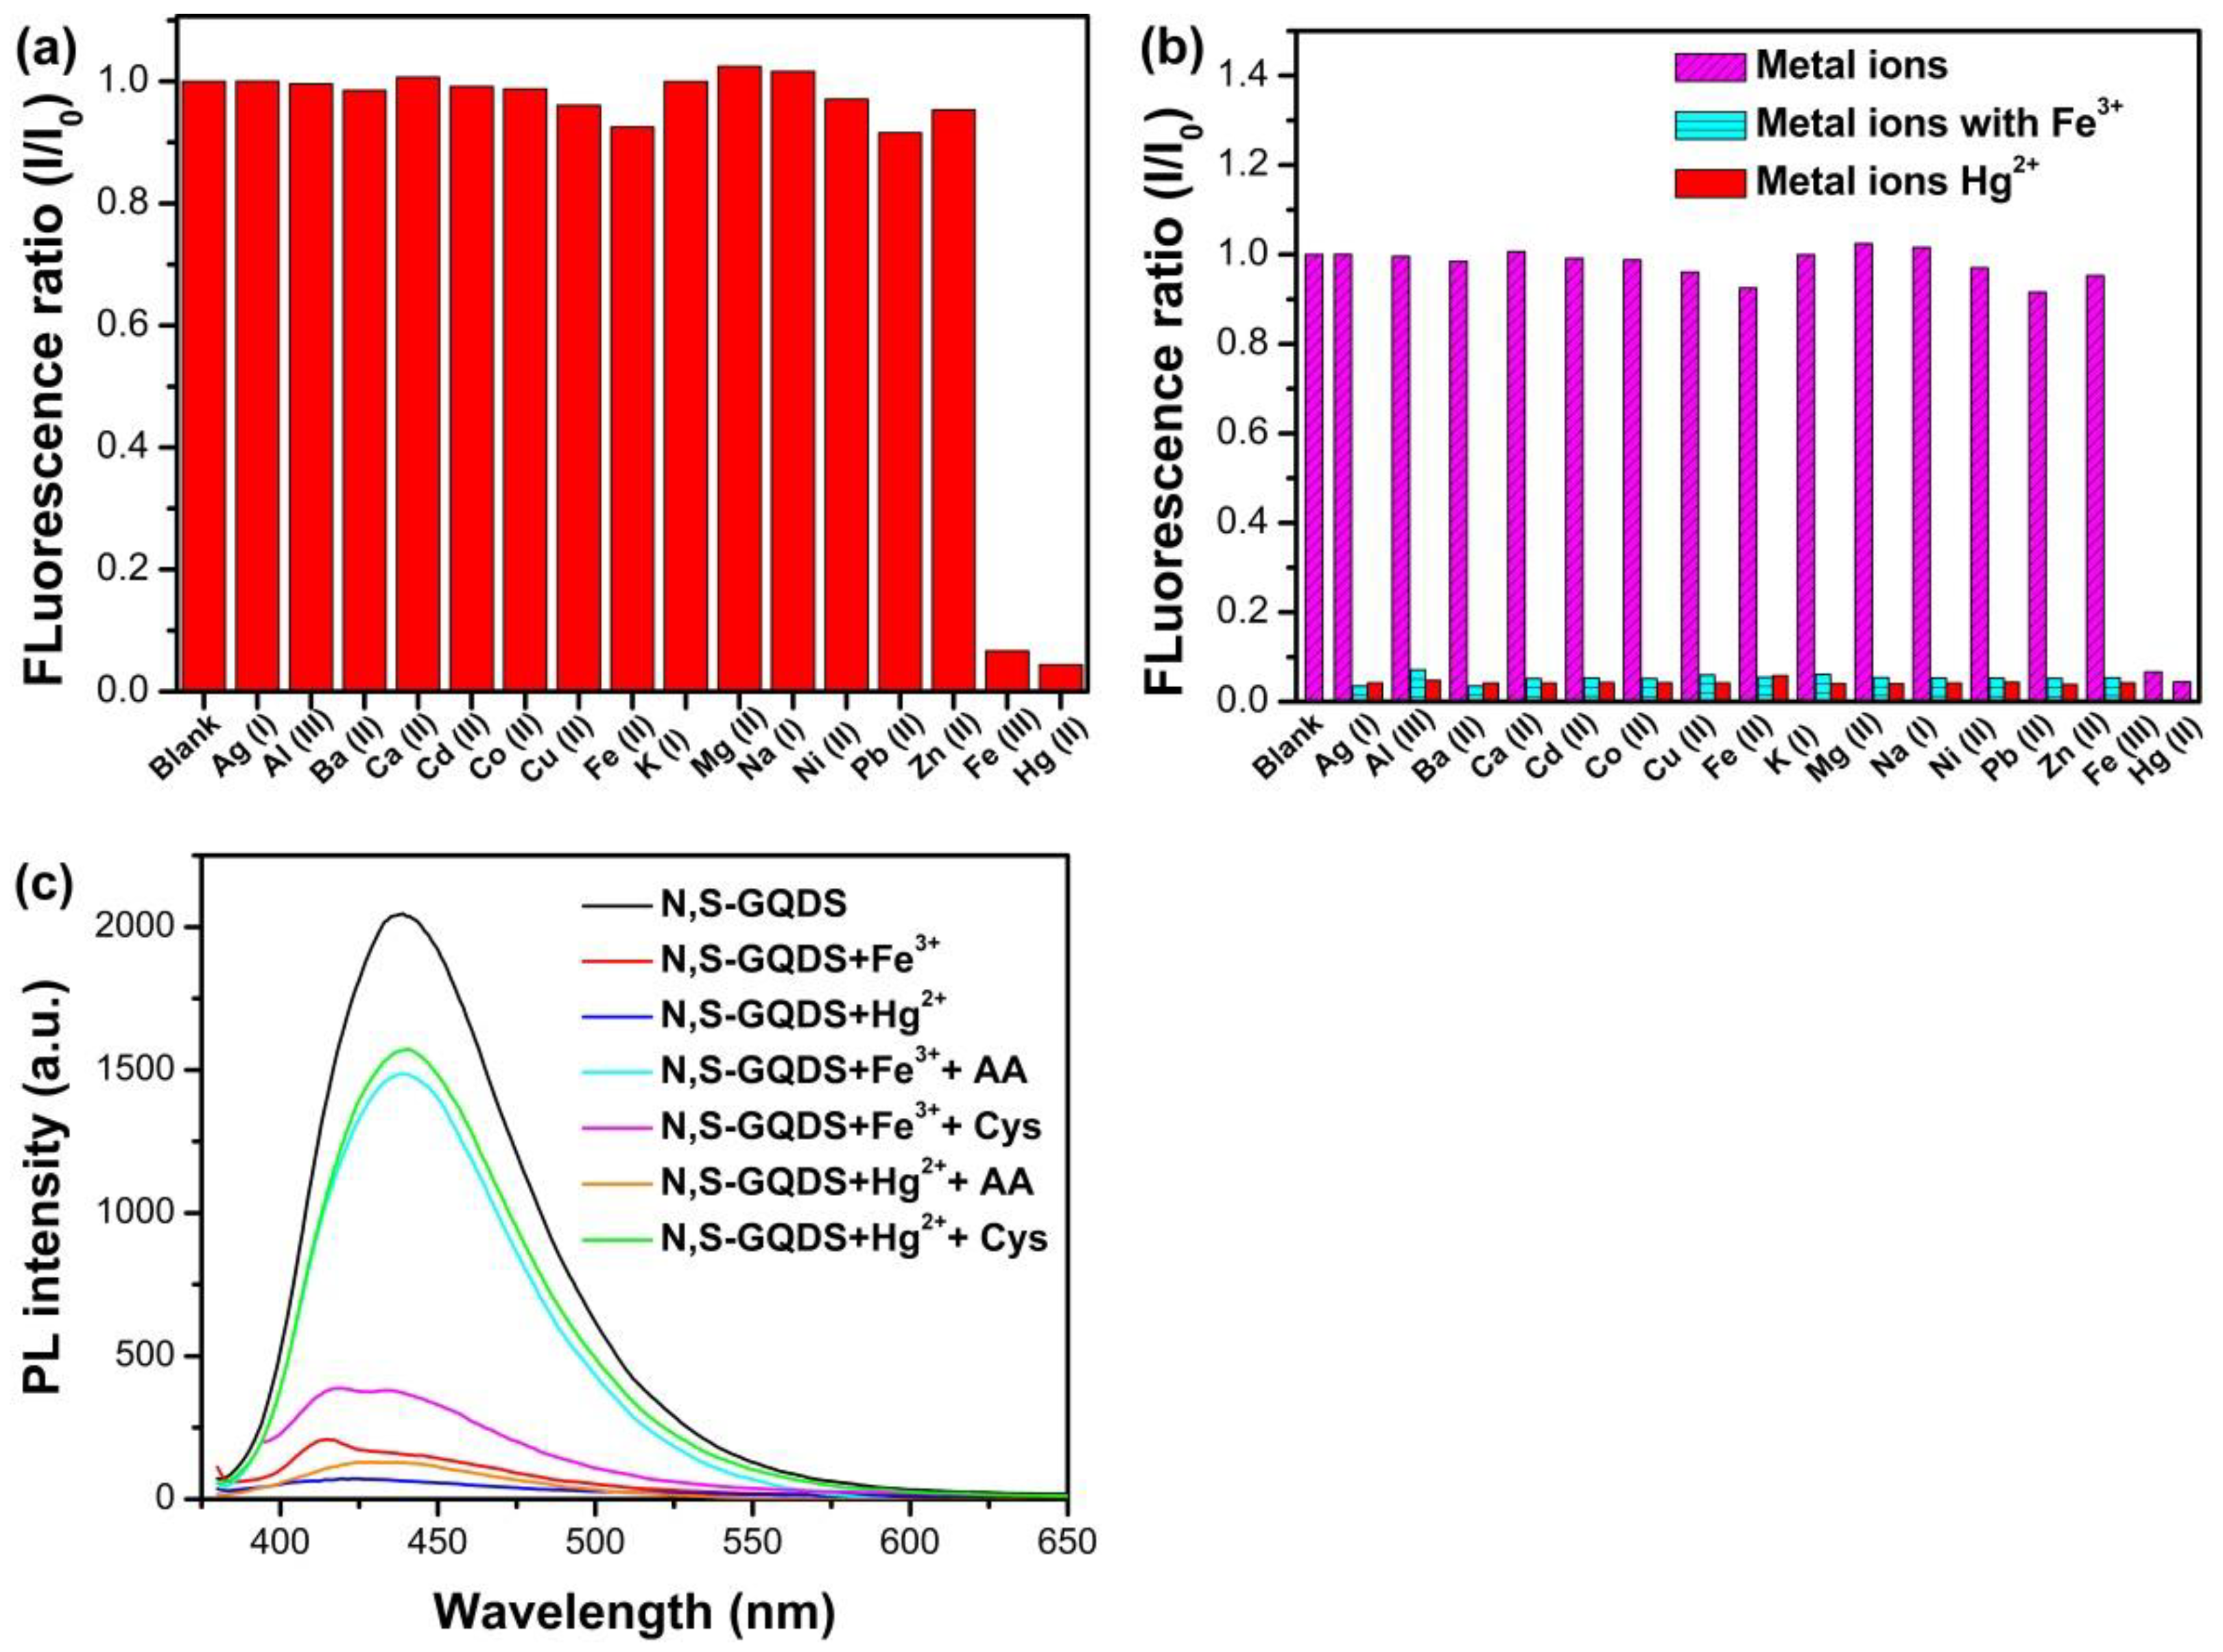
3.4. Selectivity of N, S-GQDs for Fe3+ and Hg2+ Detection

The selectivity of N, S-GQDs were evaluated by measuring the fluorescence quenching ratio as a result of the addition of various cations, including Ag+, K+, Ba2+, Mg2+, Ca2+, Al3+, Co2+, Cd2+, Zn2+, Cu2+, Fe2+, Na+, Ni2+, and Pb2+. The fluorescence quenching ratios were recorded in the presence of 50 µM various cations, as shown in Figure 8a. Of all the cations tested, only Hg2+ and Fe3+ led to efficient quenching of fluorescence intensity. Moreover, the interfering tests of N, S-GQDs, as shown in Figure 8b, were investigated through recording the fluorescence quenching ratio on Fe3+ or Hg2+ with the addition of various interfering cations (50 µM). As displayed in Figure 8c, the presence of interfering ions does not have an obvious impact on Fe3+ or Hg2+ detection. When Fe3+ or Hg2+ coexist in the detection sample, the interfering of another cation can be eliminated by adding ascorbic acid (AA) and cysteine (Cys), respectively.
Some reports have shown that the good affinity between quencher cations and functional groups on the surface of quantum dots relates to the good selectivity of GQDs’ fluorescence probe [47,48,49]. XPS and FTIR analysis show that there are many carboxyl, hydroxyl, amino, and hydrosulfonyl groups on the surface of N, S-GQDs. Fe3+ and Hg2+ have good affinity with them. Hence, N, S-GQDs have better selectivity to Fe3+ or Hg2+ than other cations. Bond populations and electron density difference also were calculated to investigate the interaction between N, S-GQDs and a quencher (Fe3+ or Hg2+). As listed in Table S1, the bond population of Fe-S was calculated as 0.17, indicating Fe3+ can covalently bond with S. The electron density difference of Fe3+@N, S-GQDs and Hg2+@N, S-GQDs are plotted in Figure 9. The red areas represent the electron enrichment and the blue areas indicate electron withdrawal. The electron density difference distributed between Fe and S atoms, as shown in Figure 9a, shows the characteristic of covalent bond distribution, which agrees with bond population analysis. According to the electron density difference and bond population of Hg2+@N, S-GQDs, as shown in Figure 9c,d, there are no obvious covalent or chemical bonds formed between Hg and doped atoms (N, S). The atomic population of doped S shows that a doped S atom has a positive charge population. This situation could reduce the ability for S atoms forming chemical bonds with interfering cations. Meanwhile, energetically favorable adsorption and the charge favorable sites on the surface of N, S-GQDs also avail the electron transfer between Fe3+, Hg2+, and N, S-GQDs [9]. Therefore, N, S-GQDs have better selectivity to Fe3+ and Hg2+ than other interfering cations.

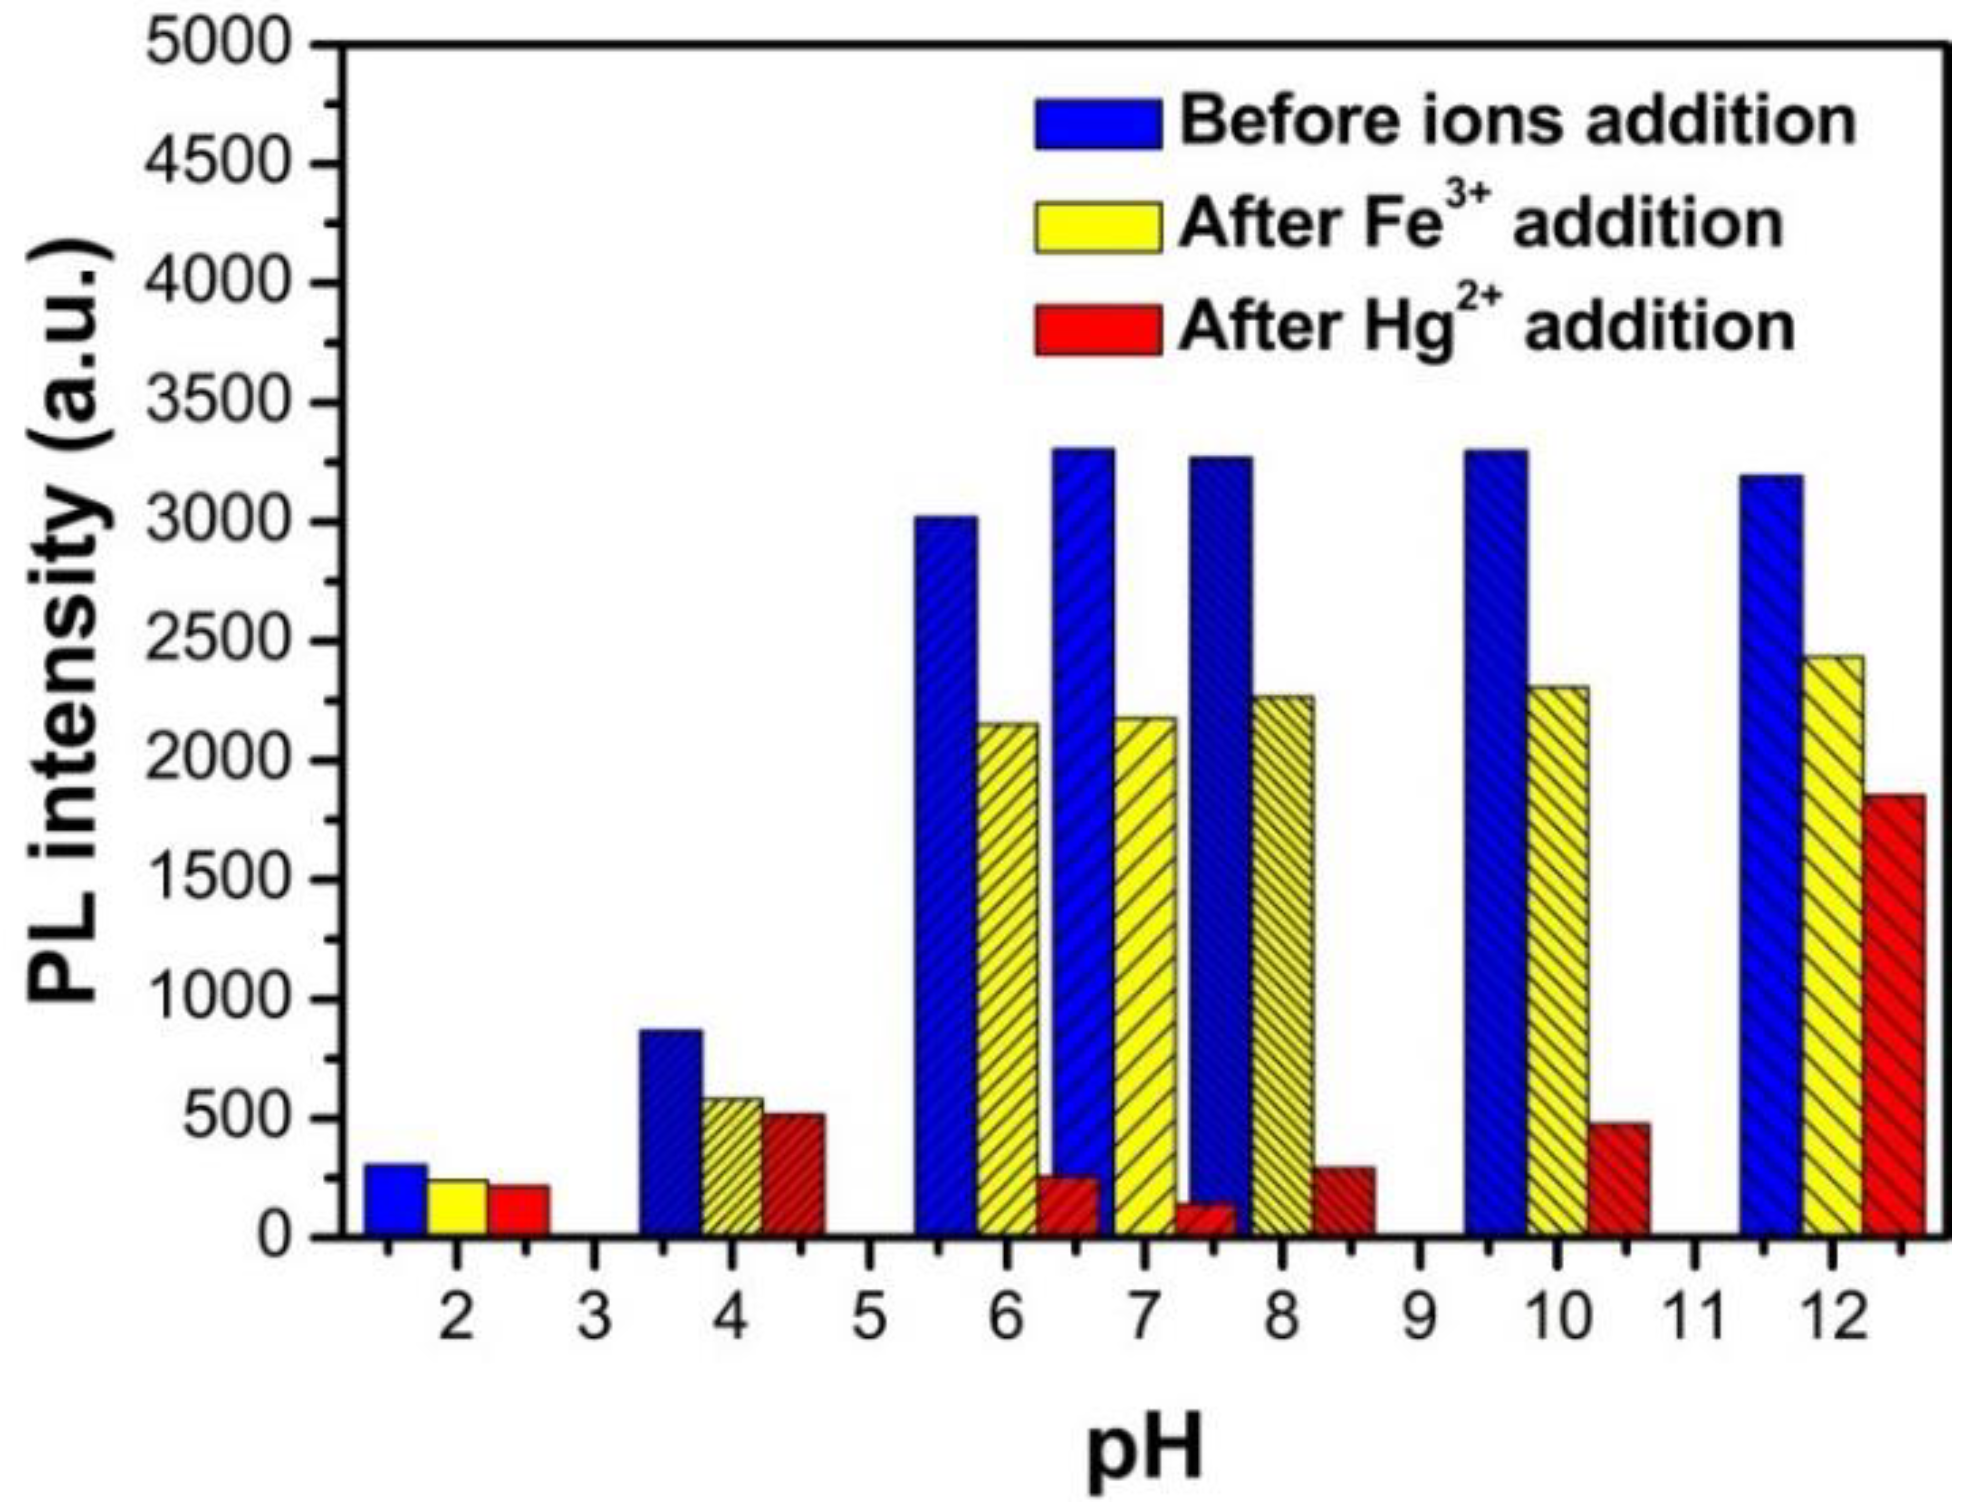
3.5. The Fluorescence Properties of N, S-GQDs under Acidity and Alkalinity Situations

The fluorescence stability and fluorescence quenching ratio were tested by measuring fluorescence intensity change on various pH values from 2.0 to 12.0, as shown in Figure 10. The fluorescence intensities of N, S-GQDs remain stable in alkaline conditions, while there is a decrease of fluorescence intensity in the pH range from 2.0 to 7.0. The decrease of fluorescence intensity of N, S-GQDs in acidic solution can be attributed to the protonation of amino and carboxylic groups in N, S-GQDs. As the carboxyl and amino groups on the surface of N, S-GQDs tend to bond with protons, resulting in the redistribution of surface electrons in acidic conditions. The fluorescence intensity decrease is assigned to the aggregation of N, S-GQDs after the protonation process of amino and carboxylic groups take place [50]. However, the carboxyl groups on the surface of N, S-GQDs are deprotonated in alkaline medium and form a negative charge shell, which makes the fluorescence properties of N, S-GQDs retain a stable performance [51]. As shown in Figure 10, the fluorescence quenching performance of N, S-GQDs show pH-dependent behavior in the presence of 1 μM Hg2+ and 1μM Fe3+, respectively. Carboxyl groups on the surface of N, S-GQDs are well protonated in acidic medium, which can weaken the affinity between metal ions (Hg2+ or Fe3+) and carboxyl groups, resulting in less fluorescence quenching. Hence, the fluorescence quenching performance of as-synthesized N, S-GQDs has pH-dependence behavior. Considering the fluorescence intensity and best fluorescence quenching of N, S-GQDs, the following photoluminescence spectra were measured under pH 7.

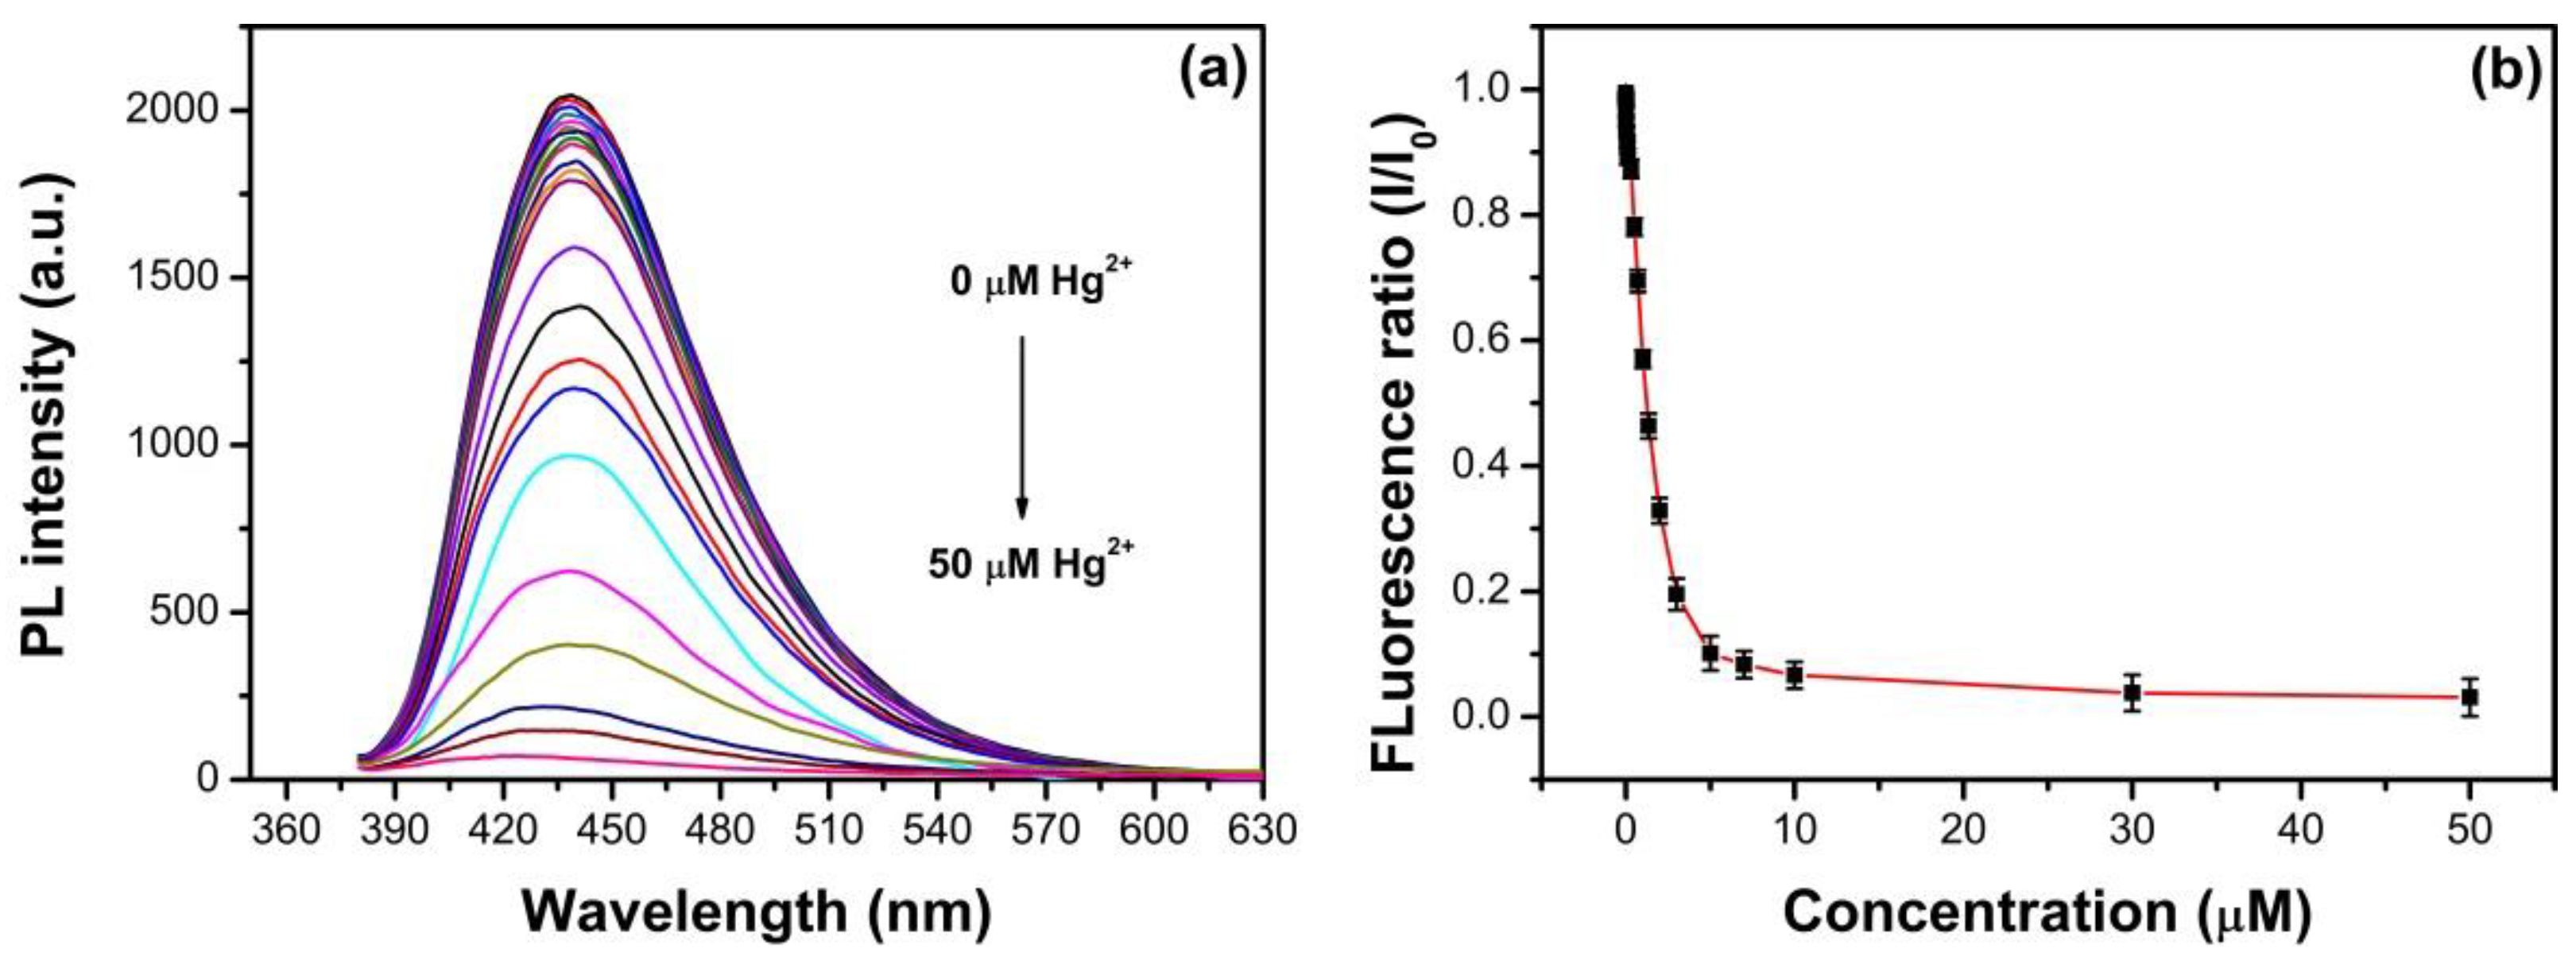
3.6. Detection of Fe3+ and Hg2+ Using N, S-GQDs as a Sensor

The fluorescence quenching performance after the addition of various concentrations of Fe3+ is plotted in Figure 11. As shown in Figure 11a, the fluorescence intensities of N, S-GQDs are quenched by Fe3+. The fluorescence quenching ratios are performed to determine the sensitivity of as-synthesized N, S-GQDs for Fe3+ detection, as shown in Figure 11b–d. Figure 11b shows the fluorescence quenching ratio as a function of Fe3+ concentration in the range 0–100 μM. Two individual linear relationships between the fluorescence quenching ratio and the concentration of Fe3+ can be observed in the dynamic ranges 1–90 nM and 0.1–30 μM, as shown in Figure 11c,d, respectively. As shown in Figure 11c, the linear regression equation (I and I0 refer to the fluorescence intensity of N, S-GQDs at 438 nm in the presence and absence of Fe3+, respectively) is I/I0 = 0.98951–0.0005194 [Fe3+]. The corresponding regression coefficient (R2) is 0.985. A good detection limit (LOD) of 2.88 nM can be obtained by the standard curve of the fluorescence quenching ratio and Fe3+ concentration (1–90 nM). The detection limit is defined by a signal-to-noise ratio of 3. In addition, the LOD can be calculated as 55.49 nM in the dynamic range 0.1–30 μM. According to the Standards for Drinking Water Quality of China National Standers, the threshold limit of Fe3+ ion content in water is 0.3 mg/L (5.37 μM) [52]. Therefore, the dynamic range and detection limit of as-synthesized N, S-GQDs have comparable application potential for Fe3+ detection in drinking water.
Besides that, the as-synthesized N, S-GQDs were applied to determine Hg2+, as shown in Figure 12. As described in Figure 12a, the as-synthesized N, S-GQDs exhibit Hg2+ concentration-dependent fluorescence properties. The fluorescence intensity of N, S-GQDs can be quenched after the addition of various amounts of Hg2+. There is a good linear relationship (I/I0 = 0.99383−0.00181 [Hg2+], R2 = 0.991) between the fluorescence quenching ratio and Hg2+ concentration in the range 1–30 nM, as shown in Figure 12c. The detection limit can be calculated as 0.27 nM, which satisfies the requirements of the Chinese National Standards (0.001 mgL−1, 4.98 nM) and the United States Environmental Protection Agency (0.002 mg L−1, 9.96 nM) for the safety demands of Hg2+ in drinking water [52,53]. In addition, another linear relationship can be observed in the range 100–1000 nM with the detection limit of 36.85 nM, which also meets the requirements of the China National Standards for the upper safety limit of total mercury content in industrial effluent (0.05 mg L−1, 249 nM) [52]. The doped atom N and S not only has contributed to the fluorescence quenching process of N, S-GQDs, but also makes the as-synthesized N, S-GQDs have a comparable detection performance on Fe3+ or Hg2+ to other fluorescence sensing systems. The detection performances of N, S-GQDs for Fe3+ or Hg2+ are compared with various reported fluorescence sensors, as listed in Table 2 and Table 3.

3.7. Real Sample Detection Analyses

To evaluate the applicability of an as-synthesized N, S-GQDs fluorescence probe, the performance of N, S-GQDs in real drinking water samples was investigated. Figure S3 displays the fluorescence intensity change spectra of N, S-GQDs with different concentrations of Fe3+ (70 nM, 1 μM, and 3 μM) and Hg2+ (50, 100, and 300 nM), respectively. The recoveries of Fe3+ or Hg2+ detection are given in Table S2. Recoveries of drinking water sample detection are close to 100%. The obtained results imply that the as-synthesized N, S-GQDs have potential as a fluorescent probe for Fe3+ or Hg2+ detection in drinking water

4. Conclusions

In this work, DFT and experimental studies indicate that non-radiative electron transfer between Hg2+ cations and N, S-GQDs cause dynamic fluorescence quenching. The good sensitivity of N, S-GQDs for Fe3+ is mainly attributed to the IFE quenching. Doped atoms can produce charge favorable sites, which can interact with Fe3+ or Hg2+, leading to the fluorescence quenching of N, S-GQDs. Ead calculations reveal that the adsorption of Hg2+ or Fe3+ are energetically favorable, which also contribute to the non-fluorescence electron transfer. The as-synthesized N, S-GQDs were applied to detect Fe3+ and Hg2+ in aqueous solution. The results show that as-synthesized N, S-GQDs have good selectivity and sensitivity to Fe3+ and Hg2+, respectively. The analysis of the fluorescence quenching ratio displays a good linear relationship in both Fe3+ and Hg2+ detection. For Fe3+ detection, a good detection limit of 55.49 nM can be found in the dynamic response range of 0.1 μM to 30 μM, which is lower than the recommended content of Fe3+ in drinking water by China National Standers. Furthermore, a good detection limit of 0.27 nM with a wide dynamic range (1–30 nM) was obtained for Hg2+ detection, implying that this method has potential for nanomolar level detection of Hg2+ in aqueous solution. Therefore, the facile, inexpensive, and sensitive N, S-GQDs present a promising candidate as a fluorescence probe for fluorescence detection.

Supplementary Materials

The following are available online at https://www.mdpi.com/2079-4991/9/5/738/s1, Figure S1: The schematic diagram of detection device geometry and testing process, Figure S2: The stability of fluorescence intensity of as-synthesized N, S-GQDs solutions, Figure S3: The fluorescence intensity of N, S-GQDs in real sample detection, Table S1: The atomic populations of Fe3+@N, S-GQDs and Hg2+@N, S-GQDs, Table S2: Recovery of Fe3+ and Hg2+ detection in drinking water samples.

Author Contributions

Y.Y. synthesized the samples, performed PL experiments, and wrote the main manuscript. X.X. and Z.W. analyzed the data. R.Z., T.Z., S.P., and X.Z. performed XPS experiments. Y.W. revised and edited the paper.

Funding

This work was supported by Department of Science and Technology of Yunnan Province via the Key Project for the Science and Technology (Grant No. 2017FA025) and the National Natural Science Foundation of China (Grant No. 61761047 and No. 41876055) and Program for Innovative Research Team (in Science and Technology) in University of Yunnan Province.

Acknowledgments

The author would like to acknowledge the Department of Science and Technology of Yunnan Province for financial support. The DFT study was also supported by the Supercomputer Center of Yunnan University.

Conflicts of Interest

The authors declare no conflicts of interest.

References

  1. Guo, R.; Zhou, S.; Li, Y.; Li, X.; Fan, L.; Voelcker, N.H. Rhodamine-functionalized graphene quantum dots for detection of Fe3+ in cancer stem cells. ACS Appl. Mater. Interfaces 2015, 7, 23958–23966. [Google Scholar] [CrossRef]
  2. Bak, S.; Kim, D.; Lee, H. Graphene quantum dots and their possible energy applications: A review. Curr. Appl. Phys. 2016, 16, 1192–1201. [Google Scholar] [CrossRef]
  3. Xu, F.; Shi, H.; He, X.; Wang, K.; He, D.; Yan, L.; Ye, X.; Tang, J.; Shangguan, J.; Luo, L. Masking agent-free and channel-switch-mode simultaneous sensing of Fe3+ and Hg2+ using dual-excitation graphene quantum dots. Analyst 2015, 140, 3925–3928. [Google Scholar] [CrossRef] [PubMed]
  4. Jurado-Sánchez, B.; Pacheco, M.; Rojo, J.; Escarpa, A. Magnetocatalytic graphene quantum dots janus micromotors for bacterial endotoxin detection. Angew. Chem. 2017, 129, 7061–7065. [Google Scholar] [CrossRef]
  5. Bian, S.; Shen, C.; Qian, Y.; Liu, J.; Xi, F.; Dong, X. Facile synthesis of sulfur-doped graphene quantum dots as fluorescent sensing probes for Ag+ ions detection. Sens. Actuators B Chem. 2017, 242, 231–237. [Google Scholar] [CrossRef]
  6. Kamat, P.V. Photochemistry on nonreactive and reactive (semiconductor) surfaces. Chem. Rev. 1993, 93, 267–300. [Google Scholar] [CrossRef]
  7. Zu, F.; Yan, F.; Bai, Z.; Xu, J.; Wang, Y.; Huang, Y.; Zhou, X. The quenching of the fluorescence of carbon dots: A review on mechanisms and applications. Microchim. Acta 2017, 184, 1899–1914. [Google Scholar] [CrossRef]
  8. Ghali, M. Static quenching of bovine serum albumin conjugated with small size CdS nanocrystalline quantum dots. J. Lumin. 2010, 130, 1254–1257. [Google Scholar] [CrossRef]
  9. Xu, T.-T.; Yang, J.-X.; Song, J.-M.; Chen, J.-S.; Niu, H.-L.; Mao, C.-J.; Zhang, S.-Y.; Shen, Y.-H. Synthesis of high fluorescence graphene quantum dots and their selective detection for Fe3+ in aqueous solution. Sens. Actuators B Chem. 2017, 243, 863–872. [Google Scholar] [CrossRef]
  10. Shi, B.; Zhang, L.; Lan, C.; Zhao, J.; Su, Y.; Zhao, S. One-pot green synthesis of oxygen-rich nitrogen-doped graphene quantum dots and their potential application in pH-sensitive photoluminescence and detection of mercury(II) ions. Talanta 2015, 142, 131–139. [Google Scholar] [CrossRef]
  11. Crisostomo, C.P.; Yao, L.-Z.; Huang, Z.-Q.; Hsu, C.-H.; Chuang, F.-C.; Lin, H.; Albao, M.A.; Bansil, A. Robust large gap two-dimensional topological insulators in hydrogenated III–V buckled honeycombs. Nano Lett. 2015, 15, 6568–6574. [Google Scholar] [CrossRef]
  12. Lian, C.; Ni, J. Strain induced phase transitions in silicene bilayers: A first principles and tight-binding study. AIP Adv. 2013, 3. [Google Scholar] [CrossRef]
  13. Bhorge, Y.R.; Tsai, H.-T.; Huang, K.-F.; Pape, A.J.; Janaki, S.N.; Yen, Y.-P. A new pyrene-based Schiff-base: A selective colorimetric and fluorescent chemosensor for detection of Cu(II) and Fe(III). Spectrochim. Acta Part A Mol. Biomol. Spectrosc. 2014, 130, 7–12. [Google Scholar] [CrossRef]
  14. Perez, C.; Tong, Y.; Guo, M. Iron chelators as potential therapeutic agents for Parkinsons disease. Curr. Bioact. Compd. 2008, 4, 150–158. [Google Scholar] [CrossRef]
  15. Narayanaswamy, N.; Govindaraju, T. Aldazine-based colorimetric sensors for Cu2+ and Fe3+. Sens. Actuators B Chem. 2012, 161, 304–310. [Google Scholar] [CrossRef]
  16. Tabner, B.J.; Turnbull, S.; El-Agnaf, O.M.A.; Allsop, D. Formation of hydrogen peroxide and hydroxyl radicals from Aβ and α-synuclein as a possible mechanism of cell death in Alzheimer’s disease and Parkinson’s disease. Free Radic. Biol. Med. 2002, 32, 1076–1083. [Google Scholar] [CrossRef]
  17. Ajioka, R.S. Clinical consequences of iron overload in hemochromatosis homozygotes. Blood 2003, 101, 3351–3353. [Google Scholar] [CrossRef] [PubMed] [Green Version]
  18. Zimmermann, M.B.; Hurrell, R.F. Nutritional iron deficiency. Lancet 2007, 370, 511–520. [Google Scholar] [CrossRef]
  19. Arduini, F.; Majorani, C.; Amine, A.; Moscone, D.; Palleschi, G. Hg2+ detection by measuring thiol groups with a highly sensitive screen-printed electrode modified with a nanostructured carbon black film. Electrochim. Acta 2011, 56, 4209–4215. [Google Scholar] [CrossRef]
  20. Yang, Y.; Gou, X.; Blecha, J.; Cao, H. A highly selective pyrene based fluorescent sensor toward Hg2+ detection. Tetrahedron Lett. 2010, 51, 3422–3425. [Google Scholar] [CrossRef]
  21. Ronchetti, R.; Zuurbier, M.; Jesenak, M.; Koppe, J.; Farah Ahmed, U.; Ceccatelli, S.; Pia Villa, M. Children’s health and mercury exposure. Acta Paediatr. 2006, 95, 36–44. [Google Scholar] [CrossRef]
  22. Li, R.; Wu, H.; Ding, J.; Fu, W.; Gan, L.; Li, Y. Mercury pollution in vegetables, grains and soils from areas surrounding coal-fired power plants. Sci. Rep. 2017, 7, 46545. [Google Scholar] [CrossRef] [PubMed] [Green Version]
  23. Wu, F.; Yang, M.; Zhang, H.; Zhu, S.; Zhu, X.; Wang, K. Facile synthesis of sulfur-doped carbon quantum dots from vitamin B1 for highly selective detection of Fe3+ ion. Opt. Mater. 2018, 77, 258–263. [Google Scholar] [CrossRef]
  24. Hohenberg, P.; Kohn, W. Inhomogeneous electron gas. Phys. Rev. 1964, 136, B864–B871. [Google Scholar] [CrossRef]
  25. Kohn, W.; Sham, L.J. Self-consistent equations including exchange and correlation effects. Phys. Rev. 1965, 140, A1133–A1138. [Google Scholar] [CrossRef]
  26. Perdew, J.P.; Burke, K.; Ernzerhof, M. Generalized gradient approximation made simple. Phys. Rev. Lett. 1996, 77, 3865–3868. [Google Scholar] [CrossRef]
  27. Segall, M.D.; Lindan, P.J.D.; Probert, M.J.; Pickard, C.J.; Hasnip, P.J.; Clark, S.J.; Payne, M.C. First-principles simulation: Ideas, illustrations and the CASTEP code. J. Phys. Condens. Matter 2002, 14, 2717–2744. [Google Scholar] [CrossRef]
  28. Vanderbilt, D. Soft self-consistent pseudopotentials in a generalized eigenvalue formalism. Phys. Rev. B 1990, 41, 7892–7895. [Google Scholar] [CrossRef]
  29. Monkhorst, H.J.; Pack, J.D. Special points for Brillouin-zone integrations. Phys. Rev. B 1976, 13, 5188–5192. [Google Scholar] [CrossRef]
  30. Fischer, T.H.; Almlof, J. General methods for geometry and wave function optimization. J. Phys. Chem. 1992, 96, 9768–9774. [Google Scholar] [CrossRef]
  31. Chen, L.; Wu, C.; Du, P.; Feng, X.; Wu, P.; Cai, C. Electrolyzing synthesis of boron-doped graphene quantum dots for fluorescence determination of Fe3+ ions in water samples. Talanta 2017, 164, 100–109. [Google Scholar] [CrossRef]
  32. Huang, H.; Liao, L.; Xu, X.; Zou, M.; Liu, F.; Li, N. The electron-transfer based interaction between transition metal ions and photoluminescent graphene quantum dots (GQDs): A platform for metal ion sensing. Talanta 2013, 117, 152–157. [Google Scholar] [CrossRef] [PubMed]
  33. Zhou, X.; Zhao, G.; Tan, X.; Qian, X.; Zhang, T.; Gui, J.; Yang, L.; Xie, X. Nitrogen-doped carbon dots with high quantum yield for colorimetric and fluorometric detection of ferric ions and in a fluorescent ink. Microchim. Acta 2019, 186, 67. [Google Scholar] [CrossRef] [PubMed]
  34. Wang, W.; Peng, J.; Li, F.; Su, B.; Chen, X.; Chen, X. Phosphorus and chlorine co-doped carbon dots with strong photoluminescence as a fluorescent probe for ferric ions. Microchim. Acta 2019, 186, 32. [Google Scholar] [CrossRef]
  35. Sun, Y.; Wang, X.; Wang, C.; Tong, D.; Wu, Q.; Jiang, K.; Jiang, Y.; Wang, C.; Yang, M. Red emitting and highly stable carbon dots with dual response to pH values and ferric ions. Microchim. Acta 2018, 185, 83. [Google Scholar] [CrossRef]
  36. Wang, X.; Yang, X.; Wang, N.; Lv, J.; Wang, H.; Choi, M.M.F.; Bian, W. Graphitic carbon nitride quantum dots as an “off-on” fluorescent switch for determination of mercury(II) and sulfide. Microchim. Acta 2018, 185, 471. [Google Scholar] [CrossRef]
  37. Mondal, T.K.; Dinda, D.; Saha, S.K. Nitrogen, sulphur co-doped graphene quantum dot: An excellent sensor for nitroexplosives. Sens. Actuators B Chem. 2018, 257, 586–593. [Google Scholar] [CrossRef]
  38. Travlou, N.A.; Secor, J.; Bandosz, T.J. Highly luminescent S-doped carbon dots for the selective detection of ammonia. Carbon 2017, 114, 544–556. [Google Scholar] [CrossRef]
  39. Dutta Chowdhury, A.; Doong, R. Highly sensitive and selective detection of nanomolar ferric ions using dopamine functionalized graphene quantum dots. ACS Appl. Mater. Interfaces 2016, 8, 21002–21010. [Google Scholar] [CrossRef]
  40. Qu, D.; Zheng, M.; Du, P.; Zhou, Y.; Zhang, L.; Li, D.; Tan, H.; Zhao, Z.; Xie, Z.; Sun, Z. Highly luminescent S, N co-doped graphene quantum dots with broad visible absorption bands for visible light photocatalysts. Nanoscale 2013, 5, 12272. [Google Scholar] [CrossRef]
  41. Zhang, B.-X.; Gao, H.; Li, X.-L. Synthesis and optical properties of nitrogen and sulfur co-doped graphene quantum dots. New J. Chem. 2014, 38, 4615–4621. [Google Scholar] [CrossRef]
  42. Li, S.; Li, Y.; Cao, J.; Zhu, J.; Fan, L.; Li, X. Sulfur-doped graphene quantum dots as a novel fluorescent probe for highly selective and sensitive detection of Fe3+. Anal. Chem. 2014, 86, 10201–10207. [Google Scholar] [CrossRef]
  43. Sangam, S.; Gupta, A.; Shakeel, A.; Bhattacharya, R.; Sharma, A.K.; Suhag, D.; Chakrabarti, S.; Garg, S.K.; Chattopadhyay, S.; Basu, B.; et al. Sustainable synthesis of single crystalline sulphur-doped graphene quantum dots for bioimaging and beyond. Green Chem. 2018, 20, 4245–4259. [Google Scholar] [CrossRef]
  44. Xia, C.; Hai, X.; Chen, X.-W.; Wang, J.-H. Simultaneously fabrication of free and solidified N, S-doped graphene quantum dots via a facile solvent-free synthesis route for fluorescent detection. Talanta 2017, 168, 269–278. [Google Scholar] [CrossRef]
  45. Zhang, H.; Chen, Y.; Liang, M.; Xu, L.; Qi, S.; Chen, H.; Chen, X. Solid-phase synthesis of highly fluorescent nitrogen-doped carbon dots for sensitive and selective probing ferric ions in living cells. Anal. Chem. 2014, 86, 9846–9852. [Google Scholar] [CrossRef]
  46. Wang, G.; Guo, Q.; Chen, D.; Liu, Z.; Zheng, X.; Xu, A.; Yang, S.; Ding, G. Facile and highly effective synthesis of controllable lattice sulfur-doped graphene quantum dots via hydrothermal treatment of durian. ACS Appl. Mater. Interfaces 2018, 10, 5750–5759. [Google Scholar] [CrossRef]
  47. Zhu, X.; Zhang, Z.; Xue, Z.; Huang, C.; Shan, Y.; Liu, C.; Qin, X.; Yang, W.; Chen, X.; Wang, T. Understanding the selective detection of Fe3+ based on graphene quantum dots as fluorescent probes: The Ksp of a metal hydroxide-assisted mechanism. Anal. Chem. 2017, 89, 12054–12058. [Google Scholar] [CrossRef]
  48. Anh, N.T.N.; Chowdhury, A.D.; Doong, R. Highly sensitive and selective detection of mercury ions using N, S-codoped graphene quantum dots and its paper strip based sensing application in wastewater. Sens. Actuators B Chem. 2017, 252, 1169–1178. [Google Scholar] [CrossRef]
  49. Amini, M.H.; Faridbod, F.; Ganjali, M.R.; Norouzi, P. Functionalized graphene quantum dots as a fluorescent “off–on” nanosensor for detection of mercury and ethyl xanthate. Res. Chem. Intermed. 2017, 43, 7457–7470. [Google Scholar] [CrossRef]
  50. Wang, R.; Wang, X.; Sun, Y. One-step synthesis of self-doped carbon dots with highly photoluminescence as multifunctional biosensors for detection of iron ions and pH. Sens. Actuators B Chem. 2017, 241, 73–79. [Google Scholar] [CrossRef]
  51. Gong, X.; Lu, W.; Liu, Y.; Li, Z.; Shuang, S.; Dong, C.; Choi, M.M.F. Low temperature synthesis of phosphorous and nitrogen co-doped yellow fluorescent carbon dots for sensing and bioimaging. J. Mater. Chem. B 2015, 3, 6813–6819. [Google Scholar] [CrossRef]
  52. Standards for Drinking Water Quality. China National Standers. (No. GB5749-2006). Available online: http://www.gb688.cn/bzgk/gb/newGbInfo?hcno=73D81F4F3615DDB2C5B1DD6BFC9DEC86 (accessed on 8 May 2019).
  53. U.S. Environmental Protection Agency (EPA). Ground Water and Drinking Water; U.S. Environmental Protection Agency (EPA): Washington, DC, USA, 2017.
  54. Qi, P.; Zhang, D.; Wan, Y. Morphology-tunable polydopamine nanoparticles and their application in Fe3+ detection. Talanta 2017, 170, 173–179. [Google Scholar] [CrossRef] [PubMed]
  55. Zhao, L.; Xin, X.; Ding, P.; Song, A.; Xie, Z.; Shen, J.; Xu, G. Fluorescent oligomer as a chemosensor for the label-free detection of Fe3+ and dopamine with selectivity and sensitivity. Anal. Chim. Acta 2016, 926, 99–106. [Google Scholar] [CrossRef]
  56. Mei, Q.; Jiang, C.; Guan, G.; Zhang, K.; Liu, B.; Liu, R.; Zhang, Z. Fluorescent graphene oxide logic gates for discrimination of iron (3+) and iron (2+) in living cells by imaging. Chem. Commun. 2012, 48, 7468. [Google Scholar] [CrossRef]
  57. Cui, X.; Wang, Y.; Liu, J.; Yang, Q.; Zhang, B.; Gao, Y.; Wang, Y.; Lu, G. Dual functional N- and S-co-doped carbon dots as the sensor for temperature and Fe3+ ions. Sens. Actuators B Chem. 2017, 242, 1272–1280. [Google Scholar] [CrossRef]
  58. Zhang, W.; Gan, J. Synthesis of blue-photoluminescent graphene quantum dots/polystyrenic anion-exchange resin for Fe(III) detection. Appl. Surf. Sci. 2016, 372, 145–151. [Google Scholar] [CrossRef]
  59. Hu, J.; Hu, Z.; Chen, Z.; Gao, H.-W.; Uvdal, K. A logic gate-based fluorogenic probe for Hg2+ detection and its applications in cellular imaging. Anal. Chim. Acta 2016, 919, 85–93. [Google Scholar] [CrossRef] [PubMed]
  60. Tang, Y.; Ding, Y.; Wu, T.; Lv, L.; Yan, Z. A turn-on fluorescent probe for Hg2+ detection by using gold nanoparticle-based hybrid microgels. Sens. Actuators B Chem. 2016, 228, 767–773. [Google Scholar] [CrossRef]
  61. Zhang, B.; Wei, C. Highly sensitive and selective fluorescence detection of Hg2+ based on turn-on aptamer DNA silver nanoclusters. RSC Adv. 2017, 7, 56289–56295. [Google Scholar] [CrossRef]
  62. Zhou, L.; Lin, Y.; Huang, Z.; Ren, J.; Qu, X. Carbon nanodots as fluorescence probes for rapid, sensitive, and label-free detection of Hg2+ and biothiols in complex matrices. Chem. Commun. 2012, 48, 1147–1149. [Google Scholar] [CrossRef]
  63. Zhang, Y.; Cui, P.; Zhang, F.; Feng, X.; Wang, Y.; Yang, Y.; Liu, X. Fluorescent probes for “off–on” highly sensitive detection of Hg2+ and L-cysteine based on nitrogen-doped carbon dots. Talanta 2016, 152, 288–300. [Google Scholar] [CrossRef] [PubMed]
  64. Li, Z.; Wang, Y.; Ni, Y.; Kokot, S. A rapid and label-free dual detection of Hg(II) and cysteine with the use of fluorescence switching of graphene quantum dots. Sens. Actuators B Chem. 2015, 207, 490–497. [Google Scholar] [CrossRef]
  65. Van Tam, T.; Hong, S.H.; Choi, W.M. Facile synthesis of cysteine–functionalized graphene quantum dots for a fluorescence probe for mercury ions. RSC Adv. 2015, 5, 97598–97603. [Google Scholar] [CrossRef]
  66. Liu, Z.; Gong, Y.; Fan, Z. Cysteine detection using a high-fluorescence sensor based on a nitrogen-doped graphene quantum dot–mercury(II) system. J. Lumin. 2016, 175, 129–134. [Google Scholar] [CrossRef]
Figure 1. The top view of density functional theory (DFT) simulation modes (a) N, S co-doped graphene quantum dots (N, S-GQDs), (b) M cations (M = Fe3+, Hg2+) adsorb on the surface of N, S-GQDs.
Nanomaterials 09 00738 g001
Figure 2. Photoluminescence decay spectra of N, S-GQDs (a) without cations and the addition of 10 μM Fe3+ (b) and 10 μM Hg2+ (c), respectively. (d) UV-vis absorption spectra (10 μM Fe3+ and Hg2+) and fluorescence spectra of N, S-GQDs in the presence and absence of 20 μM Fe3+ and 10 μM Hg2+.
Nanomaterials 09 00738 g002
Figure 3. Schematic diagram of N, S-GQDs as a fluorescence probe for the detection of Fe3+ or Hg2+ ions.
Nanomaterials 09 00738 g003
Figure 4. (a) TEM image of N, S-GQDs and HRTEM image are inserted as insets; (b) the corresponding particle size distribution (n = 40); (c,d) atomic force microscope (AFM) image and particle height distribution of as-synthesized N, S-GQDs.
Nanomaterials 09 00738 g004
Figure 5. (a) The X-ray photoelectron spectroscopy (XPS) survey spectrum of N, S-GQDs, (be) high resolution spectra of C 1s, N 1s, S 2p, and O 1s of as-synthesized N, S-GQDs, respectively.
Nanomaterials 09 00738 g005
Figure 6. FTIR spectra of as-synthesized N, S-GQDs.
Nanomaterials 09 00738 g006
Figure 7. (a) UV-vis absorption, fluorescence excitation, and fluorescence emission spectra of N, S-GQDs; (b) the excitation dependent photoluminescence (PL) emission spectra of N, S-GQDs.
Nanomaterials 09 00738 g007
Figure 8. (a) The fluorescence quenching ratio of as-synthesized N, S-GQDs toward various cations; (b) the interfering test of N, S-GQDs; (c) the fluorescence spectra of N, S-GQDs before and after the addition of 50 μM Fe3+, 50 μM Hg2+, 100 μM AA, and 50 μM Cys, respectively.
Nanomaterials 09 00738 g008
Figure 9. The electron density difference of N, S-GQDs after the adsorption of Fe3+ (a,b) and Hg2+ (c,d), respectively.
Nanomaterials 09 00738 g009
Figure 10. The dependence of fluorescence intensity on different pH of N, S-GQDs before and after the addition of 1 μM Hg2+ or 1 μM Fe3+, respectively.
Nanomaterials 09 00738 g010
Figure 11. (a) Fluorescence response of N, S-GQDs by adding various concentrations of Fe3+ ranging from 0 to 100 μM, (b) the relationship between fluorescence ratio and Fe3+ concentration, (c,d) the dynamic response range for Fe3+ detection in the ranges 1–90 nM and 0.1–30 μM, respectively.
Nanomaterials 09 00738 g011
Figure 12. (a) Fluorescence response of N, S-GQDs by adding various concentrations of Hg2+ ranging from 0 to 50 μM, (b) the relationship between fluorescence ratio and Hg2+ concentration, (c,d) the dynamic response range for Hg2+ detection in the ranges 1–30 nM and 100–1000 nM, respectively.
Nanomaterials 09 00738 g012aNanomaterials 09 00738 g012b
Table 1. The atomic populations of pure graphene and N, S-GQDs.
MaterialsAtomic Populations (Mulliken)Bond Populationd (Å)
spTotalCharge (e)
Pure grapheneC1.052.954.000C-C1.021.42
N, S-GQDsC11.132.863.990.01C1-O0.641.37
C21.072.994.07−0.07C1-S0.481.78
C31.272.824.09−0.09C2-S0.651.71
N1.393.845.23−0.23C2-N0.851.39
O1.764.616.37−0.37C3-N0.921.37
S1.673.565.240.76C3-O−0.062.40
Table 2. Comparison of different fluorescence sensing systems for Fe3+ detection. LOD: limit of detection.
ProbeDynamic RangeLODReferences
Polydopamine dots10–1000 μM4.6 μM[54]
Tyloxapol0–100 μM2.2 μM[55]
Graphene oxide5–50 μM0.64 μM[56]
Dopamine-functionalized GQDs0.02–20 μM7.6 nM[39]
Rhodamine-functionalized GQDs0–1.0 μM0.02 μM[1]
N, S-CQDs1.5–200 μM1.02 nM[57]
GQDs/PS-AER1–7 μM0.65 μM[58]
GQDs10–200 μM10 μM[3]
GQDs0–60 μM0.45 μM[47]
N, S-GQDs1–90 nM2.88 nMThis work
0.1–30 μM55.49 nMThis work
a GQDs: graphene quantum dots; N, S-CQDs: N and S co-doped carbon quantum dots; GQDs/PS-AER: graphene quantum dots/polystyrenic anion-exchange resin.
Table 3. Comparison of different fluorescence sensing systems for Hg2+ detection.
ProbeDynamic RangeLODReferences
Rhodamine derivative4–15 μM60.7 nM[59]
Gold nanoparticle0.16–1.6 μM31 nM[60]
DNA-Ag NCs2–18 nM0.25 nM[61]
CDs0–3 μM4.2 nM[62]
N-CQDs0–10 μM1.48 nM[63]
GQDs1–50 nM0.43 nM[64]
Cysteine-functionalized GQDs0–10 μM20 nM[65]
N-GQDs0.05–30 μM1.3 nM[66]
N, S-GQDs1–50 nM0.14 nM[48]
N, S-GQDs1–30 nM0.27 nMThis work
100–1000 nM36.85 nMThis work
b DNA-Ag NCs: aptamer DNA silver nanoclusters; CDs: carbon nanodots.

