Abstract
The as-prepared co-doped N/Ag carbon dot (CDNAg) has strong catalysis of H2O2 oxidation of 3,3′-dimethylbiphenyl-4,4′-diamine (DBD). It forms an oxidation product (DBDox) with surface-enhanced Raman scattering (SERS) activity at 1605 cm−1 in the silver nanosol substrate, and a CDNAg catalytic amplification with SERS analytical platform can be structured based on aptamer (Apt) with the DBD oxidizing reaction. For example, the aptamer (Apt) of acetamiprid (ACT) can be adsorbed on the surface of CDNAg, resulting in inhibited catalytic activity, the reduced generation of DBDox, and a weakened SERS intensity. When the target molecule ACT was added, it formed a stable Apt-ACT complex and free CDNAg that restored catalytic activity and linearly enhanced the SERS signal. Based on this, we proposed a new quantitative SERS analysis method for the determination of 0.01–1.5 μg ACT with a detection limit of 0.006 μg/L.
1. Introduction
Exploring highly selective, sensitive, simple, and rapid contaminant analysis methods is one of the vital development directions of environmental analytical chemistry. Highly selective and sensitive assays rely on highly selective analytical reactions and highly sensitive detection techniques. Nucleic acid aptamers (Apt) are oligonucleotide fragments that have specific recognition of and high affinity with the target. It has applications in genomics, food safety, medical diagnosis, and biomedicine [1,2,3,4,5,6,7,8,9,10,11,12,13]. Surface-enhanced Raman scattering (SERS) is a sensitive molecular spectral technique with real-time in-situ detection; less sample is needed, there is little damage to the sample, and it is simple and fast [5,6,7,8,9,10]. Although many SERS studies have been reported, most of them were qualitative due to poor reproducibility. Reproducibility not only affects qualitative analysis but is a principle of quantitative analysis, which limits its development. To overcome the shortage, some reproducible preparations of clean and highly Ag and Au SERS active substrates have been reported in Reference [14]. Bassi et al. [15] prepared recyclable SERS active glass chips. The gold nanostars were grafted on functionalized glasses by means of electrostatic interactions and then they were coated with a silica layer of controllable thickness. The SERS activity was examined in terms of reproducibility using rhodamine 6G molecular probes. As an analytical technique, the highly sensitive and selective SERS quantitative analytical method is important. It depends on reproducible SERS substrates and highly selective biochemical reactions such as Apt reactions. Combining the high selectivity of the Apt reaction with the high-sensitivity of SERS detection to develop a SERS quantitative analytical method has achieved favorable results. Xu et al. [3] established a simple, selective and sensitive SERS aptasensor to detect 102 to 107 cfu/mL Salmonella typhimurium in milk samples, based on gold nanodimers assembled with a Raman signal and capture probe via hybridization of the complementary ssDNAs. Song et al. [4] proposed an approach based on SERS and As(III)-Apt for the detection of 0.5 to 10 ppb As(III) with a detection limit of 0.1 ppb. Wen et al. [11] described Apt modified nanosilver to obtain a nanosilver-Apt SERS probe for the determination of 6.3–403.6 μg/L melamine. Ye et al. [12] introduced nanogold modified by Apt to be used in the preparation of nanogold-Apt probes for 0.29–23.0 ng/mL As3+, with a detection limit of 0.1 ng/mL. Dong et al. [13] developed a nanosenor to detect 1.0 pg/mL–10 ng/mL melamine in milk using an aptamer-modified SERS nanosensor and oligonucleotide chip. However, there are few reports on the Apt-mediated CDNAg nanocatalytic amplification of SERS probes for acetamiprid (ACT).
As a new type of fluorescent nanomaterial, carbon dots (CDs) have attracted great attention, due to their excellent optical properties, satisfactory chemical stability, low toxicity, exceptional biocompatibility and surface functional adjustability. They have become the most popular carbon nanomaterials after fullerenes, carbon nanotubes and graphene, and have been studied and applied in bio-imaging and fluorescence sensing [16]. The preparation of CDs has been one of the hotspots in nanomaterials and analytical chemistry. At present, some synthesis methods for CDs have been established, such as arc discharge, laser etching, chemical oxidation, template methods, hydrothermal synthesis and microwave methods [17]. The microwave method has attracted much attention because of its fast preparation speed and harmless water as a solvent. Xiao et al. [18] synthesized nitrogen-doped CDs with strong photoluminescence by a one-step microwave irradiation of citric acid and ethylenediamine for 15 min, used for cell imaging. Water-soluble phosphorus-containing CDs with strong green fluorescence can be synthesized by one-step microwave irradiation using ethylenediamine as the nitrogen-doping agent and phosphorus-rich phytic acid as the carbon source [19]. The main analytical application of CDs is fluorescence analysis. Most of the methods are based on the redox reaction between the carbon point fluorescence probe and the analyte, a coordination reaction leading to fluorescence quenching or fluorescence enhancement [20]. Ahmed et al. [21] used ethylene glycol bis-(2-aminoethyl ether)-N,N′,N′,N′-tetraacetic acid and tri (hydroxymethyl) ethylenediamine as precursors to prepare CDs, by hydrothermal synthesis, for a long time. Based on the fluorescence quenched by 4-nitrophenol, a 28 nM 4-nitrophenol can be detected. The N-doped carbon dots were prepared rapidly by microwave, and used as the nanoprobe and nanocatalyst for the fluorescence determination of ultratrace isocarbophos with a label-free aptamer [22]. Luo et al. [23] used fluorescent CD-modified single-stranded nucleic acids and Apt-modified graphene oxide to undergo a chain substitution reaction, and 10–800 nM adenosine triphosphate were detected by fluorescence. Shi et al. [24] modified complementary nucleic acids with CDs as fluorescent labeling indicators. The Apts were fixed on the surface of Fe3O4 nanoparticles, and a fluorescence detection of 0.25–50 ng/mL beta-lactoglobulin was performed with a detection limit of 37 pg/mL.
ACT is a new high-efficiency broad-spectrum nicotine chloride insecticide. It can act on the synaptic nicotine acetylcholine receptors of the nervous system of homoptera, lepidoptera and coleoptera pests on vegetables, fruit trees, rice and tea. It interferes with the stimulation of and transmission in the nervous system of pests, blocks the nervous system pathways, and causes paralysis, thus achieving the insecticidal effect [25]. In natural environment, ACT is difficult to degrade under strong acidic and neutral conditions. It has been reported that low concentrations of ACT can impair long-term memory and sensitivity to stimulation in bees [26]. In addition, some studies have shown that ACT is also very harmful to the human body; it can induce DNA damage [27]. Therefore, it is necessary to strictly monitor the residues of ACT pesticides. At present, the main methods for detecting ACT are gas chromatography, high performance liquid chromatography, chromatography-mass spectrometry, enzyme-linked immunosorbent assay and electrochemical methods [28,29,30,31,32,33,34,35,36,37]. However, such methods are expensive, complex to operate or pretreat, have low sensitivity and are time-consuming. Therefore, it is necessary to develop a rapid, sensitive, and selective method for the determination of trace ACT pesticide residues. Jin et al. [33] reported a sensor for the detection of ACT in vegetables based on a photocatalytic degradation compound. In this paper, the Apt reaction [25] was coupled with the SERS catalytic reaction of 3,3′-dimethylbiphenyl-4,4′-diamine (DBD) oxidized product (DBDox), and a novel, rapid and sensitive SERS method for the detection of ACT was established.
2. Experimental Section
2.1. Instruments
A model of DXR smart Raman spectrometer (Thermo, Waltham, MA, USA), with a laser wavelength of 633 nm, power of 3.5 mW, slit of 50 μm and acquisition time of 5 s, a model of a 3K-15 high-speed refrigerated centrifuge (Sigma Co., Darmstadt, Germany), a model of a 79-1 magnetic stirrer with heating (Zhongda Instrumental Plant, Nanjing, China), a model of an HH-S2 electric hot water bath (Earth Automation Instrument Plant, Jintan, China), a model of a WX-6000 microwave digestion instrument (Preekem Scientific Instruments Co., Ltd., Shanghai, China), a model of a two spectrum Fourier transform infrared spectrometer and its supporting tableting device (Bojin Elmer Co., Ltd., Shanghai, China), a model of an FD-1C-50 vacuum drying freezer (Hangzhou Jutong Electronics Co., Ltd., Hangzhou, China), and a model of a S-4800 field emission scanning electron microscope (Hitachi High-Technologies Corporation, Japan/Oxford company, Oxford, UK) were used.
2.2. Reagents
The aptamer sequence (Apt): 5′-CTGAC ACCAT ATTAT GAAGA -3′ (Shanghai Sangon Biotech Co., Ltd., Shanghai, China), acetamiprid (ACT) (98.5% purity, Shanghai Shenggong Biotechnology Co., Ltd.); imidacloprid (purity 98.5%, Shanghai Aladdin Biochemical Technology Co., Ltd., Shanghai, China); atrazine (purity 98%, Shanghai Aladdin Biochemical Technology Co., Ltd.); carbendazim (purity 99%, Shanghai Aladdin Biochemical Technology Co., Ltd.); and chlorpyrifos (purity 99%, Shanghai Aladdin Biochemical Technology Co., Ltd.) were used. A 10 mmol/L AgNO3 solution, 0.1 mol/L sodium citrate solution, 30% H2O2 solution, 0.1 mol/L NaBH4 solution, 0.2 mol/L pH 3.6 HAc-NaAc buffer solution, 1.0 mol/L HCl solution, and a 0.25 mol/L NaOH solution were prepared. A 30 mg/L ACT standard solution was prepared as follows: In a breaker, 7.5 mg ACT were dissolved in 20 mL anhydrous ethanol. It was transferred into a 250 mL volumetric flask and diluted to the mark with water. A 0.5 mmol/L DBD solution was prepared as follows: First, 11 mg DBD were dissolved and transferred to a 100 mL volumetric flask. This was diluted to the mark with the volume ratio of 6:4 ethanol:water. The nanosilver sol (AgNPs) was prepared as follows [38]: Water, 44 mL, was added to a conical flask. Then, 2 mL 10 mM AgNO3, 2.0 mL 100 mM trisodium citrate, 600 μL 30% H2O2, and 600 μL 0.1 M NaBH4 were added into the water successively. After the color turned blue, with rapidly stirring, the mixture was immediately shifted to the air light wave stove. After irradiation for 10 min at 250 °C, the color went from blue to orange-red. The mixture was cooled naturally to room temperature. It was then diluted to 50 mL. The concentration of the nanosilver sol was 0.4 mM Ag, calculated by AgNO3 concentration. All reagents were of analytical grade and the water was double distilled.
Preparation of CDNAg was as follows: one gram of glucose, 0.8 g of urea and 0, 200, 500, and 700 μL 0.01 mol/L AgNO3 were sonicated in 30 mL water. Then, it was transferred to a high-pressure reaction vessel with a polytetrafluoroethylene substrate, sealed and irradiated in a microwave oven for 10 min with a power of 640 W. After the irradiation, it was cooled to room temperature to obtain a pale yellow solution, which was calculated by adding the total amount of carbon to obtain a solution of C = 13 mg/mL CDN, CDNAg1, CDNAg2 and CDNAg3, respectively.
2.3. Procedure
A suitable amount of 1.0 μg/L ACT standard solution, 25 μL of 1.55 μmol/L Apt, and 400 μL 1.7 mg/L CD, 60 μL 2 mmol/L H2O2, 75μL 0.5 mmol/L DBD, 100 μL 1 mmol/L pH 3.6 HAc-NaAc solution were added to a 5 mL test tube and then diluted to 1 mL with water and mixed well. The tube was placed in a bath at 50 °C for 20 min. The reaction was stopped by tap water cooling. A 400 μL 0.4 mmol/L AgNPs solution was added and diluted to 1.5 mL with water. The mixture was transferred to a quartz cell and its SERS spectra were recorded. The SERS peak intensity I at 1605 cm−1 was measured, the blank (I0) without ACT was recorded, and the ΔI = I − I0 was calculated.
3. Results and Discussions
3.1. Analytical Principle
In the pH 3.6 HAc-NaAc buffer solution, the CD had a strong catalytic effect on the reaction of H2O2-DBD to form DBD oxidation products (DBDox). When the Apt was present, it adsorbed on the CD surface, resulting in a weakening of the catalytic action of CD. After the addition of the target molecule ACT, it specifically bound to the Apt and, with the CD released, the catalytic activity was restored. With the increase of ACT, there was more desorption of CD, a faster catalyzed H2O2-DBD reaction, and a greater the concentration of DBDox formed. After the addition of the AgNP nanosol substrate, the SERS signal enhanced linearly (Figure 1). Coupling this catalytic amplification reaction with the Apt reaction, a new SERS quantitative analytical method could be established for detecting ultratrace ACT.
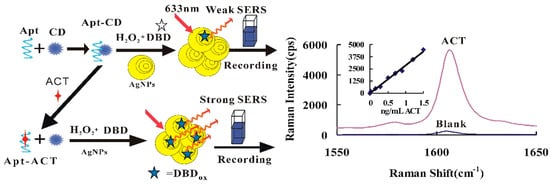
Figure 1.
Carbon dot (CD) catalytic amplification surface-enhanced Raman scattering (SERS) analytical platform based on aptamer with 3,3′-dimethylbiphenyl-4,4′-diamine (DBD) oxidizing reaction.
3.2. SERS Spectra
In a pH 3.6 HAc-NaAc buffer solution, the H2O2-DBD system was difficult to react in the 60 °C water bath. In the presence of nano-catalysts such as CDN and CDNAg1–3, the oxidation of DBD by H2O2 was catalyzed and the oxidation product of DBDox had the strongest SERS activity for the CDNAg2 catalytic system. The SERS substrates, such as AgNP, gold nanoparticles and CDNAg sols, were examined. The AgNP was the most sensitive and was chosen for use. After the addition of AgNP sol as a SERS substrate, the CDNAg2 catalytic system exhibited a peak at 1189 cm−1, ascribing to the stretching vibration of C–N, at 1335 cm−1, ascribing to the bending vibration of C–H, and at 1402 cm−1, owing to the bending vibration of C=C. The strongest peak was at 1605 cm−1, ascribing to the tensile vibration of C=N and C=C–C=C (Figure 2a). When the Apt was added it was coated on the surface of the carbon dot, thereby inhibiting the catalytic activity of the CD, and the SERS signal attenuated (Figure 2b). With the addition of ACT, the combination of ACT and Apt specifically released CDs, which restored its catalytic activity. With the increase of the ACT concentration, the release of CDs increased. The SERS peak at 1605 cm−1 increased linearly, due to more DBDox products being generated (Figure 2c), and was chosen for use.
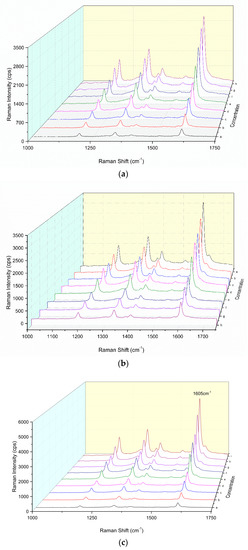
Figure 2.
SERS spectra of a CDNAg2-H2O2-DBD-AgNPs system. (a) 0.13 mmol/L H2O2 + 33 μmol/L DBD + 0.11 mmol/L AgNPs, a–h were 0, 0.011, 0.057, 0.113, 0.17, 0.227, 0.34, and 0.45 mg/L CDNAg2, respectively. (b) 0.45 mg/L CDNAg2 + 0.13 mmol/L H2O2 + 33 μmol/L DBD + 0.11 mmol/L AgNPs, the a–h were 0, 3.1, 7.2, 15.5, 20.7, 25.8, 31, and 36.2 nmol/L aptamer (Apt). (c) 25.8 nmol/L Apt + 0.45 mg/L CDNAg2 + 0.08 mmol/L H2O2 + 0.025 mmol/L DBD + 0.11 mmol/L AgNPs, a–i were 0, 0.03, 0.15, 0.3, 0.5, 0.7, 0.9, 1.2, and 1.5 μg/L acetamiprid (ACT), respectively.
3.3. Nanocatalysis and Aptamer Inhibition
Under the selected conditions H2O2 and DBD systems were difficult to carry out. As the CD catalyst concentration increased, the catalytic ability enhanced, the DBDox increased, and the SERS signal increased linearly in the AgNP nanosol substrate. When Apt was added, the CDs were entrapped by the Apt, resulting in inhibition of the CDs catalysis, and the SERS peak intensity decreased linearly (Table 1). In this article, the slope of the linear relationship was used to measure the catalysis and inhibition with simplicity and rapidity. The CDNAg2 was strongest and the strongest inhibition was Apt-CDNAg2.

Table 1.
Nanocatalysis and Apt inhibition.
In the experiment, citric acid was used as the carbon source, urea was involved in the reaction, and a nitrogen source and AgNO3 as the Ag source were provided to produce a nitrogen/silver co-doped CD. The CD was composed of various molecules that contain amide chains and many N-Ag atoms on the surface. Due to the fact that N and Ag atoms are electron donating atoms, the CD with a proper amount of nitrogen and silver atoms containing a lone pair of electrons could enhance the π bond conjugation. The CD was a catalyst to speed up the redox electron-transfer of DBD and H2O2 to form DBDox with SERS activity. Nitrogen/silver-doped CDs showed high catalysis due to their greater number of surface electrons. This accelerated the redox electron transfer, which is a new type of CD catalyst with promising applications for the amplification of analytical signal.
3.4. Electron Microscopy (EM) and Infrared Spectra
According to the experimental method, 1.5 mL of the reaction solution were centrifuged in a 2 mL centrifuge tube for 10 min (70 × 100 rpm), the supernatant was discarded, and the volume was adjusted to 1.5 mL with water and sonicated for 15 min. We repeated the above centrifugation step twice and added 1.5 mL water for scanning electron microscopy (SEM) and transmission electron microscopy (TEM). The spherical AgNPs were observed by SEM and TEM to have an average size of 45 nm (Figure 3a) and 50 nm (Figure 3b), and exhibited a surface plasmon resonance absorption peak at 400 nm. For the Apt-ACT-CDNAg2-H2O2-DBD-AgNPs system, when there was no ACT in the system, Apt encapsulated the carbon dots, inhibiting the CDN-catalyzed H2O2-DBD reaction and forming fewer DBDox probes, which caused weak AgNPs aggregations with an average particle size of 50 nm (Figure 3b). With the increase of ACT concentration, CDN was gradually released and the catalytic effect was enhanced to form more DBDox probes, which caused strong AgNPs aggregations with an average particle size of 60 nm (Figure 3c). In theory, the sizes of the AgNPs, the blank, and the analytical systems are the same. The size difference was ascribed to the different conditions of the three systems. The prepared CDN were diluted and dropped onto a silicon wafer for transmission electron microscopy scanning. The average particle diameter was about 20 nm (Figure 3d). The energy spectra (Figure 3e) indicated that there were Ag atoms doped in the CD because the peak at 3.0 keV was ascribed to Ag. For the CD infrared spectra (Figure 3f) eight peaks were observed, at 3908, 3785, 3430, and 3202 cm−1 ascribing to O–H stretching vibrations, 1716 cm−1 ascribing to C=O stretching vibration, 1666 cm−1 ascribing to C=C conjugate structure stretching vibrations, 1384 cm−1 ascribing to an N=N stretching motion, 1077 cm−1 ascribing to C–H in-plane bending vibrations, and at 642 cm−1 ascribing to N–C=O bending vibrations.
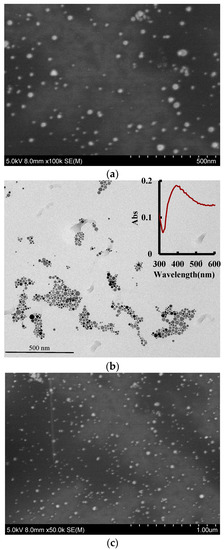
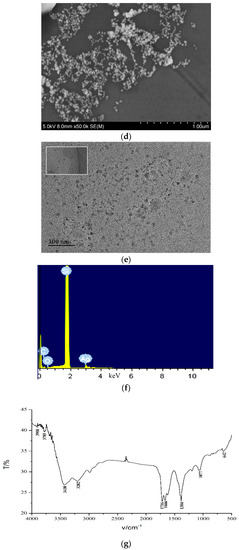
Figure 3.
Scanning electron microscopy (SEM), transmission electron microscopy (TEM), energy spectra and infrared spectra. (a) SEM image of AgNPs; (b) TEM image of AgNPs (the inserted Figure was the surface plasmon resonance absorption spectrum of AgNPs); (c) 0.026 μmol/L Apt + 6.67 μg/L CDNAg2 + 0.08 mmol/L H2O2 + 0.025 mmol/L DBD + pH 3.6 HAc-NaAc + 0.11 mmol/L AgNPs; (d) SEM of c + 0.5 μg/L ACT; (e) TEM of CDNAg2; (f) energy spectra of CDNAg2; and (g) infrared spectra (IR) image of CDNAg2.
3.5. Optimization of the Analytical Conditions
The effect of the concentration of H2O2, DBD, CDNAg2, pH, Apt and AgNPs, the reaction temperature and the time on the SERS signal of the system were investigated, respectively (Figure 4). The SERS signal was the strongest when 0.08 mmol/L H2O2, 0.025 mmol/L DBD, 6.67 μg/L CDNAg2, pH 3.6 HAc-NaAc buffer solution, 0.026 μmol/L Apt and 0.11 mmol/L AgNPs solution was added. Thus, those concentrations were chosen for use, respectively. When the reaction temperature was 50 °C for 20 min, the SERS was the strongest, so these conditions were selected.
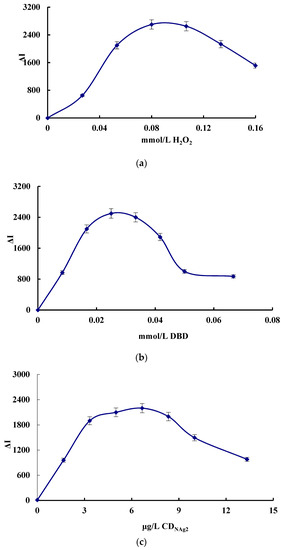
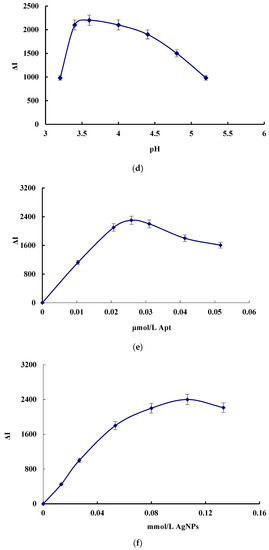
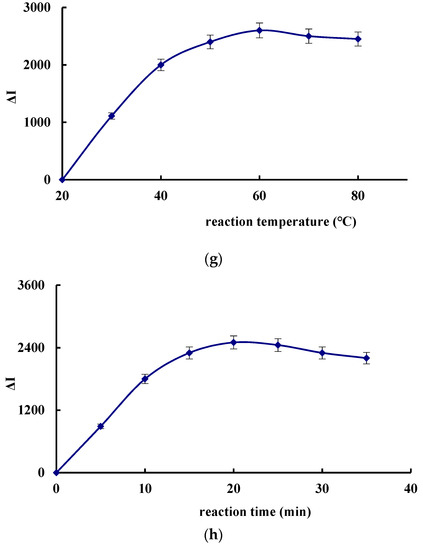
Figure 4.
Effect of reagent concentration, reaction temperature and time on ΔI. (a) H2O2, (b) DBD, (c) CDNAg2, (d) Apt, (e) AgNPs, (f) pH, (g) reaction temperature, and (h) reaction time.
3.6. Influence of Interfering Ions
The interference of coexisting ions (CES) on the Apt-ACT-CDN-H2O2-DBD-AgNPs SERS system was determined by 0.1 μg/L ACT. The results showed that 1000 times Zn2+, Ca2+, Ni2+, Mn2+, Co2+, NH4Cl and CO32−, 500 times Ba2+, Mg2+, K+, HCO3− and NO2−, 250 times Fe3+, Bi3+, Cu2+, Pb2+, Al3+ and Hg2+, 250 times imidacloprid, chlorpyrifos and atrazine, 100 times Cr6+, Fe2+, and carbendazim had no interference on the determination of ACT (Table 2). Therefore, the SERS method had acceptable selectivity.
Table 2.
Effect of coexisting ions (CES).
3.7. Working Curve
Under the selected conditions, the relationship between the ACT concentration (C) and its corresponding ΔI was obtained (Figure 5, Table 3). In the four systems, the slope of the CDNAg2 system was the largest due to CDNAg2 having the strongest catalysis. Therefore, the system was chosen for the assay of ACT in real samples. This SERS method is simpler and more sensitive than the reported spectral method for determining ACT [28,29,30,31,32,33,34,35,36,37] (Table 4).
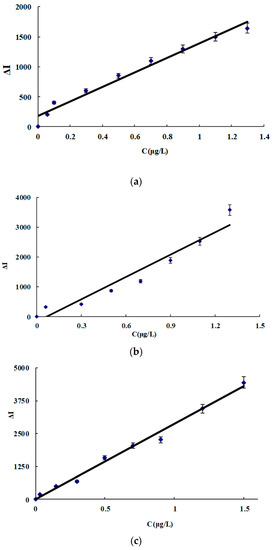
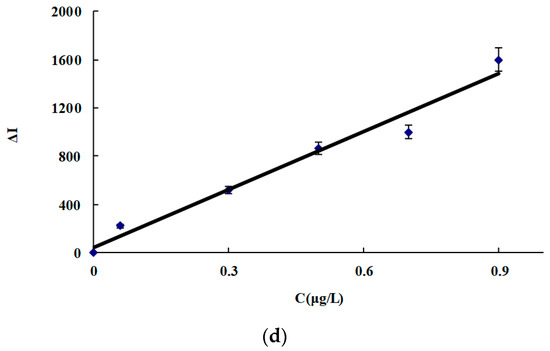
Figure 5.
Working curve for ACT. (a) CDN system, (b) CDNAg1 system, (c) CDNAg2 system, and (d) CDNAg3 system.
Table 3.
Analytical characteristics of the carbon dot (CD) catalytic amplification surface-enhanced Raman scattering (SERS) assay for acetamiprid (ACT).
Table 4.
Comparison of some reported molecular spectral methods for ACT.
3.8. Sample Analysis
Pakchoi, cucumber and tomato were purchased from Guilin Agricultural Market and 50 g samples were weighed. The grinding bowl was ground thoroughly and 1 mL of 99.5% acetone was added. The mixture was filtered with filter paper and centrifuged at 1000 RPM for 5 min. The supernatant was collected and stored in a refrigerator at 4 °C for use. We followed the procedure for SERS detection and tested the recovery. Table 5 indicates that the recovery was 95.7–99.4% and the relative standard deviation was 3.5–5.6%.
Table 5.
Determination results of ACT in water samples.
4. Conclusions
In this paper, a nitrogen/silver co-doped carbon dot with high stability and high catalytic activity was synthesized by microwave method. Based on the catalytic effect of the carbon dot on the H2O2-DBD SERS reaction, combined with the specific reaction of ACT-Apt, a new SERS quantitative analysis method for ACT was constructed. It has the advantages of simple operation, high sensitivity and good selectivity.
Author Contributions
X.F. and C.L. acquired the data for the work, drafted the work, gave final approval of the version to be published, and agreed to be accountable for all aspects of the work in questions related to its accuracy. Y.L. and A.L. analyzed the data for the work, drafted the work, gave final approval of the version to be published, and agreed to be accountable for all aspects of the work in questions related to its accuracy. Z.J. designed the work, analyzed the data for the work, revised it critically for important intellectual content, gave final approval of the version to be published, and agreed to be accountable for all aspects of the integrity, investigation and resolution of the work.
Funding
This research was funded by the National Key R and D Program of China [grant number 2018YFD0901003], National Natural Science Foundation of China [grant number 21767004, 21667006] and the Nature Science Foundation of the Guangxi province [grant number 2018GXNSFBA281135].
Conflicts of Interest
The authors declare no conflicts of interest.
References
- Shahdordizadeh, M.; Taghdisi, S.M.; Ansari, N.; Langroodi, F.A.; Abnous, K.; Ramezani, M. Aptamer based biosensors for detection of Staphylococcus aureus. Sens. Actuators B Chem. 2017, 241, 619–635. [Google Scholar] [CrossRef]
- Huang, R.; Xi, Z.; He, N. Applications of aptamers for chemistry analysis, medicine and food security. Sci. China Chem. 2015, 58, 1122–1130. [Google Scholar] [CrossRef]
- Xu, X.; Ma, X.; Wang, H.; Wang, Z. Aptamer based SERS detection of Salmonella typhimurium, using DNA-assembled gold nanodimers. Microchim. Acta 2018, 185, 325. [Google Scholar] [CrossRef]
- Song, L.; Mao, K.; Zhou, X.; Hu, J. A novel biosensor based on Au@Ag core-shell nanoparticles for SERS detection of arsenic (III). Talanta 2016, 146, 285–290. [Google Scholar] [CrossRef]
- Wang, Y.; Yan, B.; Chen, L. SERS tags: Novel optical nanoprobes for bioanalysis. Chem. Rev. 2013, 113, 1391–1428. [Google Scholar] [CrossRef]
- Cialla, D.; März, A.; Bohme, R.; Theil, F.; Weber, K.; Schmitt, M.; Popp, J. Surface-enhanced Raman spectroscopy (SERS): Progress and trends. Anal. Bioanal. Chem. 2012, 403, 27–54. [Google Scholar] [CrossRef] [PubMed]
- Fisk, H.; Westley, C.; Turner, N.J.; Goodacre, R. Achieving optimal SERS through enhanced experimental design. J. Raman Spectrosc. 2016, 47, 59–66. [Google Scholar] [CrossRef]
- Lu, T.; Lee, Y.; Yen, Y.; Yu, C.; Chen, H. Astronomical liquid mirrors as highly ultrasensitive, broadband-operational surface-enhanced Raman scattering-active substrates. J. Colloid Interface Sci. 2016, 466, 80–90. [Google Scholar] [CrossRef] [PubMed]
- Ge, J.; Li, Y.; Wang, J.; Pu, Y.; Xue, W.; Liu, X. Green synthesis of graphene quantum dots and silver nanoparticles compounds with excellent surface enhanced Raman scattering performance. J. Alloys Compd. 2016, 663, 166–171. [Google Scholar] [CrossRef]
- Koleva, M.E.; Nedyalkov, N.N.; Atanasov, P.A.; Gerlach, J.W.; Hirsch, D.; Prager, A. Porous plasmonic nanocomposites for SERS substrates fabricated by two-step laser method. J. Alloys Compd. 2016, 665, 282–287. [Google Scholar] [CrossRef]
- Wen, G.Q.; Zhou, L.P.; Li, T.S.; Liang, A.H.; Jiang, Z.L. A sensitive surface-enhanced Raman scattering method for determination of melamine with aptamer-modified nanosilver probe. Chin. J. Chem. 2012, 30, 869–874. [Google Scholar] [CrossRef]
- Ye, L.; Wen, G.Q.; Dong, J.; Luo, Y.; Liu, Q.Y.; Liang, A.H.; Jiang, Z.L. A simple label-free rhodamine 6G SERS probe for quantitative analysis of trace As3+ in an aptamer-nanosol. RSC Adv. 2014, 4, 32960–32964. [Google Scholar] [CrossRef]
- Dong, N.; Hu, Y.; Yang, K.; Liu, J. Development of aptamer-modified SERS nanosensor and oligonucleotide chip to quantitatively detect melamine in milk with high sensitivity. Sens. Actuators B Chem. 2016, 228, 85–93. [Google Scholar] [CrossRef]
- Lin, X.M.; Cui, Y.; Xu, Y.H.; Ren, B.; Tian, Z.Q. Surface-enhanced Raman spectroscopy: Substrate-related issues. Anal. Bioanal. Chem. 2009, 394, 1729–1745. [Google Scholar] [CrossRef] [PubMed]
- Bassi, B.; Albini, B.; Agostino, A.D.; Dacarro, G.; Pallavicini, P.; Galinetto, P.; Taglietti, A. Robust, reproducible, recyclable SERS substrates: Monolayers of gold nanostars grafted on glass and coated with a thin silica layer. Nanotechnology 2019, 30, 025302. [Google Scholar] [CrossRef] [PubMed]
- Sun, X.G.; Lei, Y. Fluorescent carbon dots and their sensing applications. TrAC Trends Anal. Chem. 2017, 89, 163–180. [Google Scholar] [CrossRef]
- Atabaev, T.S. Doped carbon dots for sensing and bioimaging applications: A minireview. Nanomaterials 2018, 8, 342. [Google Scholar] [CrossRef] [PubMed]
- Xiao, Q.; Liang, Y.; Zhu, F.W.; Lu, S.Y.; Huang, S. Microwave-assisted one-pot synthesis of highly luminescent N-doped carbon dots for cellular imaging and multi-ion probing. Microchim. Acta 2017, 184, 2429–2438. [Google Scholar] [CrossRef]
- Wang, W.; Li, Y.M.; Cheng, L.; Cao, Z.Q.; Liu, W.G. Water-soluble and phosphorus-containing carbon dots with strong green fluorescence for cell labeling. J. Mater. Chem. B 2013, 2, 46–48. [Google Scholar] [CrossRef]
- Liu, M.L.; Chen, B.B.; Li, C.M.; Huang, C.Z. Carbon dots: Synthesis, formation mechanism, fluorescence origin and sensing applications. Green Chem. 2019, 21, 449–471. [Google Scholar] [CrossRef]
- Ahmed, G.H.G.; Laino, R.B.; Calzón, J.A.G.; Garcia, M.E.D. Highly fluorescent carbon dots as nanoprobes for sensitive and selective determination of 4-nitrophenol in surface waters. Microchim. Acta 2015, 182, 51–59. [Google Scholar] [CrossRef]
- Li, X.; Jiang, X.; Liu, Q.Y.; Liang, A.H.; Jiang, Z.L. Using N-doped carbon dots prepared rapidly by microwave as nanoprobe and nanocatalyst for fluorescence determination of ultratrace isocarbophos with label-free aptamer. Nanomaterials 2019, 9, 223. [Google Scholar] [CrossRef] [PubMed]
- Luo, J.; Shen, X.; Li, B.; Li, X.; Zhou, X. Signal amplification by strand displacement in a carbon dot based fluorometric assay for ATP. Microchim. Acta 2018, 185, 392–399. [Google Scholar] [CrossRef]
- Shi, M.; Cen, Y.; Sohail, M.; Xu, G.; Wei, F.; Ma, Y.; Song, Y.; Hu, Q. Aptamer based fluorometric β-lactoglobulin assay based on the use of magnetic nanoparticles and carbon dots. Microchim. Acta 2018, 185, 40–48. [Google Scholar] [CrossRef] [PubMed]
- Shi, H.; Zhao, G.; Liu, M. Aptamer-based colorimetric sensing of acetamiprid in soil samples: Sensitivity, selectivity and mechanism. J. Hazard. Mater. 2013, 260, 754–761. [Google Scholar] [CrossRef] [PubMed]
- El Hassani, A.K.; Dacher, M.; Gary, V. Effects of sublethal doses of acetamiprid and thiamethoxam on the behavior of the honeybee (Apis mellifera). Arch. Environ. Contam. Toxicol. 2008, 54, 653–661. [Google Scholar] [CrossRef] [PubMed]
- Imamura, T.; Yanagawa, Y.; Nishikawa, K. Two cases of acute poisoning with acetamiprid in humans. Clin. Toxicol. 2010, 48, 851–853. [Google Scholar] [CrossRef]
- Zhang, B.; Pan, X.; Venne, L. Development of a method for the determination of 9 currently used cotton pesticides by gas chromatography with electron capture detection. Talanta 2008, 75, 1055–1060. [Google Scholar] [CrossRef]
- Vichapong, J.; Burakham, R.; Srijaranai, S. Vortex-assisted surfactant-enhanced-emulsification liquid-liquid microextraction with solidification of floating organic droplet combined with HPLC for the determination of neonicotinoid pesticides. Talanta 2013, 117, 221–228. [Google Scholar] [CrossRef]
- Mohan, C.; Kumar, Y.; Madan, J. Multiresidue analysis of neonicotinoids by solid-phase extraction technique using high-performance liquid chromatography. Environ. Monit. Assess. 2010, 165, 573–576. [Google Scholar] [CrossRef] [PubMed]
- Xie, W.; Han, C.; Qian, Y. Determination of neonicotinoid pesticides residues in agricultural samples by solid-phase extraction combined with liquid chromatography-tandem mass spectrometry. J. Chromatogr. A 2011, 1218, 4426–4433. [Google Scholar] [CrossRef] [PubMed]
- Zhang, X.; Mobley, N.; Zhang, J. Analysis of Agricultural Residues on Tea Using d-SPE Sample Preparation with GC-NCI-MS and UHPLC-MS/MS. J. Agric. Food Chem. 2010, 58, 11553–11560. [Google Scholar] [CrossRef] [PubMed]
- Jin, D.; Qin, X.; Yu, L. A novel sensor for the detection of acetamiprid in vegetables based on its photocatalytic degradation compound. Food Chem. 2016, 194, 959–965. [Google Scholar] [CrossRef]
- Wang, J.; Wu, Y.; Zhou, P.; Yang, W.; Tao, H.; Qiu, S.; Feng, C. A novel fluorescent aptasensor for ultrasensitive and selective detection of acetamiprid pesticide based on the inner filter effect between gold nanoparticles and carbon dots. Analyst 2018, 143, 5151–5160. [Google Scholar] [CrossRef]
- Tang, X.; Li, X.; Ma, D.L.; Lu, L.; Qu, B. A label-free triplex-to-G-qadruplex molecular switch for sensitive fluorescent detection of acetamiprid. Talanta 2018, 189, 599–605. [Google Scholar] [CrossRef]
- Wang, C.; Chen, D.; Wang, Q.; Wang, Q. Aptamer-based resonance light scattering for sensitive detection of acetamiprid. Anal Sci. 2016, 32, 757–762. [Google Scholar] [CrossRef]
- Kang, Y.; Wu, T.; Han, X.; Gu, H.; Zhang, X. A needle-like reusable surface-enhanced Raman scattering substrate, and its application to the determination of acetamiprid by combining SERS and thin-layer chromatography. Microchim. Acta 2018, 185, 504. [Google Scholar] [CrossRef]
- Li, C.N.; Qin, Y.N.; Li, D.; Zhang, C.; Liang, A.H.; Wen, G.Q.; Lu, Z.J.; Jiang, Z.L. A highly sensitive enzyme catalytic SERS quantitative analysis method for ethanol with Victoria blue B molecular probe in the stable nanosilver sol substrate. Sens. Actuators B Chem. 2018, 255, 3464–3471. [Google Scholar] [CrossRef]
© 2019 by the authors. Licensee MDPI, Basel, Switzerland. This article is an open access article distributed under the terms and conditions of the Creative Commons Attribution (CC BY) license (http://creativecommons.org/licenses/by/4.0/).