1. Introduction
Light whispering-gallery-modes (WGMs) in microresonators, which are the analogy of acoustic waves travelling in a closed concave surface such as St. Paul’s Cathedral, support ultrasmall mode volumes and ultrahigh quality (Q) factors. WGM microresonators with high local field intensities make them an excellent platform for enhancing the interaction between light and matter, based on which many applications have been demonstrated over the past two decades, such as low-threshold lasers [
1,
2], opto-mechanics [
3,
4], integrated optical devices [
5,
6], non-linear optics processes [
7,
8,
9], and optical sensors [
10,
11,
12]. Particularly, the WGM microresonator with strong evanescent waves has been proven as a versatile label-free biochemical sensor [
13,
14,
15,
16,
17] with high sensitivity and low detection limit down to single molecules and nanoparticles by monitoring the shift [
18], split [
16,
19,
20,
21], or broadening [
22] of the resonance spectra. Various types of WGM microresonators including microsphere [
18], microtoroid [
16], microbubble [
23,
24], microdisk/ring [
25], and microcapillaries [
26,
27] have been used in biosensing experiments; they can be catalogued into passive resonators and active resonators. In passive resonator-based sensor configuration, the resonator is driven by a waveguide, such as a relatively fragile tapered fiber or prism. The relative position between them must be adjusted precisely by a nano-positioning platform that makes the sensing system costly and cumbersome. While in active resonator sensor configuration, the fluorescence or laser spectrum is collected by free-space optics that makes the sensing system relatively practical.
In most WGM microresonator (both for passive and active) based biochemical sensor configurations, the microcavity is immersed in water and sealed in a microfluidic cell. This sensing configuration is a closed system. To change the refractive index (RI) of liquid around the microresonator, a micro syringe pump is used to pump the biochemical sample under test through the microfluidic channel. Thus, this sensing configuration cannot change the RI of liquid around the microresonator and sensing it immediately because sensing samples must be crossed through the microfluidic channel. Here, we report on the demonstration of a biochemical sensor based on a water-immersion-objective (WIO) pumped on-chip microdisk laser. This WIO pumped configuration is an open sensing system. The microdisk is directly immersed in the water environment that is what the WIO requires. By monitoring the laser wavelength, any feeble disturbance of the RI of the water can be detected in real time. Thus, the WIO pumped configuration provides an excellent platform for monitoring the RI change of the water that is induced by chemical reactions. In this paper, we demonstrate that the salt dissolution in water process and diffusion process of two droplets with different RI can be tracked by the lasing mode wavelength in real time. We believe that this work opens up a novel on-chip biochemical sensor based on a WIO pumped configuration, which provides potential accesses to study chemical reaction kinetics.
2. Laser Operation
2.1. Optical System Setup
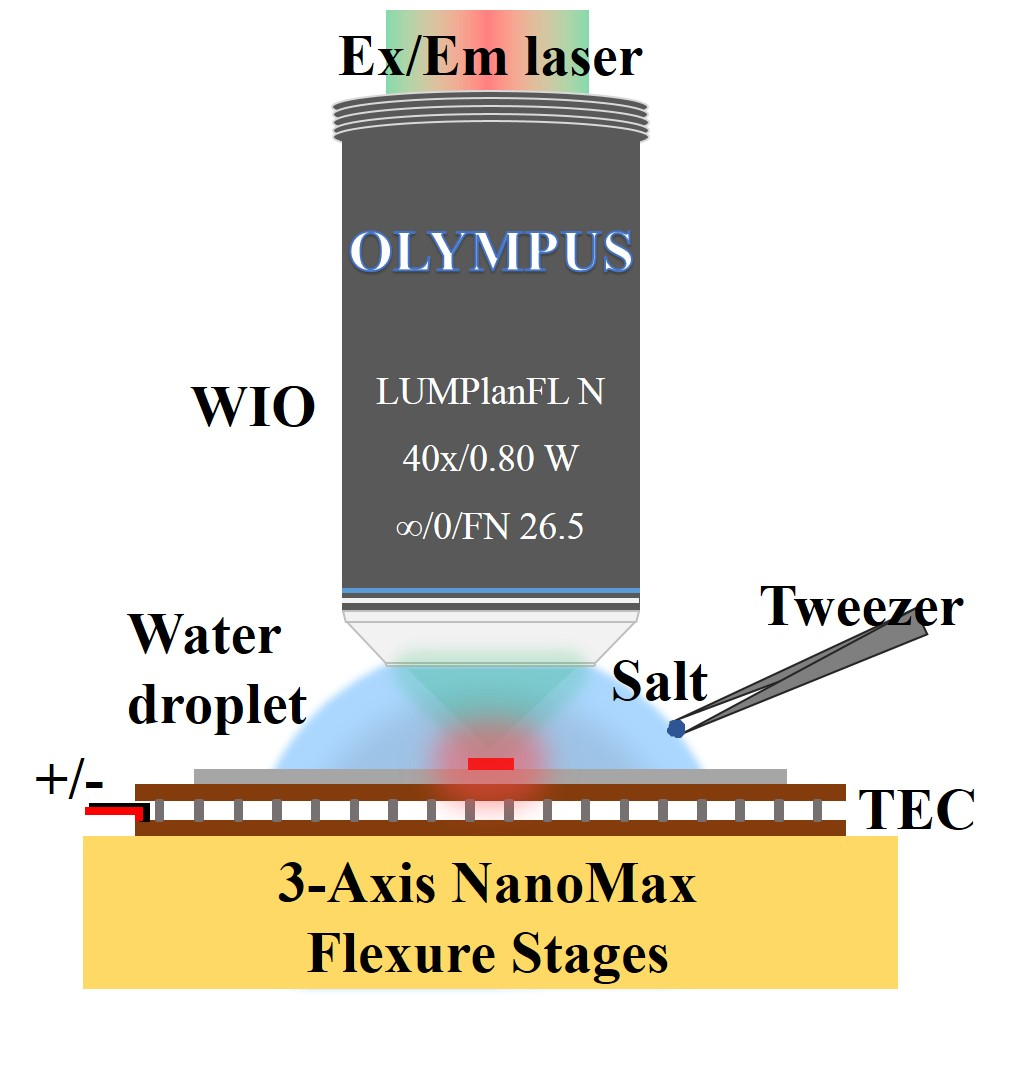
The optical system setup is shown in
Figure 1a, which is a typical optically pumped microcavity laser setup, except that a water-immersion objective (WIO) instead of conventional air objective is used. The pump laser is focused on the active microdisk resonator, which is directly immersed in water, through this WIO (LUMPlanFLN 40× W, Olympus, Tokyo, Japan). In this study, an active SU-8 microdisk resonator doped with Rhodamine B (RhB) is used for the experiment. The microdisk laser array (
Figure 1b) is fabricated on silica-on-silicon chip and the detailed fabrication process can be found in previous studies [
28,
29]. The diameter and thickness of the microdisk are controlled to 40 μm and 1 μm, respectively. To avoid thermal wavelength drift induced by the fluctuation of the lab temperature, the sample chip is mounted on a home-made TEC (TZET Co. Ltd., Tianjin, China). The TEC is connected to a temperature controller (TED4015, Thorlabs Inc., Newton, NJ, USA) with a controlling precision of 2 mK. The pump light used here is an ns-pulsed OPO laser with a repetition rate of 10 Hz. The wavelength of pump laser is tuned to 532 nm for matching the absorption band of RhB. The laser emitted from the active microdisk is collected through free-space and recorded by the monochromator (HORIBA iHR550, Kyoto, Japan) equipped with a cooled CCD detector. A 1200 mm
−1 grating is installed in the monochromator.
2.2. Threshold Measurement and Spectral Identification
The threshold of the laser emission is firstly measured by tuning the power of pump light and the light emission form the active microdisk is recorded correspondingly. Both the air objective (LMPlanFLN 20×, Olympus, Tokyo, Japan) pumped configuration and WIO pumped configuration are performed for comparison; the result is shown in
Figure 2. Under both configurations, there are obvious kinks (
Figure 2a,b), which indicate that the lasing thresholds are about 5.2 μJ/mm
2 and 13.9 μJ/mm
2, respectively. The linewidth of the laser peak above the threshold is about 0.08 nm. The corresponding Q factor is about 7800. However, this is not the real Q factor which is limited by the grating of the monochromator. The laser threshold pumped by WIO is higher than that pumped by the air objective. This is attributed to that the RI contrast is lower, which increases radiation loss in the WIO pumped configuration.
To verify this, the eigenmodes of a microdisk surrounded by air and water are calculated by Finite Element Method (FEM) with COMSOL Multiphysics 3.5a [
30]. The perfectly matched layers (PMLs) are introduced to accurately calculate the radiation-loss-related Q
rad. The Q
rad of the fundamental radial mode (radial quantum number
p =1) is 1.5×10
8 when the microdisk is exposed in air, while it drops to 2.4×10
7 when the microdisk is immersed in water.
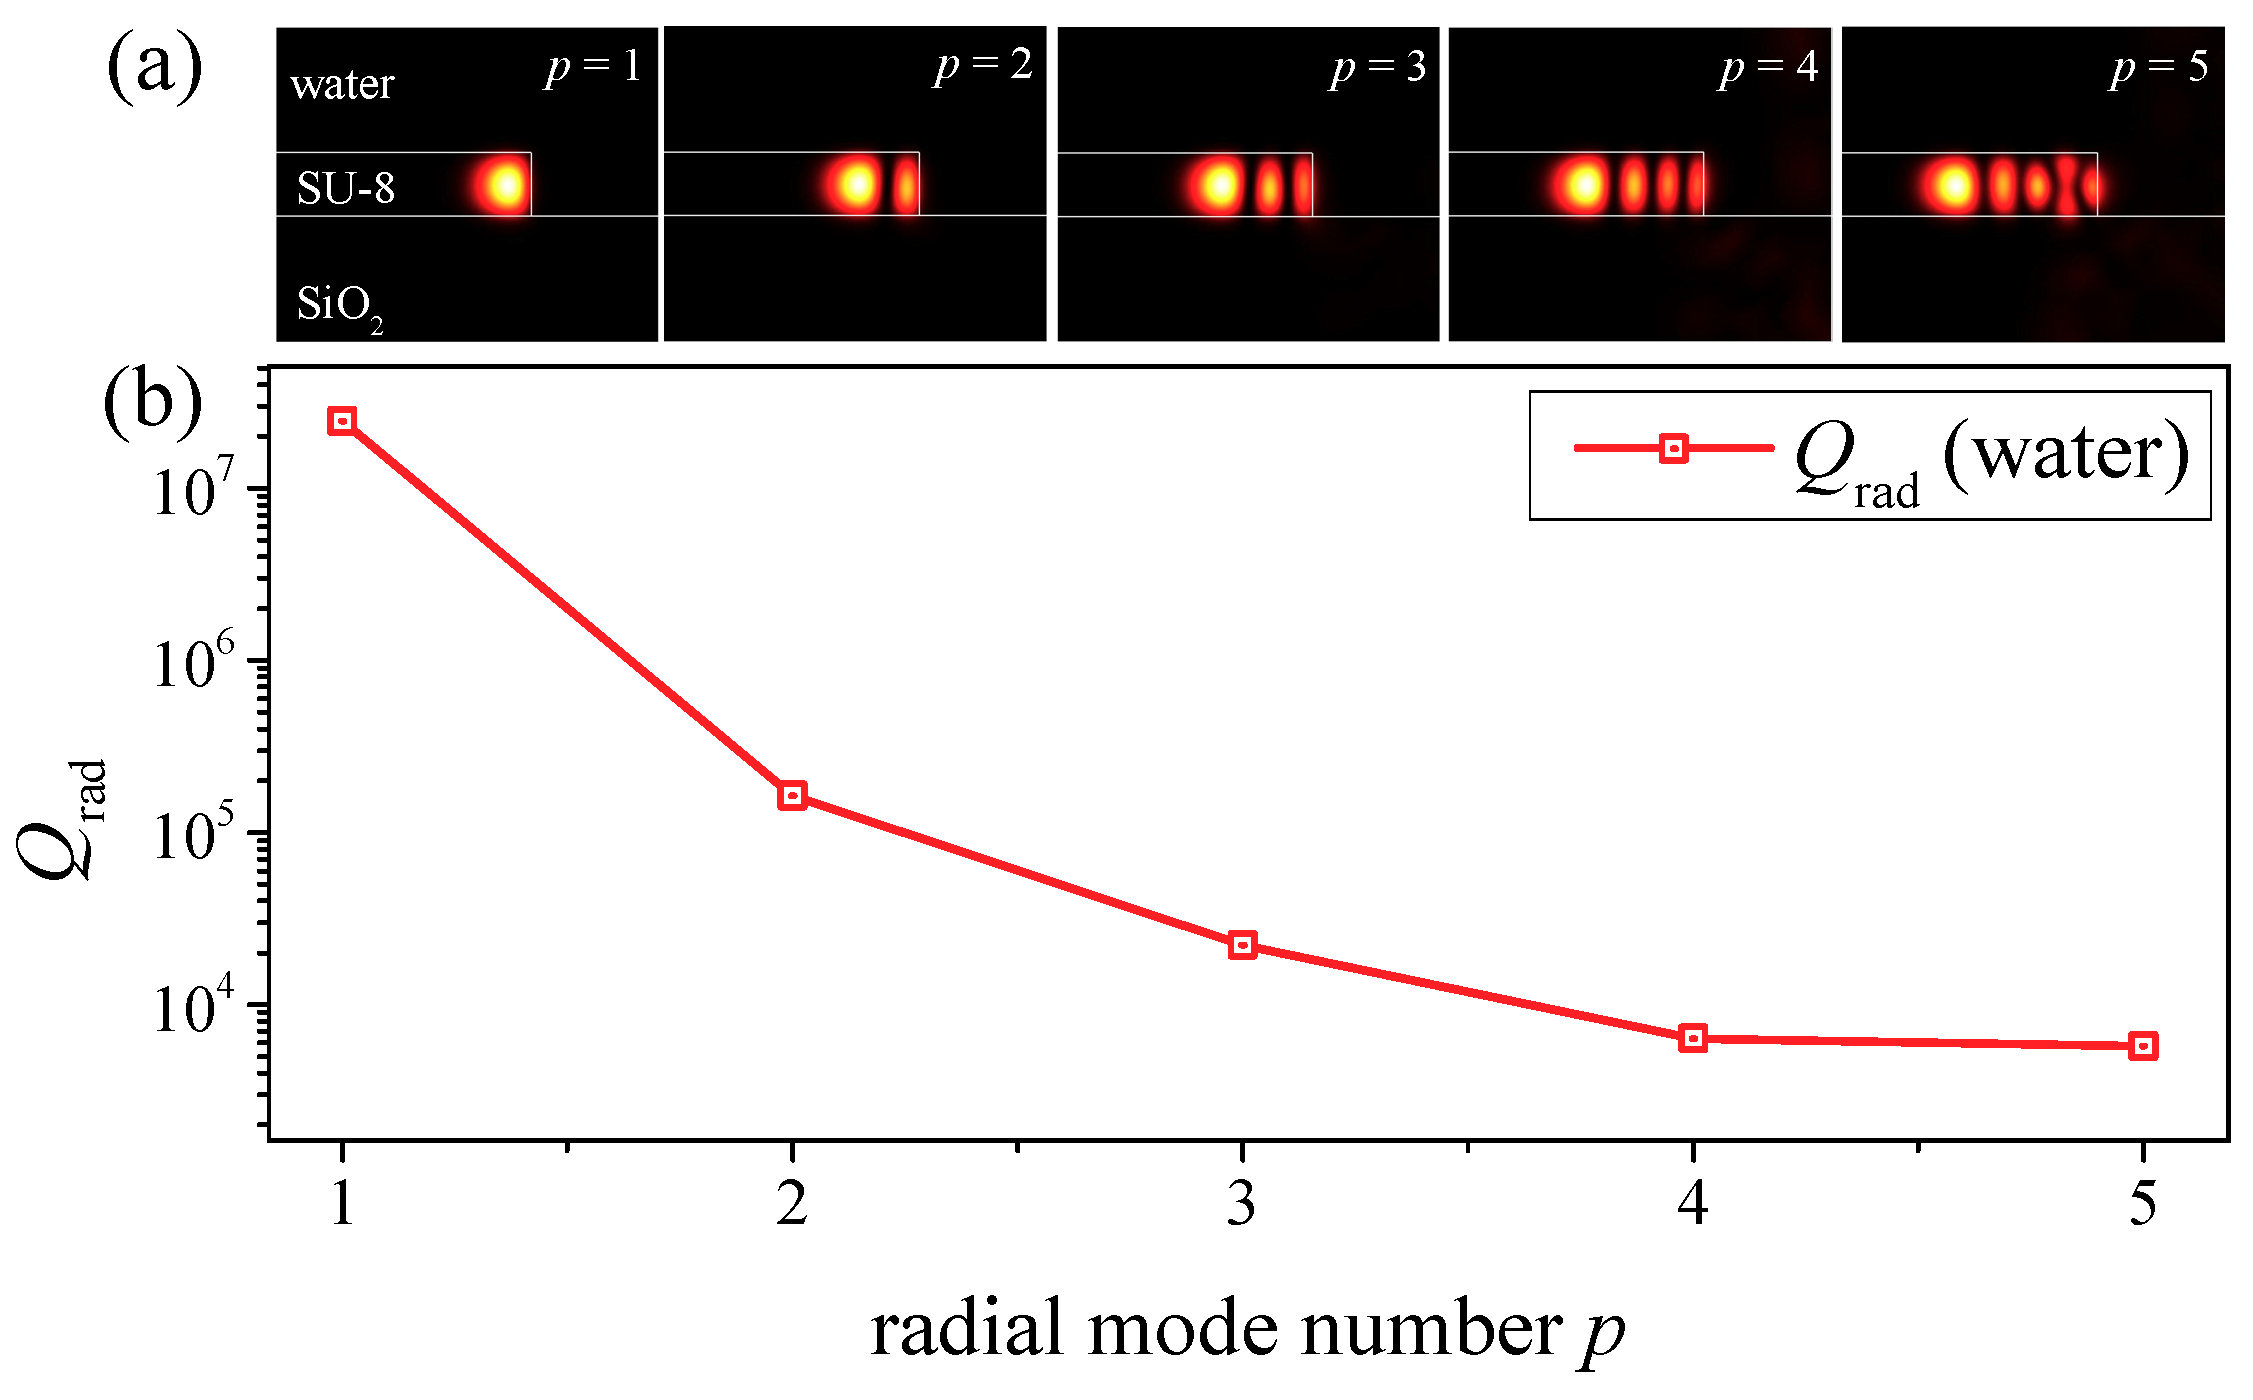
The Q
rad and field distribution of different radial modes are calculated and plotted in
Figure 3. The Q
rad decreases exponentially with the increment of
p. Thus, we can conclude that the laser peaks shown in
Figure 2c,d are the fundamental modes with adjacent azimuthal mode numbers. The free spectral range (FSR) is slightly larger in the WIO pumped configuration, because of the RI increment of surrounding materials of the microdisk. Little discrepancy between the calculated FSR and measured FSR may result from the inaccuracy of the microdisk diameter during the fabrication process.
3. Basic Element Sensing
3.1. Bulk Refractive Index Sensitivity (BRIS)
Under the WIO pumped configuration, the microdisk is directly immersed in a water environment, so the lasing spectra will be quite sensitive to the RI of the water. The BRIS of the microdisk laser is tested by directly changing the RI of the water droplet between the WIO and the silicon chip. Different RI solutions are obtained by dissolving different masses of NaCl into deionized water. Five NaCl solutions with concentrations of 1, 2.05, 3, 4.03, and 4.94 mol/liter are prepared for testing as shown in
Figure 4a. To change in advance each droplet between the WIO and silicon chip, the sample is washed by the deionized water at least twice to eliminate the error of the droplet RI.
The lasing spectra are recorded for each droplet, respectively, which are shown in
Figure 4a. The central lasing wavelength is obtained by fitting the lasing peaks with Lorentz function. The lasing wavelength shift is plotted as a function of RI (
Figure 4b). By linear fitting the measured wavelength data, the slope, i.e., the BRIS is 11.3 nm/RIU.
The wavelengths of the eigenmodes are calculated by changing the RI of the surrounding environment of the microdisk in the simulation model, and are also plotted over RI in
Figure 4c. As shown, the calculated BRIS is 11.7 nm/RIU. The measured BRIS matches very well with this calculated value. The relatively high BRIS guarantees the performance of microdisk laser as a chemical sensor.
3.2. Thermal Sensing
SU-8 material exhibits high thermal optics (TO) coefficient of −3.5 × 10
−4 K
−1 [
31], which is higher than that of materials that are commonly used to fabricate WGM resonators, such as silica (1 × 10
−5 K
−1) [
32] and silicon (1.8 × 10
−4 K
−1) [
33]. Combining with on-chip integration, ease of laser probing and readout based on free-space optics against passive WGM thermal sensors using relatively fragile tapered microfiber [
34,
35], the fabricated all-polymer microdisk laser provides a good platform for ultrasensitive thermal sensing. Thus, the thermal sensing of the SU-8 microdisk laser is performed.
The laser emission spectra are recorded in real time when changing the TEC temperature by a step of 1 K. At each temperature, the spectra are recorded for about 2 mins. A home-made code is written to track the spectral positions of the laser peaks over time. The result of spectral shift over time with different temperatures is shown in
Figure 5a, where the spectral shift (triangle dots) exhibits step change to the temperature. However, at each constant temperature, the lasing wavelength minor shifts linearly which can be seen from the enlarged view of spectral shift at 20 °C (inset in
Figure 5a). This blue shift of laser wavelength is attributed to the decreased RI of the polymer-dye composites due to photobleaching [
36,
37,
38,
39]. As the spectral shift is linear over time [
38], the spectral shift can be corrected by eliminating its slope (red fitting line in the inset of
Figure 5a). The corrected spectral shift (circular dots) is almost flat over time at each constant temperature.
The average values of laser wavelength with error bar for each temperature is plotted in
Figure 5b. The linear fit result indicates the thermal sensitivity is as high as 120.6 pm/K and has benefited from the high TO coefficient. Here the thermal expansion effect is ignored since its coefficient of ~ 10
−6 K
−1 is much lower than TO coefficient [
40].
For bio-chemical sensing, the temperature fluctuation and photobleaching will cause the resonance wavelength drift and influence the quantification of the proposed analytes. To eliminate the effect of temperature fluctuation, the sensor chip is mounted on a TEC for stabilizing the temperature. The wavelength drift caused by the photobleaching can be corrected by eliminating its slope. Recently, S. F. Wondimu also reported a novel scheme that allows for simultaneous compensation of temperature drift and photobleaching by using microdisk laser arrays with on-chip references [
39].
4. Chemical Sensor
As the microdisk is directly immersed in the water droplet and the microdisk sensor exhibits high sensitivities, so the lasing mode can quickly sense the local change (e.g., RI) of the water droplet in real time. This provides an excellent platform for studying some chemical reactions in water, e.g., dissolution and diffusion process, by monitoring the laser wavelength. Thus in the following study, a proof-of-principle chemical sensor is demonstrated based on a WIO pumped configuration by adding salt crystals or NaCl solution into the water droplet.
4.1. Salt Dissolution Process in Water
In this section, adding a certain quality of salt crystal into the water droplet between the WIO and silicon chip is performed. The water droplet with a fixed volume of 0.2 mL is firstly injected into the space between the WIO and silicon chip by a pipette. By tuning one microdisk just under the focus of pump light, the laser is generated above the threshold and the emission spectrum is automatically recorded with integration time of 1 s. Then salt crystal with a mass of 14 mg is cast into the edge of the droplet with a tweezer. In this process, the acquisition of emission spectra is ongoing for about 7 mins.
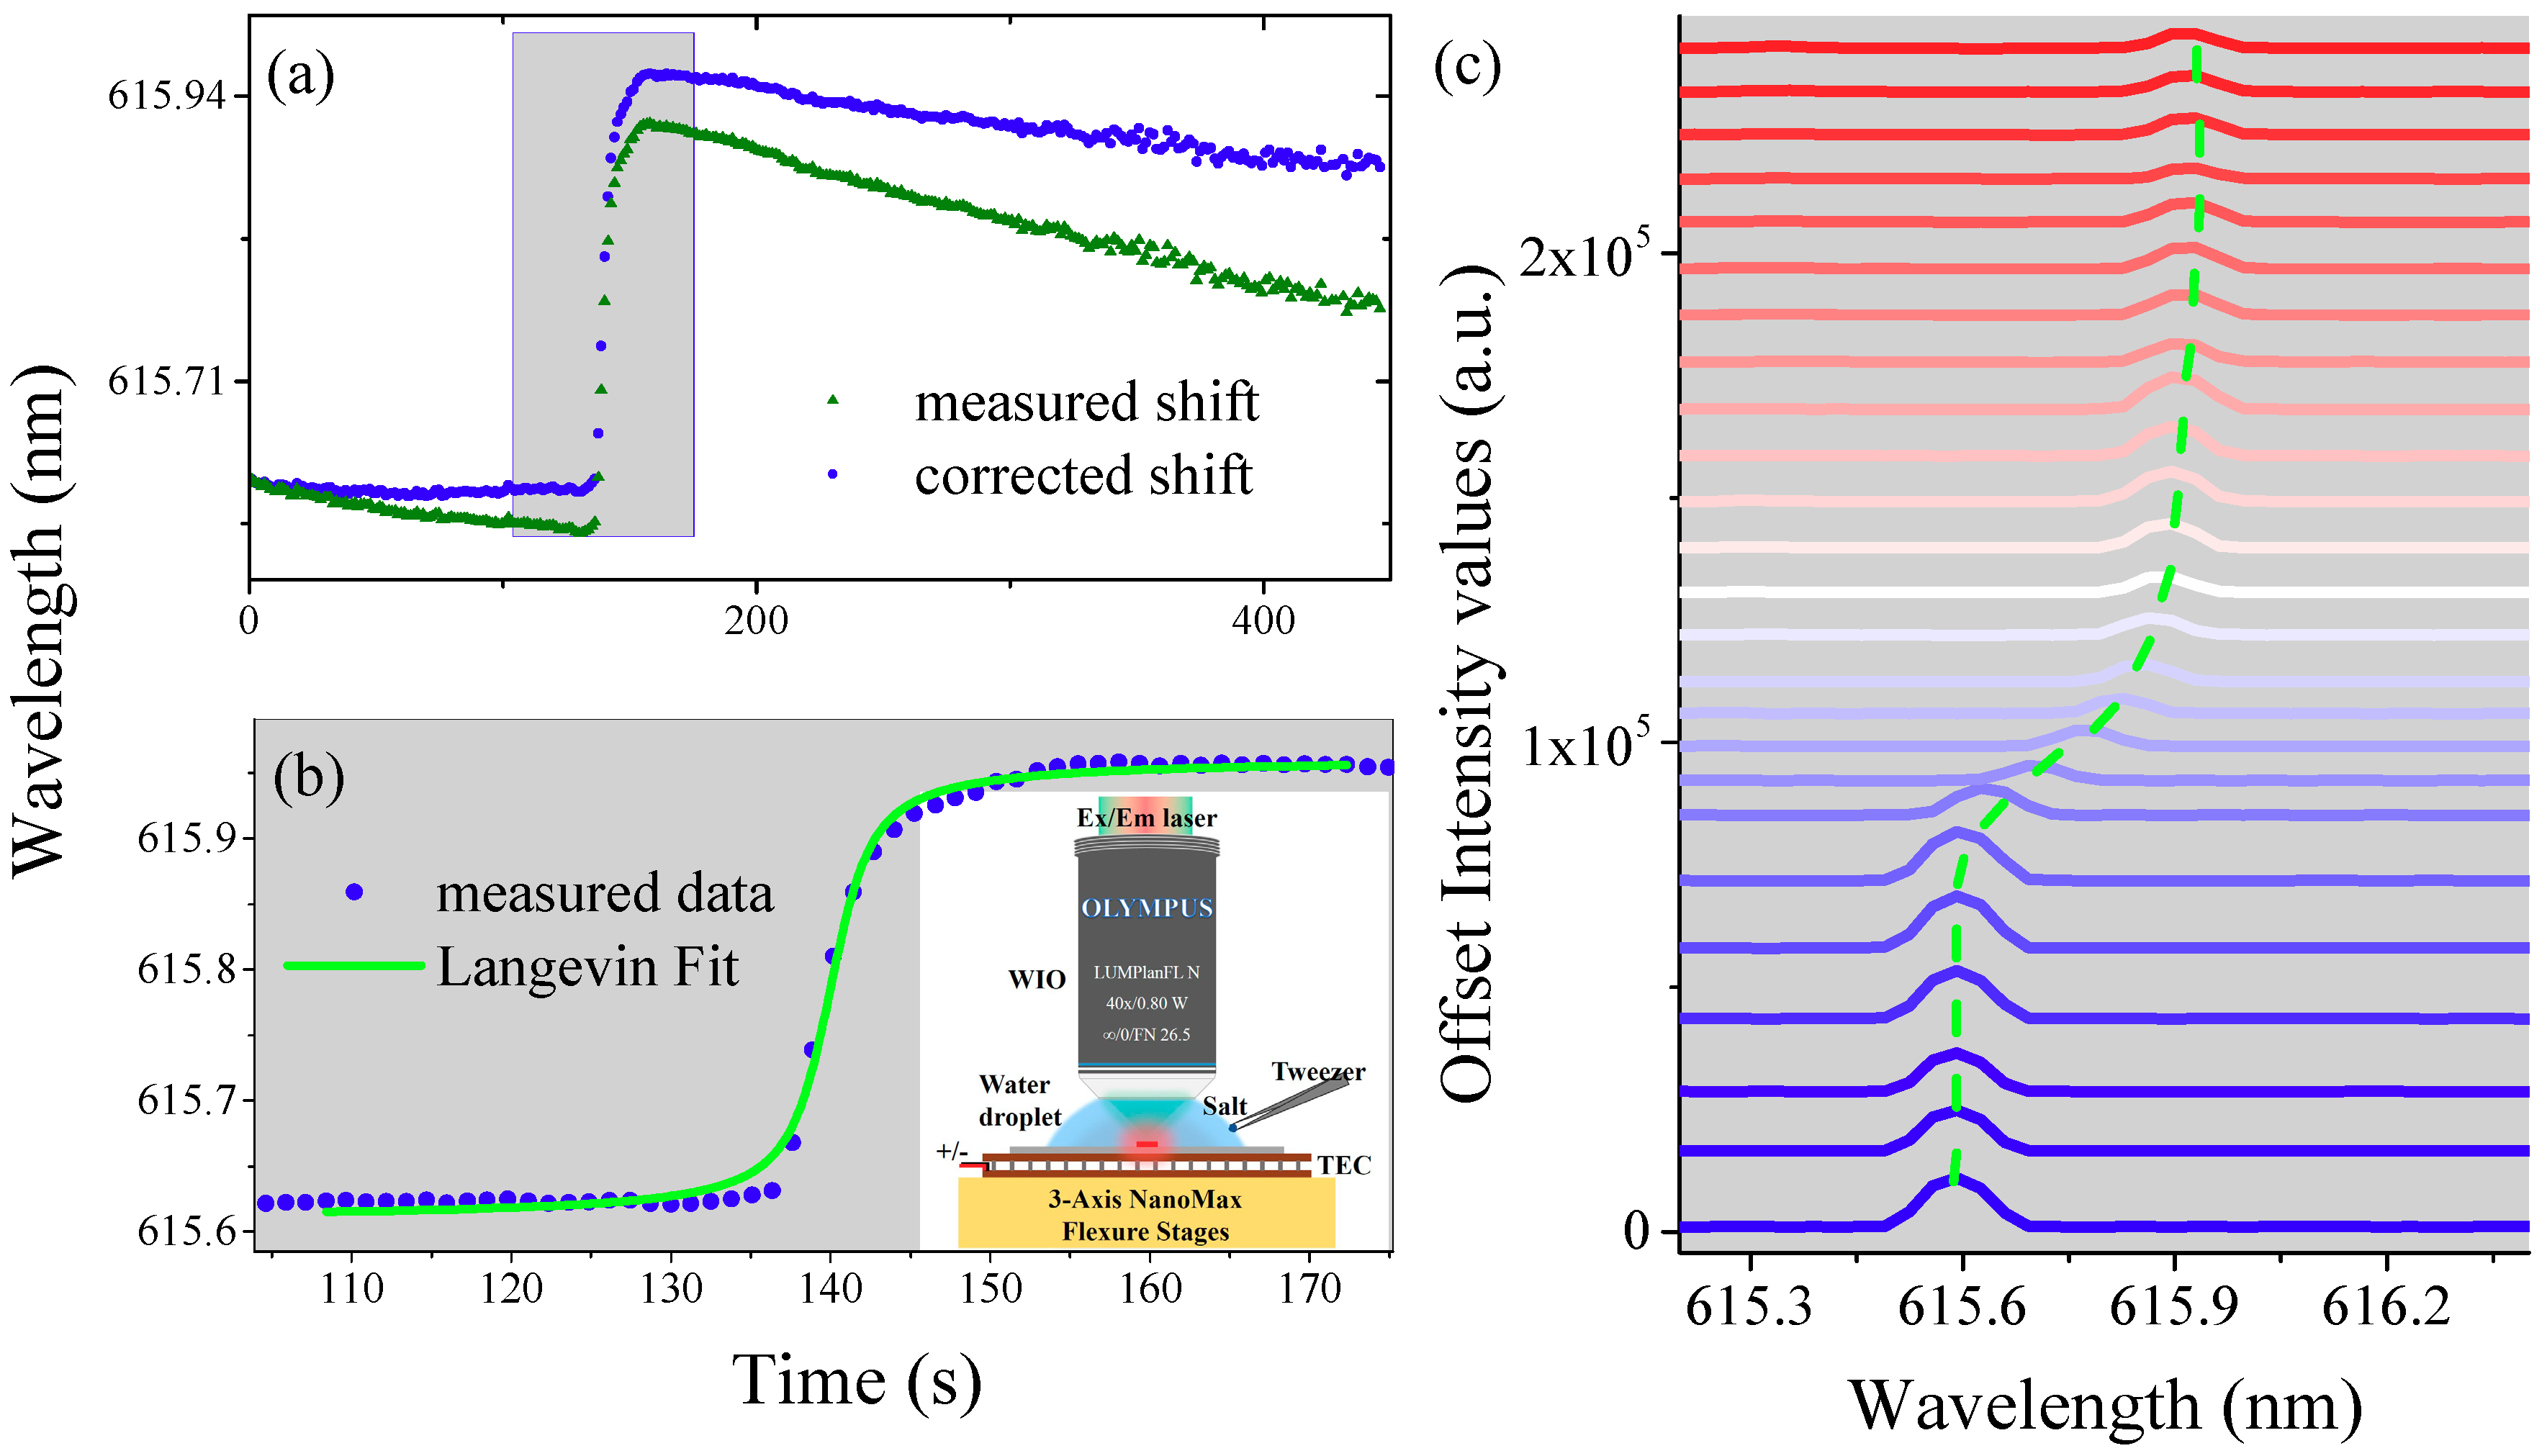
After data acquisition, one laser peak is monitored and its spectral wavelength shift is shown in
Figure 6a (triangle dots). Slow linear change of wavelength induced by photobleaching is observed, after correction, and the spectral shift is denoted by circular dots. Before casting salt into the droplet, the lasing wavelength is quiet, which can be seen from
Figure 6a (circular dots). After casting salt into the droplet, the lasing wavelength is red shifted dramatically. Then the lasing wavelength blue shifts slowly and finally approaches to equilibrium over 400 s. The whole process is explained below.
Once the salt is cast into the droplet, the salt will dissolve and diffuse in the water, which induces the increment of RI of the droplet. As a result, the spectrum shifts to longer wavelength dramatically. Since the salt crystal is cast in one side of the droplet, there exists a gradient in concentration of NaCl solution from this side to the other side. Therefore, the RI in the surrounding volume of the lasing microdisk first increases and then decreases with the progress of diffusion. Consequently, the spectrum starts to shift slowly to shorter wavelength and finally no longer changes at the end of diffusion process (> 400 s), as shown in
Figure 6a.
A close-up view of the dramatic change of laser wavelength is shown in
Figure 6b. The trajectory of spectral shift is fitted well by Langevin function, which is written as: L(t) = coth(t) − 1/t, where the "coth" is the hyperbolic cotangent, defined as coth(t) = (e
t + e
−t)/(e
t − e
−t). The dynamic change of the laser spectra is also plotted in
Figure 6c (guided by the dotted line).
We found that the spectral does not shift as soon as the salt is cast into the droplet. From adding the salt into the droplet, the laser wavelength is almost stable for a certain time until the wavelength shifts obviously. Here, this time is named as dead time. In order to measure the dead time, the spectral data are recorded separately before and after adding the salt (8 mg) into the droplet, which is shown in
Figure 7a. The time to add the salt into the droplet is set to 0 s. The dead time is about 6.5 s, as shown in
Figure 7a (denoted as a yellow region). After the dead time, the laser wavelength drifts steeply. Dead time as a function of salt mass is also investigated and plotted in
Figure 7b. As shown, the dead time decrease exponentially with the salt mass. This is attributed to the heavier salt possessing a larger surface area and the dissolution process is shorter.
Adding salt into the water actually contains two processes: dissolution of salt and diffusion of NaCl solution. The onset of the spectral shift means the RI of the surrounding volume of the lasing microdisk starts to change due to the diffusion of NaCl solution. The dead time is the sum of salt dissolution time and diffusion time of NaCl solution from one side of the droplet to the middle (where the lasing microdisk locates) of the droplet. Therefore, we perform next experiment by injecting NaCl solution directly into the water droplet to investigate the diffusion time.
4.2. Diffusion Process of Two Different Solutions
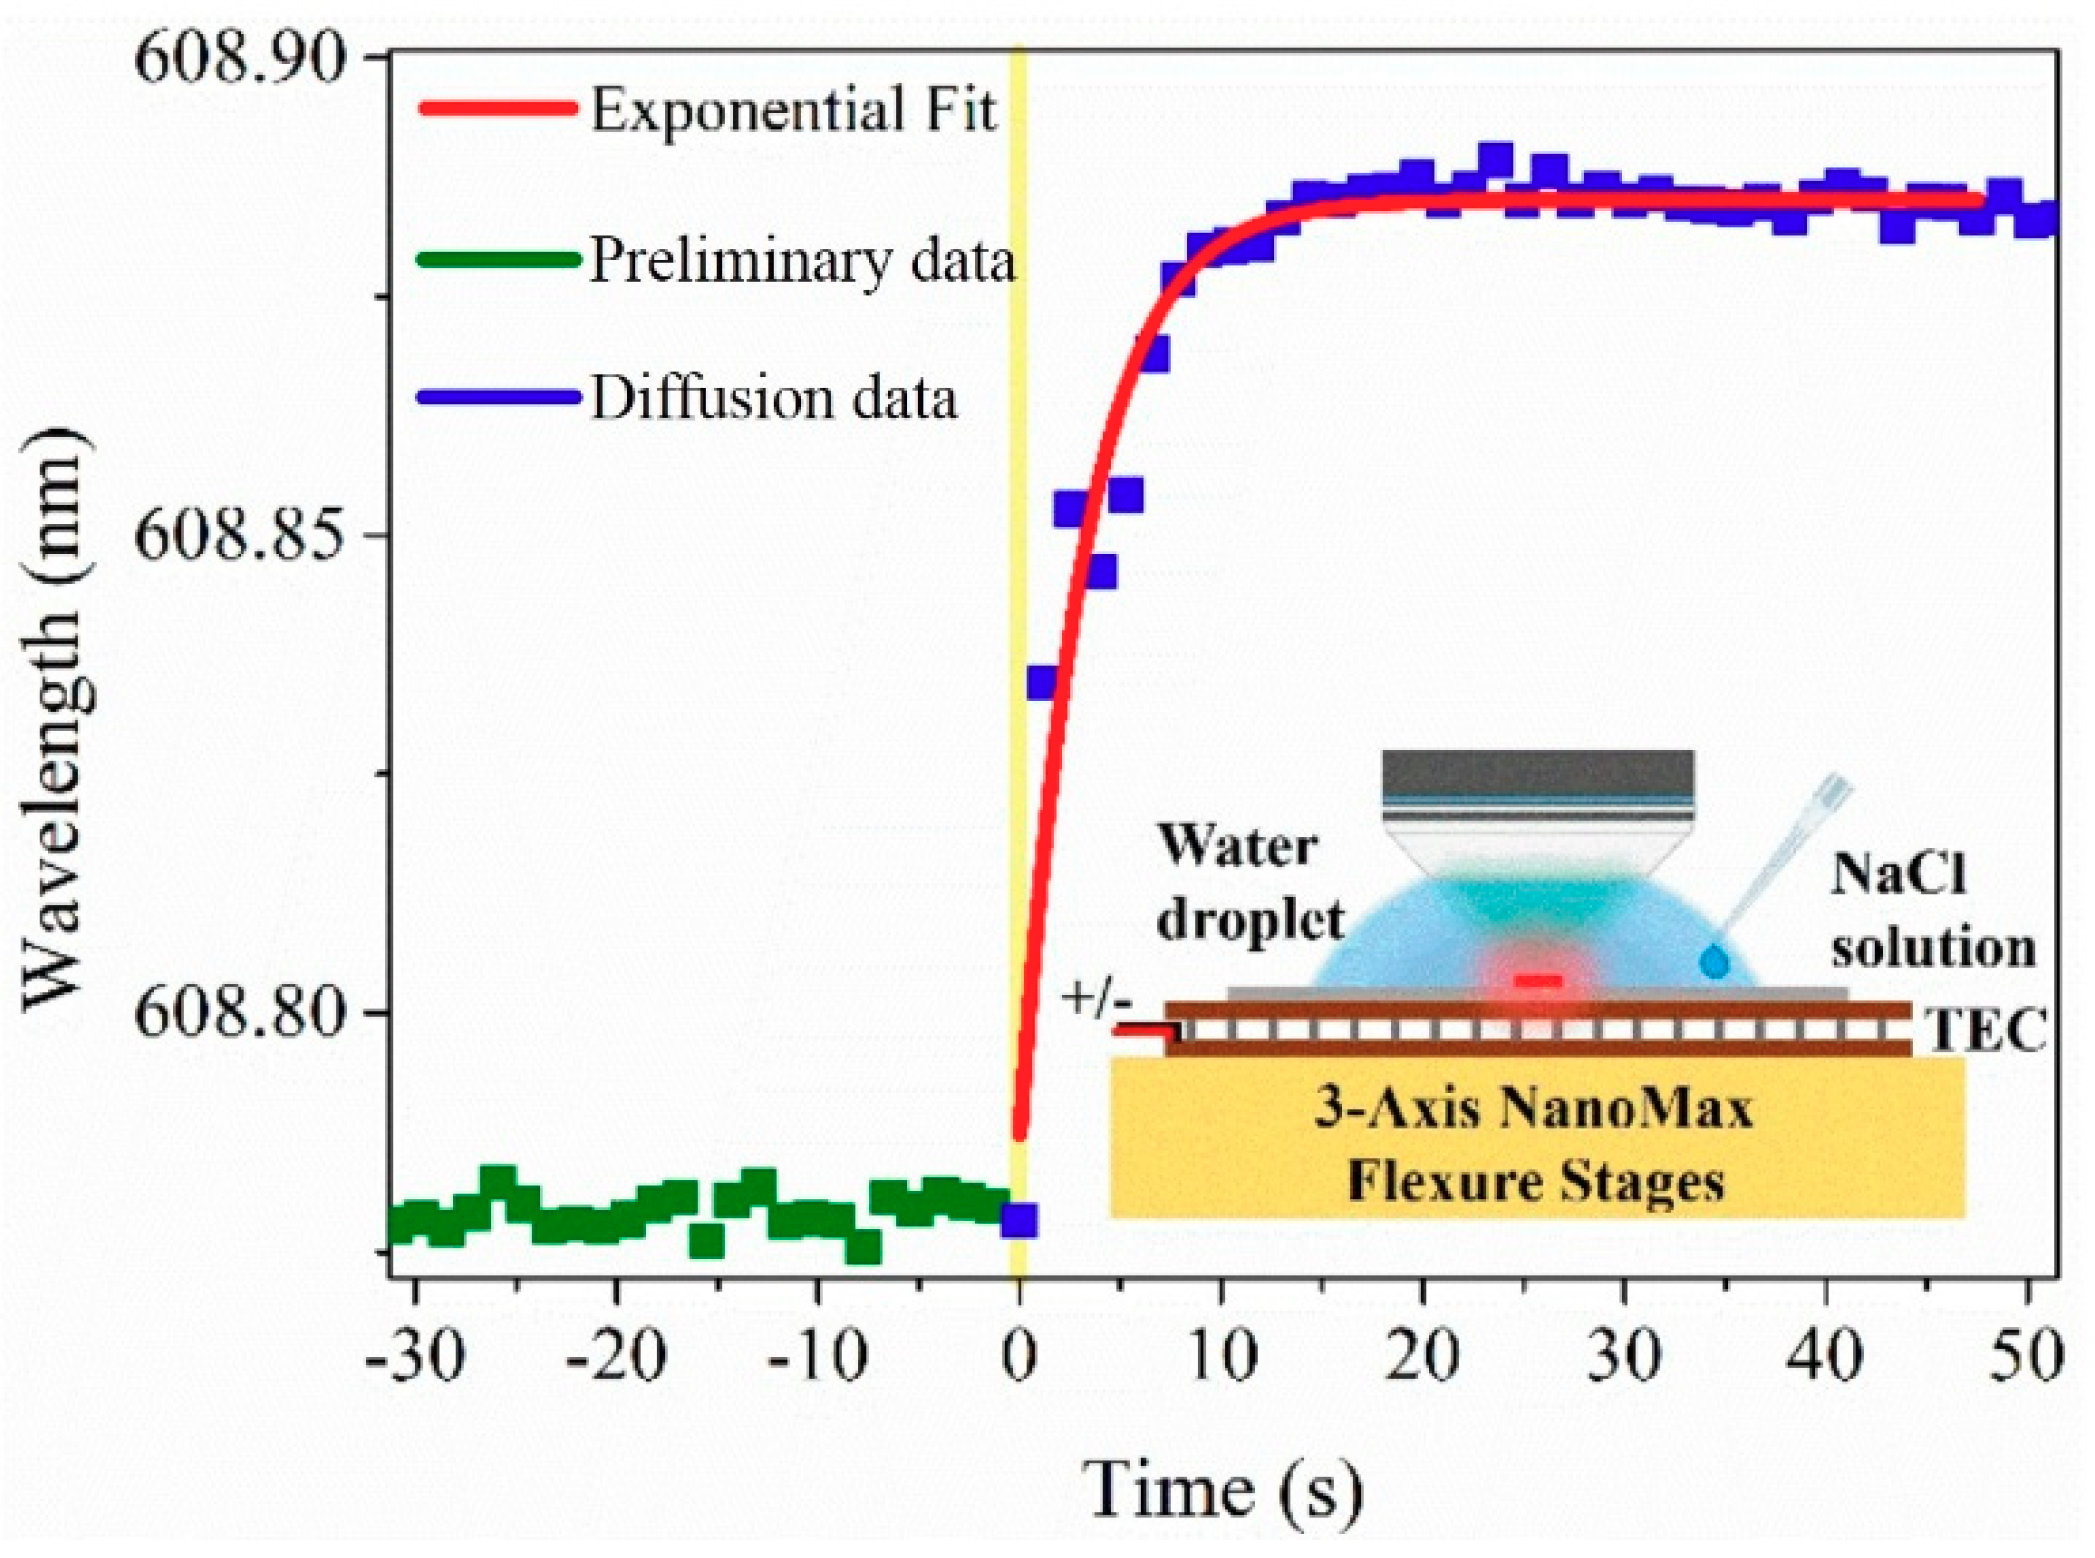
In this section, the diffusion process of two different RI solutions is investigated. The water droplet with a fixed volume of 0.1 mL is firstly injected to the volume between the WIO and silicon chip. Then 0.1 mL NaCl solution with RI of 1.3516 is quickly injected into the water droplet by a pipette tip.
One laser peak was monitored and its spectral shift is shown in
Figure 8. The spectral data are recorded separately before and after injecting NaCl solution into the droplet. The spectral response is different from that in adding salt into the droplet. As soon as the NaCl solution is injected into the droplet, the laser wavelength shifts immediately. This indicates the RI of the surrounding volume of the lasing microdisk changes immediately due to the diffusion of NaCl solution, and this diffusion process is very fast (less than 1 s as shown in
Figure 8). Therefore, it can be confirmed that the dead time in
Figure 7a is the reaction time of salt dissolution in water.
5. Conclusion
We introduced and systematically studied on-chip versatile chemical sensors based on a WIO pumped WGM microlaser in which the microdisk is directly immersed in the water droplet. Laser properties including threshold and spectrum are firstly investigated and also compared with the microdisk pumped by WIO and air objective, respectively. Lasing mode identification is also performed by using FEM. Then, basic physical elements of RI and temperature sensing are tested, which shows that BRIS is as high as 11.3 nm/RIU and the thermal sensitivity can reach 120.6 pm/K. Finally, a proof-of-concept demonstration of the chemical sensor is carried out by locally changing the droplet RI with the help of typical chemical reactions. The tracking of the progression of dissolution and the diffusion process in real time are realized by monitoring the laser spectral shift.
We anticipate that our demonstration can be further extended to study various biochemical reactions, such as endothermic and exothermic reactions. The application of the WIO pumped configuration can be also broadened to multifunctional biological monitoring and treatment by directly immersing cells or tissues into the WIO droplet.
Author Contributions
Conceptualization, Q.L., X.C., X.W., and S.X.; methodology, Q.L., X.C., and L.F.; validation, X.C., L.F., and Q.L.; writing—original draft preparation, Q.L. and X.C.; writing—review and editing, X.W. and S.X.; funding acquisition, S.X. All authors discussed the results and commented on the manuscript.
Funding
This research was funded by the National Natural Science Foundation of China, grant number 61705039; National Key Basic Research Program of China (973 project), grant number 2015CB352006; China Postdoctoral Science Foundation, grant number 2017M610389; Fujian Provincial Program for Distinguished Young Scientists in University; Fujian Provincial Key Project of Natural Science Foundation for Young Scientists in University, grant number JZ160423; Program for Changjiang Scholars and Innovative Research Team in University, grant number IRT_15R10; Special Funds of the Central Government Guiding Local Science and Technology Development, grant number 2017L3009.
Conflicts of Interest
The authors declare no conflict of interest.
References
- He, L.; Özdemir, Ş.K.; Yang, L. Whispering gallery microcavity lasers. Laser Photonics Rev. 2013, 7, 60–82. [Google Scholar] [CrossRef]
- Jiang, X.F.; Zou, C.L.; Wang, L.; Gong, Q.; Xiao, Y.F. Whispering-gallery microcavities with unidirectional laser emission. Laser Photonics Rev. 2016, 10, 40–61. [Google Scholar] [CrossRef]
- Kippenberg, T.J.; Vahala, K.J. Cavity opto-mechanics. Opt. Express 2007, 15, 17172–17205. [Google Scholar] [CrossRef] [PubMed]
- Dong, C.; Fiore, V.; Kuzyk, M.C.; Wang, H. Optomechanical dark mode. Science 2012, 338, 1609–1613. [Google Scholar] [CrossRef] [PubMed]
- Yang, K.Y.; Dong, Y.O.; Lee, S.H.; Yang, Q.F.; Yi, X.; Shen, B.; Wang, H.; Vahala, K. Bridging ultrahigh- Q devices and photonic circuits. Nat. Photonics 2018, 12, 297–302. [Google Scholar] [CrossRef]
- Levy, J.S.; Gondarenko, A.; Foster, M.A.; Turner-Foster, A.C.; Gaeta, A.L.; Lipson, M. CMOS-compatible multiple-wavelength oscillator for on-chip optical interconnects. Nat. Photonics 2009, 4, 37. [Google Scholar] [CrossRef]
- Armani, D.; Kippenberg, T.; Spillane, S.; Vahala, K. Ultra-high-Q toroid microcavity on a chip. Nature 2003, 421, 925–928. [Google Scholar] [CrossRef] [PubMed]
- Jiang, X.; Shao, L.; Zhang, S.X.; Yi, X.; Wiersig, J.; Wang, L.; Gong, Q.; Lončar, M.; Yang, L.; Xiao, Y.F. Chaos-assisted broadband momentum transformation in optical microresonators. Science 2017, 358, 344–347. [Google Scholar] [CrossRef]
- Lu, Q.; Liu, S.; Wu, X.; Liu, L.; Xu, L. Stimulated Brillouin laser and frequency comb generation in high-Q microbubble resonators. Opt. Lett. 2016, 41, 1736–1739. [Google Scholar] [CrossRef]
- Foreman, M.R.; Swaim, J.D.; Vollmer, F. Whispering gallery mode sensors. Adv. Opt. Photonics 2015, 7, 168–240. [Google Scholar] [CrossRef]
- Fan, X.; White, I.M.; Shopova, S.I.; Zhu, H.; Suter, J.D.; Sun, Y. Sensitive optical biosensors for unlabeled targets: A review. Anal. Chim. Acta 2008, 6208–6226. [Google Scholar] [CrossRef] [PubMed]
- Yang, J.; Guo, L.J. Optical sensors based on active microcavities. IEEE J. Sel. Top. Quant. Electr. 2006, 12, 143–147. [Google Scholar] [CrossRef]
- Vollmer, F.; Braun, D.; Libchaber, A.; Khoshsima, M.; Teraoka, I.; Arnold, S. Protein detection by optical shift of a resonant microcavity. Appl. Phys. Lett. 2002, 80, 4057–4059. [Google Scholar] [CrossRef]
- Vollmer, F.; Arnold, S. Whispering-gallery-mode biosensing: Label-free detection down to single molecules. Nat. Methods 2008, 5, 591–596. [Google Scholar] [CrossRef] [PubMed]
- Lu, T.; Lee, H.; Chen, T.; Herchak, S.; Kim, J.-H.; Fraser, S.E.; Flagan, R.C.; Vahala, K. High sensitivity nanoparticle detection using optical microcavities. Proc. Natl. Acad. Sci. USA 2011, 108, 5976–5979. [Google Scholar] [CrossRef]
- Zhu, J.; Ozdemir, S.K.; Xiao, Y.-F.; Li, L.; He, L.; Chen, D.-R.; Yang, L. On-chip single nanoparticle detection and sizing by mode splitting in an ultrahigh-Q microresonator. Nat. Photonics 2010, 4, 46–49. [Google Scholar] [CrossRef]
- Baaske, M.D.; Foreman, M.R.; Vollmer, F. Single-molecule nucleic acid interactions monitored on a label-free microcavity biosensor platform. Nat. Nanotechnol. 2014, 9, 933–939. [Google Scholar] [CrossRef] [PubMed]
- Dantham, V.R.; Holler, S.; Barbre, C.; Keng, D.; Kolchenko, V.; Arnold, S. Label-Free Detection of Single Protein Using a Nanoplasmonic-Photonic Hybrid Microcavity. Nano Lett. 2013, 13, 3347–3351. [Google Scholar] [CrossRef] [PubMed]
- He, L.; Özdemir, Ş.K.; Zhu, J.; Kim, W.; Yang, L. Detecting single viruses and nanoparticles using whispering gallery microlasers. Nat. Nanotechnol. 2011, 6, 428–432. [Google Scholar] [CrossRef]
- Özdemir, Ş.K.; Zhu, J.; Yang, X.; Peng, B.; Yilmaz, H.; He, L.; Monifi, F.; Huang, S.H.; Long, G.L.; Yang, L. Highly sensitive detection of nanoparticles with a self-referenced and self-heterodyned whispering-gallery Raman microlaser. Proc. Natl. Acad. Sci. USA 2014, 111, E3836–E3844. [Google Scholar] [CrossRef] [PubMed]
- Li, B.-B.; Clements, W.R.; Yu, X.-C.; Shi, K.; Gong, Q.; Xiao, Y.-F. Single nanoparticle detection using split-mode microcavity Raman lasers. Proc. Natl. Acad. Sci. USA 2014, 111, 14657–14662. [Google Scholar] [CrossRef] [PubMed]
- Shao, L.; Jiang, X.F.; Yu, X.C.; Li, B.B.; Clements, W.R.; Vollmer, F.; Wang, W.; Xiao, Y.F.; Gong, Q. Detection of single nanoparticles and lentiviruses using microcavity resonance broadening. Adv. Mater. 2013, 25, 5616–5620. [Google Scholar] [CrossRef]
- Li, M.; Wu, X.; Liu, L.; Fan, X.; Xu, L. Self-referencing optofluidic ring resonator sensor for highly sensitive biomolecular detection. Anal. Chem. 2013, 85, 9328–9332. [Google Scholar] [CrossRef]
- Ward, J.M.; Yang, Y.; Lei, F.; Yu, X.-C.; Xiao, Y.-F.; Chormaic, S.N. Nanoparticle sensing beyond evanescent field interaction with a quasi-droplet microcavity. Optica 2018, 5, 674–677. [Google Scholar] [CrossRef]
- Liu, S.; Sun, W.; Wang, Y.; Yu, X.; Xu, K.; Huang, Y.; Xiao, S.; Song, Q. End-fire injection of light into high-Q silicon microdisks. Optica 2018, 5, 612–616. [Google Scholar] [CrossRef]
- Li, H.; Fan, X. Characterization of sensing capability of optofluidic ring resonator biosensors. Appl. Phys. Lett. 2010, 97, 011105. [Google Scholar] [CrossRef]
- Sun, Y.; Fan, X. Optical ring resonators for biochemical and chemical sensing. Ana. Bioanal. Chem. 2011, 399, 205–211. [Google Scholar] [CrossRef]
- Wu, X.; Li, H.; Liu, L.; Xu, L. High Quality Direct Photo-Patterned Microdisk Lasers with Organic–Inorganic Hybrid Materials. IEEE J. Quant. Electr. 2007, 44, 75–80. [Google Scholar] [CrossRef]
- Wang, H.; Liu, S.; Chen, L.; Shen, D.; Wu, X. Dual-wavelength single-frequency laser emission in asymmetric coupled microdisks. Sci. Rep. 2016, 6, 38053. [Google Scholar] [CrossRef]
- Oxborrow, M. Traceable 2-D finite-element simulation of the whispering-gallery modes of axisymmetric electromagnetic resonators. IEEE Trans. Microw. Theory 2007, 55, 1209–1218. [Google Scholar] [CrossRef]
- Wan, L.; Chandrahalim, H.; Chen, C.; Chen, Q.; Mei, T.; Oki, Y.; Nishimura, N.; Guo, L.J.; Fan, X. On-chip, high-sensitivity temperature sensors based on dye-doped solid-state polymer microring lasers. Appl. Phys. Lett. 2017, 111, 061109. [Google Scholar] [CrossRef]
- Zhang, Y.; Liu, P.; Zhang, S.; Liu, W.; Chen, J.; Shi, Y. High sensitivity temperature sensor based on cascaded silicon photonic crystal nanobeam cavities. Opt. Express 2016, 24, 23037–23043. [Google Scholar] [CrossRef] [PubMed]
- Guha, B.; Cardenas, J.; Lipson, M. Athermal silicon microring resonators with titanium oxide cladding. Opt. Express 2013, 21, 26557–26563. [Google Scholar] [CrossRef] [PubMed]
- Kim, E.; Foreman, M.R.; Baaske, M.D.; Vollmer, F. Thermal characterisation of (bio)polymers with a temperature-stabilised whispering gallery mode microsensor. Appl. Phys. Lett. 2015, 106, 20701. [Google Scholar] [CrossRef]
- Ward, J.M.; Yang, Y.; Chormaic, S.N. Highly sensitive temperature measurements with liquid-core microbubble resonators. IEEE Photonic Technol. Lett. 2013, 25, 2350–2353. [Google Scholar] [CrossRef]
- Peng, G.D.; Xiong, Z.; Chu, P.L. Fluorescence decay and recovery in organic dye-doped polymer optical fibers. J. Lightw. Technol. 1998, 16, 2365–2372. [Google Scholar] [CrossRef]
- Gupta, G.; Steier, W.H.; Liao, Y.; Luo, J.; Dalton, L.R.; Jen, A.K.Y. Modeling Photobleaching of Optical Chromophores: Light-Intensity Effects in Precise Trimming of Integrated Polymer Devices†. J. Phys. Chem. C 2008, 113, 8051–8060. [Google Scholar] [CrossRef]
- Poon, J.K.; Huang, Y.; Paloczi, G.T.; Yariv, A.; Zhang, C.; Dalton, L.R. Wide-range tuning of polymer microring resonators by the photobleaching of CLD-1 chromophores. Opt. Lett. 2004, 29, 2584–2586. [Google Scholar] [CrossRef]
- Wondimu, S.F.; Hippler, M.; Hussal, C.; Hofmann, A.; KrãMmer, S.; Lahann, J.; Kalt, H.; Freude, W.; Koos, C. Robust label-free biosensing using microdisk laser arrays with on-chip references. Opt. Express 2018, 26, 3161–3173. [Google Scholar] [CrossRef]
- Liu, Z.; Liu, L.; Zhu, Z.; Zhang, Y.; Wei, Y.; Zhang, X.; Zhao, E.; Zhang, Y.; Yang, J.; Yuan, L. Whispering gallery mode temperature sensor of liquid microresonastor. Opt. Lett. 2016, 41, 4649–4652. [Google Scholar] [CrossRef]
© 2019 by the authors. Licensee MDPI, Basel, Switzerland. This article is an open access article distributed under the terms and conditions of the Creative Commons Attribution (CC BY) license (http://creativecommons.org/licenses/by/4.0/).


