Pt Cluster Modified h-BN for Gas Sensing and Adsorption of Dissolved Gases in Transformer Oil: A Density Functional Theory Study


Abstract
1. Introduction
2. Computational Details
3. Results and Discussions
3.1. Optimized Structure of Gas Molecules and Intrinsic h-BN
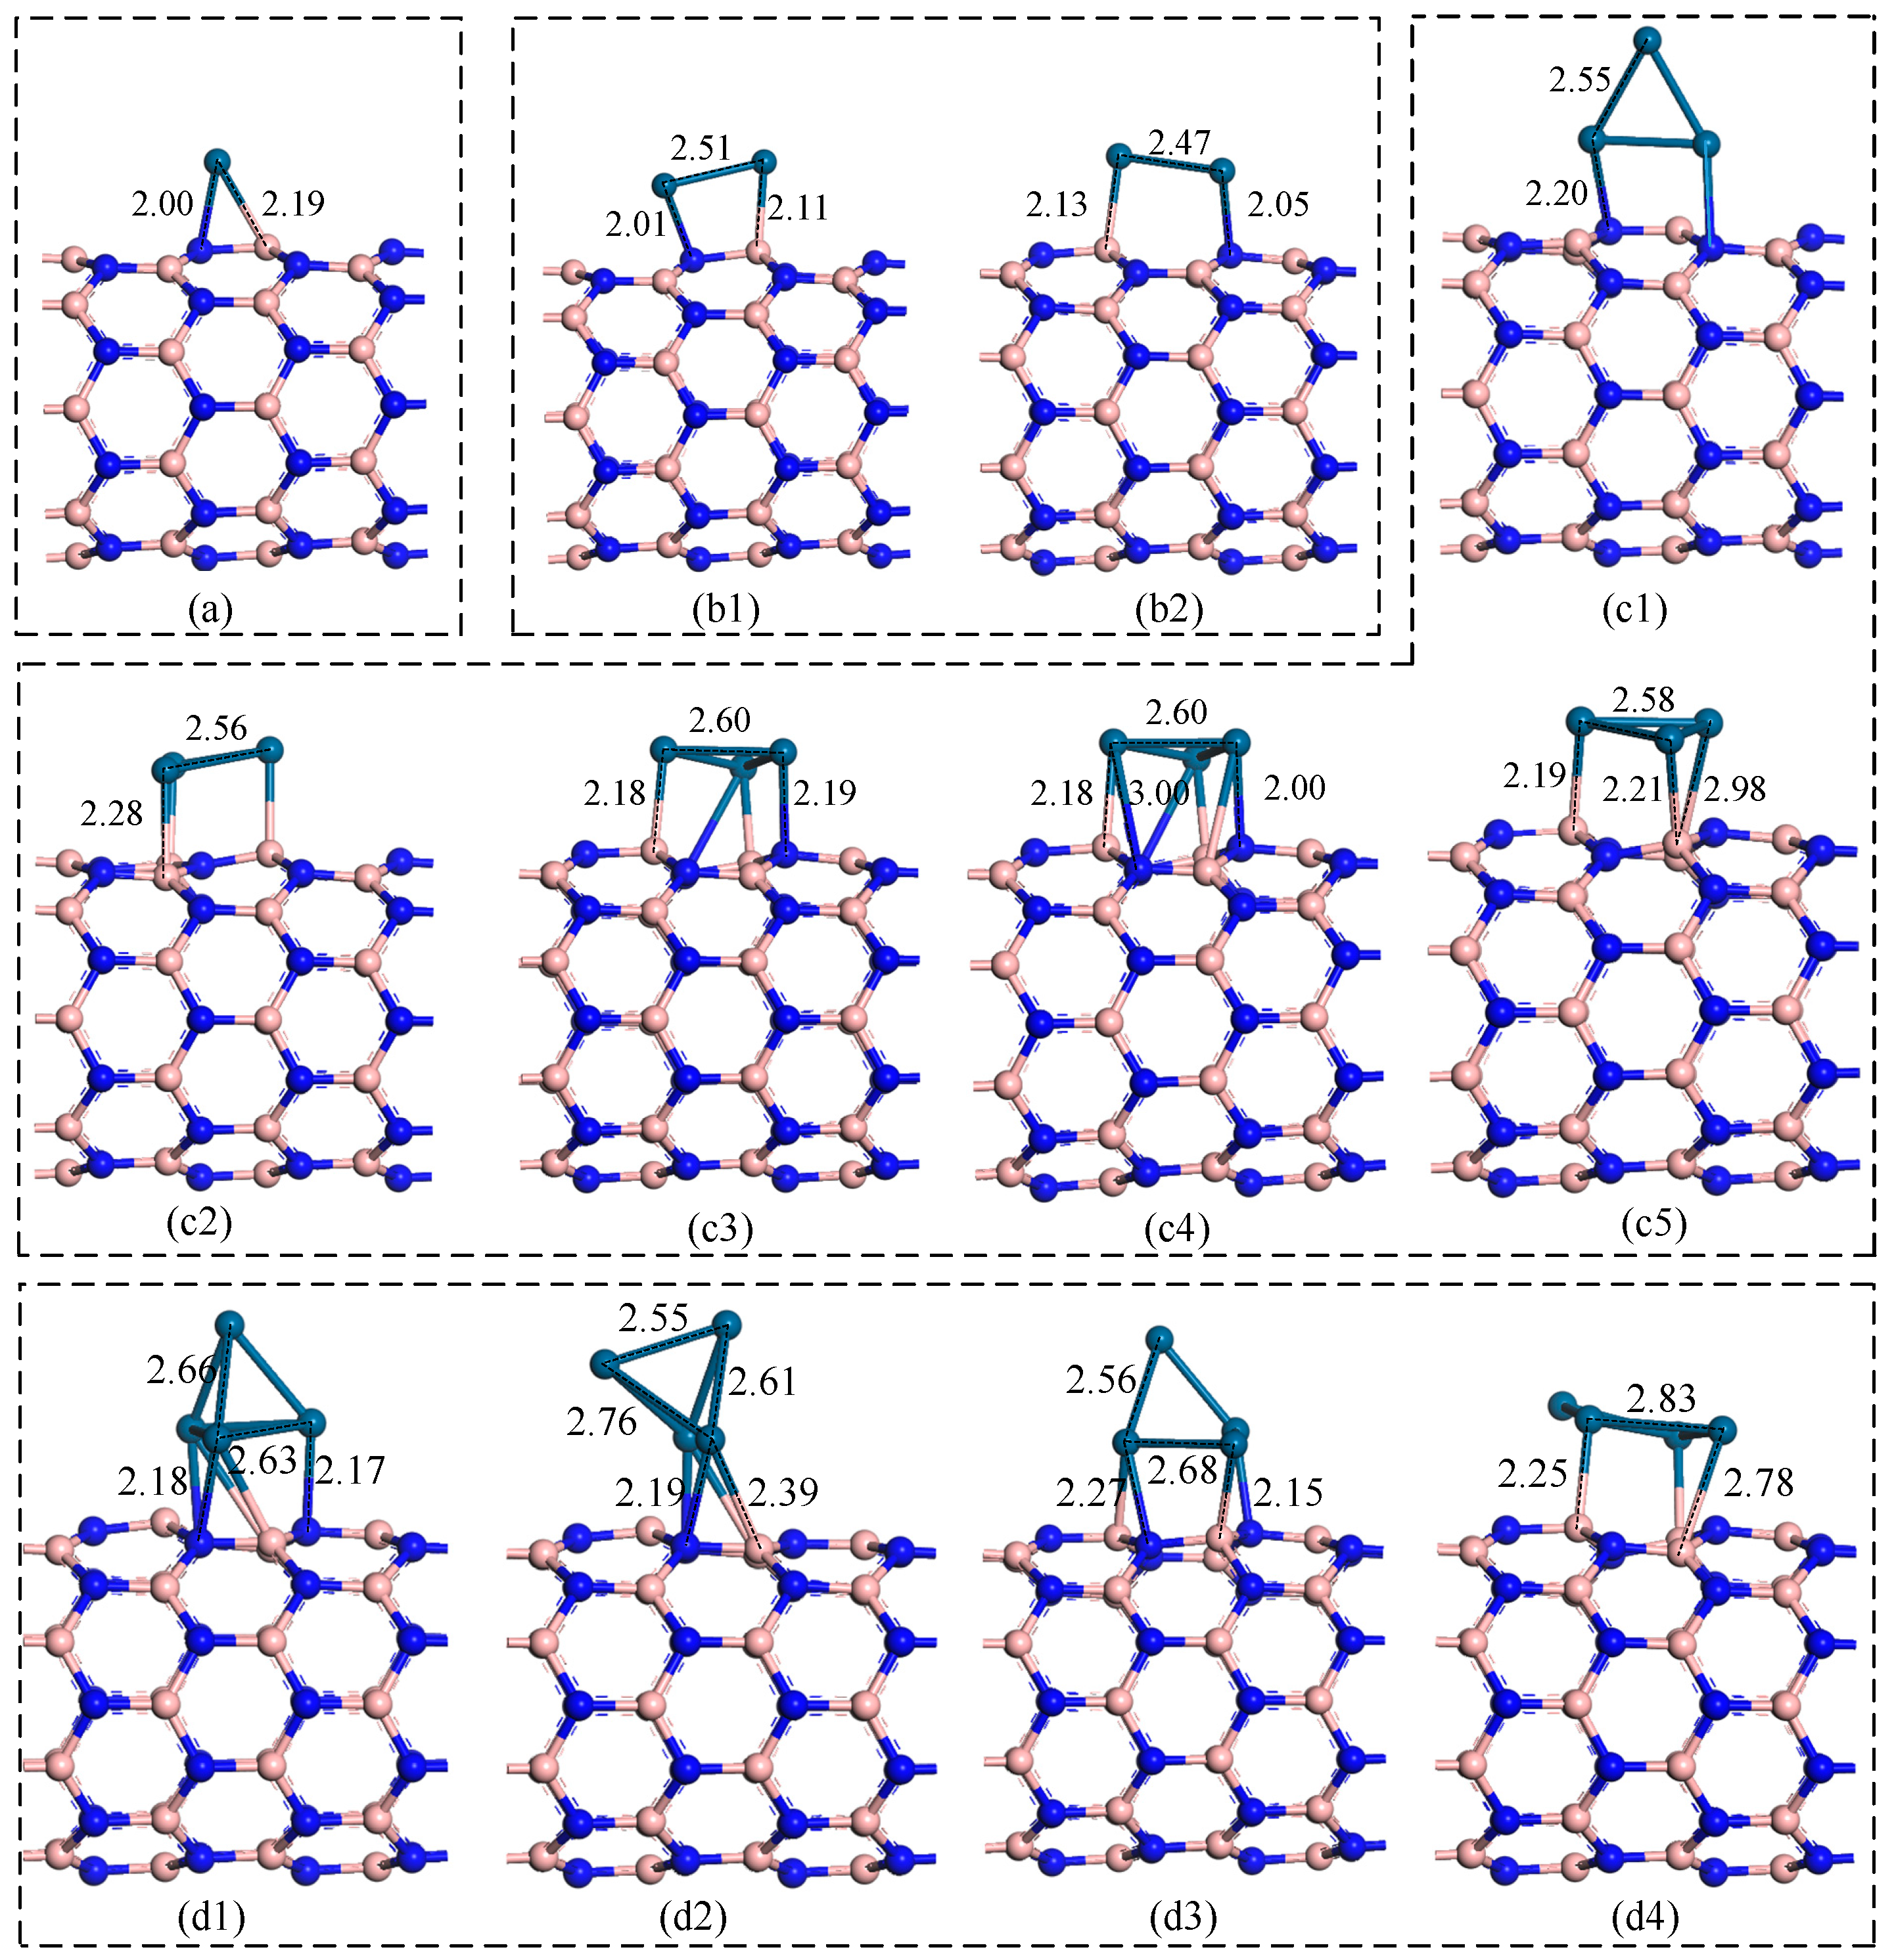
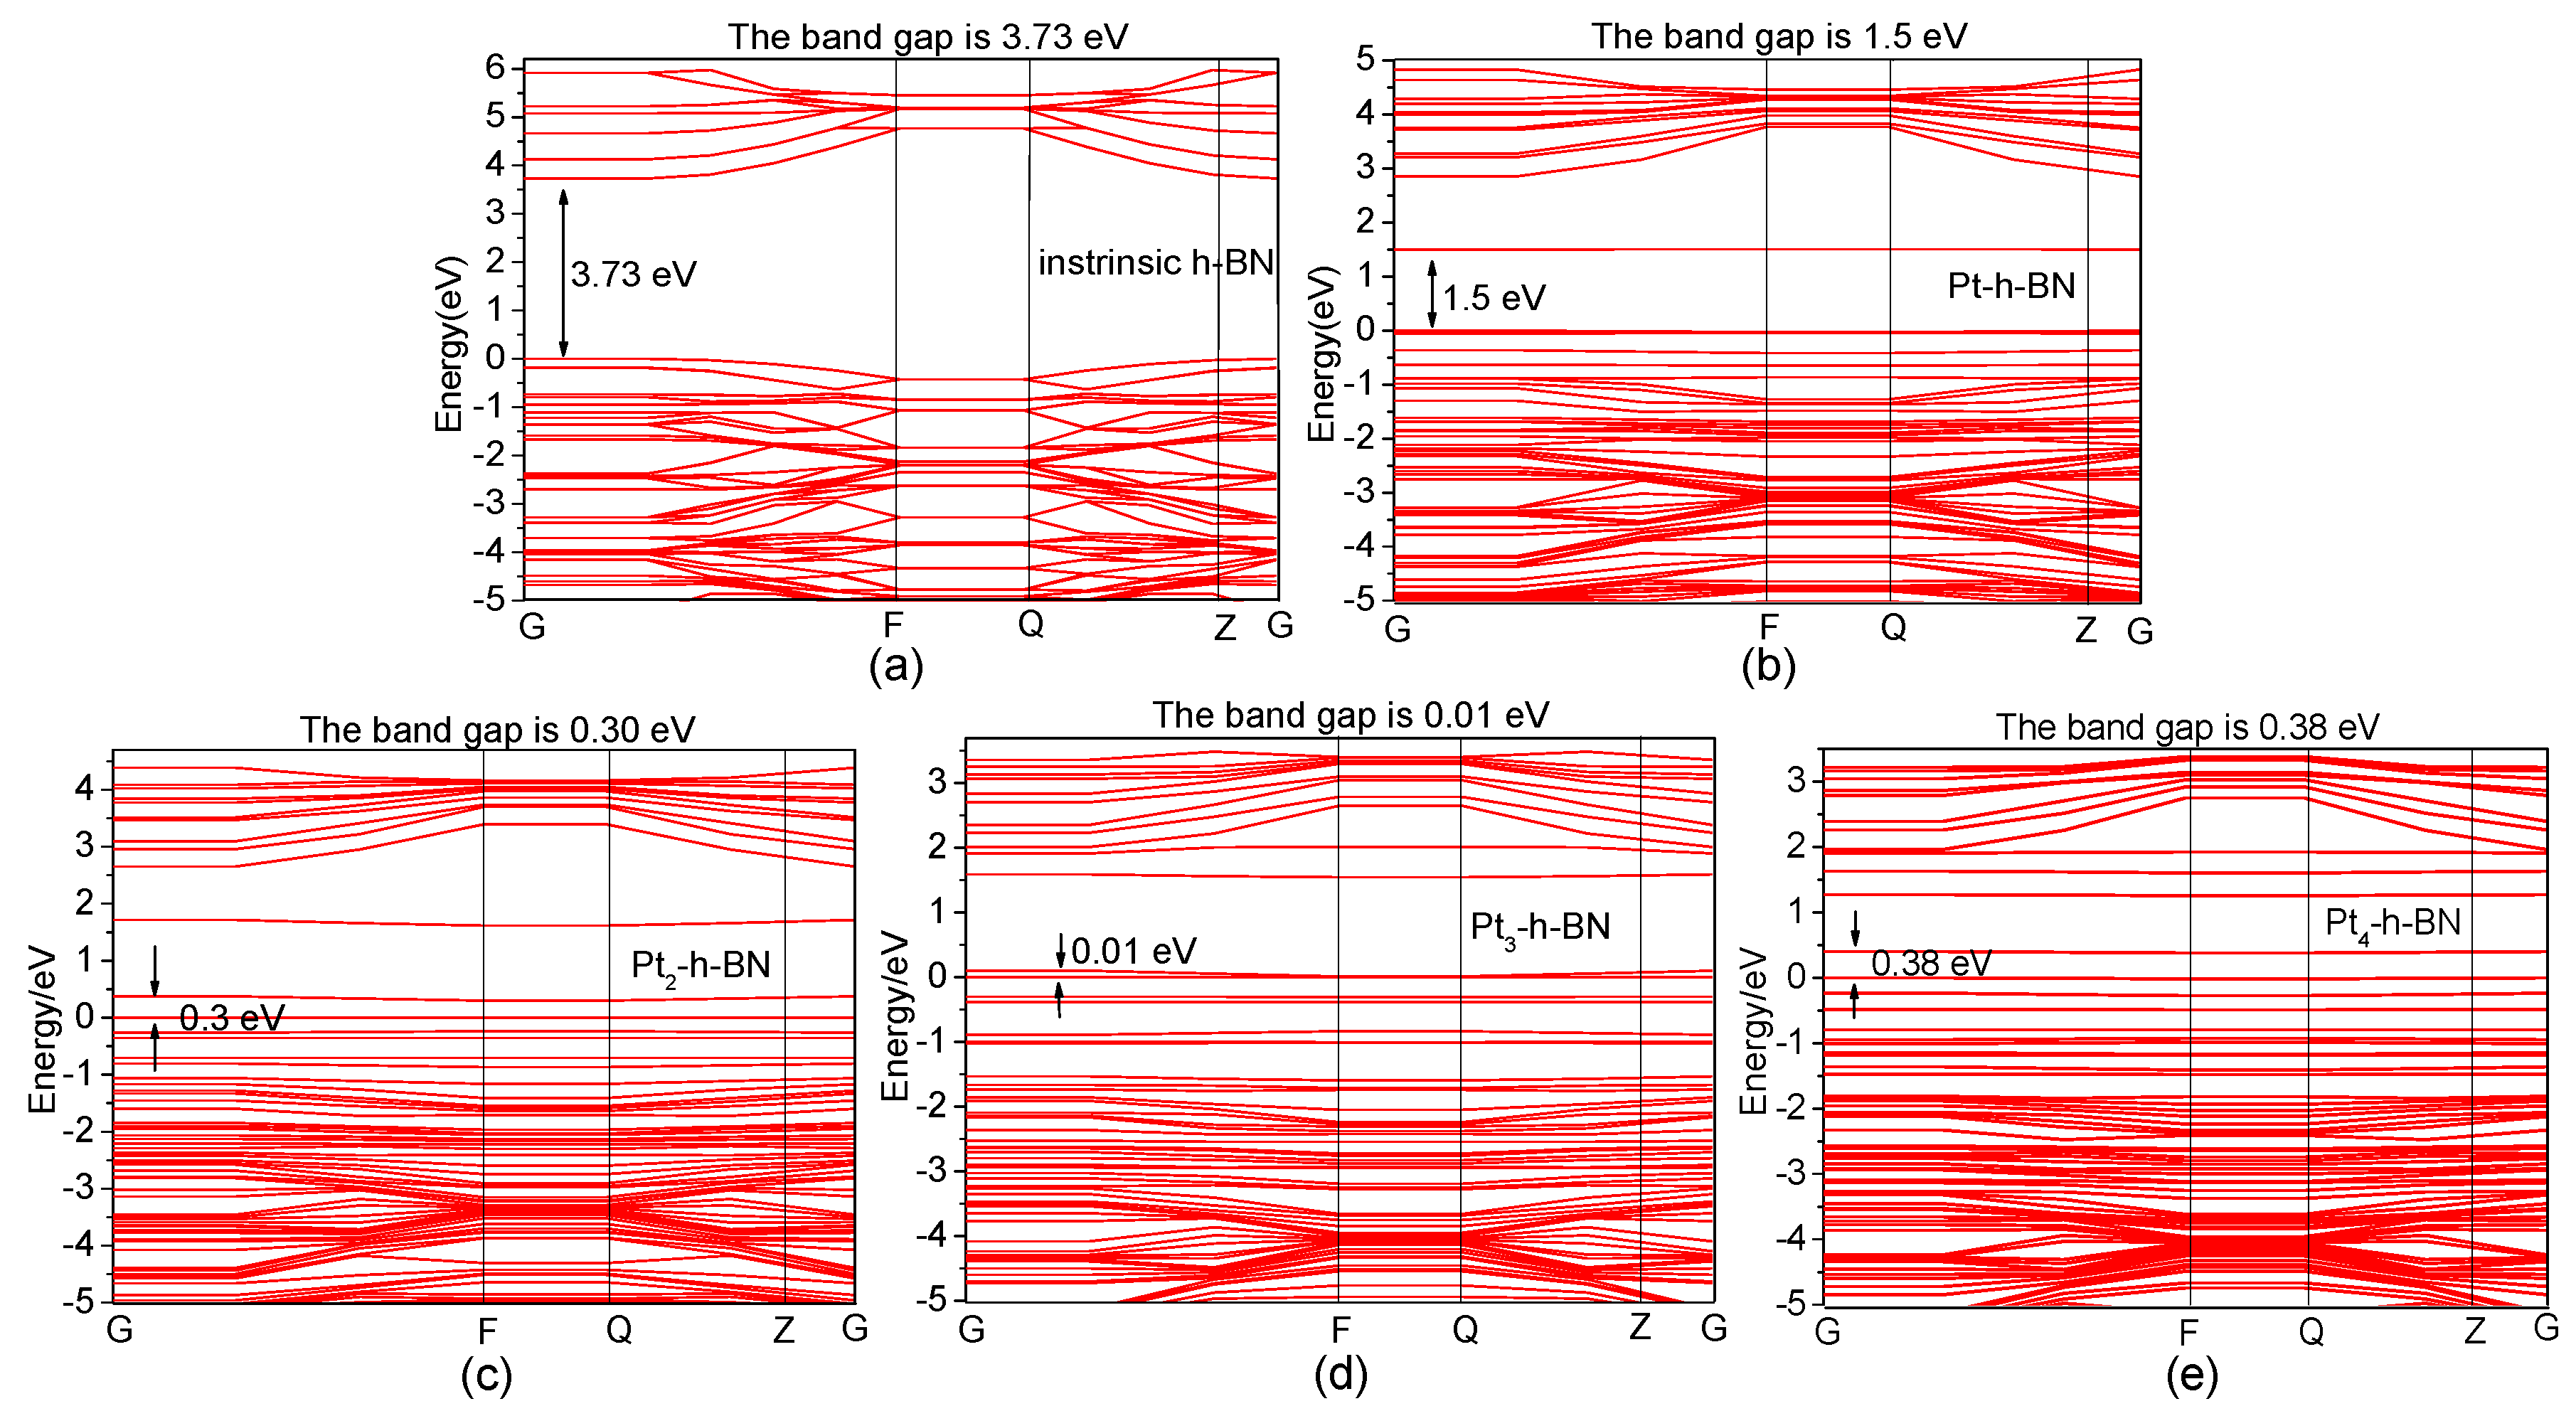
3.2. Pt Cluster Modified h-BN
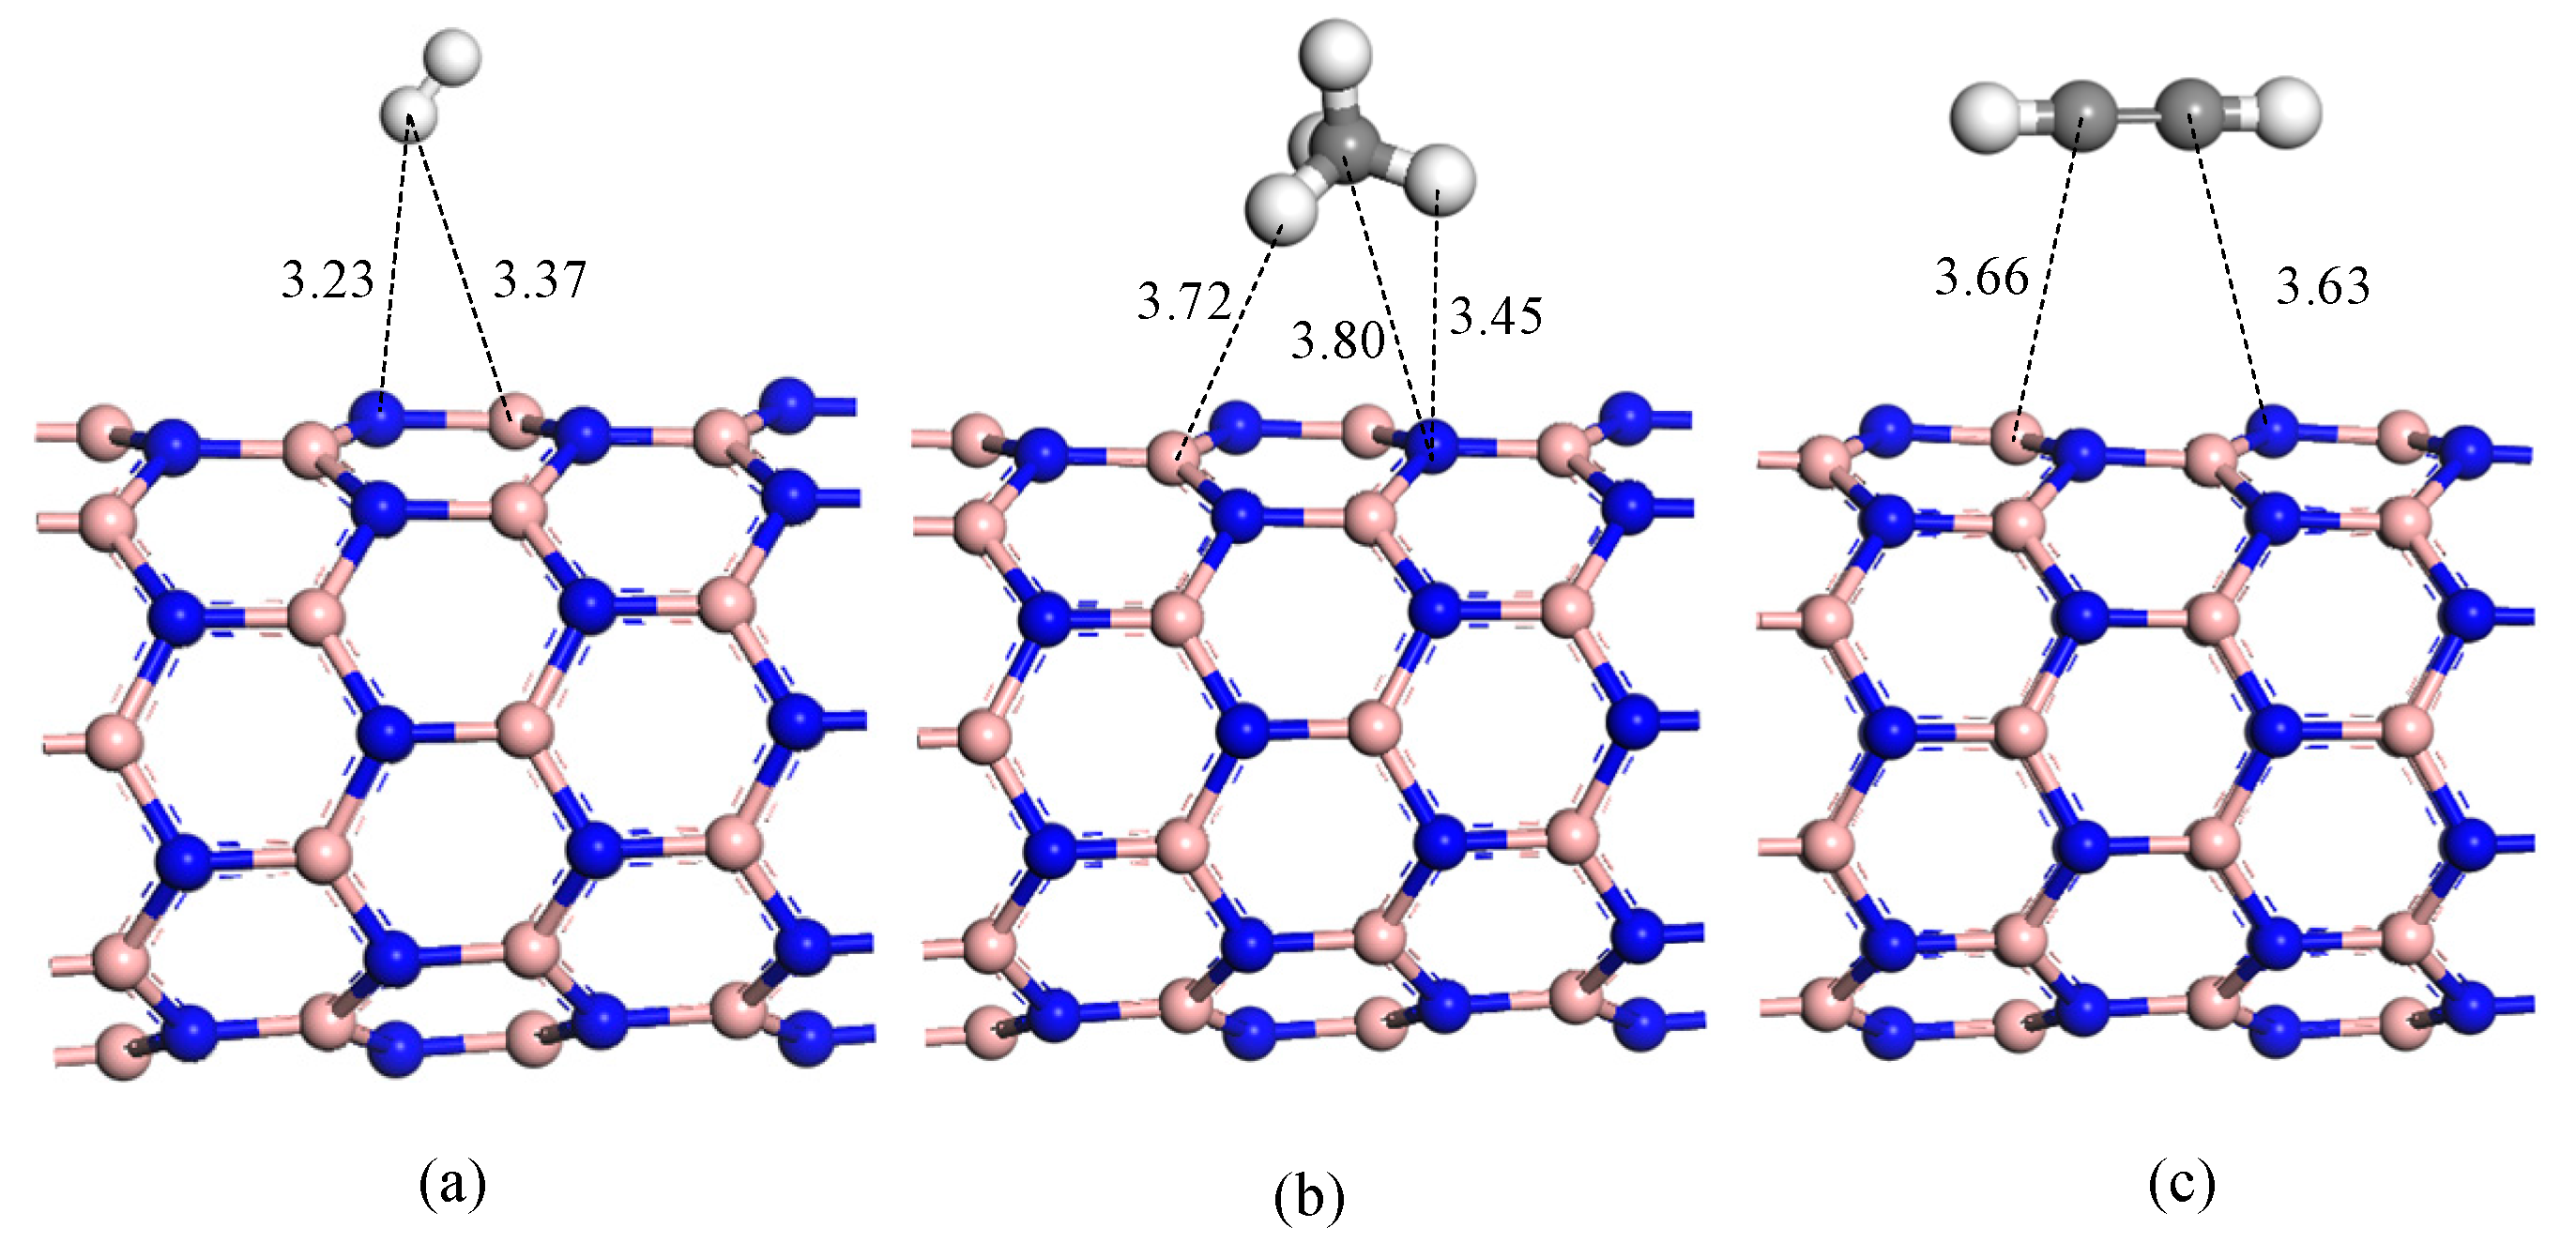
3.3. Adsorption of H2, CH4, C2H2 on the Surface of Intrinsic h-BN
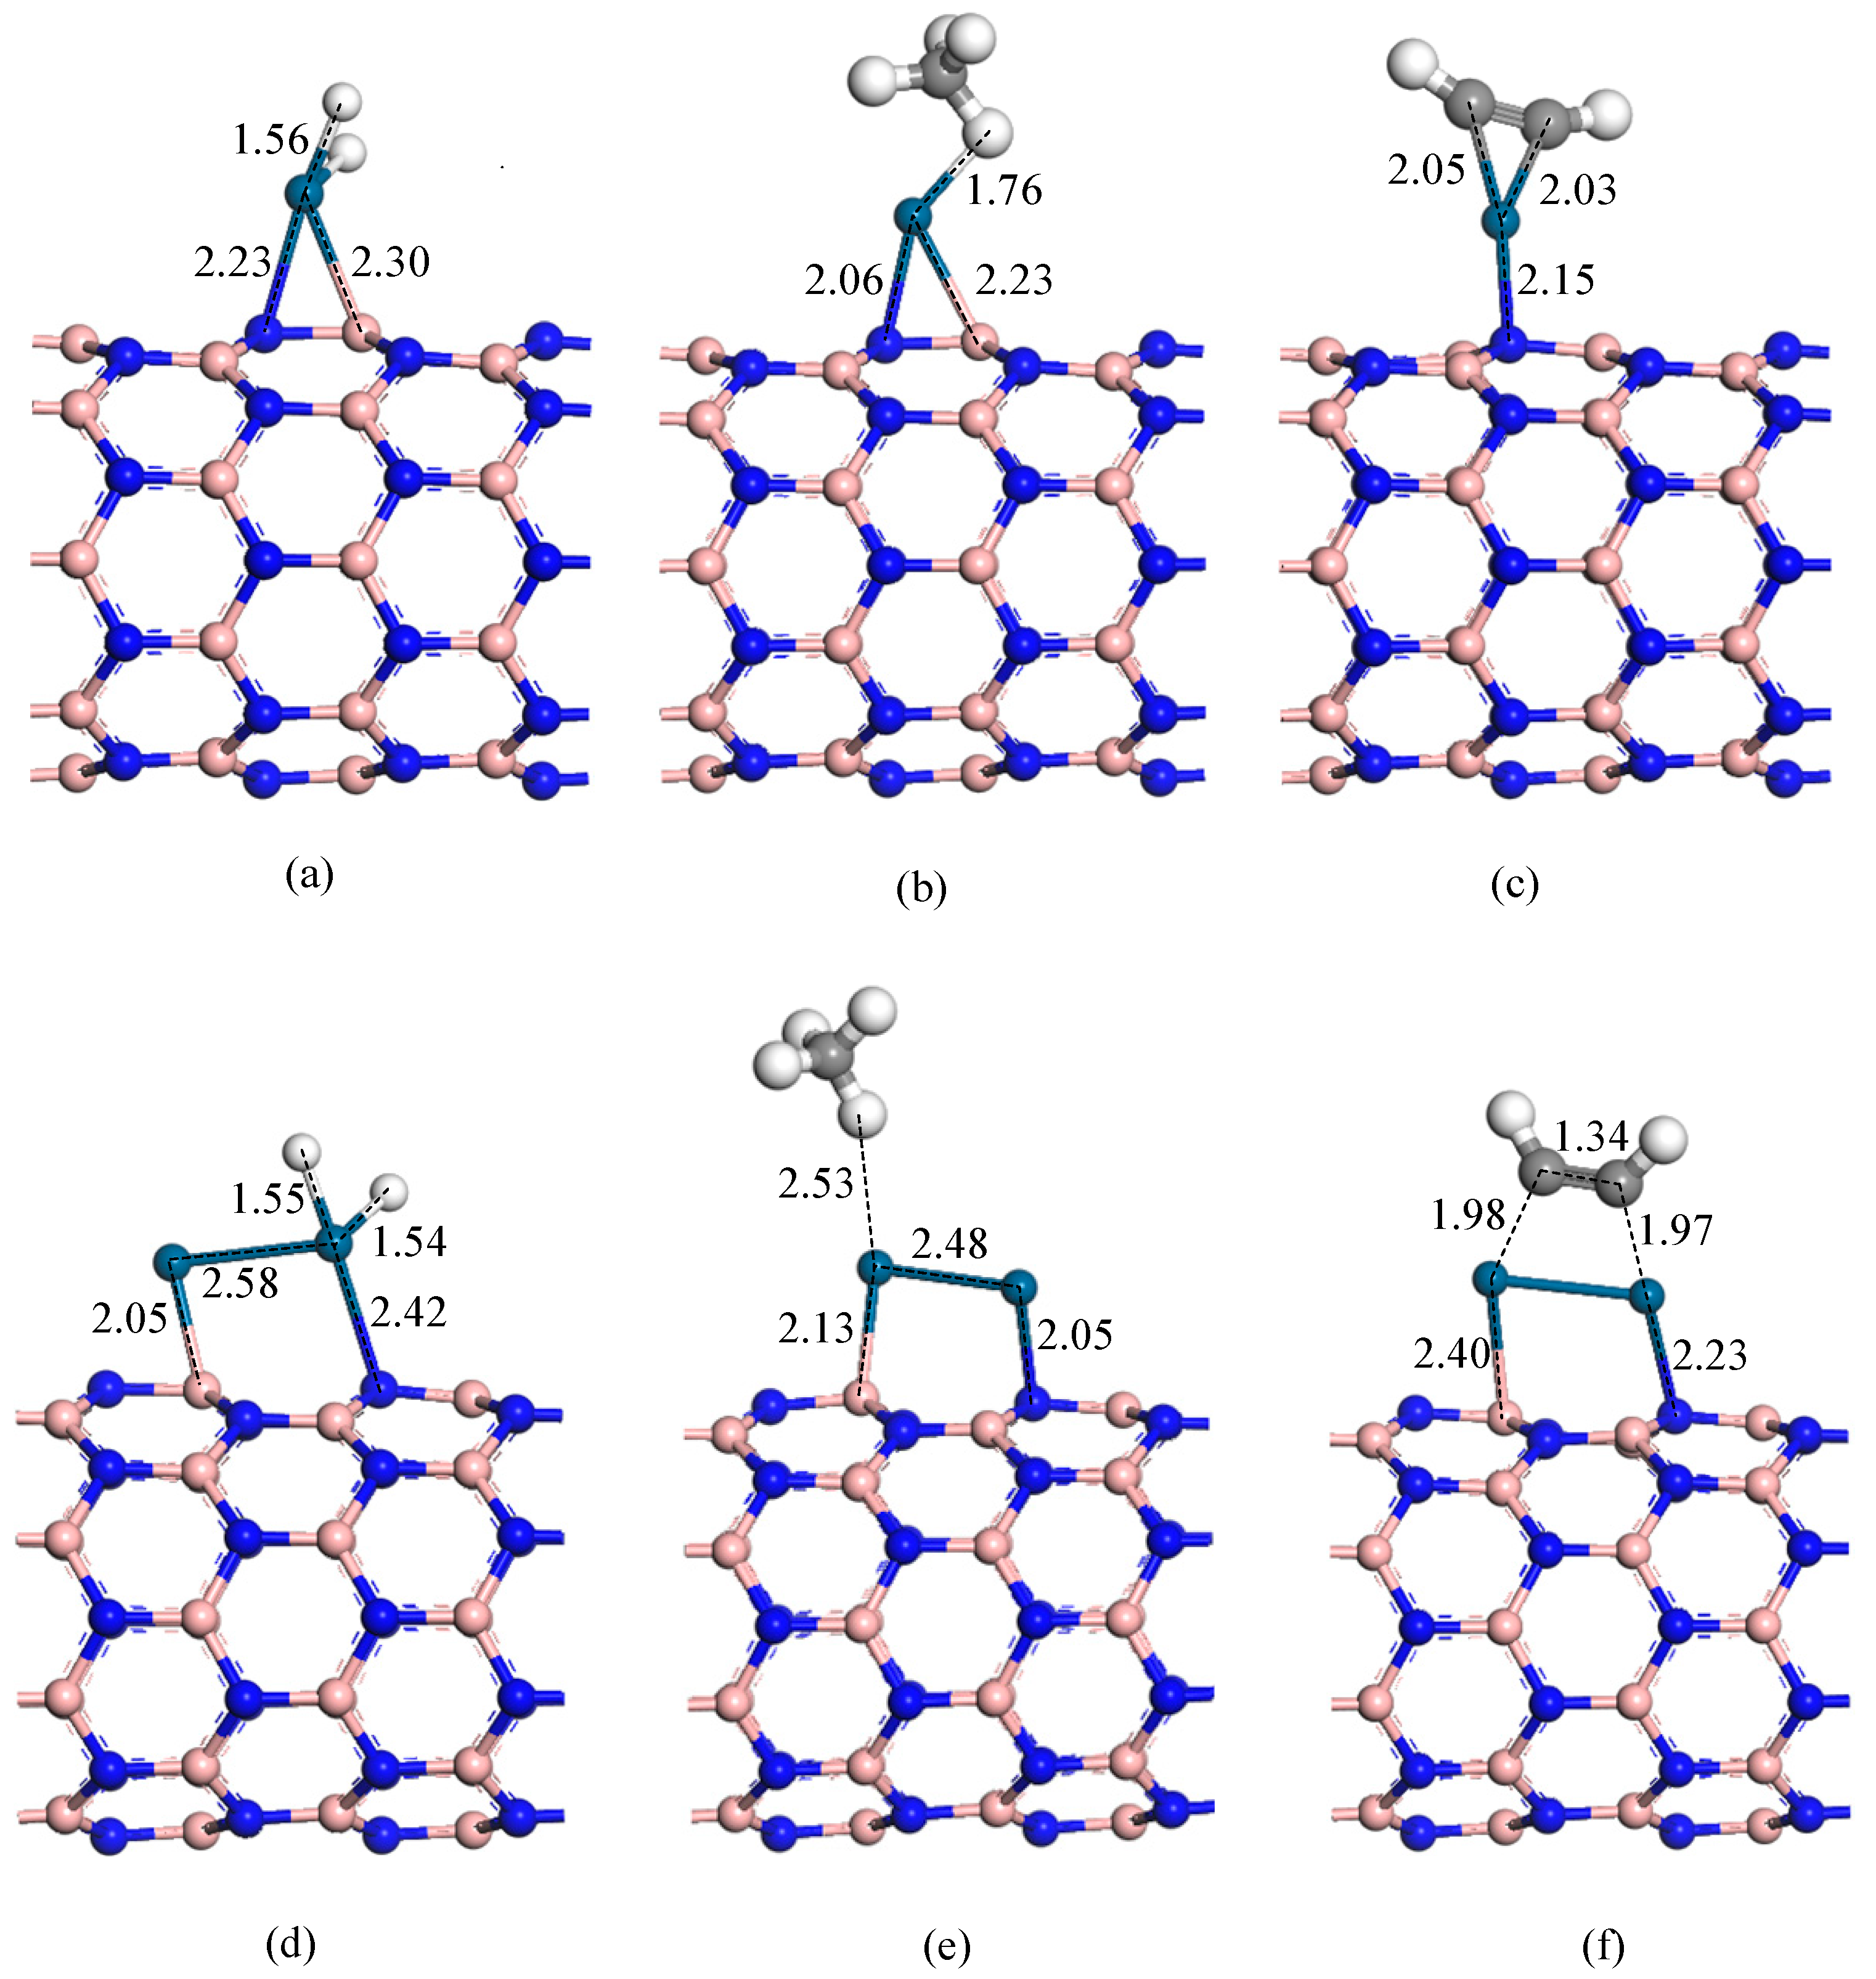
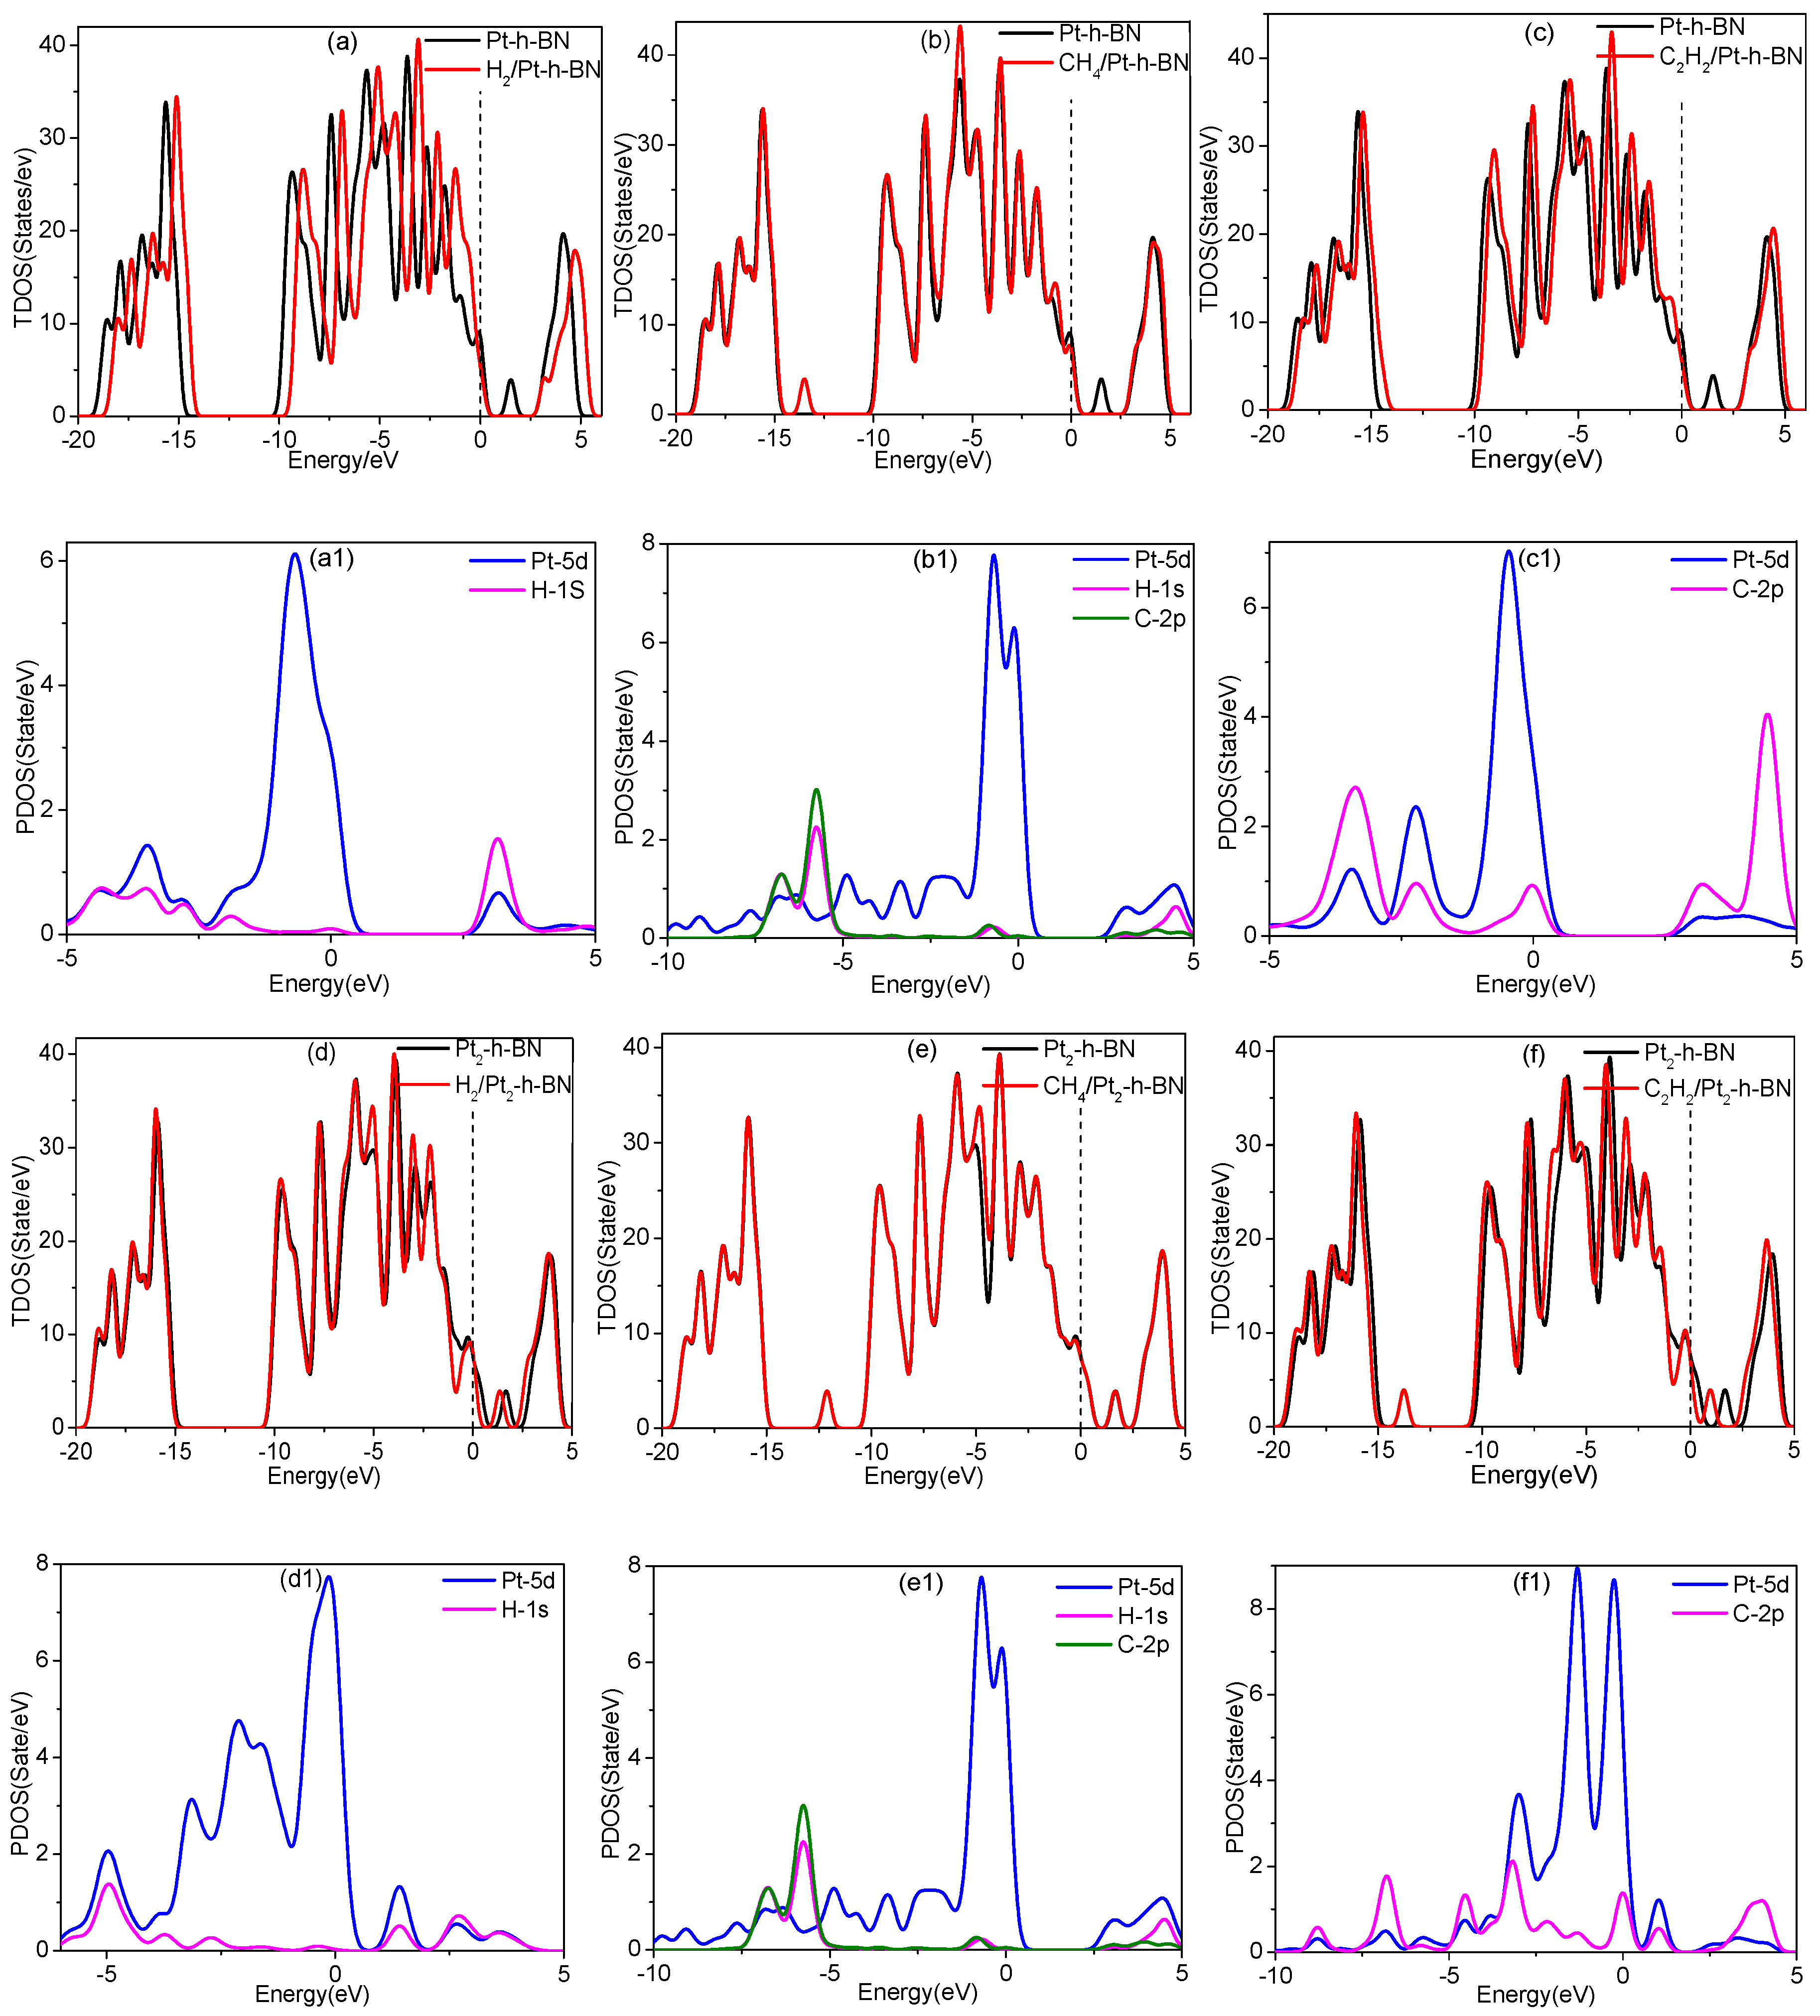
3.4. Adsorption of Gas Molecules on Pt, Pt2 Doped h-BN
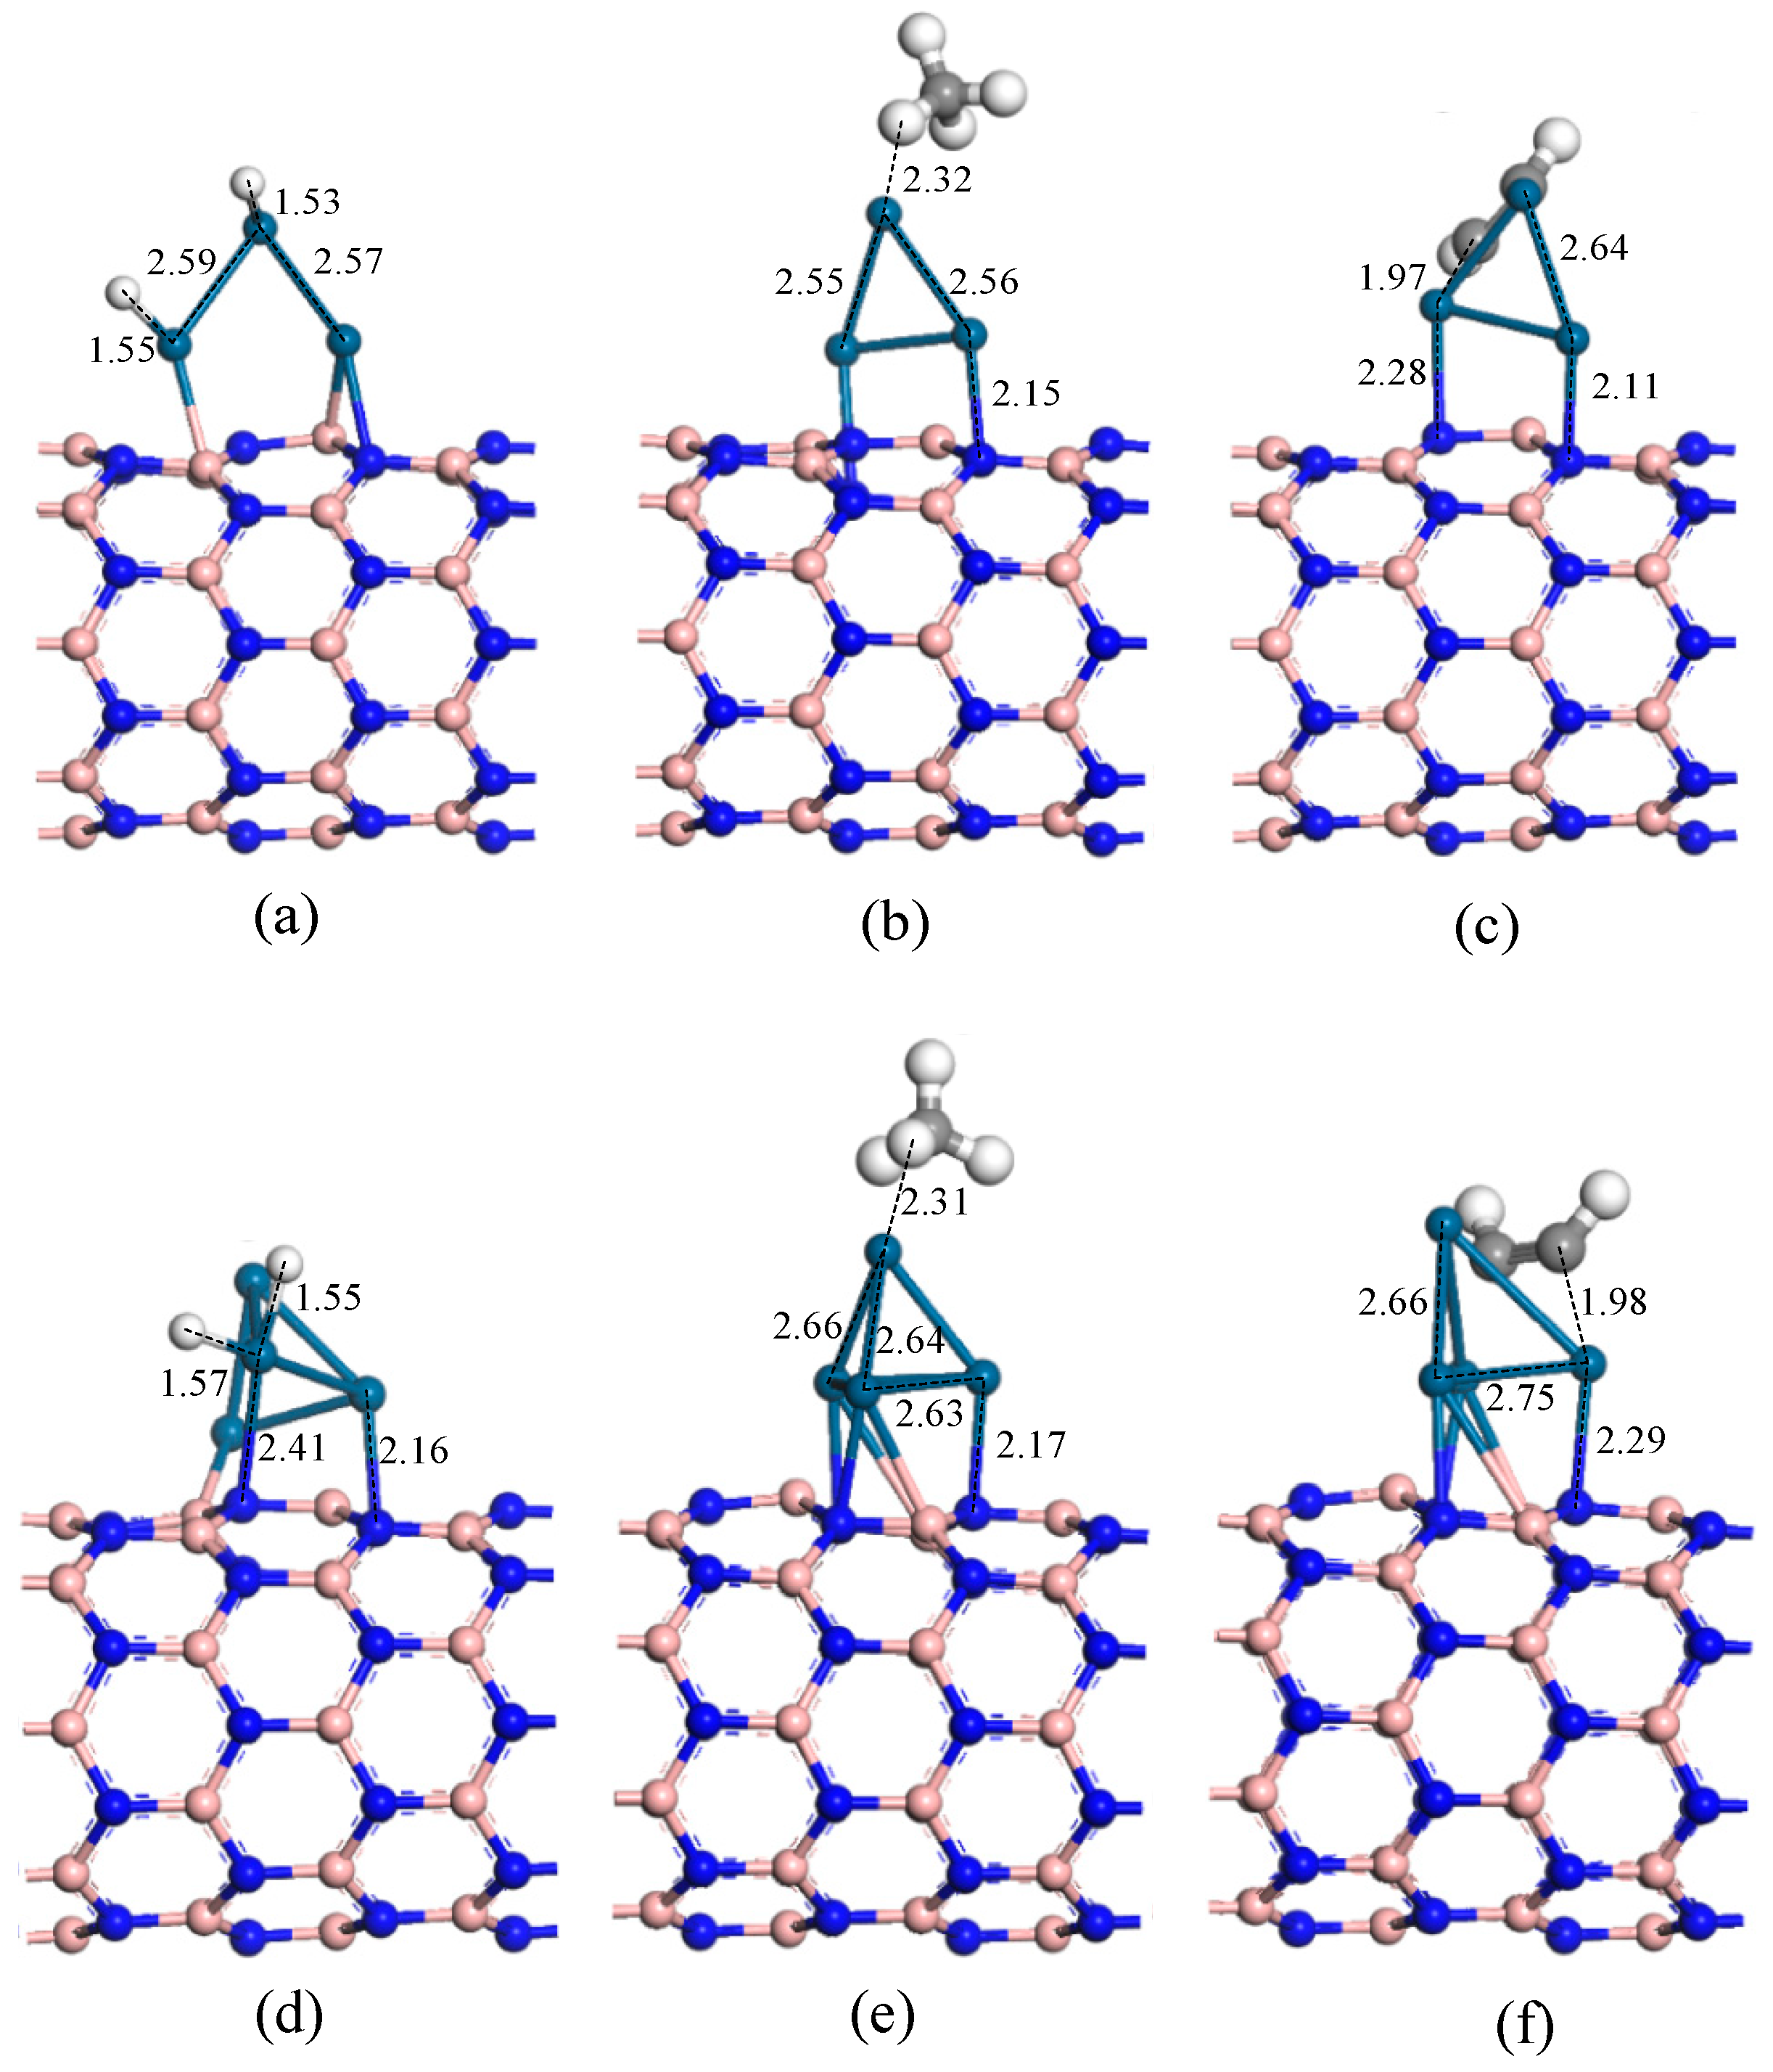
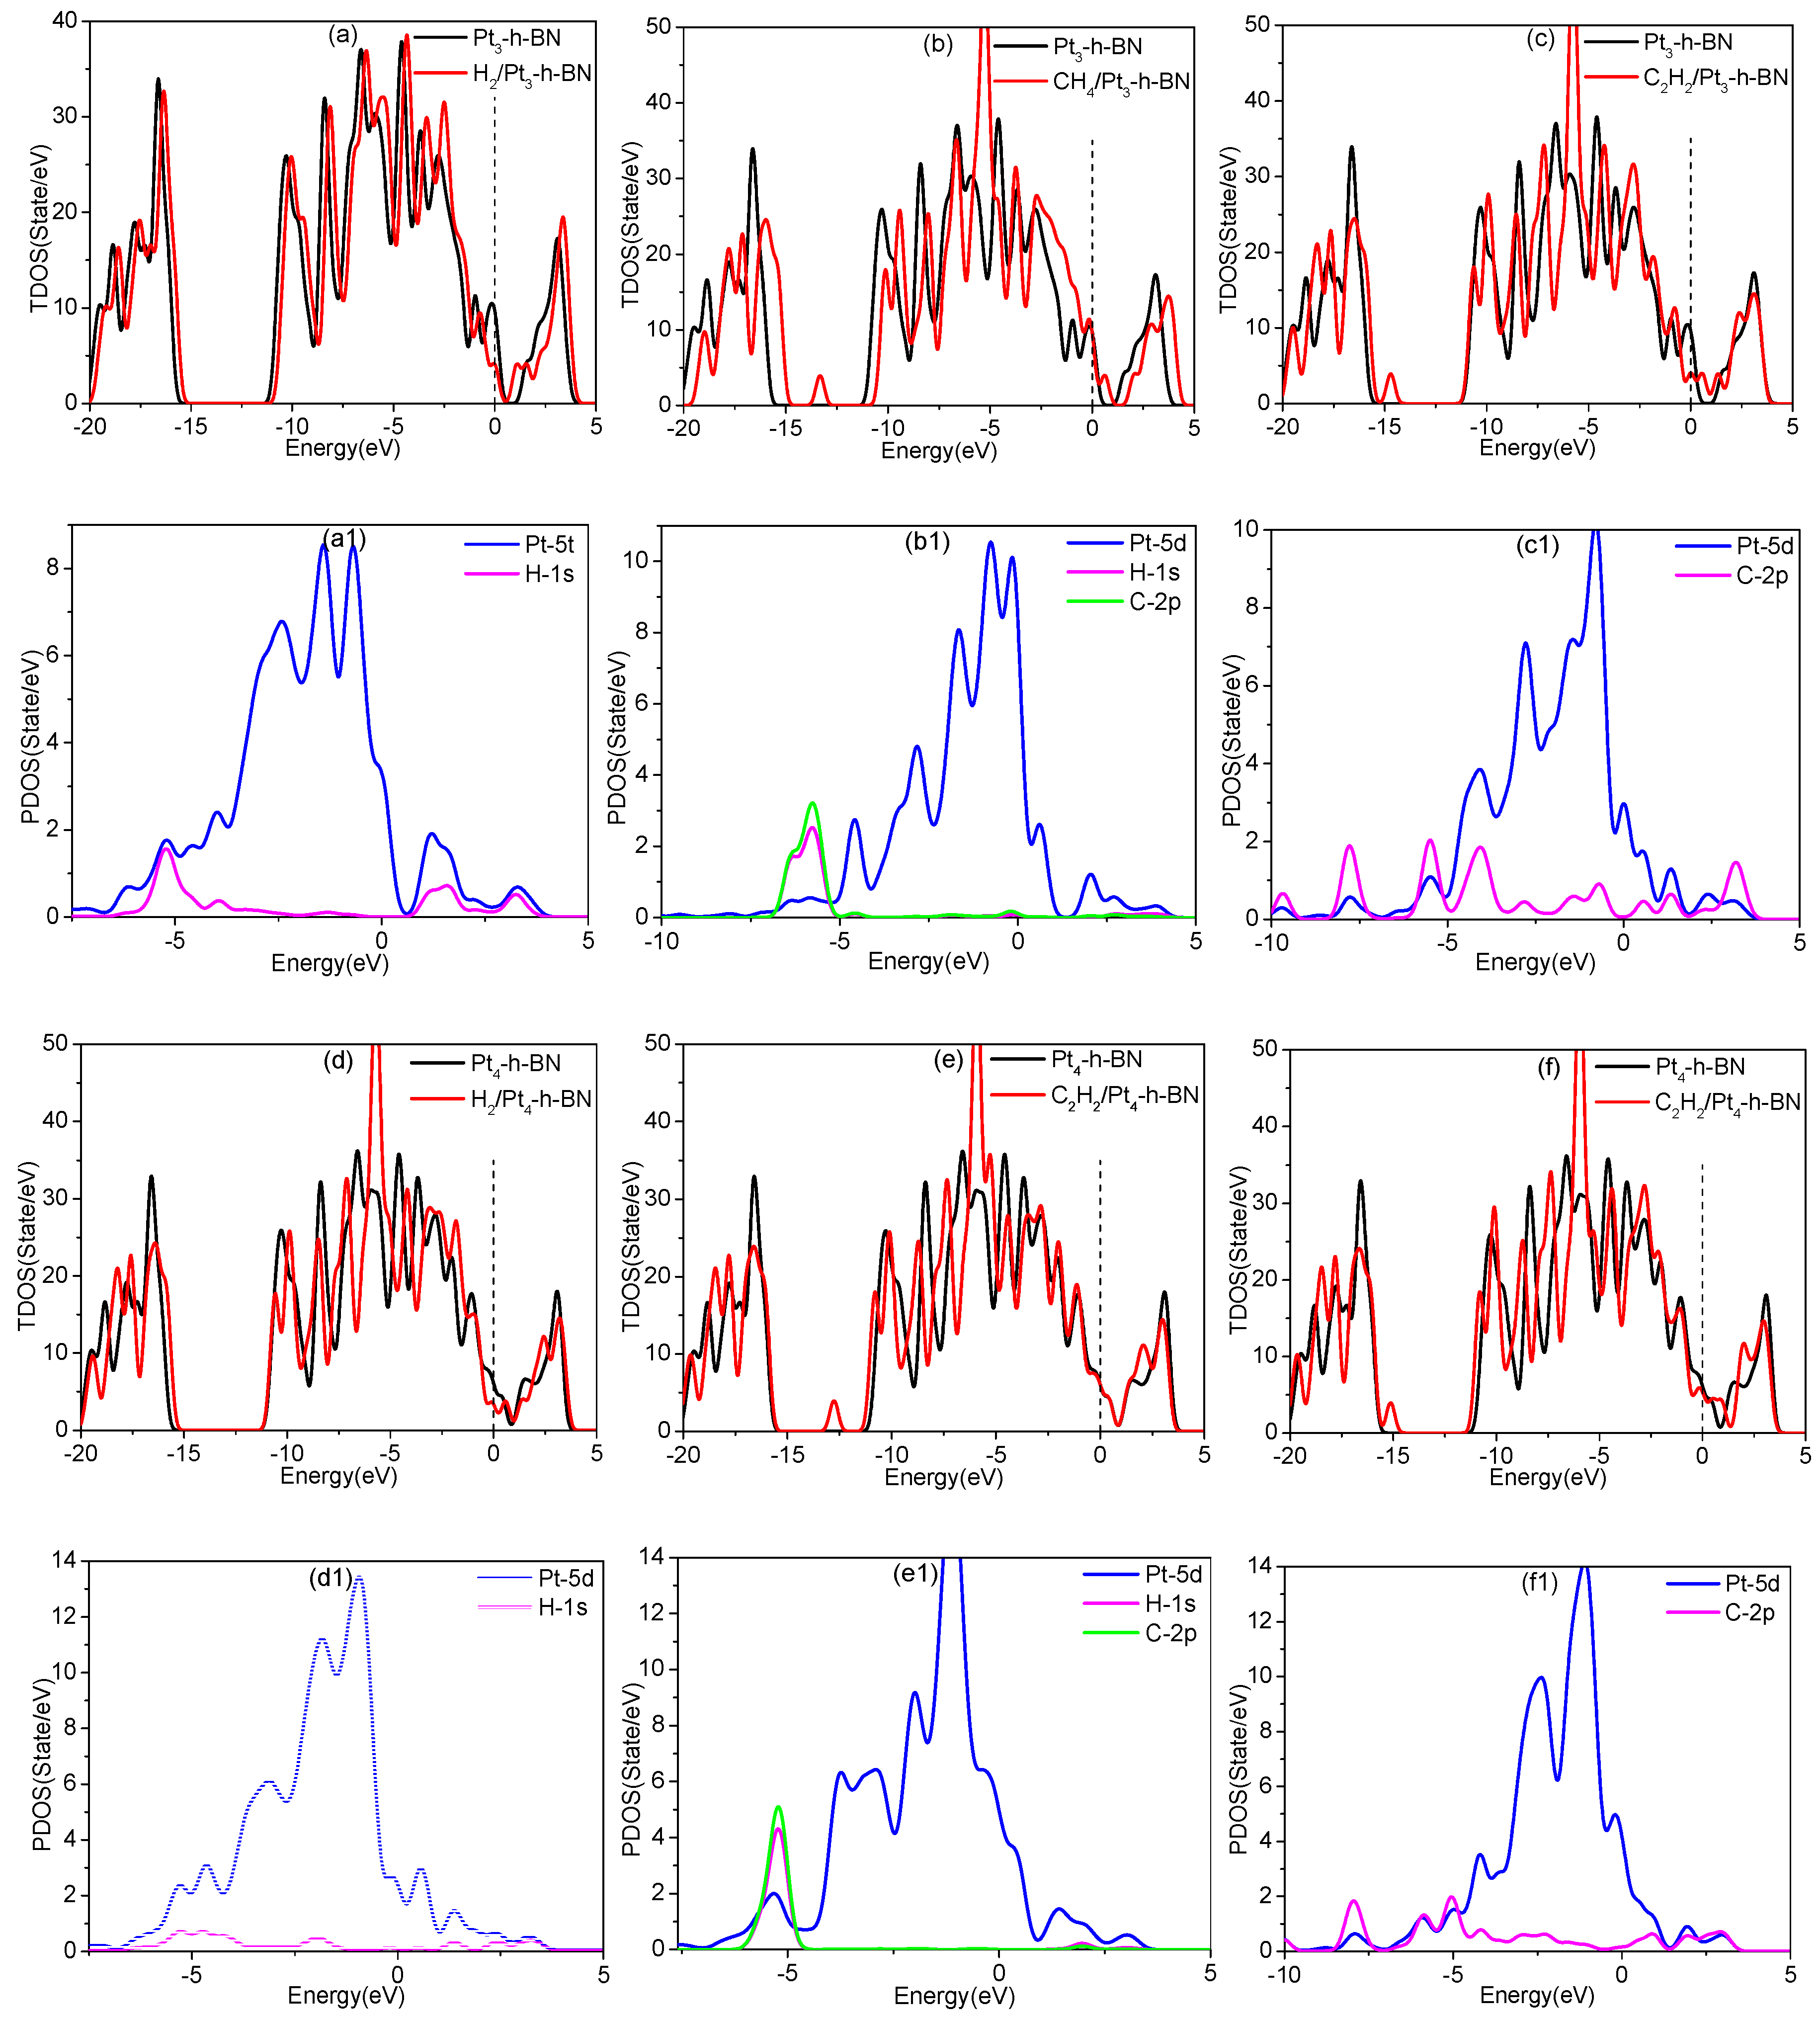
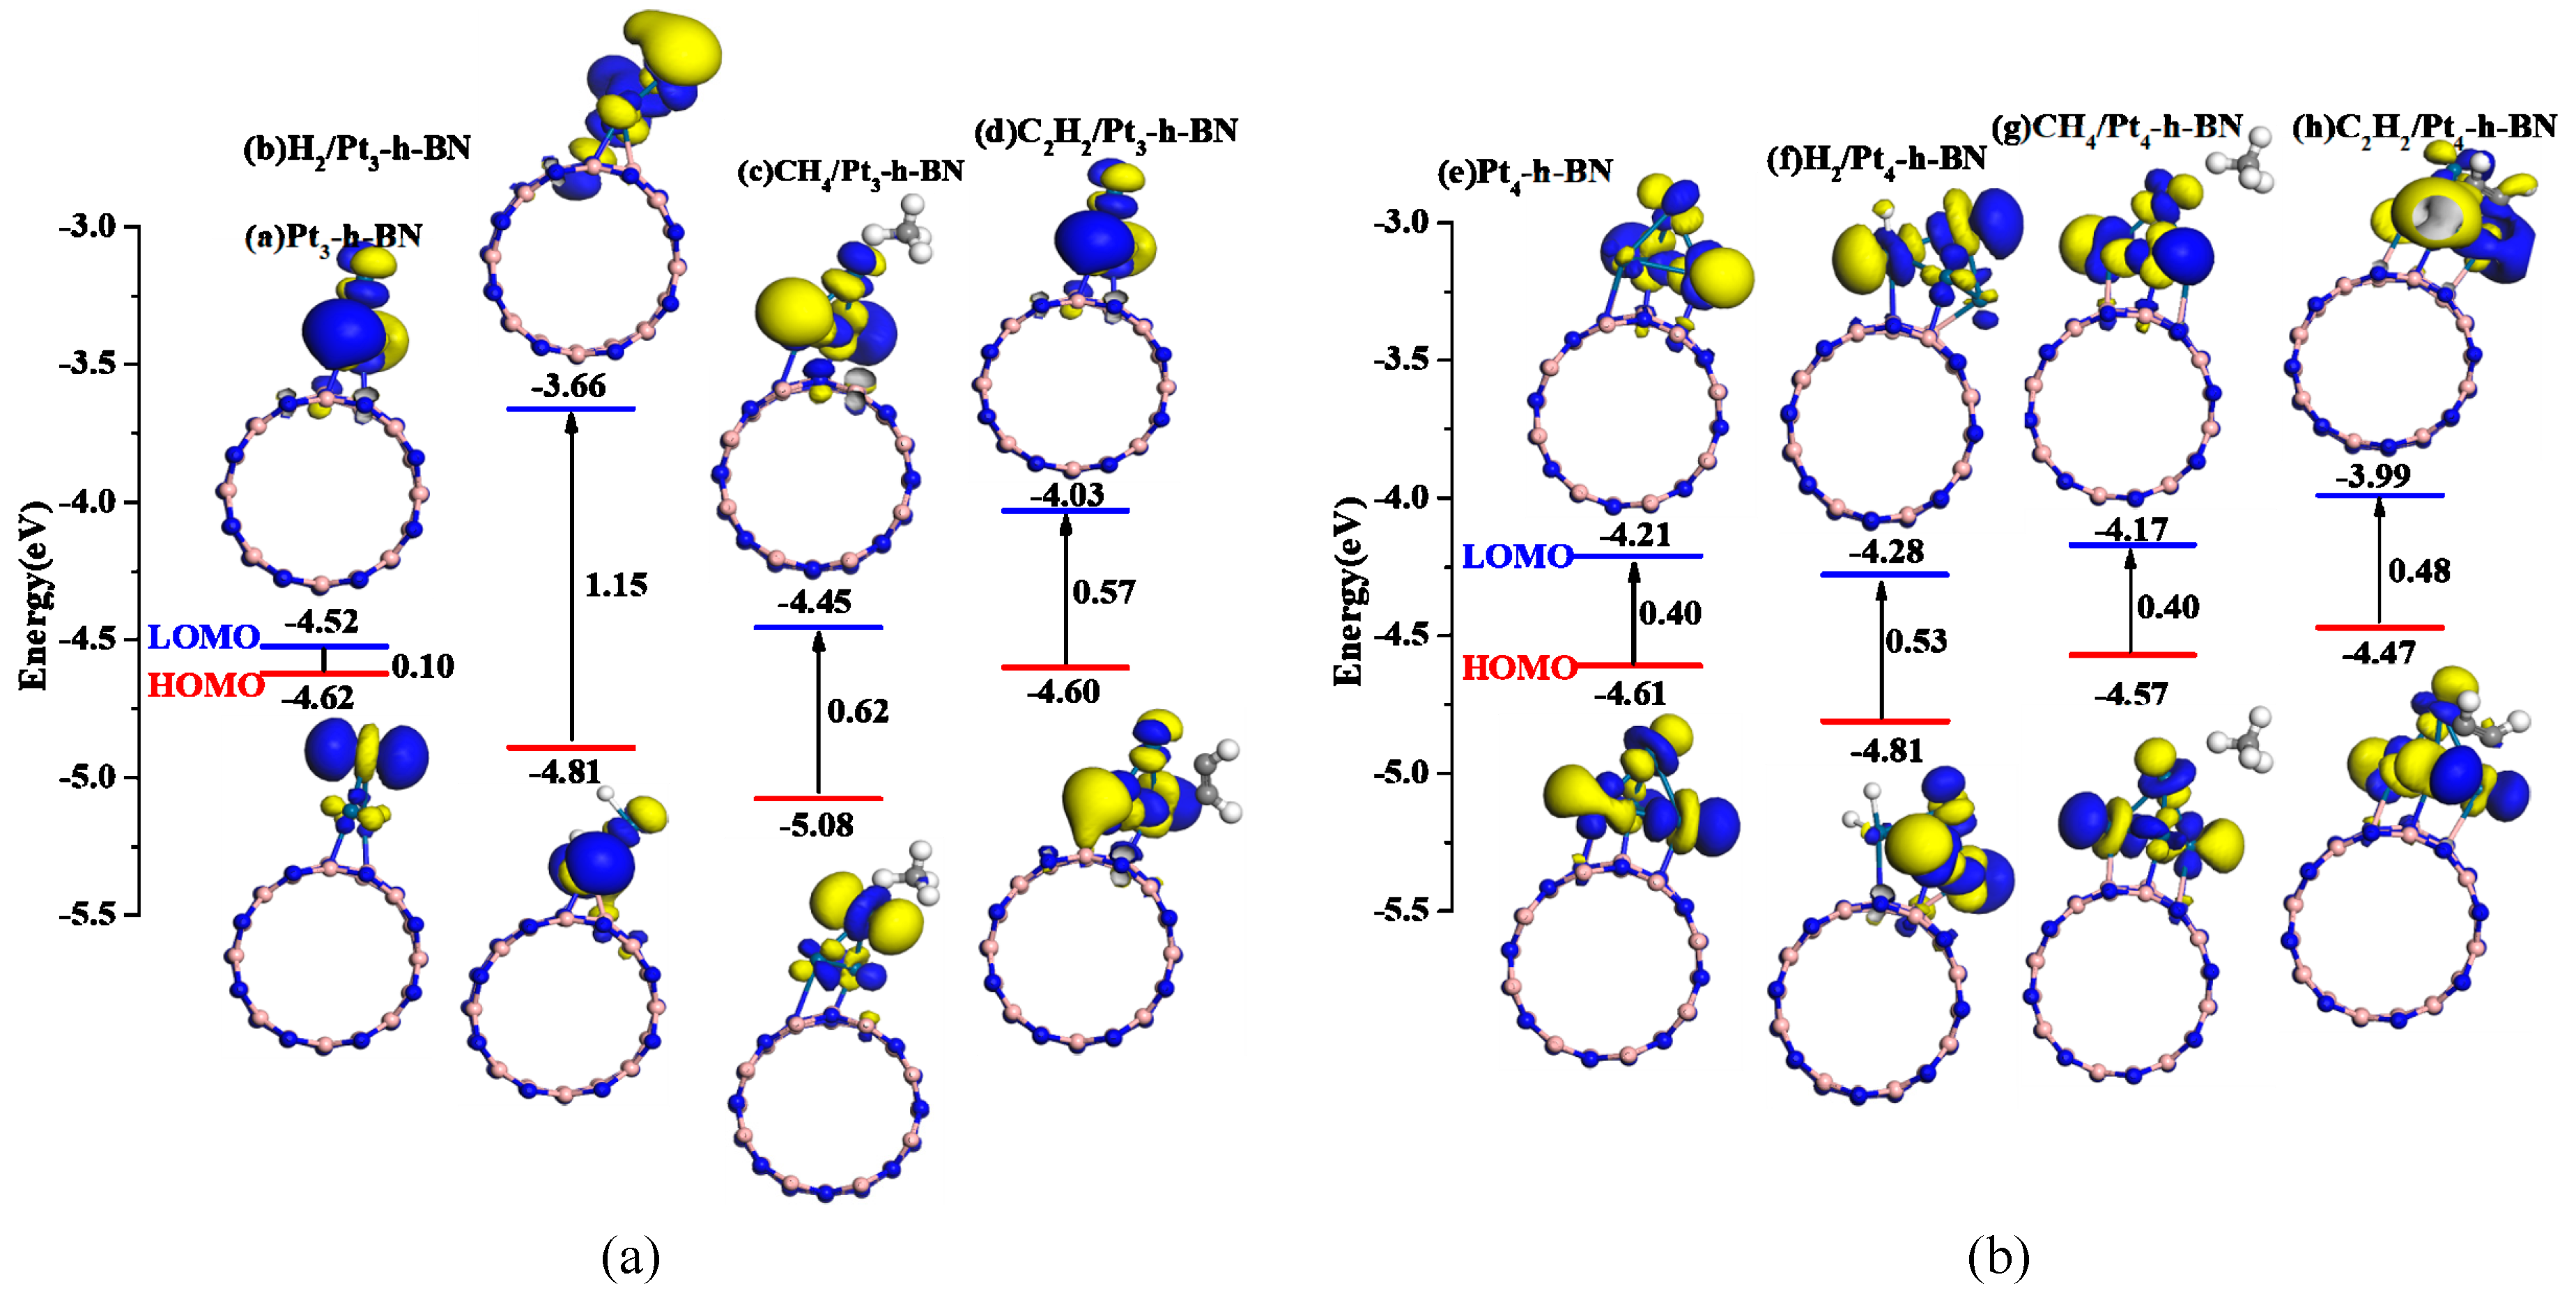
3.5. Adsorption of Gas Molecules on Pt3, Pt4 Doped h-BN
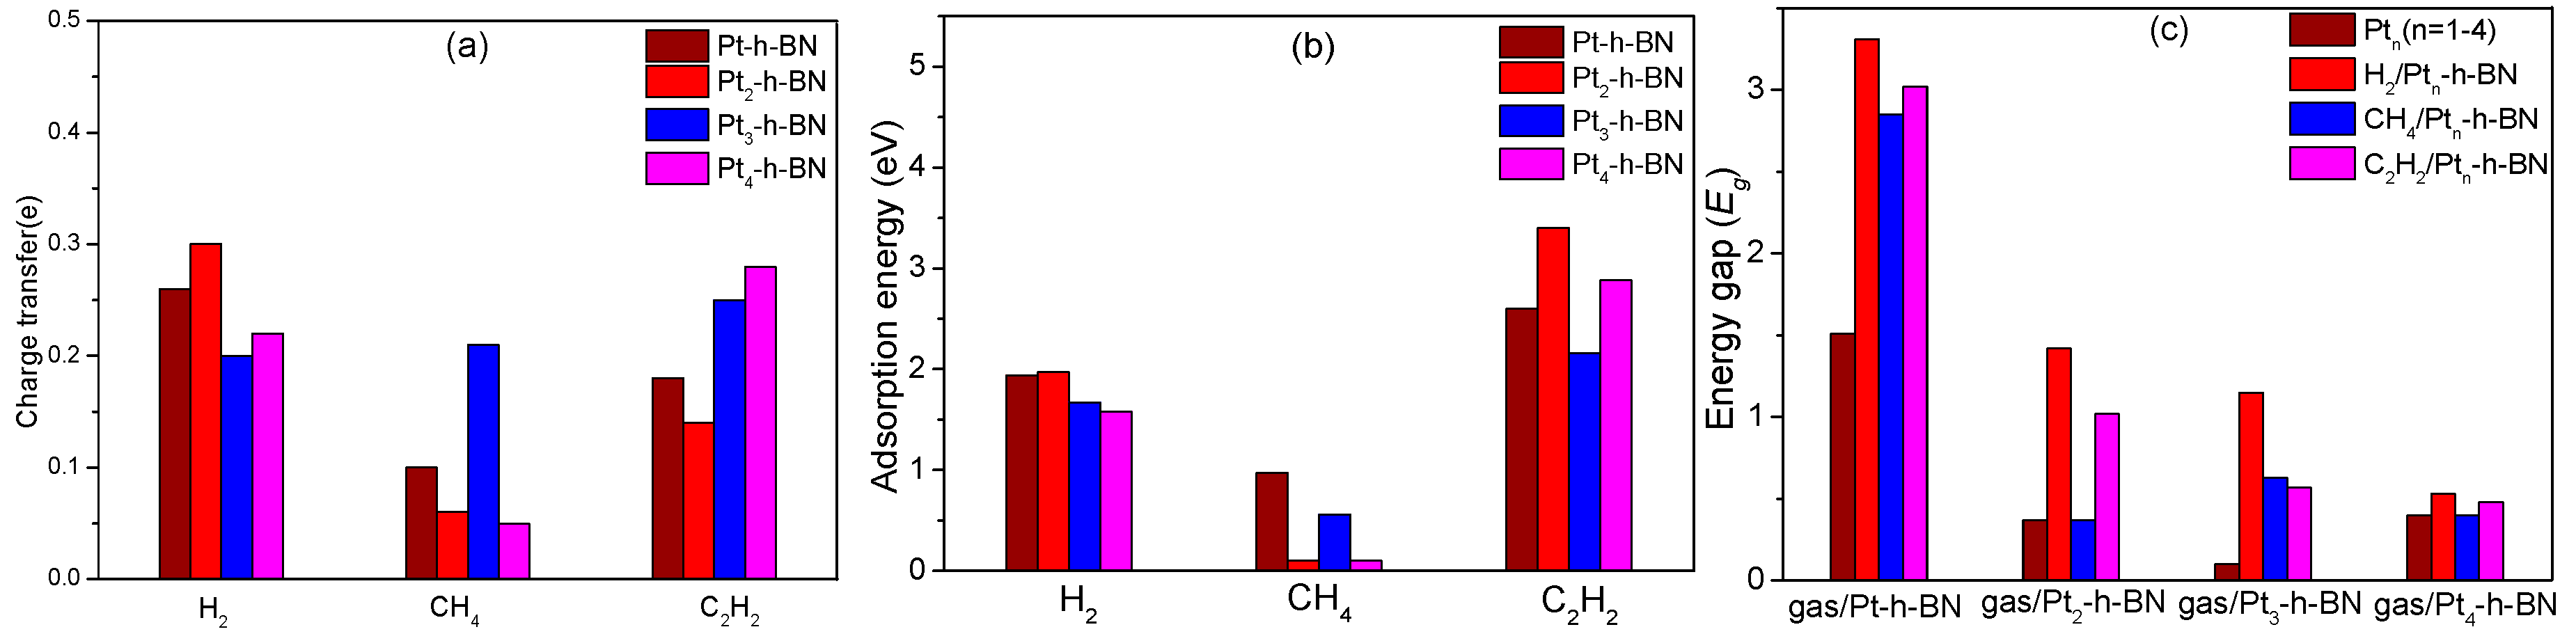
3.6. Comparison of Charge Transfer, Adsorption Energy, Energy Gap at Different Systems Through Table and Histogram
4. Conclusions
- Pt cluster-modified h-BN exhibits good sensitivity to C2H2 and H2 due to chemical adsorption process but is insensitive to CH4, with only weak physical adsorption process between them. The adsorption ability for these decomposition components occurs in the following order: C2H2 > H2 > CH4.
- In all doping systems, the adsorption of each gas molecule decreases the conductivity of the entire system. H2 and C2H2 molecules can drastically change the conductivity, and the decreased conductivity values for C2H2 and H2 are ordered as follows: H2 > C2H2. CH4 does not affect electronic distribution.
- In doping by different Pt atoms, the adsorption process mechanisms and adsorption are slightly different, but the good sensitivity to H2 and C2H2 is consistent. On the basis of the large difference in characteristics after adsorption, Pt cluster-modified h-BN is a suitable gas sensor.
Author Contributions
Funding
Conflicts of Interest
References
- Lu, J.; Zhang, X.; Wu, X.; Dai, Z.; Zhang, J. A Ni-Doped Carbon Nanotube Sensor for Detecting Oil-Dissolved Gases in Transformers. Sensors 2015, 15, 13522–13532. [Google Scholar] [CrossRef] [PubMed]
- Zhang, X.; Hao, C.; Zhang, J.; Ju, T. Adsorption characteristic of Pd-4 cluster carbon nanotube towards transformer oil dissolved components: A simulation. Appl. Surf. Sci. 2017, 419, 802–810. [Google Scholar] [CrossRef]
- Sun, H.C.; Huang, Y.C.; Huang, C.M. A Review of Dissolved Gas Analysis in Power Transformers. Energy Procedia 2012, 14, 1220–1225. [Google Scholar] [CrossRef]
- Lee, J.H. Gas sensors using hierarchical and hollow oxide nanostructures: Overview. Sens. Actuators B Chem. 2009, 140, 319–336. [Google Scholar] [CrossRef]
- Jia, J.F.; Wu, H.S.; Jiao, H. The structure and electronic property of BN nanotube. Phys. B Condens. Matter 2006, 381, 90–95. [Google Scholar] [CrossRef]
- Bo, Z.; Huang, X.; Wen, G.; Long, X.; Yu, H.; Bai, H. Preparation and Ultraviolet-Visible Luminescence Property of Novel BN Whiskers with a Cap-Stacked Structure. J. Phys. Chem. C 2010, 114, 21165–21172. [Google Scholar]
- Farmanzadeh, D.; Askari, N. Theoretical study of ozone adsorption on the surface of Fe, Co and Ni doped boron nitride nanosheets. Appl. Surf. Sci. 2018, 444. [Google Scholar] [CrossRef]
- Anota, E.C.; Cocoletzi, H.G. GGA-based analysis of the metformin adsorption on BN nanotubes. Phys. E Low-Dimens. Syst. Nanostruct. 2014, 56, 134–140. [Google Scholar] [CrossRef]
- Xuan, Z.; Wei, C.; Zhou, Y.; Sun, W.; Ying, X. DFT simulation on H 2 adsorption over Ni-decorated defective h -BN nanosheets. Appl. Surf. Sci. 2018, 439, 246–253. [Google Scholar]
- Min, G.; Lyalin, A.; Taketsugu, T. Catalytic Activity of Au and Au2 on the h-BN Surface: Adsorption and Activation of O2. J. Phys. Chem. C 2012, 116, 9054–9062. [Google Scholar]
- Koch, H.P.; Laskowski, R.; Blaha, P.; Schwarz, K. Adsorption of gold atoms on the h-BN/Rh (111) nanomesh. Phys. Rev. B Condens. Matter 2011, 84, 2335–2341. [Google Scholar] [CrossRef]
- Gui, Y.; Wang, Y.; Duan, S.; Tang, C.; Zhou, Q.; Xu, L.; Zhang, X. Ab Initio Study of SOF2 and SO2F2 Adsorption on Co-MoS2. ACS Omega 2019, 4, 2517–2522. [Google Scholar] [CrossRef] [PubMed]
- Wang, Y.; Gui, Y.; Ji, C.; Tang, C.; Zhou, Q.; Li, J.; Zhang, X. Adsorption of SF6 decomposition components on Pt3-TiO2(1 0 1) surface: A DFT study. Appl. Surf. Sci. 2018, 459, 242–248. [Google Scholar] [CrossRef]
- Wang, Q.; Lim, K.H.; Yang, S.W.; Yang, Y.; Chen, Y. Atomic carbon adsorption on Ni nanoclusters: A DFT study. Theor. Chem. Acc. 2011, 128, 17–24. [Google Scholar] [CrossRef]
- Russo, T.V.; Martin, R.L.; Hay, P.J. Effective Core Potentials for DFT Calculations. J. Phys. Chem. 1995, 99, 17085–17087. [Google Scholar] [CrossRef]
- Hensley, A.J.R.; Ghale, K.; Rieg, C.; Dang, T.; Ye, X. DFT-Based Method for More Accurate Adsorption Energies: An Adaptive Sum of Energies from RPBE and vdW Density Functionals. J. Phys. Chem. C 2017, 121, 4937–4945. [Google Scholar] [CrossRef]
- Schultz, P.A. Local electrostatic moments and periodic boundary conditions. Phys. Rev. B 1998, 60, 1551–1554. [Google Scholar] [CrossRef]
- Makov, G.; Payne, M.C. Periodic boundary conditions in ab initio calculations. Phys. Rev. B Condens. Matter 1995, 51, 4014. [Google Scholar] [CrossRef]
- Li, J.; Gui, Y.; Ji, C.; Tang, C.; Zhou, Q.; Wang, Y.; Zhang, X. Theoretical study of the adsorption of SF6 decomposition components on Ni(1 1 1) surface. Comput. Mater. Sci. 2018, 152, 248–255. [Google Scholar] [CrossRef]
- Javid, M.A.; Khan, Z.U.; Mehmood, Z.; Nabi, A.; Hussain, F.; Imran, M.; Nadeem, M.; Anjum, N. Structural, electronic and optical properties of LiNbO3 using GGA-PBE and TB-mBJ functionals: A DFT study. Int. J. Mod. Phys. B 2018, 32, 1850168. [Google Scholar] [CrossRef]
- Amaya-Roncancio, S.; Linares, D.H.; Duarte, H.A.; Sapag, K. A DFT Study of Hydrogen Assisted Dissociation of CO by HCO, COH and HCOH Formation on Fe (100). J. Phys. Chem. C 2016, 120. [Google Scholar] [CrossRef]
- Esrafili, M.D. BN co-doped graphene monolayers as promising metal-free catalysts for N 2 O reduction: A DFT study. Chem. Phys. Lett. 2018, 705, 44–49. [Google Scholar] [CrossRef]
- Froyen, S. Brillouin-zone integration by Fourier quadrature: Special points for superlattice and supercell calculations. Phys. Rev. B Condens. Matter 1989, 39, 3168–3172. [Google Scholar] [CrossRef] [PubMed]
- Yang, Q.; Zhong, C. Understanding hydrogen adsorption in metal-organic frameworks with open metal sites: A computational study. J. Phys. Chem. B 2006, 110, 655–658. [Google Scholar] [CrossRef]
- Gui, Y.; Chao, T.; Qu, Z.; Xu, L.; Zhao, Z.; Zhang, X. The sensing mechanism of N-doped SWCNTs toward SF 6 decomposition products: A first-principle study. Appl. Surf. Sci. 2018, 440, 846–852. [Google Scholar] [CrossRef]
- Huo, C.F.; Ren, J.; Li, Y.W.; Wang, J.G.; Jiao, H.J. CO dissociation on clean and hydrogen precovered Fe(111) surfaces. J. Catal. 2007, 249, 174–184. [Google Scholar] [CrossRef]
- Motl, P.M.; Tohline, J.E.; Frank, J. Numerical Methods for the Simulation of Dynamical Mass Transfer in Binaries. Astrophys. J. Suppl 2001, 138, 121. [Google Scholar] [CrossRef][Green Version]
- He, X.; Gui, Y.; Xie, J.; Liu, X.; Wang, Q.; Tang, C. A DFT study of dissolved gas (C2H2, H2, CH4) detection in oil on CuO-modified BNNT. Appl. Surf. Sci. 2020, 500. [Google Scholar] [CrossRef]
- Hariharan, P.C.; Pople, J.A. The influence of polarization functions on molecular orbital hydrogenation energies. Theor. Chim. Acta 1973, 28, 213–222. [Google Scholar] [CrossRef]


| System | Structure | Adsorption Distance (d) | Adsorption Energy (Eads) |
|---|---|---|---|
| H2 adsorption | Figure 4a | 3.23 Å | −0.08 eV |
| CH4 adsorption | Figure 4b | 3.45 Å | −0.06 eV |
| C2H2 adsorption | Figure 4c | 3.63 Å | −0.10 eV |
| System | Structure | Adsorption Distance (6) | Adsorption Energy (Eads) | Charge Transfer (Qt) |
|---|---|---|---|---|
| H2/Pt-h-BN | Figure 5a | 1.56 Å | −1.94 eV | 0.26 e |
| CH4/Pt-h-BN | Figure 5b | 1.76 Å | −0.97 eV | 0.10 e |
| C2H2/Pt-h-BN | Figure 5c | 2.03 Å | −2.60 eV | 0.18 e |
| H2/Pt2-h-BN | Figure 5d | 1.54 Å | −1.97 eV | 0.30 e |
| CH4/Pt2-h-BN | Figure 5e | 2.53 Å | −0.10 eV | 0.06 e |
| C2H2/Pt2-h-BN | Figure 5f | 1.97 Å | −3.40 eV | 0.14 e |
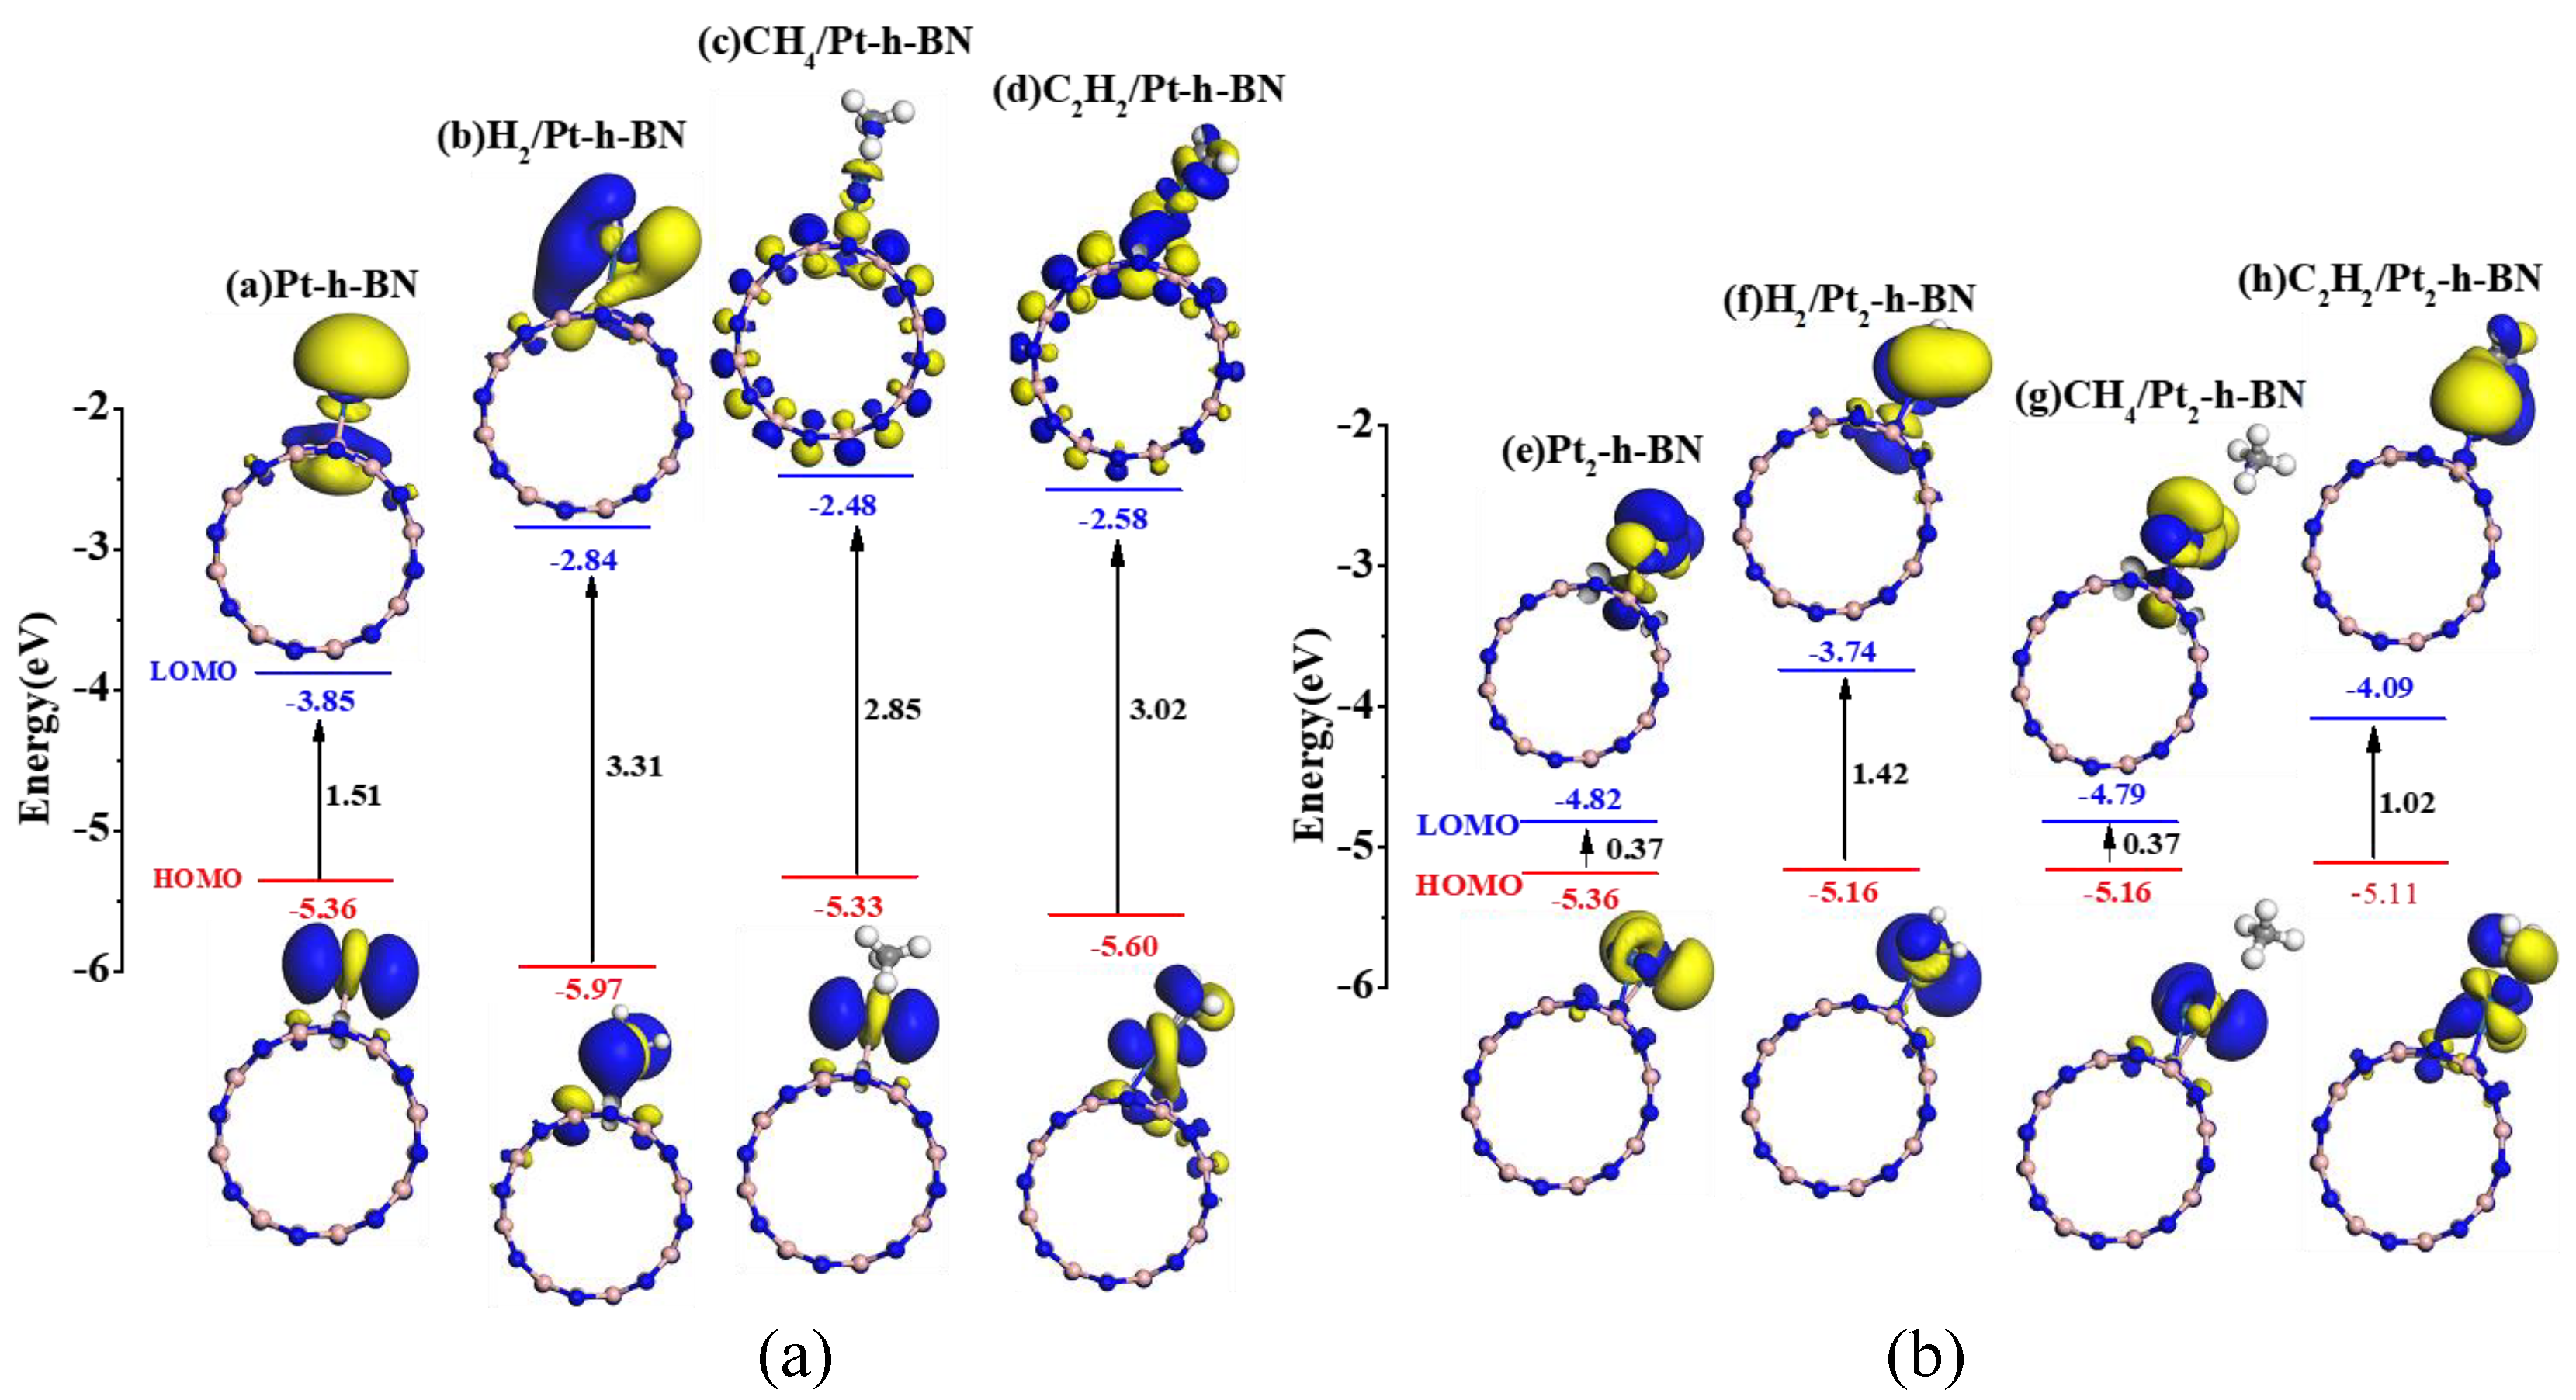
| Adsorption system | Structure | EHOMO(eV) | ELUMO(eV) | Eg(eV) |
|---|---|---|---|---|
| Pt-h-BN | Figure 7a | −5.34 | −3.85 | 1.51 |
| H2/Pt-h-BN | Figure 7b | −5.97 | −2.84 | 3.31 |
| CH4/Pt-h-BN | Figure 7c | −5.33 | −2.48 | 2.85 |
| C2H2/Pt-h-BN | Figure 7d | −5.60 | −2.58 | 3.02 |
| Pt2-h-BN | Figure 7e | −5.19 | −4.82 | 0.37 |
| H2/Pt2-h-BN | Figure 7f | −5.16 | −3.74 | 1.42 |
| CH4/Pt2-h-BN | Figure 7g | −5.16 | −4.79 | 0.37 |
| C2H2/Pt2-h-BN | Figure 7h | −5.11 | −4.09 | 1.02 |
| System | Structure | Adsorption Distance (d) | Adsorption Energy (Eads) | Charge Transfer (Qt) |
|---|---|---|---|---|
| H2/Pt3-h-BN | Figure 8a | 1.53 Å | 1.67 eV | 0.20 e |
| CH4/Pt3-h-BN | Figure 8b | 2.32 Å | 0.56 eV | 0.21 e |
| C2H2/Pt3-h-BN | Figure 8c | 1.97 Å | 2.16 eV | 0.25 e |
| H2/Pt4-h-BN | Figure 8d | 1.55 Å | 1.58 eV | 0.22 e |
| CH4/Pt4-h-BN | Figure 8e | 2.31 Å | 0.10 eV | 0.05 e |
| C2H2/Pt4-h-BN | Figure 8f | 1.98 Å | 2.88 eV | 0.28 e |
| Adsorption System | Structure | EHOMO (eV) | ELUMO (eV) | Eg (eV) |
|---|---|---|---|---|
| Pt3-h-BN | Figure 10a | −4.62 | −4.52 | 0.10 |
| H2/Pt3-h-BN | Figure 10b | −4.81 | −3.66 | 1.15 |
| CH4/Pt3-h-BN | Figure 10c | −5.08 | −4.45 | 0.63 |
| C2H2/Pt3-h-BN | Figure 10d | −4.60 | −4.03 | 0.57 |
| Pt4-h-BN | Figure 10e | −4.61 | −4.21 | 0.40 |
| H2/Pt4-h-BN | Figure 10f | −4.81 | −4.28 | 0.53 |
| CH4/Pt4-h-BN | Figure 10g | −4.57 | −4.17 | 0.40 |
| C2H2/Pt4-h-BN | Figure 10h | −4.47 | −3.99 | 0.48 |
| Adsorption Type | Qt (e) | Eads (eV) | Eg (eV) |
|---|---|---|---|
| Pt-h-BN | / | / | 1.51 |
| Pt2-H-BN | / | / | 0.37 |
| Pt3-h-BN | / | / | 0.10 |
| Pt4-h-BN | / | / | 0.40 |
| H2/Pt-h-BN | 0.26 | 1.94 | 3.31 |
| H2/Pt2-h-BN | 0.30 | 1.97 | 1.42 |
| H2/Pt3-h-BN | 0.20 | 1.67 | 1.15 |
| H2/Pt4-h-BN | 0.22 | 1.58 | 0.53 |
| CH4/Pt-h-BN | 0.10 | 0.97 | 2.85 |
| CH4/Pt2-h-BN | 0.06 | 0.10 | 0.37 |
| CH4/Pt3-h-BN | 0.21 | 0.56 | 0.63 |
| CH4/Pt4-h-BN | 0.05 | 0.10 | 0.40 |
| C2H2/Pt-h-BN | 0.18 | 2.60 | 3.02 |
| C2H2/Pt2-h-BN | 0.14 | 3.40 | 1.02 |
| C2H2/Pt3-h-BN | 0.25 | 2.16 | 0.57 |
| C2H2/Pt4-h-BN | 0.28 | 2.88 | 0.48 |
© 2019 by the authors. Licensee MDPI, Basel, Switzerland. This article is an open access article distributed under the terms and conditions of the Creative Commons Attribution (CC BY) license (http://creativecommons.org/licenses/by/4.0/).
Share and Cite
Gui, Y.; Li, T.; He, X.; Ding, Z.; Yang, P. Pt Cluster Modified h-BN for Gas Sensing and Adsorption of Dissolved Gases in Transformer Oil: A Density Functional Theory Study. Nanomaterials 2019, 9, 1746. https://doi.org/10.3390/nano9121746
Gui Y, Li T, He X, Ding Z, Yang P. Pt Cluster Modified h-BN for Gas Sensing and Adsorption of Dissolved Gases in Transformer Oil: A Density Functional Theory Study. Nanomaterials. 2019; 9(12):1746. https://doi.org/10.3390/nano9121746
Chicago/Turabian StyleGui, Yingang, Tao Li, Xin He, Zhuyu Ding, and Pingan Yang. 2019. "Pt Cluster Modified h-BN for Gas Sensing and Adsorption of Dissolved Gases in Transformer Oil: A Density Functional Theory Study" Nanomaterials 9, no. 12: 1746. https://doi.org/10.3390/nano9121746
APA StyleGui, Y., Li, T., He, X., Ding, Z., & Yang, P. (2019). Pt Cluster Modified h-BN for Gas Sensing and Adsorption of Dissolved Gases in Transformer Oil: A Density Functional Theory Study. Nanomaterials, 9(12), 1746. https://doi.org/10.3390/nano9121746