A Metabolomic Approach for the In Vivo Study of Gold Nanospheres and Nanostars after a Single-Dose Intravenous Administration to Wistar Rats
Abstract
1. Introduction
2. Materials and Methods
2.1. Reagents and Materials
2.2. Synthesis and Characterization of AuNPs
2.3. Animal and Experimental Design
2.4. Determination of Gold in Biological Samples by Graphite Furnace Atomic Absorption Spectrometry (GFAAS)
2.5. Intracellular Metabolome Analysis of the Liver
2.5.1. Sample Collection and Preparation
2.5.2. GC-MS Pre-Processing Data
2.5.3. Multivariate Analysis
2.5.4. Metabolites Identification Process
2.5.5. Univariate Analysis
2.6. In Vivo Toxicological Evaluation of AuNPs
2.7. Statistical Analysis of the Biochemical Parameters
3. Results
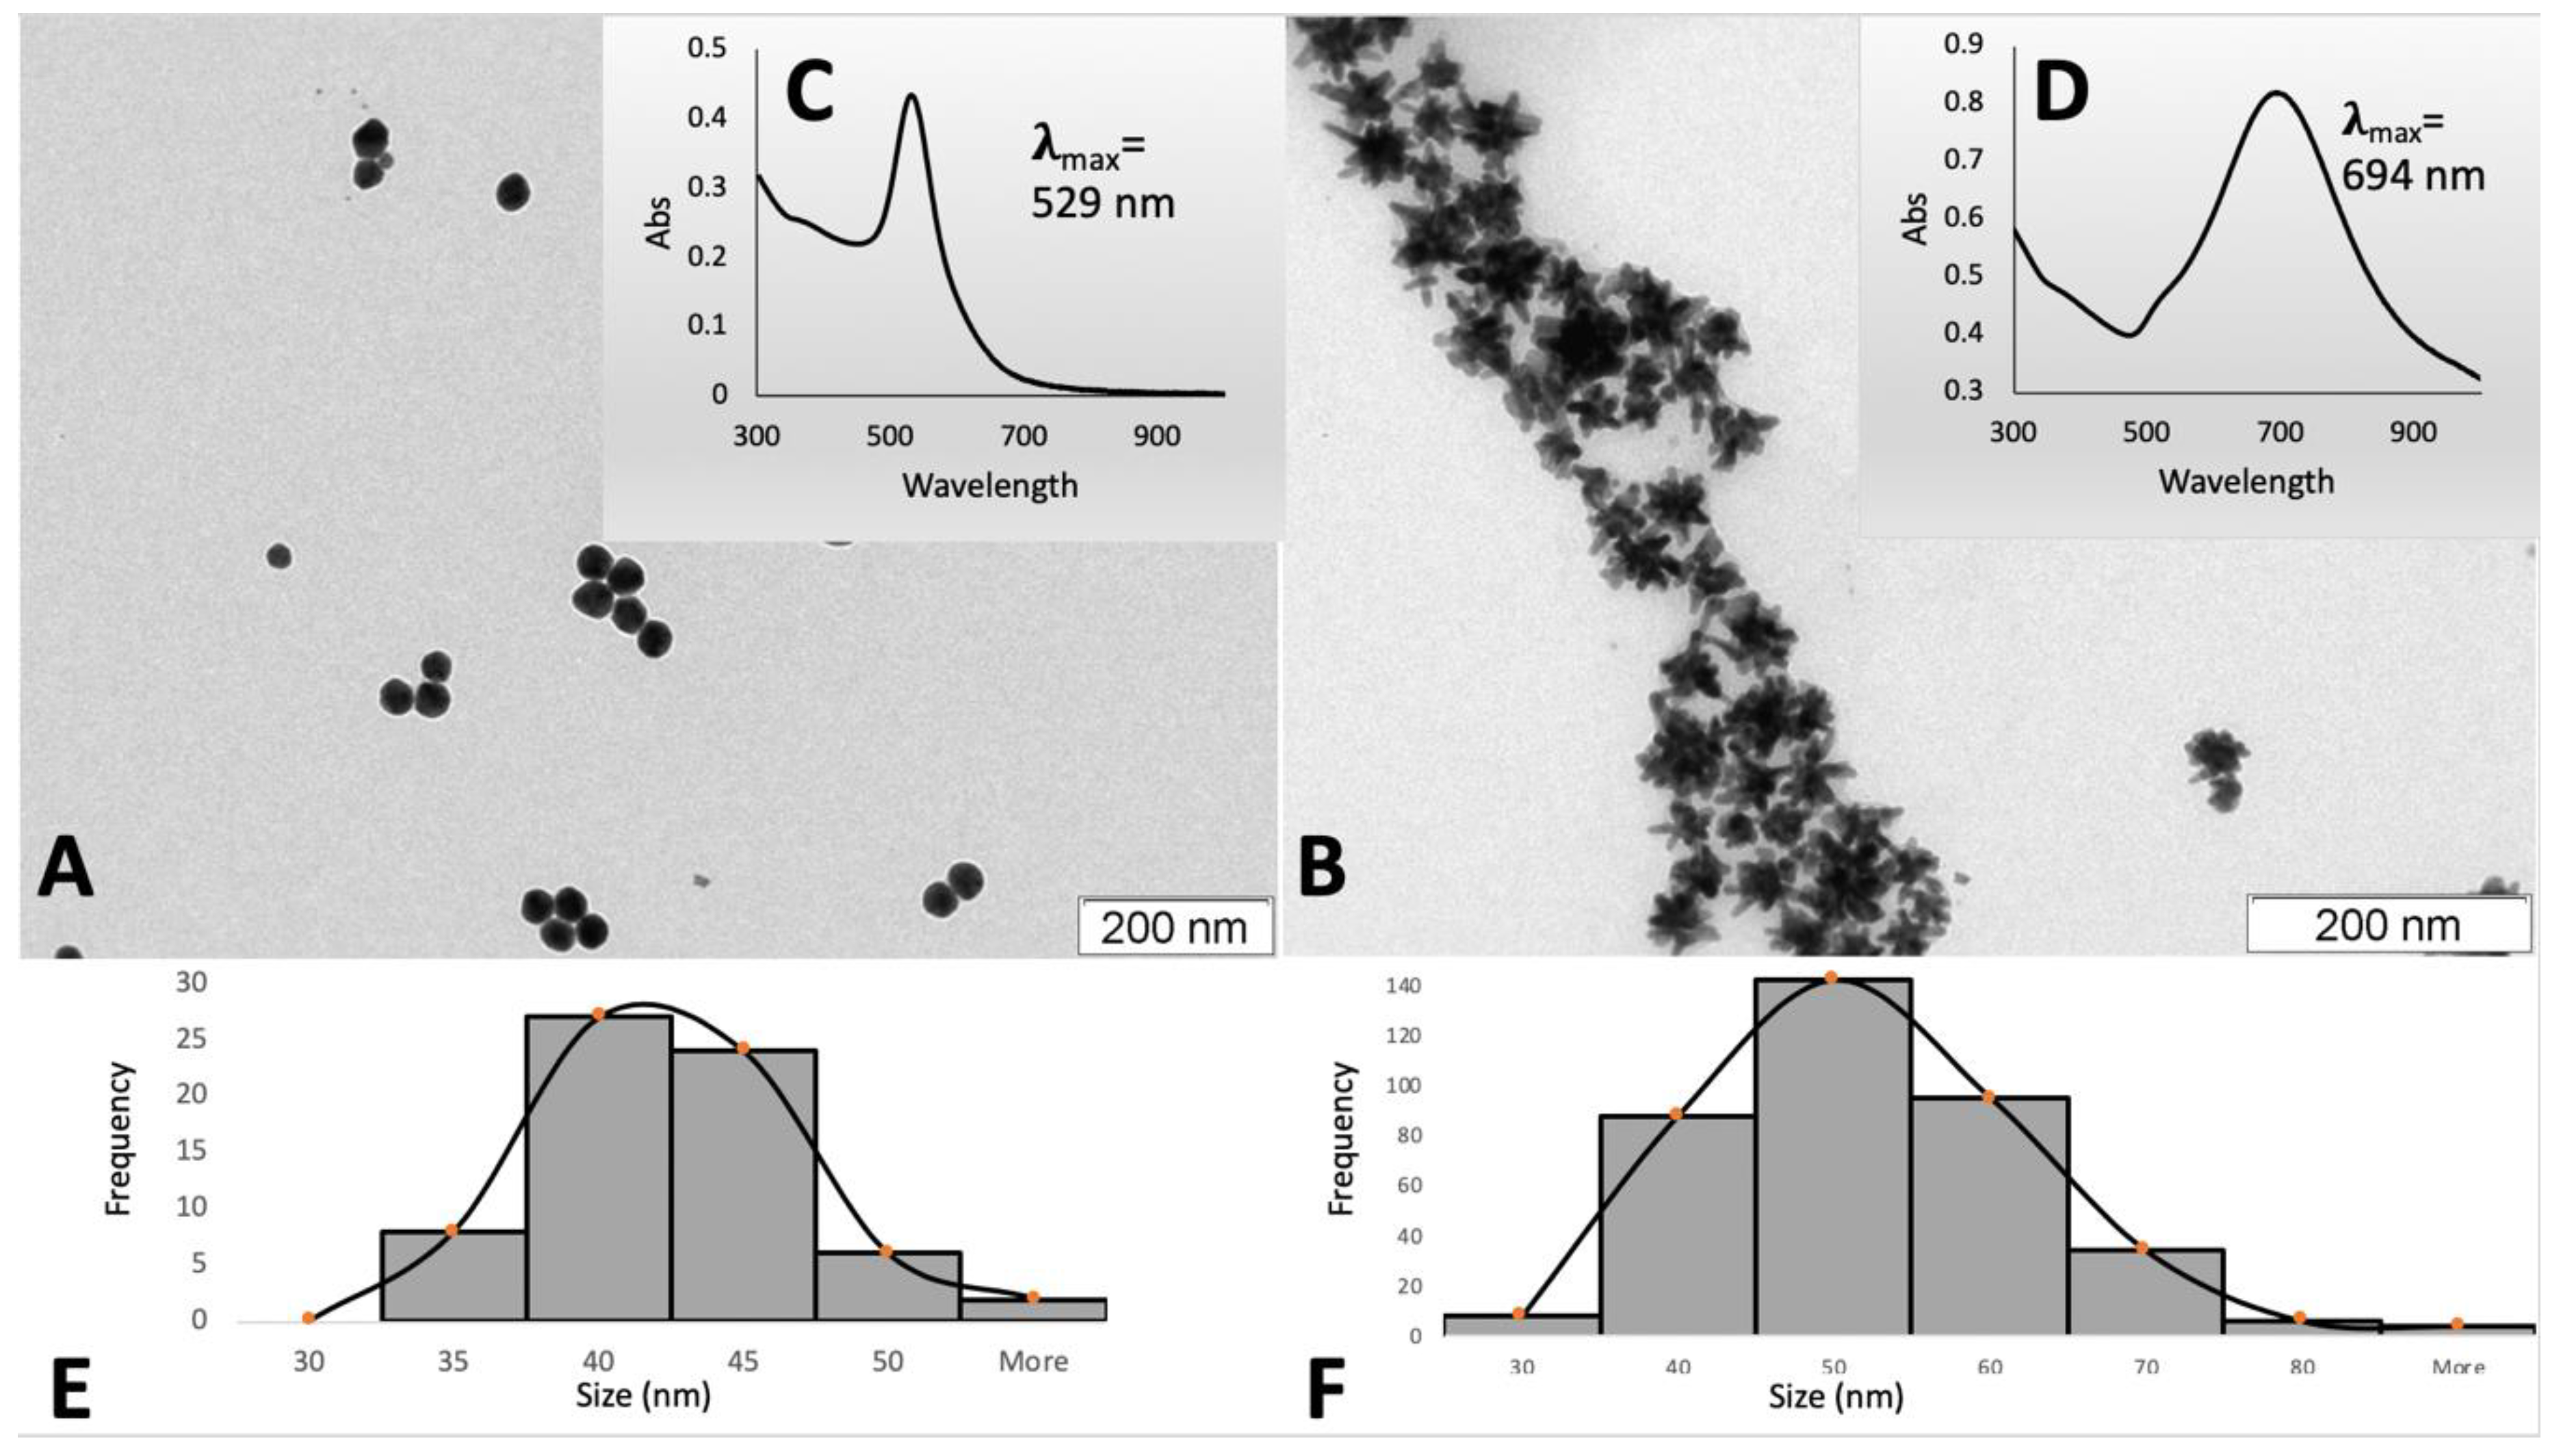
3.1. Synthesis and Characterization of AuNPs
3.2. Influence of Shape in the Biodistribution Profile of AuNPs
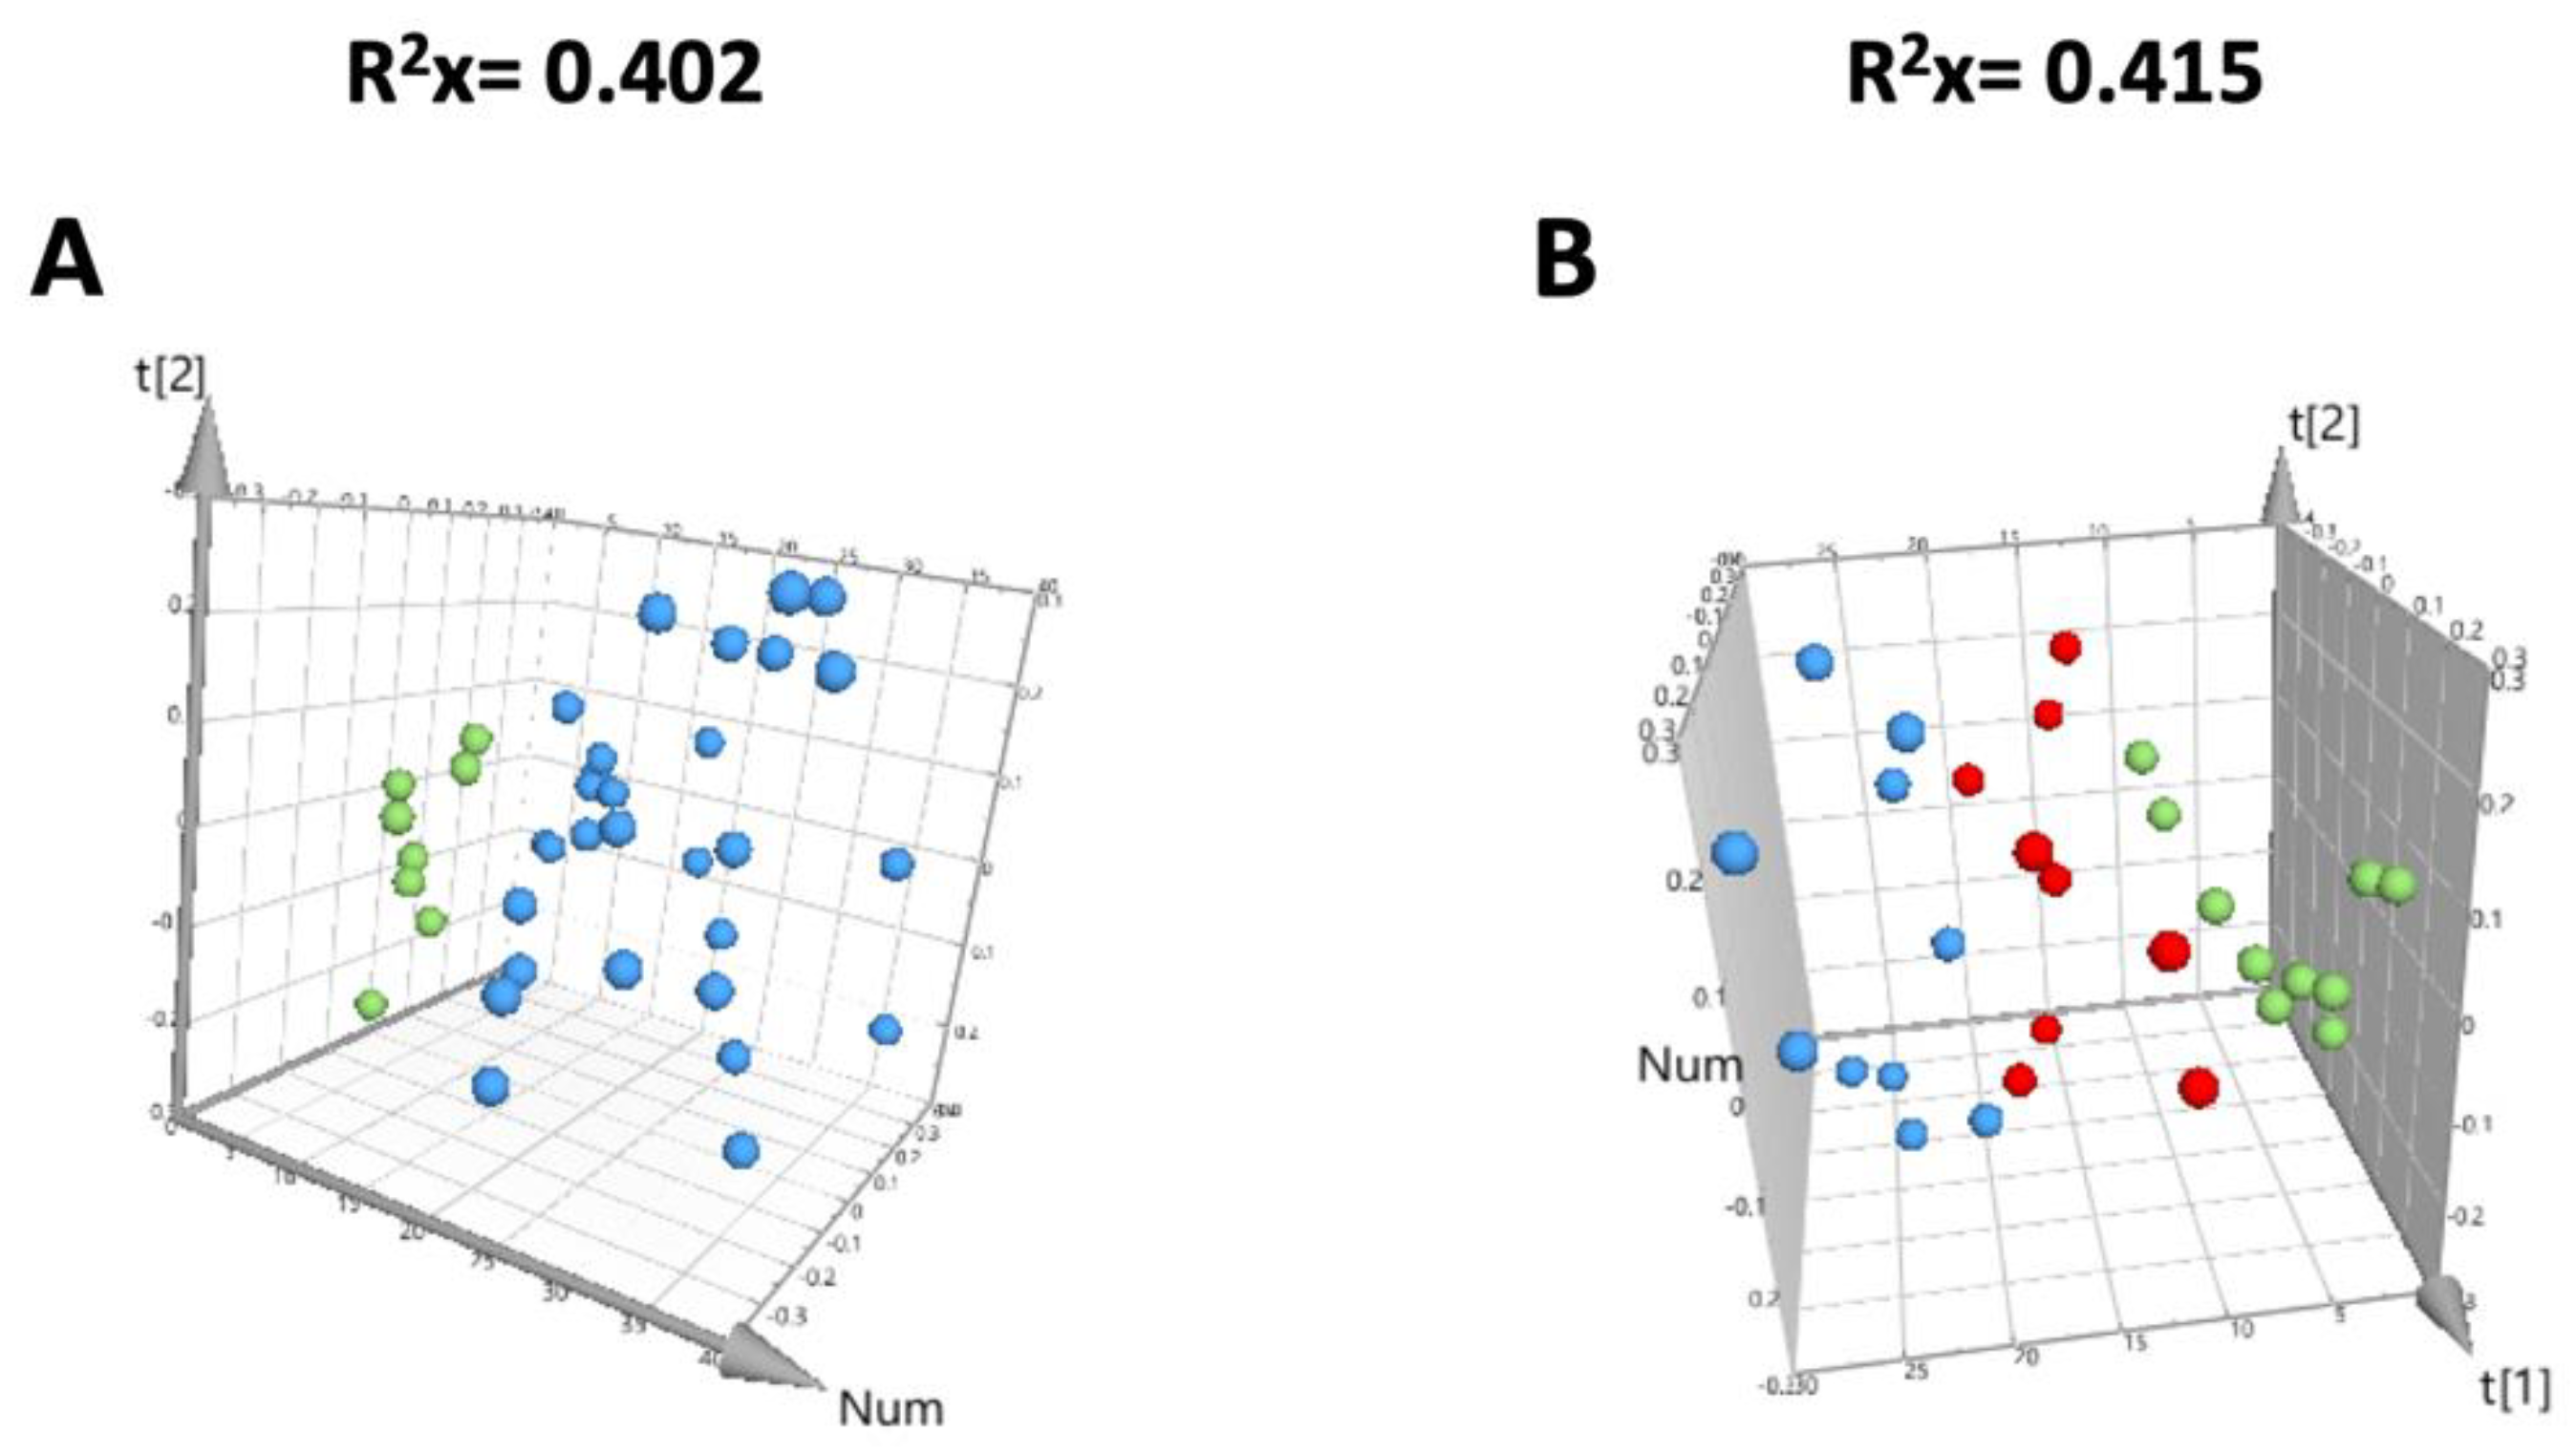
3.3. Quality Evaluation of the Metabolomic Study
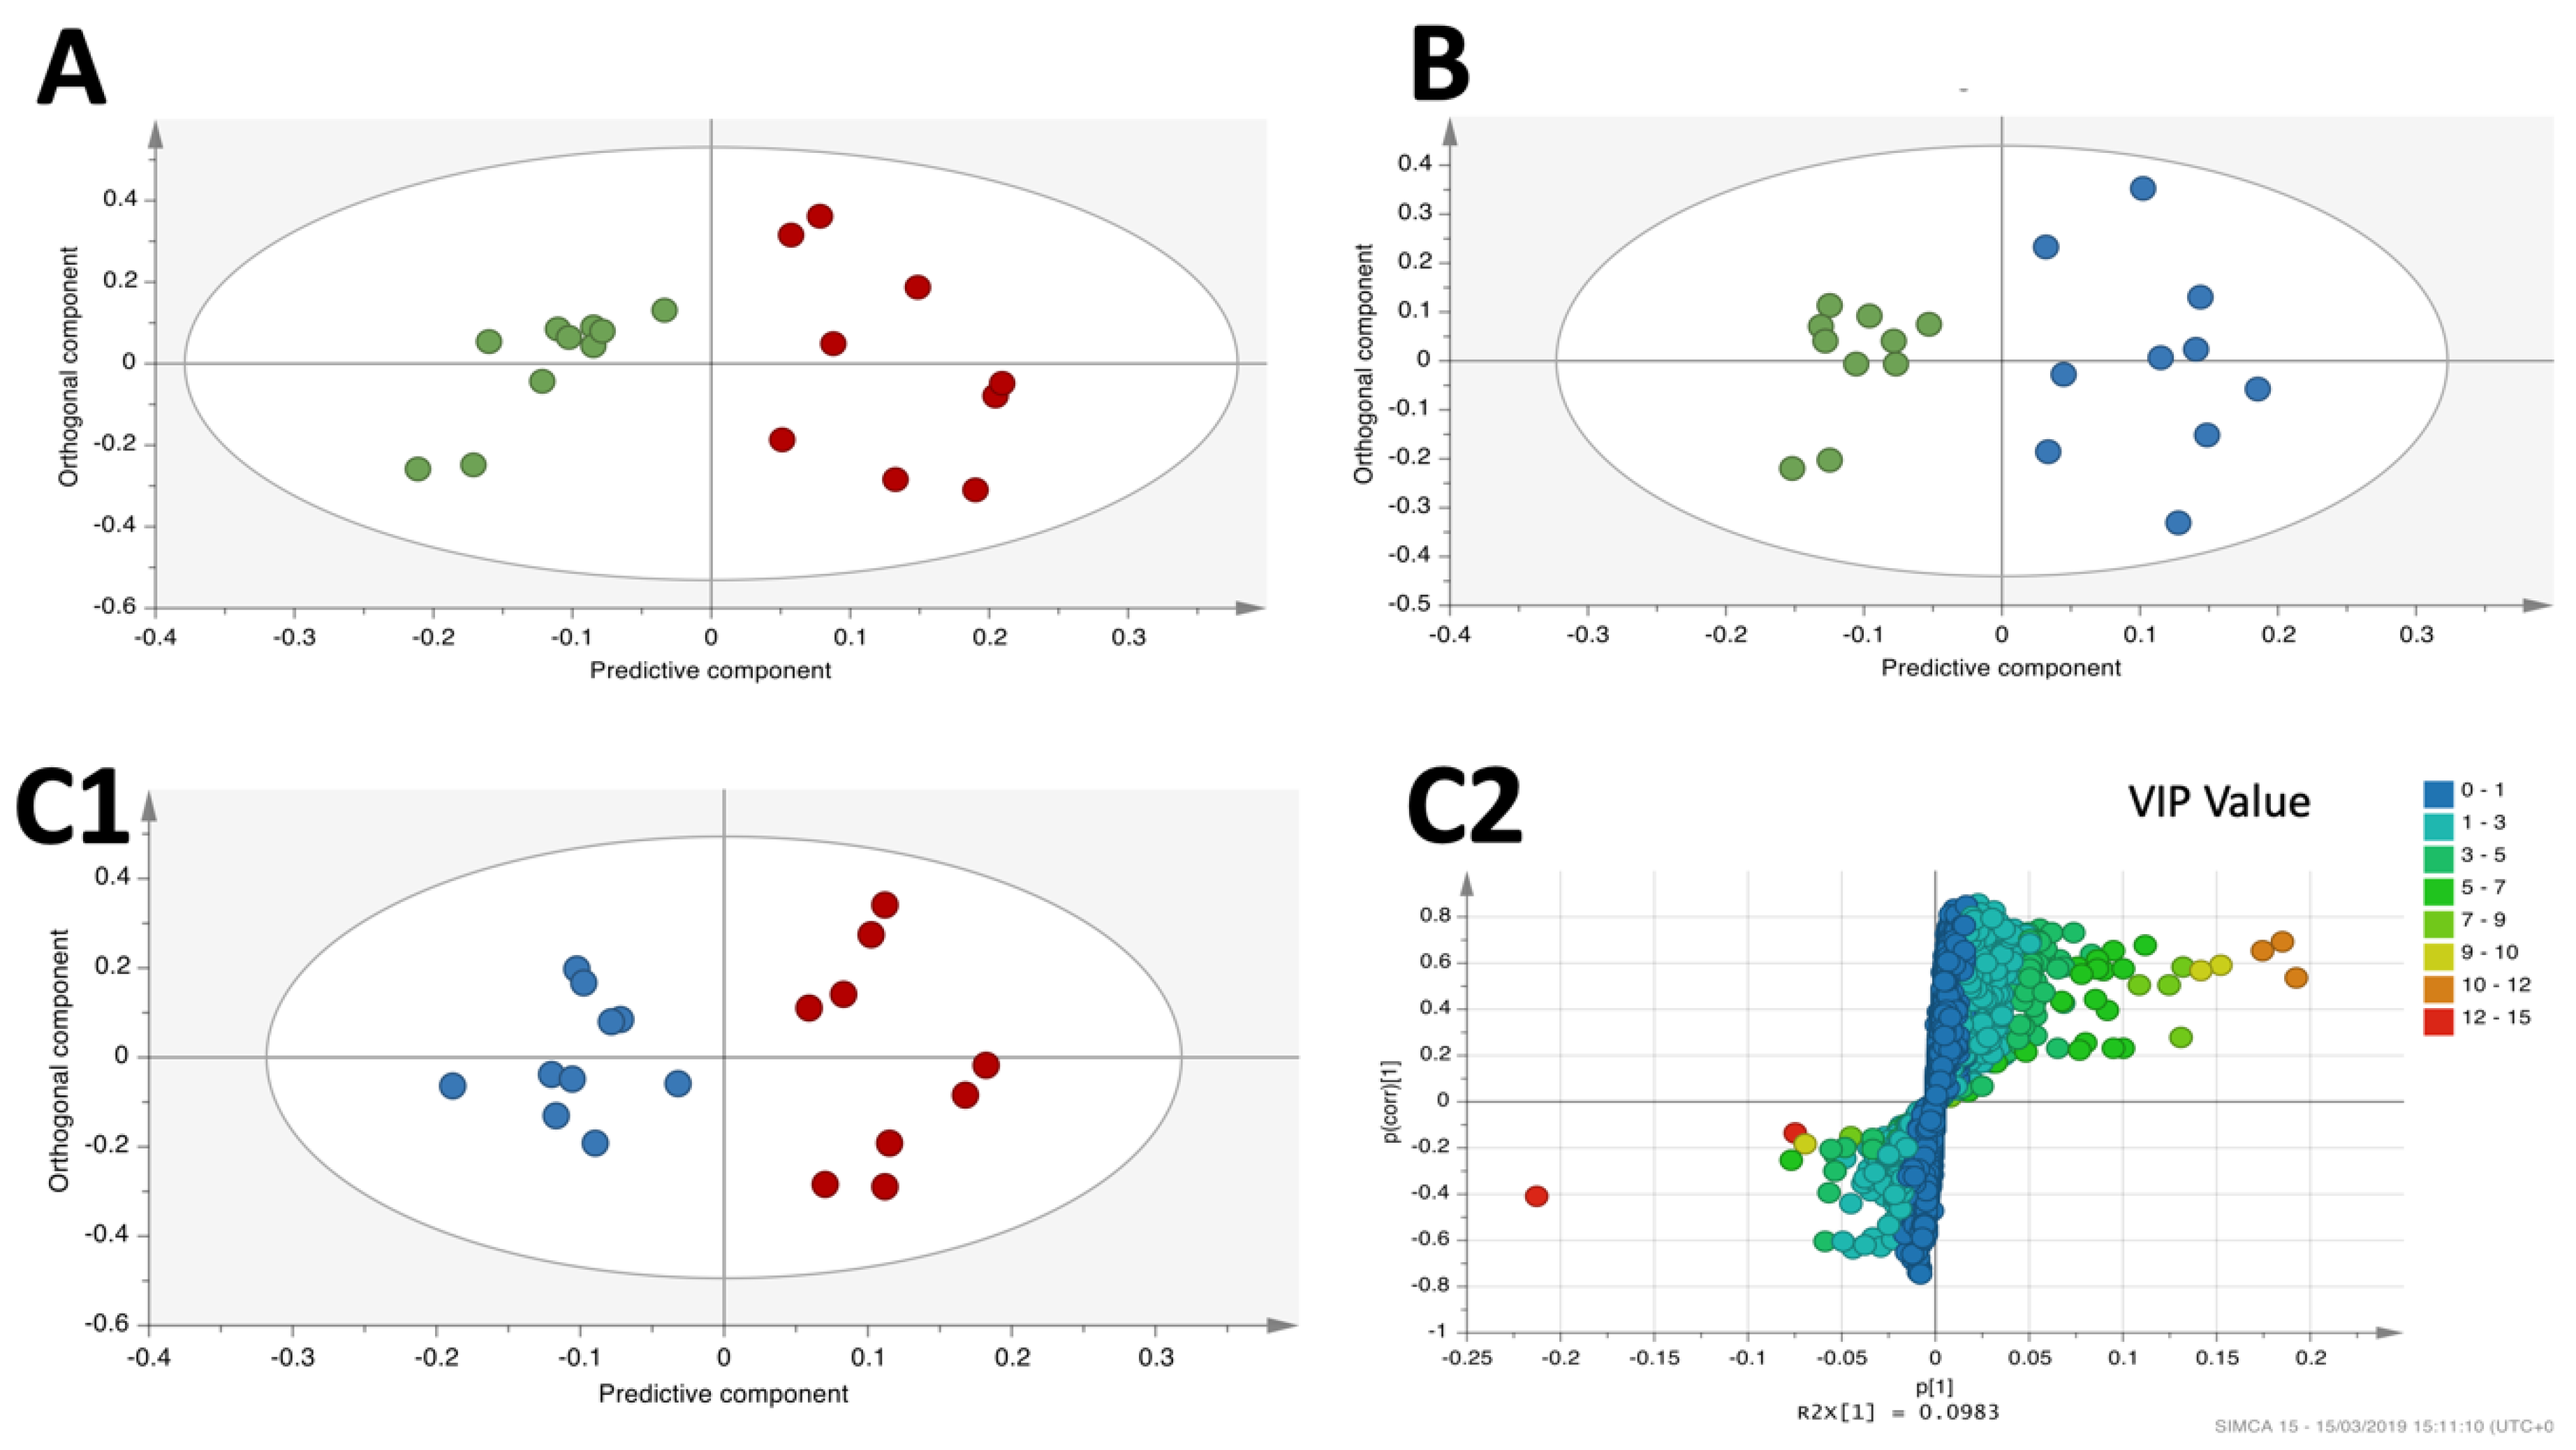
3.4. OPLS-DA Liver Analysis Clearly Discriminated the Metabolic Profile of Nanospheres and Nanostars Compared to Control
3.5. OPLS-DA Liver Analysis Clearly Discriminated the Metabolic Profile of Nanospheres versus Nanostars
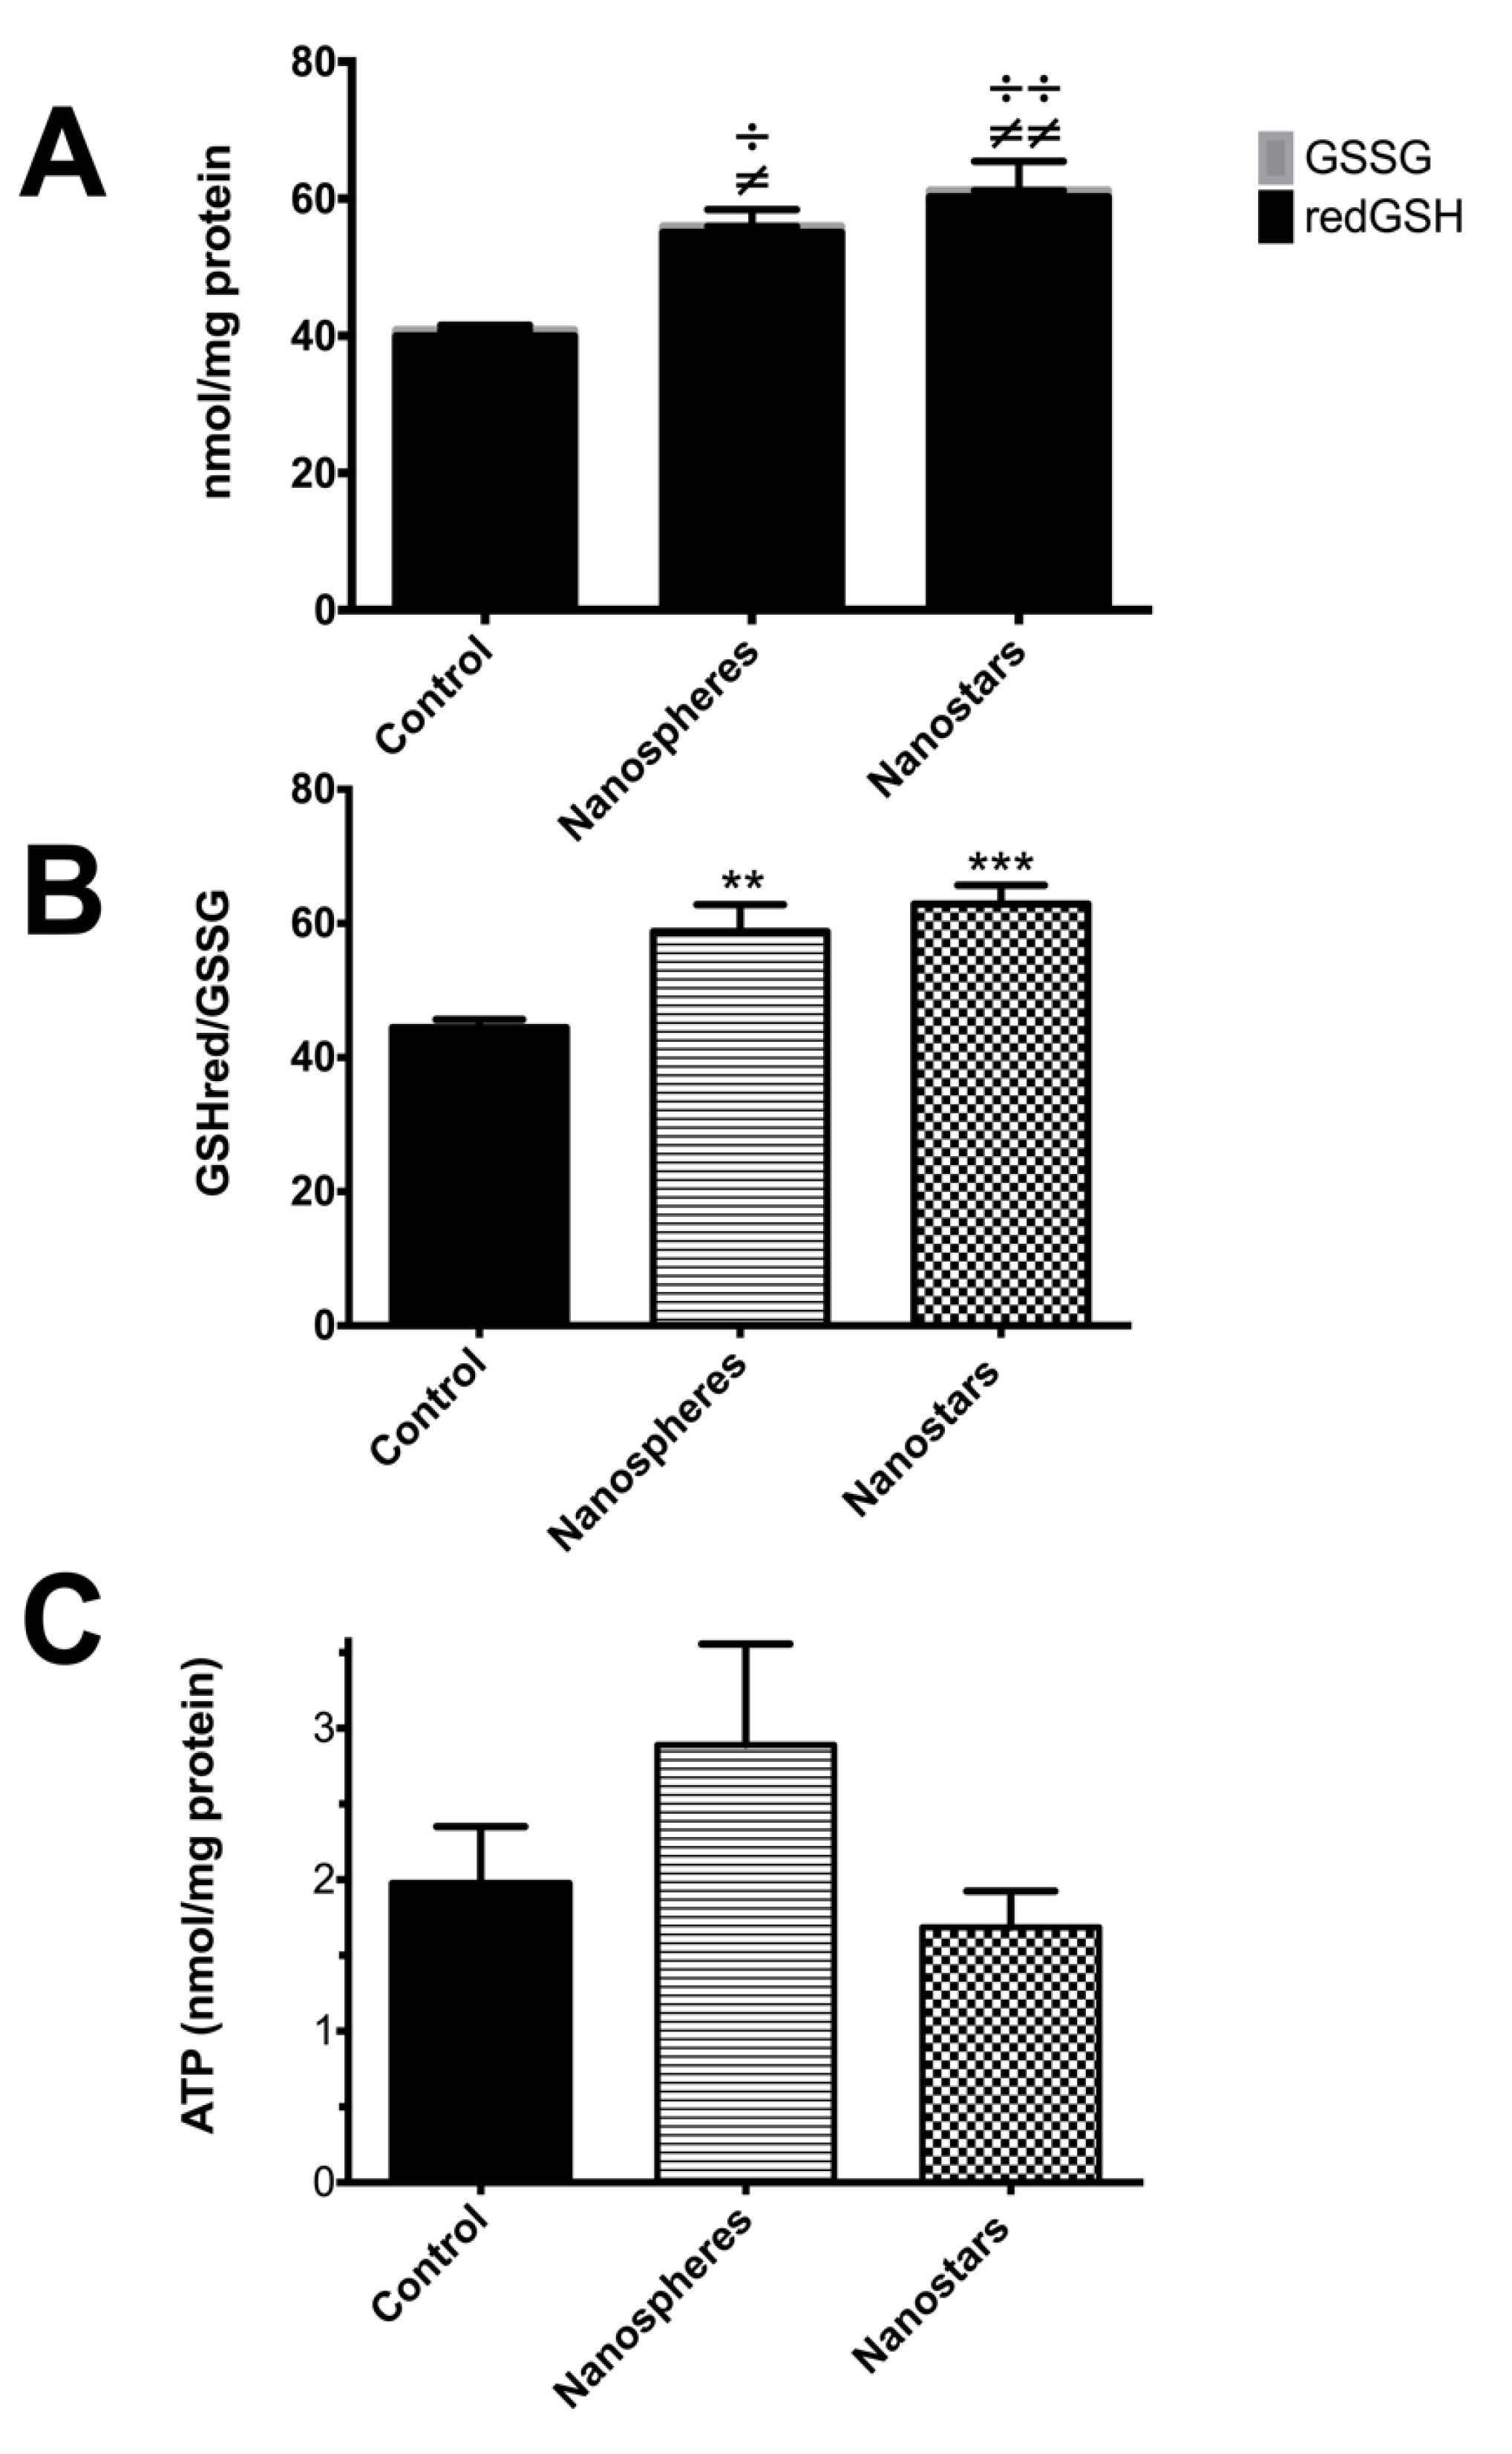
3.6. In Vivo Toxicological Evaluation of AuNPs
4. Discussion
5. Conclusions
Supplementary Materials
Author Contributions
Funding
Conflicts of Interest
References
- Espinosa, A.; Silva, A.K.; Sanchez-Iglesias, A.; Grzelczak, M.; Pechoux, C.; Desboeufs, K.; Liz-Marzan, L.M.; Wilhelm, C. Cancer cell internalization of gold nanostars impacts their photothermal efficiency in vitro and in vivo: Toward a plasmonic thermal fingerprint in tumoral environment. Adv. Healthc. Mater. 2016, 5, 1040–1048. [Google Scholar] [CrossRef] [PubMed]
- Zhu, H.; Liu, W.; Cheng, Z.; Yao, K.; Yang, Y.; Xu, B.; Su, G. Targeted delivery of siRNA with pH-responsive hybrid gold nanostars for cancer treatment. Int. J. Mol. Sci. 2017, 18, 2029. [Google Scholar] [CrossRef]
- Mioc, A.; Mioc, M.; Ghiulai, R.; Voicu, M.; Babuta, R.; Trandafirescu, C.; Dehelean, C.; Coricovac, D.; Soica, C.M. Gold nanoparticles as targeted delivery systems and theranostic agents in cancer therapy. Curr. Med. Chem. 2019. [Google Scholar] [CrossRef] [PubMed]
- Huo, S.; Ma, H.; Huang, K.; Liu, J.; Wei, T.; Jin, S.; Zhang, J.; He, S.; Liang, X.J. Superior penetration and retention behavior of 50 nm gold nanoparticles in tumors. Cancer Res. 2013, 73, 319–330. [Google Scholar] [CrossRef] [PubMed]
- Bibikova, O.; Haas, J.; Lopez-Lorente, A.I.; Popov, A.; Kinnunen, M.; Ryabchikov, Y.; Kabashin, A.; Meglinski, I.; Mizaikoff, B. Surface enhanced infrared absorption spectroscopy based on gold nanostars and spherical nanoparticles. Anal. Chim. Acta 2017, 990, 141–149. [Google Scholar] [CrossRef]
- Liu, Y.; Yuan, H.; Fales, A.M.; Register, J.K.; Vo-Dinh, T. Multifunctional gold nanostars for molecular imaging and cancer therapy. Front. Chem. 2015, 3, 51. [Google Scholar] [CrossRef]
- Favi, P.M.; Gao, M.; Johana Sepulveda Arango, L.; Ospina, S.P.; Morales, M.; Pavon, J.J.; Webster, T.J. Shape and surface effects on the cytotoxicity of nanoparticles: Gold nanospheres versus gold nanostars. J. Biomed. Mater. Res. Part A 2015, 103, 3449–3462. [Google Scholar] [CrossRef]
- Wozniak, A.; Malankowska, A.; Nowaczyk, G.; Grzeskowiak, B.F.; Tusnio, K.; Slomski, R.; Zaleska-Medynska, A.; Jurga, S. Size and shape-dependent cytotoxicity profile of gold nanoparticles for biomedical applications. J. Mater. Sci. Mater. Med. 2017, 28, 92. [Google Scholar] [CrossRef]
- Sultana, S.; Djaker, N.; Boca-Farcau, S.; Salerno, M.; Charnaux, N.; Astilean, S.; Hlawaty, H.; de la Chapelle, M.L. Comparative toxicity evaluation of flower-shaped and spherical gold nanoparticles on human endothelial cells. Nanotechnology 2015, 26, 055101. [Google Scholar] [CrossRef]
- Enea, M.; Peixoto de Almeida, M.; Eaton, P.; Dias da Silva, D.; Pereira, E.; Soares, M.E.; Bastos, M.L.; Carmo, H. A multiparametric study of gold nanoparticles cytotoxicity, internalization and permeability using an in vitro model of blood-brain barrier. Influence of size, shape and capping agent. Nanotoxicology 2019, 13. [Google Scholar] [CrossRef]
- Fraga, S.; Brandao, A.; Soares, M.E.; Morais, T.; Duarte, J.A.; Pereira, L.; Soares, L.; Neves, C.; Pereira, E.; Bastos Mde, L.; et al. Short-and long-term distribution and toxicity of gold nanoparticles in the rat after a single-dose intravenous administration. Nanomed. Nanotechnol. Biol. Med. 2014, 10, 1757–1766. [Google Scholar] [CrossRef] [PubMed]
- Morais, T.; Soares, M.E.; Duarte, J.A.; Soares, L.; Maia, S.; Gomes, P.; Pereira, E.; Fraga, S.; Carmo, H.; Bastos Mde, L. Effect of surface coating on the biodistribution profile of gold nanoparticles in the rat. Eur. J. Pharm. Biopharm. 2012, 80, 185–193. [Google Scholar] [CrossRef] [PubMed]
- Gioria, S.; Lobo Vicente, J.; Barboro, P.; La Spina, R.; Tomasi, G.; Urban, P.; Kinsner-Ovaskainen, A.; Francois, R.; Chassaigne, H. A combined proteomics and metabolomics approach to assess the effects of gold nanoparticles in vitro. Nanotoxicology 2016, 10, 736–748. [Google Scholar] [CrossRef] [PubMed]
- Lindeque, J.Z.; Matthyser, A.; Mason, S.; Louw, R.; Taute, C.J.F. Metabolomics reveals the depletion of intracellular metabolites in HepG2 cells after treatment with gold nanoparticles. Nanotoxicology 2018, 12, 251–262. [Google Scholar] [CrossRef] [PubMed]
- Shin, T.H.; Lee, D.Y.; Lee, H.S.; Park, H.J.; Jin, M.S.; Paik, M.J.; Manavalan, B.; Mo, J.S.; Lee, G. Integration of metabolomics and transcriptomics in nanotoxicity studies. BMB Rep. 2018, 51, 14–20. [Google Scholar] [CrossRef] [PubMed]
- Lindon, J.C.; Holmes, E.; Nicholson, J.K. Metabonomics techniques and applications to pharmaceutical research & development. Pharm. Res. 2006, 23, 1075–1088. [Google Scholar] [CrossRef]
- Araujo, A.M.; Bastos, M.L.; Fernandes, E.; Carvalho, F.; Carvalho, M.; Guedes de Pinho, P. GC-MS metabolomics reveals disturbed metabolic pathways in primary mouse hepatocytes exposed to subtoxic levels of 3,4-methylenedioxymethamphetamine (MDMA). Arch. Toxicol. 2018, 92, 3307–3323. [Google Scholar] [CrossRef]
- Palomino-Schatzlein, M.; Garcia, H.; Gutierrez-Carcedo, P.; Pineda-Lucena, A.; Herance, J.R. Assessment of gold nanoparticles on human peripheral blood cells by metabolic profiling with 1H-NMR spectroscopy, a novel translational approach on a patient-specific basis. PloS. ONE 2017, 12, e0182985. [Google Scholar] [CrossRef]
- Lopez-Chaves, C.; Soto-Alvaredo, J.; Montes-Bayon, M.; Bettmer, J.; Llopis, J.; Sanchez-Gonzalez, C. Gold nanoparticles: Distribution, bioaccumulation and toxicity. In vitro and in vivo studies. Nanomed. Nanotechnol. Biol. Med. 2018, 14, 1–12. [Google Scholar] [CrossRef]
- Bastus, N.G.; Comenge, J.; Puntes, V. Kinetically controlled seeded growth synthesis of citrate-stabilized gold nanoparticles of up to 200 nm: Size focusing versus Ostwald ripening. Langmuir 2011, 27, 11098–11105. [Google Scholar] [CrossRef]
- Zabetakis, K.; Ghann, W.E.; Kumar, S.; Daniel, M.-C. Effect of high gold salt concentrations on the size and polydispersity of gold nanoparticles prepared by an extended Turkevich–Frens method. Gold Bull. 2012, 45, 203–211. [Google Scholar] [CrossRef]
- Yuan, H.; Khoury, C.G.; Hwang, H.; Wilson, C.M.; Grant, G.A.; Vo-Dinh, T. Gold nanostars: Surfactant-free synthesis, 3D modelling, and two-photon photoluminescence imaging. Nanotechnology 2012, 23, 075102. [Google Scholar] [CrossRef] [PubMed]
- Chan, E.C.Y.; Pasikanti, K.K.; Nicholson, J.K. Global urinary metabolic profiling procedures using gas chromatography–mass spectrometry. Nat. Protoc. 2011, 6, 1483. [Google Scholar] [CrossRef] [PubMed]
- Wheelock, Å.M.; Wheelock, C.E. Trials and tribulations of ‘omics data analysis: Assessing quality of SIMCA-based multivariate models using examples from pulmonary medicine. Mol. BioSyst. 2013, 9, 2589–2596. [Google Scholar] [CrossRef] [PubMed]
- Worley, B.; Powers, R. Multivariate analysis in metabolomics. Curr. Metabol. 2013, 1, 92–107. [Google Scholar] [CrossRef]
- Chong, J.; Soufan, O.; Li, C.; Caraus, I.; Li, S.; Bourque, G.; Wishart, D.S.; Xia, J. MetaboAnalyst 4.0: Towards more transparent and integrative metabolomics analysis. Nucleic Acids Res. 2018, 46, W486–W494. [Google Scholar] [CrossRef]
- Lowry, O.H.; Rosebrough, N.J.; Farr, A.L.; Randall, R.J. Protein measurement with the Folin phenol reagent. J. Biol. Chem. 1951, 193, 265–275. [Google Scholar]
- Martins, M.J.; Roque Bravo, R.; Enea, M.; Carmo, H.; Carvalho, F.; Bastos, M.L.; Dinis-Oliveira, R.J.; Dias da Silva, D. Ethanol addictively enhances the in vitro cardiotoxicity of cocaine through oxidative damage, energetic deregulation, and apoptosis. Arch. Toxicol. 2018, 92, 2311–2325. [Google Scholar] [CrossRef]
- de Puig, H.; Tam, J.O.; Yen, C.W.; Gehrke, L.; Hamad-Schifferli, K. Extinction coefficient of gold nanostars. J. Phys. Chem. C 2015, 119, 17408–17415. [Google Scholar] [CrossRef]
- Cheng, X.; Tian, X.; Wu, A.; Li, J.; Tian, J.; Chong, Y.; Chai, Z.; Zhao, Y.; Chen, C.; Ge, C. Protein corona influences cellular uptake of gold nanoparticles by phagocytic and nonphagocytic cells in a size-dependent manner. ACS Appl. Mater. Interfaces 2015, 7, 20568–20575. [Google Scholar] [CrossRef]
- Bhamidipati, M.; Fabris, L. Multiparametric assessment of gold nanoparticle cytotoxicity in cancerous and healthy cells: The role of size, shape, and surface chemistry. Bioconjugate Chem. 2017, 28, 449–460. [Google Scholar] [CrossRef] [PubMed]
- Li, J.; Li, J.J.; Zhang, J.; Wang, X.; Kawazoe, N.; Chen, G. Gold nanoparticle size and shape influence on osteogenesis of mesenchymal stem cells. Nanoscale 2016, 8, 7992–8007. [Google Scholar] [CrossRef] [PubMed]
- Wang, J.Y.; Chen, J.; Yang, J.; Wang, H.; Shen, X.; Sun, Y.M.; Guo, M.; Zhang, X.D. Effects of surface charges of gold nanoclusters on long-term in vivo biodistribution, toxicity, and cancer radiation therapy. Int. J. Nanomed. 2016, 11, 3475–3485. [Google Scholar] [CrossRef]
- Sonavane, G.; Tomoda, K.; Makino, K. Biodistribution of colloidal gold nanoparticles after intravenous administration: Effect of particle size. Colloids Surf. B Biointerfaces 2008, 66, 274–280. [Google Scholar] [CrossRef]
- Ding, L.; Yao, C.; Yin, X.; Li, C.; Huang, Y.; Wu, M.; Wang, B.; Guo, X.; Wang, Y.; Wu, M. Size, shape and protein corona determine cellular uptake and removal mechanisms of gold nanoparticles. Small 2018, 14, e1801451. [Google Scholar] [CrossRef]
- Yao, M.; He, L.; McClements, D.J.; Xiao, H. Uptake of gold nanoparticles by intestinal epithelial cells: Impact of particle size on their absorption, accumulation, and toxicity. J. Agric. Food Chem. 2015, 63, 8044–8049. [Google Scholar] [CrossRef]
- Lee, Y.J.; Ahn, E.Y.; Park, Y. Shape-dependent cytotoxicity and cellular uptake of gold nanoparticles synthesized using green tea extract. Nanoscale Res. Lett. 2019, 14, 129. [Google Scholar] [CrossRef]
- Sun, Y.N.; Wang, C.D.; Zhang, X.M.; Ren, L.; Tian, X.H. Shape dependence of gold nanoparticles on in vivo acute toxicological effects and biodistribution. J. Nanosci. Nanotechnol. 2011, 11, 1210–1216. [Google Scholar] [CrossRef]
- Herance, J.R.; Garcia, H.; Gutierrez-Carcedo, P.; Navalon, S.; Pineda-Lucena, A.; Palomino-Schatzlein, M. A translational approach to assess the metabolomic impact of stabilized gold nanoparticles by NMR spectroscopy. Analyst 2019, 144, 1265–1274. [Google Scholar] [CrossRef]
- Mastrangelo, A.; Ferrarini, A.; Rey-Stolle, F.; Garcia, A.; Barbas, C. From sample treatment to biomarker discovery: A tutorial for untargeted metabolomics based on GC-(EI)-Q-MS. Anal. Chim. Acta 2015, 900, 21–35. [Google Scholar] [CrossRef]
- Eriksson, L.; Trygg, J.; Wold, S. CV-ANOVA for significance testing of PLS and OPLS (R) models. J. Chemom. 2008, 22, 594–600. [Google Scholar] [CrossRef]
- Trygg, J.; Holmes, E.; Lundstedt, T. Chemometrics in metabonomics. J. Proteom. Res. 2007, 6, 469–479. [Google Scholar] [CrossRef] [PubMed]
- Westerhuis, J.A.; Hoefsloot, H.C.J.; Smit, S.; Vis, D.J.; Smilde, A.K.; van Velzen, E.J.J.; van Duijnhoven, J.P.M.; van Dorsten, F.A. Assessment of PLSDA cross validation. Metabolomics 2008, 4, 81–89. [Google Scholar] [CrossRef]
- Iswarya, V.; Manivannan, J.; De, A.; Paul, S.; Roy, R.; Johnson, J.B.; Kundu, R.; Chandrasekaran, N.; Mukherjee, A.; Mukherjee, A. Surface capping and size-dependent toxicity of gold nanoparticles on different trophic levels. Environ. Sci. Pollut. Res. Int. 2016, 23, 4844–4858. [Google Scholar] [CrossRef] [PubMed]
- Upadhyay, G.; Gupta, S.P.; Prakash, O.; Singh, M.P. Pyrogallol-mediated toxicity and natural antioxidants: Triumphs and pitfalls of preclinical findings and their translational limitations. Chem. Biol. Interact. 2010, 183, 333–340. [Google Scholar] [CrossRef] [PubMed]
- Mailloux, R.J.; Young, A.; Chalker, J.; Gardiner, D.; O’Brien, M.; Slade, L.; Brosnan, J.T. Choline and dimethylglycine produce superoxide/hydrogen peroxide from the electron transport chain in liver mitochondria. FEBS Lett. 2016, 590, 4318–4328. [Google Scholar] [CrossRef]
- Li, J.J.; Hartono, D.; Ong, C.N.; Bay, B.H.; Yung, L.Y. Autophagy and oxidative stress associated with gold nanoparticles. Biomaterials 2010, 31, 5996–6003. [Google Scholar] [CrossRef]
- Birben, E.; Sahiner, U.M.; Sackesen, C.; Erzurum, S.; Kalayci, O. Oxidative stress and antioxidant defense. World Allergy Organ. J. 2012, 5, 9–19. [Google Scholar] [CrossRef]
- Han, D.; Hanawa, N.; Saberi, B.; Kaplowitz, N. Mechanisms of liver injury. III. Role of glutathione redox status in liver injury. Am. J. Physiol. Gastrointest. Liver Physiol. 2006, 291, G1–G7. [Google Scholar] [CrossRef]
- Lu, S.C. Regulation of glutathione synthesis. Mol. Asp. Med. 2009, 30, 42–59. [Google Scholar] [CrossRef]
- Little, J.L.; Wheeler, F.B.; Fels, D.R.; Koumenis, C.; Kridel, S.J. Inhibition of fatty acid synthase induces endoplasmic reticulum stress in tumor cells. Cancer Res. 2007, 67, 1262–1269. [Google Scholar] [CrossRef] [PubMed]
- Ichi, I.; Kono, N.; Arita, Y.; Haga, S.; Arisawa, K.; Yamano, M.; Nagase, M.; Fujiwara, Y.; Arai, H. Identification of genes and pathways involved in the synthesis of Mead acid (20:3n-9), an indicator of essential fatty acid deficiency. Biochim. Biophys. Acta 2014, 1841, 204–213. [Google Scholar] [CrossRef] [PubMed]
- Domenichiello, A.F.; Kitson, A.P.; Bazinet, R.P. Is docosahexaenoic acid synthesis from α-linolenic acid sufficient to supply the adult brain? Prog. Lipid Res. 2015, 59, 54–66. [Google Scholar] [CrossRef] [PubMed]
- Serhan, C.N.; Yacoubian, S.; Yang, R. Anti-inflammatory and proresolving lipid mediators. Annu. Rev. Pathol. 2008, 3, 279–312. [Google Scholar] [CrossRef] [PubMed]
- Massey, K.A.; Nicolaou, A. Lipidomics of polyunsaturated-fatty-acid-derived oxygenated metabolites. Biochem. Soc. Trans. 2011, 39, 1240–1246. [Google Scholar] [CrossRef] [PubMed]
- Ayala, A.; Munoz, M.F.; Arguelles, S. Lipid peroxidation: Production, metabolism, and signaling mechanisms of malondialdehyde and 4-hydroxy-2-nonenal. Oxidative Med. Cell. Longev. 2014, 2014, 360438. [Google Scholar] [CrossRef]
- Browning, J.D.; Horton, J.D. Molecular mediators of hepatic steatosis and liver injury. J. Clin. Investig. 2004, 114, 147–152. [Google Scholar] [CrossRef]
- Rodriguez-Cuenca, S.; Pellegrinelli, V.; Campbell, M.; Oresic, M.; Vidal-Puig, A. Sphingolipids and glycerophospholipids-The ’ying and yang’ of lipotoxicity in metabolic diseases. Prog. Lipid Res. 2017, 66, 14–29. [Google Scholar] [CrossRef]
- Calder, P.C. N-3 polyunsaturated fatty acids, inflammation, and inflammatory diseases. Am. J. Clin. Nutr. 2006, 83, 1505s–1519s. [Google Scholar] [CrossRef]
- Illes, P.; Klotz, K.N.; Lohse, M.J. Signaling by extracellular nucleotides and nucleosides. Naunyn Schmiedeberg Arch. Pharmacol. 2000, 362, 295–298. [Google Scholar] [CrossRef]
- Moffatt, B.A.; Ashihara, H. Purine and pyrimidine nucleotide synthesis and metabolism. Arabidopsis B. 2002, 1, e0018. [Google Scholar] [CrossRef] [PubMed]
- Nyhan, W.L. Disorders of purine and pyrimidine metabolism. Mol. Genet. Metab. 2005, 86, 25–33. [Google Scholar] [CrossRef] [PubMed]
- Quinones-Valdez, G.; Tran, S.S.; Jun, H.I.; Bahn, J.H.; Yang, E.W.; Zhan, L.; Brummer, A.; Wei, X.; Van Nostrand, E.L.; Pratt, G.A.; et al. Regulation of RNA editing by RNA-binding proteins in human cells. Commun. Biol. 2019, 2, 19. [Google Scholar] [CrossRef] [PubMed]
- Ayyar, V.S.; Almon, R.R.; DuBois, D.C.; Sukumaran, S.; Qu, J.; Jusko, W.J. Functional proteomic analysis of corticosteroid pharmacodynamics in rat liver: Relationship to hepatic stress, signaling, energy regulation, and drug metabolism. J. Proteom. 2017, 160, 84–105. [Google Scholar] [CrossRef]
- Zhang, L.; Wang, L.; Hu, Y.; Liu, Z.; Tian, Y.; Wu, X.; Zhao, Y.; Tang, H.; Chen, C.; Wang, Y. Selective metabolic effects of gold nanorods on normal and cancer cells and their application in anticancer drug screening. Biomaterials 2013, 34, 7117–7126. [Google Scholar] [CrossRef]
- Xu, B.; Chen, M.; Ji, X.; Mao, Z.; Zhang, X.; Wang, X.; Xia, Y. Metabolomic profiles delineate the potential role of glycine in gold nanorod-induced disruption of mitochondria and blood-testis barrier factors in TM-4 cells. Nanoscale 2014, 6, 8265–8273. [Google Scholar] [CrossRef]

 ) and nanostars (
 );
);  p value < 0.05;
 p value < 0.01;

 p value < 0.001 nanosphere-treated animals versus control;
  p value < 0.05;
 p value < 0.01;

 p value < 0.001 nanostars-treated animals versus control; or
  for p value between 0.05 and 0.1 in nanosphere-treated animals versus control.
 ) and nanostars (
 );
);  p value < 0.05;
 p value < 0.01;

 p value < 0.001 nanosphere-treated animals versus control;
  p value < 0.05;
 p value < 0.01;

 p value < 0.001 nanostars-treated animals versus control; or
  for p value between 0.05 and 0.1 in nanosphere-treated animals versus control.
| Measurement | Technique | Nanospheres | Nanostars | ||||
|---|---|---|---|---|---|---|---|
| Surface charge | Zeta Potential (mV) | DLS | −24.9 | −27.9 | |||
| Size | Hydrodynamic diameter (nm) | Polydispersity Index | DLS | 52.6 ± 0.1 | 0.256 | 64.4 ± 0.3 | 0.289 |
| Hydrodynamic diameter (nm) | NTA | 59.1 ± 2.5 | 60.0 ± 1.5 | ||||
| Core size (nm) | TEM | 40.0 ± 4.6 | 47.4 ± 10.7 | ||||
| Concentration | AuNPs/mL | NTA | (6.68 ± 0.08) × 1010 | (18.2 ± 0.8) × 1010 | |||
| Au (µg/mL) | GFAAS | 72.78 ± 4.17 | 180.33 ± 13.76 | ||||
| Tissue | Gold Concentration (ng/g) | Gold Concentration (% of the Injected Dose) | Number of AuNPs/g Organ | |||
|---|---|---|---|---|---|---|
| Nanospheres | Nanostars | Nanospheres | Nanostars | Nanospheres | Nanostars | |
| Liver | 3648 ± 329 ● a bbbb | 2697 ± 205 bbbb | 91.2 ± 5.27 aaa bbb | 77.2 ± 4.7 aaaa bbbb | (3.35 ± 0.30) × 109 a bbbb | (2.72 ± 0.21) × 109 bbbb |
| Spleen | 2624 ± 329 bbb | 2271 ± 202 bbbb | 3.7 ± 0.4 bbbb | 4.3 ± 0.5 bbb | (2.41 ± 0.30) × 109 bbb | (2.29 ± 0.20) × 109 bbbb |
| Lung | 31.7 ± 7.0 | 44.0 ± 6.7 | 0.09 ± 0.02 ● | 0.13 ± 0.01 | (2.91 ± 0.51) × 107 | (4.44 ± 0.56) × 107 |
| OPLS-DA Model | Component | R2X | R2Y | Q2 | Permutation Tests | p (CV-ANOVA) | |
|---|---|---|---|---|---|---|---|
| R2 | Q2 | ||||||
| Nanospheres versus control | 1 + 1 | 0.481 | 0.835 | 0.628 | 0.603 | −0.577 | 0.0053 |
| Nanostars versus control | 1 + 1 | 0.337 | 0.870 | 0.506 | 0.653 | −0.494 | 0.0242 |
| nanospheres versus nanostars | 1 + 1 | 0.336 | 0.882 | 0.568 | 0.663 | −0.566 | 0.0140 |
| Metabolites | Nanospheres versus Nanostars | Nanospheres versus Control | Nanostars versus Control | |||||||
|---|---|---|---|---|---|---|---|---|---|---|
| VIPs | p Value | Effect | VIPs | p Value | Effect | VIPs | p Value | Effect | ||
| Fatty acids | Oleic acid | 5.35 | 0.0335 |  | 6.39 | 0.0012 |   | 4.07 | 0.0324 |  |
| Palmitic acid | 9.62 | 0.0205 |  | 11.04 | 0.0013 |   | 6.01 | 0.0232 |  | |
| Linoleic acid | 8.58 | 0.1024 |  | 11.00 | 0.0015 |   | 9.73 | 0.0116 |  | |
| Palmitoleic acid | 3.27 | 0.068 |  | 1.68 | 0.0708 |  | 1.77 | >> 0.1 | - | |
| Docosahexaenoic acid | 1.66 | 0.0578 |  | 1.60 | 0.0010 |    | 1.36 | >> 0.1 | - | |
| Arachidonic acid | 2.24 | 0.0947 |  | 2.50 | 0.0031 |   | 1.5 | >> 0.1 | - | |
| 5,8,11-Eicosatrienoic acid | 6.89 | 0.0354 |  | 4.55 | 0.0120 |  | 2.45 | >> 0.1 | - | |
| Myristic acid | 1.04 | >> 0.1 | - | 1.24 | 0.0055 |   | 1.19 | >> 0.1 | - | |
| Organic acids and derivatives | Squalene | - | - | - | - | - | - | 1.27 | 0.0354 |  |
| Urea | 2.15 | >> 0.1 | - | 3.34 | >> 0.1 | - | 6.72 | 0.0550 |  | |
| N-Hydroxybenzamide | 2.08 | >> 0.1 | - | 2.14 | 0.0762 |  | 1.6 | ns | - | |
| Glyceric acid | 1.01 | >> 0.1 | - | 2.35 | 0.0021 |   | 3.15 | 0.0021 |   | |
| Maleic acid | 1.72 | 0.0853 |  | - | - | - | 1.4 | ns | - | |
| Propanoic acid | - | - | - | - | - | - | 1.2 | 0.0255 |  | |
| 2-Aminobenzoxazole | - | - | - | 2.14 | 0.0456 |  | 2.67 | ns | - | |
| Glycerol | - | - | - | 1.90 | >> 0.1 | - | 3.65 | 0.0286 |  | |
| Pyrogallol | 1.07 | 0.1052 |  | - | - | - | 1.2 | 0.0569 |  | |
| Inorganic acids | Phosphoric acid | 7.13 | 0.0151 |  | - | - | - | 8.89 | 0.0022 |   |
| Boric acid | 1.70 | 0.0649 |  | - | - | - | 1.7 | 0.1017 |  | |
| Benzene and substituted derivatives | o-Ethyltoluene | 1.30 | 0.0314 | 1.32 | >> 0.1 | - | 1.63 | ns | - | |
| Aminoacids and derivatives | L-Lysine | 1.58 | 0.0325 |  | - | - | - | 1.31 | ns | - |
| L-isoleucine | - | - | - | 1.60 | >> 0.1 | - | 2.43 | 0.0681 |  | |
| L-proline | 1.25 | >> 0.1 | - | 2.97 | >> 0.1 | - | 4.23 | 0.0104 |  | |
| L-serine | 1.01 | >> 0.1 | - | 3.8 | >> 0.1 | - | 5.4 | 0.0737 |  | |
| L-threonine | 2.30 | >> 0.1 | - | 2.11 | >> 0.1 | - | 5.02 | 0.0778 |  | |
| Dimethylglicine | 3.57 | 0.0061 |   | 2.15 | 0.0941 |  | 2.1 | 0.0610 |  | |
| Nucleoside/Nucleotide | Inosine | 11.4 | 0.0014 |   | 4.77 | >> 0.1 | - | 13.04 | <0.0001 |     |
| Uridine | 2.07 | 0.0078 |   | 3.76 | 0.0296 |  | 5.52 | 0.0016 |   | |
| Uracil | 2.92 | 0.0046 |   | 1.19 | 0.0637 |  | 4.24 | 0.0003 |    | |
| Sugars | Myoinositol | 1.90 | >>0.1 | - | 2.06 | >> 0.1 | - | 2.45 | 0.0709 |  |
| D-Psicofuranose | 1.16 | >>0.1 | - | 2.08 | >> 0.1 | - | 3.01 | 0.066 |  | |
| Unknown | Unknown 1 | 1.67 | 0.0022 |   | - | - | - | 1.2 | >> 0.1 | - |
| Unknown 2 | 11.35 | 0.0076 |   | 10.37 | >> 0.1 | - | 2.58 | >> 0.1 | - | |
| Unknown 3 | 2.50 | 0.0045 |   | 1.39 | >> 0.1 | - | 1.11 | >> 0.1 | - | |
 and downregulated marked with
  or with
  and
and  (p value between 0.05 and 0.1); - discriminant not found in the comparison; ns: not statistically different.
© 2019 by the authors. Licensee MDPI, Basel, Switzerland. This article is an open access article distributed under the terms and conditions of the Creative Commons Attribution (CC BY) license (http://creativecommons.org/licenses/by/4.0/).
Share and Cite
Enea, M.; Araújo, A.M.; Peixoto de Almeida, M.; Soares, M.E.; Gonçalves-Monteiro, S.; Guedes de Pinho, P.; Pereira, E.; Bastos, M.d.L.; Carmo, H. A Metabolomic Approach for the In Vivo Study of Gold Nanospheres and Nanostars after a Single-Dose Intravenous Administration to Wistar Rats. Nanomaterials 2019, 9, 1606. https://doi.org/10.3390/nano9111606
Enea M, Araújo AM, Peixoto de Almeida M, Soares ME, Gonçalves-Monteiro S, Guedes de Pinho P, Pereira E, Bastos MdL, Carmo H. A Metabolomic Approach for the In Vivo Study of Gold Nanospheres and Nanostars after a Single-Dose Intravenous Administration to Wistar Rats. Nanomaterials. 2019; 9(11):1606. https://doi.org/10.3390/nano9111606
Chicago/Turabian StyleEnea, Maria, Ana Margarida Araújo, Miguel Peixoto de Almeida, Maria Elisa Soares, Salomé Gonçalves-Monteiro, Paula Guedes de Pinho, Eulália Pereira, Maria de Lourdes Bastos, and Helena Carmo. 2019. "A Metabolomic Approach for the In Vivo Study of Gold Nanospheres and Nanostars after a Single-Dose Intravenous Administration to Wistar Rats" Nanomaterials 9, no. 11: 1606. https://doi.org/10.3390/nano9111606
APA StyleEnea, M., Araújo, A. M., Peixoto de Almeida, M., Soares, M. E., Gonçalves-Monteiro, S., Guedes de Pinho, P., Pereira, E., Bastos, M. d. L., & Carmo, H. (2019). A Metabolomic Approach for the In Vivo Study of Gold Nanospheres and Nanostars after a Single-Dose Intravenous Administration to Wistar Rats. Nanomaterials, 9(11), 1606. https://doi.org/10.3390/nano9111606


