Article

Thermal Stability Evaluation of Polystyrene-Mg/Zn/Al LDH Nanocomposites

by
Miguel Ángel De la Rosa-Guzmán
1,2,
Ariel Guzmán-Vargas
1,
Nicolás Cayetano-Castro
3,
José Manuel Del Río
2,
Mónica Corea
2,* and
María de Jesús Martínez-Ortiz
1,*
1
Instituto Politécnico Nacional-ESIQIE, Laboratorio de Investigación en Materiales Porosos, Catálisis Ambiental y Química Fina, UPALM, Edificio 7 P. B., Zacatenco, C. P., Ciudad de México 07738, Mexico
2
Instituto Politécnico Nacional-ESIQIE, Laboratorio de Investigación en Polímeros y Nanomateriales, UPALM, Edificio Z-5, P. B., Zacatenco, Gustavo A. Madero, C. P., Ciudad de México 07738, Mexico
3
Instituto Politécnico Nacional, Centro de Nanociencias Micro y Nanotecnologías, C.P., México D.F. 07300, Mexico
*
Authors to whom correspondence should be addressed.
Nanomaterials 2019, 9(11), 1528; https://doi.org/10.3390/nano9111528
Submission received: 1 October 2019 / Revised: 21 October 2019 / Accepted: 24 October 2019 / Published: 27 October 2019

Abstract

:
A series of samples of Mg/Zn/Al LDHs (layered double hydroxides) materials was prepared by the co-precipitation and urea hydrolysis methods. They were modified with organic surfactants (acrylate and oleate anions) and characterized by X-ray diffraction, which corroborated the intercalation of anionic species into the interlayer space. The hydrophobized materials were incorporated at low contents (10 and 15 wt.%) to polystyrene, which was synthesized by emulsion polymerization techniques. The polymeric composites were analyzed by thermogravimetry to determine the decomposition temperature. The results demonstrated that the materials with Zn presented the greatest increment in the degradation temperature (7 °C < T < 54 °C). Moreover, the Friedman, Flynn–Wall–Ozawa, and Coats–Redfern models were compared to obtain the kinetic parameters of degradation process. The obtained order of decomposition of the Coats–Redfern model showed that the decomposition process occurs in at least two stages. Finally, the addition of environmentally friendly modified Layered Double Hydroxides (LDH) nanomaterials to the polystyrene (PS) matrix allowed for obtaining polymeric composites with higher thermal stability, retarding the decomposition process of PS.

Graphical Abstract

1. Introduction

Flame retardants (FRs) are additives that have been incorporated into polymers to reduce their flammability [1]. FRs are used to minimize ignition, pyrolysis, and combustion in polymeric matrices in order to enhance the properties of composite materials [2,3,4]. The main chemical groups used as FRs are organic-halogen compounds, organic-phosphorus compounds, metal hydroxides, and cationic clays [4,5,6]. Additionally, a good dispersion of flame retardants within a polymeric matrix is an important parameter for increasing the decomposition temperature, modifying the ignition point, and providing greater thermal stability [7,8,9].
This can be accomplished by the organophilization of the inorganic nano-additive, which forms a barrier that minimizes the mass transfer that is associated with polymer degradation [1,10]. In addition, such barriers also serve to reduce the peak in the heat release rate [11]. Consequently, the thermal stability of the inorganic additive is an important factor to consider in the structure and morphology of composite materials [12,13].
On the other hand, Layered Double Hydroxides (LDH) have been used as additives in organic polymers to increase the mechanical, thermal, flame retardant, and barrier properties, as well as to improve their strength [6,14,15]. LDH materials, which have also referred as anionic clays or hydrotalcite like materials, are anion- exchangeable layered compounds: divalent (MII) and trivalent (MIII) cations are bonded octahedrally by OH groups to form brucite-like layers [16,17]. Their general formula is: [ M 1 x I I M x I I I ( O H ) 2 ] x [ A x / n n ] · m H 2 O , where An− represents the compensating negatively-charged species, located within the interlayer space [18,19,20].
In recent researches, the incorporation of hydrotalcite type materials has had different applications, such as pharmaceuticals, adsorbents, catalysts, as well as additives in polymeric materials [5,21].
Anionic clays have tunable properties and the possibility of anion exchange. These characteristics allow for the development of materials with hydrophobic surfaces, which is necessary to achieve a good interaction with organic materials, such as polymeric matrices [10,22]. However, the presence of inorganic anions and water in the interlayer space of the structure makes the incorporation of organic anions in LDH materials that are desirable to improve the dispersion into polymeric materials difficult and it could cause the formation of particle aggregates in the matrix [6,23]. The incorporation of LDHs increases the degradation temperature of nanocomposites and influences their degradation rate [24].
Some works have reported the incorporation of LDH (Zn-Al, Co-Al, and Mg-Al) in polystyrene matrixes in order to be used as flame retardants and thermal stabilizers. Their results showed an increment of thermal stability close to 18 °C when LDH are incorporated at 5 wt.% and modified with dodecyl sulfate anion [9].
It has been reported that LDH materials, as flame retardant, present three characteristics through the thermal decomposition as heat absorption, gas dilution, and ash formation [5]. In addition, during this process, the loss of interlayer water in LDH, as well as intercalated anions and the water generated by the dehydroxylation, allows for the reduction of the available fuel. For this reason, the mass loss rate is significantly reduced. In this work, a variety of multicationic LDHs (containing Mg, Zn, and Al) were synthesized by the co-precipitation and urea hydrolysis methods. These materials were modified with oleate and acrylate anions, so that they could be dispersed into polystyrene (PS) matrix, because they are short-chain organic compounds and they have a good hydrophobic-lipophilic balance (HLB ≈ 1); to be precise, the lipophilic part has almost the same size of the hydrophilic part. This characteristic allows for the inorganic materials, such as LDH, to be hydrophobized [25,26] Thus, the incorporation of modified LDH materials was carried out and their thermal stability was studied in order to increase the thermal stability of the PS matrix, generating environmentally friendly composite materials.

2. Materials and Methods

2.1. Materials

Magnesium nitrate hexahydrate (Mg(NO3)2·6H2O 98%), zinc nitrate hexahydrate (Zn(NO3)2·6H2O 98%), aluminum nitrate nonahydrate (Al(NO3)3·9H2O 98%), sodium hydroxide (NaOH 98%), acrylic acid (C3H4O2 99%), oleic acid (C18H34O2 99%), styrene (C8H8 99%), sodium persulfate (Na2S2O8 98%), and toluene (C8H8 99.5%) were all obtained from Sigma-Aldrich (Saint Louis, MO 63103, USA). Additionally, surfactant ABEX EP-100 35% (SOLVEY Toronto, ON, M5J2T-3, CA) and distilled water were also used as received.

2.2. LDH Synthesis

Mg/Zn/Al LDH materials with a constant MII/MIII mole ratio of 3 were prepared by co-precipitation at constant pH and by the urea hydrolysis methods while using Zn(NO3)2·6H2O, Mg(NO3)2·6H2O, and Al(NO3)3·9H2O as precursors.
The use of two different methods of synthesis was established to obtain pure phases of the hydrotalcite like-materials. In the case of materials with a higher content of Zn, they must be synthesized by the urea hydrolysis method with the aim of avoiding the formation of the additional phase of ZnO, which is usually obtained when materials are synthetized by coprecipitation method [27,28,29]. Thus, the prepared samples were labeled according to their Mg and Zn content, Table 1, the synthesis methods, their respective theoretical molar ratio, and the last column presents the anionic exchange capacity (AEC) of the samples (mmol per gram of LDH), which is used to determine the amounts of organic anions that were intercalated in the these LDH samples.
Figure 1 shows a scheme of the LDH structure. It should be noted that Figure 1 also illustrate an octahedral unit to specify that, for each sample, the content of divalent cations (Mg2+ and/or Zn2+) and the trivalent cation (Al3+) were varied.

2.2.1. Co-Precipitation at Constant pH

The LDH samples were prepared at constant pH, with a 2 M NaOH solution. The pH was maintained constant while using a pH-Stat Titrando (Metrohm, Switzerland), as previously reported [30]. The obtained suspension was aged overnight at 80 °C for 13 h. The solids were washed with distilled water and dried at 80 °C for 15 h.

2.2.2. Urea Hydrolysis

Based on the method used by Alexandra Inayat et al. (2011) [31], metal nitrate salts were used as precursors, and they were mixed with urea/NH4NO3 in a three-neck flask. The suspension was stirred at 90 °C under a N2 atmosphere for 12 h. The obtained solid was washed with distilled water and then dried at 80 °C for 15 h.

2.3. Thermal Treatments

Synthesized materials by the co-precipitation method were calcined in air flow at 450 °C for 3 h to obtain the corresponding mixed oxides. In the case of samples that were prepared by urea hydrolysis, they were thermally treated in N2 flow at 450 °C for 3 h. Again, the control of the thermal treatment atmosphere for samples that were synthetized by urea hydrolysis method prevents the formation of ZnO as additional phase [29,32,33].

2.4. Modification of LDHs with Anionic Surfactants

LDH samples were modified with the anionic species of short chain organic compounds: acrylic acid (AAC) and oleic acid (AOL), in order to increase their compatibility with the polymeric matrix.

2.4.1. Acrylate Anion

Calcined LDH materials were added to an aqueous solution of acrylic acid, while using a molar ration of 1:1.25 according to their anion exchange capacity (AEC). The mixture was stirred at room temperature under N2 for seven days.

2.4.2. Oleate Anion

After thermal treatment, mixed oxides and oleic acid were added to a 50/50 v/v methanol/water solution, while using a molar ratio of 1:1.25 according to their anion exchange capacity (AEC). The mixtures were stirred for seven days at room temperature under N2.

2.5. Polystyrene Synthesis

Polystyrene was synthesized by emulsion polymerization to yield 200 g of latex containing 60 wt.% of solid and Table 2 provides the recipe details.
Polymerization was carried out at 75 °C under N2 while using a semi-continuous process in a 0.5 L jacketed glass reactor and a feeding tank. A dosing pump ensured a continuous flow of pre-emulsion material. The stirring speed and addition rate were controlled at 250 rpm and 1.3 g·min−1, respectively.

2.6. Nanocomposite Preparation

Dispersions of modified LDHs in toluene were stirred by ultrasound and then incorporated into the polystyrene matrix at different concentrations (10 and 15 wt.%). The mixtures were stirred for 24 h and, finally, solvent was removed and recuperated with a rotavapor at room temperature.

2.7. Characterization and Measurements

Powder X-ray diffraction (XRD) patterns were obtained with a Philips PRO instrument (Malvern, United Kingdom) while using Cu-Kα radiation (1.5406 Å, 35 kV, 25 mA). Materials were also characterized using Fourier transform infrared spectroscopy with attenuated total reflectance (FTIR-ATR, Perkin Elmer, FRONTIER, Waltham, MA USA) and MALDI-TOF ionization, Matrix-assisted laser desorption/ionization time-of-flight mass spectrometer, (AUTOFLEX MALDI-TOF, Bruker, DALTONIC, Billerica, MA USA). The thermal behavior of the nanocomposites from 30 to 720 °C was evaluated while using TGA, Thermogravimetric Analyzer and dTG analysis, derivate of the TG, (Perkin Elmer, STA 6000, Waltham, MA USA) with N2 flow of 20 mL·min−1 and scan rates of 5, 10, 20, and 30 °C·min−1. The microstructural analysis of polymeric composites was performed with a scanning electron microscope (SEM) (JEOL JSM6701F, Tokyo, Japan), working at 5.0 kV. Further, Au-Pd coating was made on the samples to increase the conductivity. The morphology of composites was also studied by transmission electron microscopy (TEM) (JEOL JEM-2100, Tokyo, Japan) working at 200 kV. The instrumental magnification ranged at 2 × 10⁵.

3. Results and Discussion
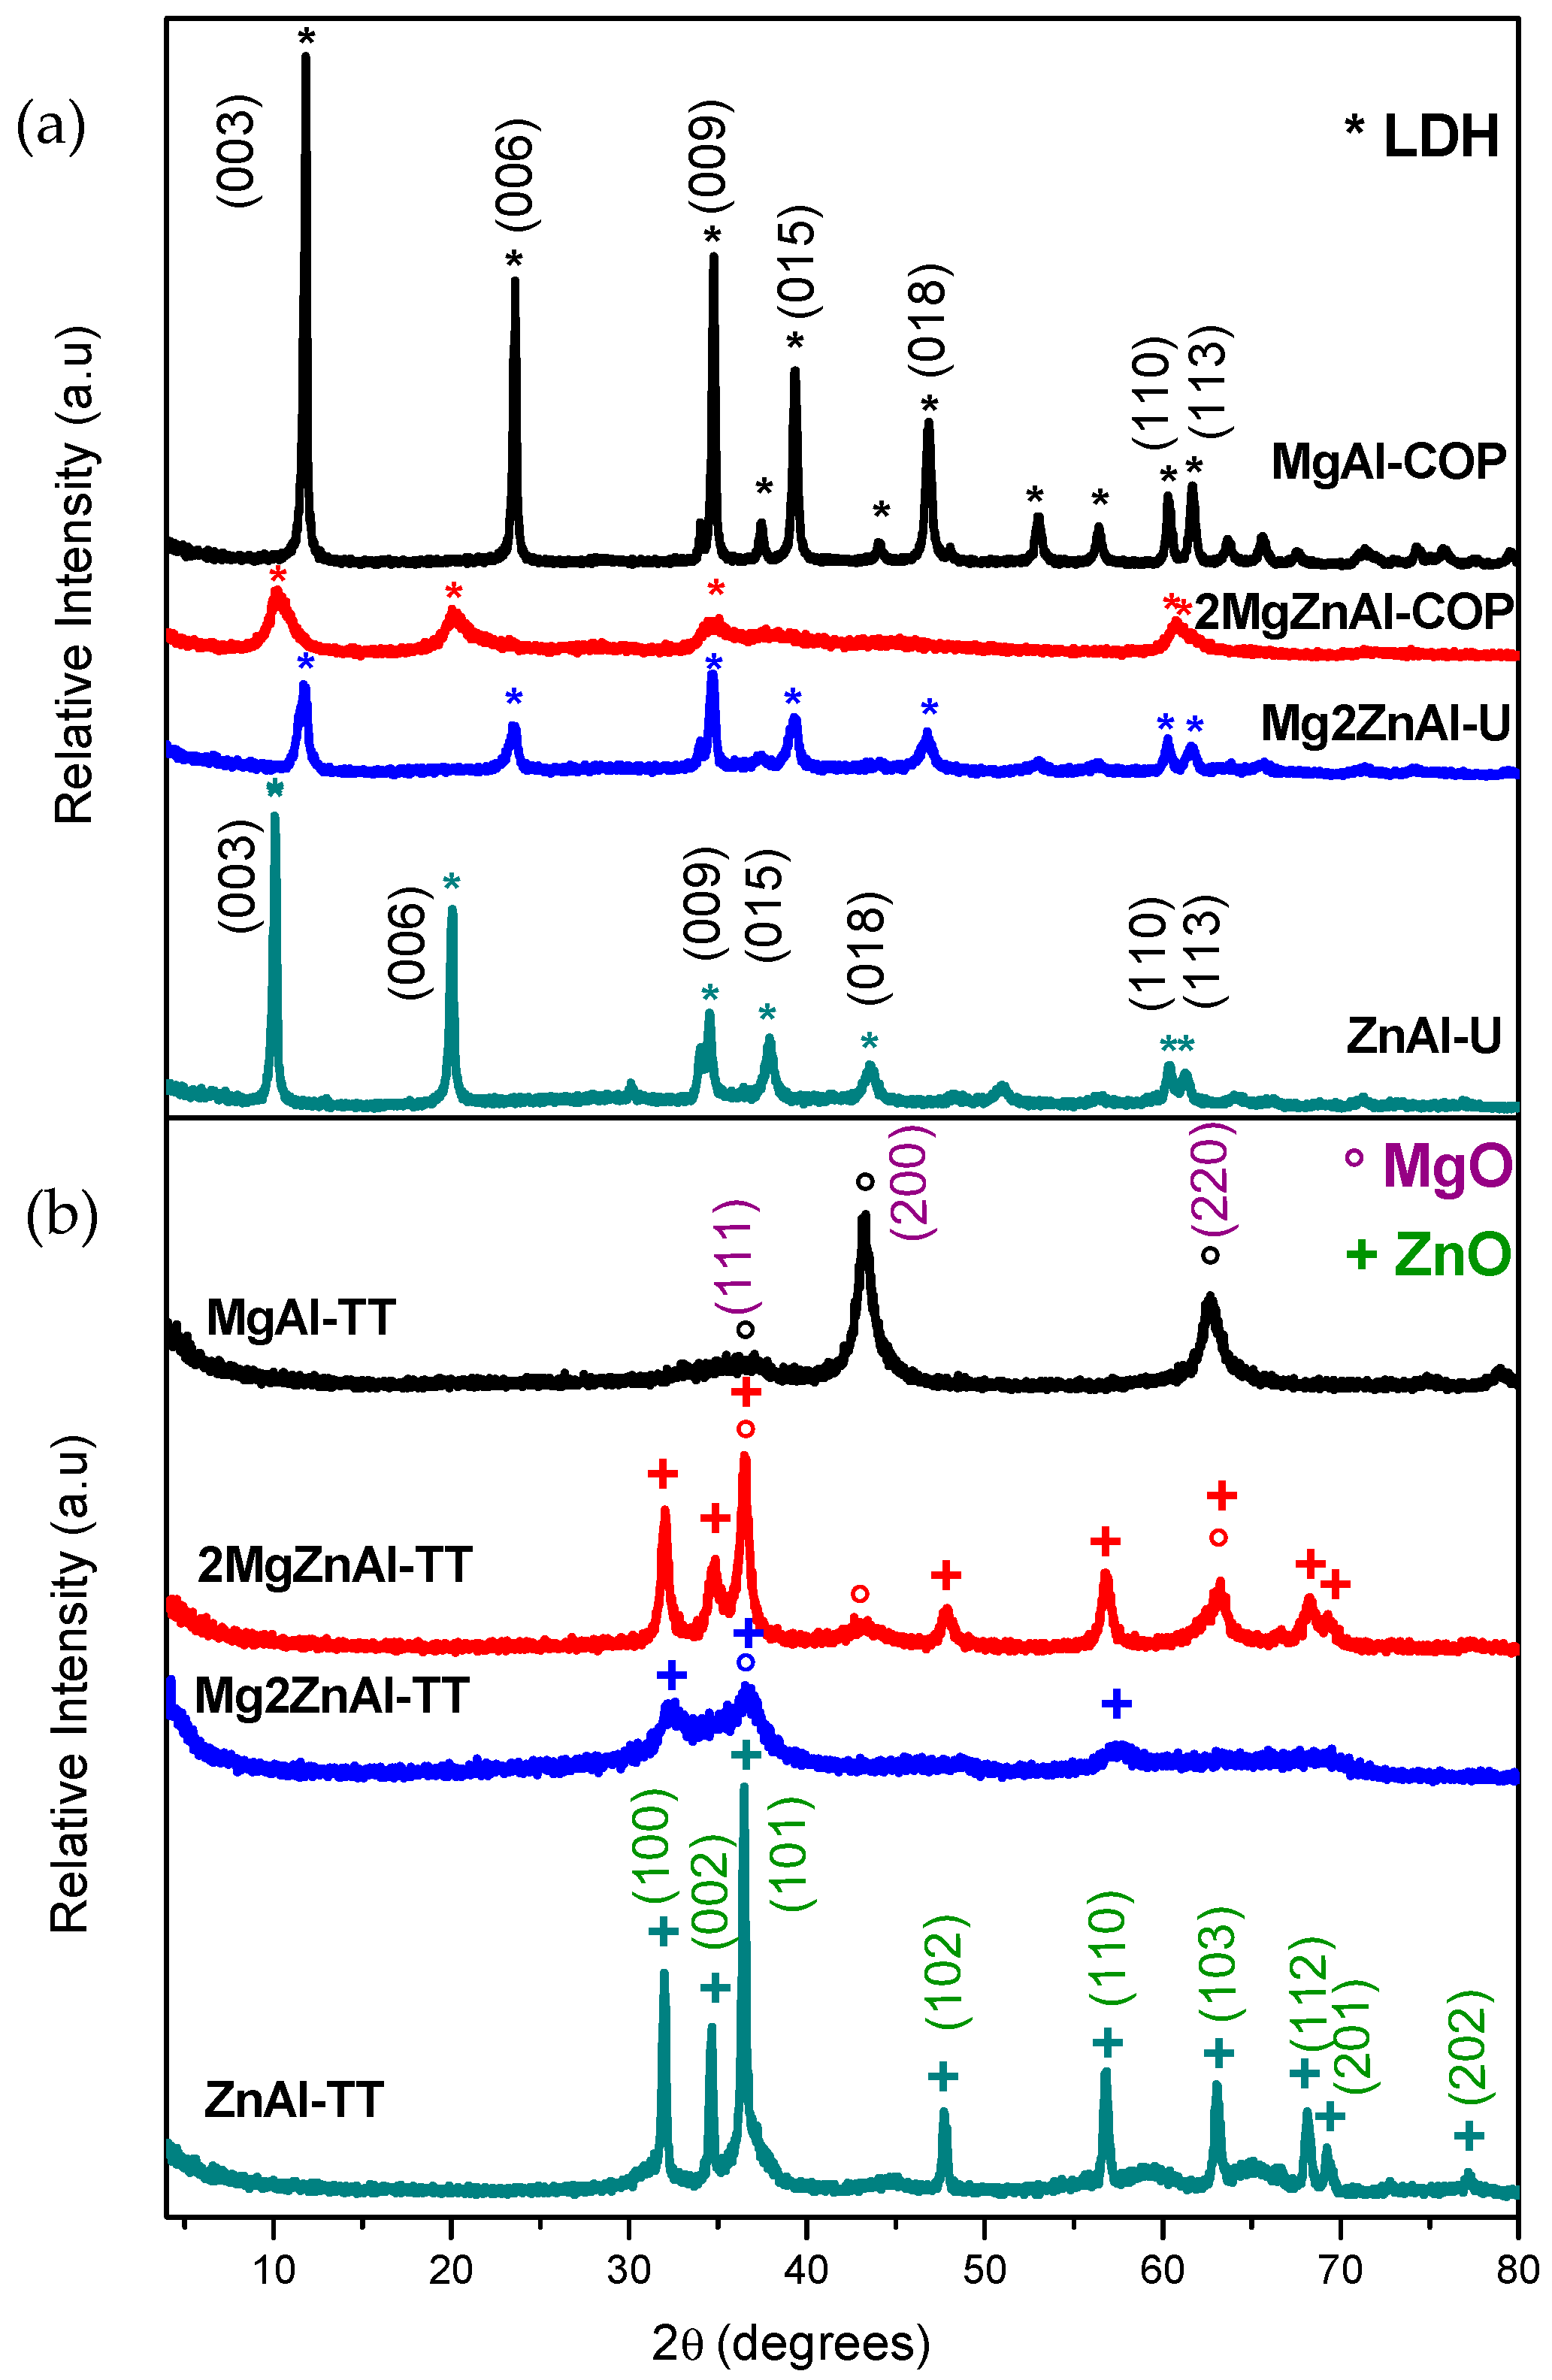
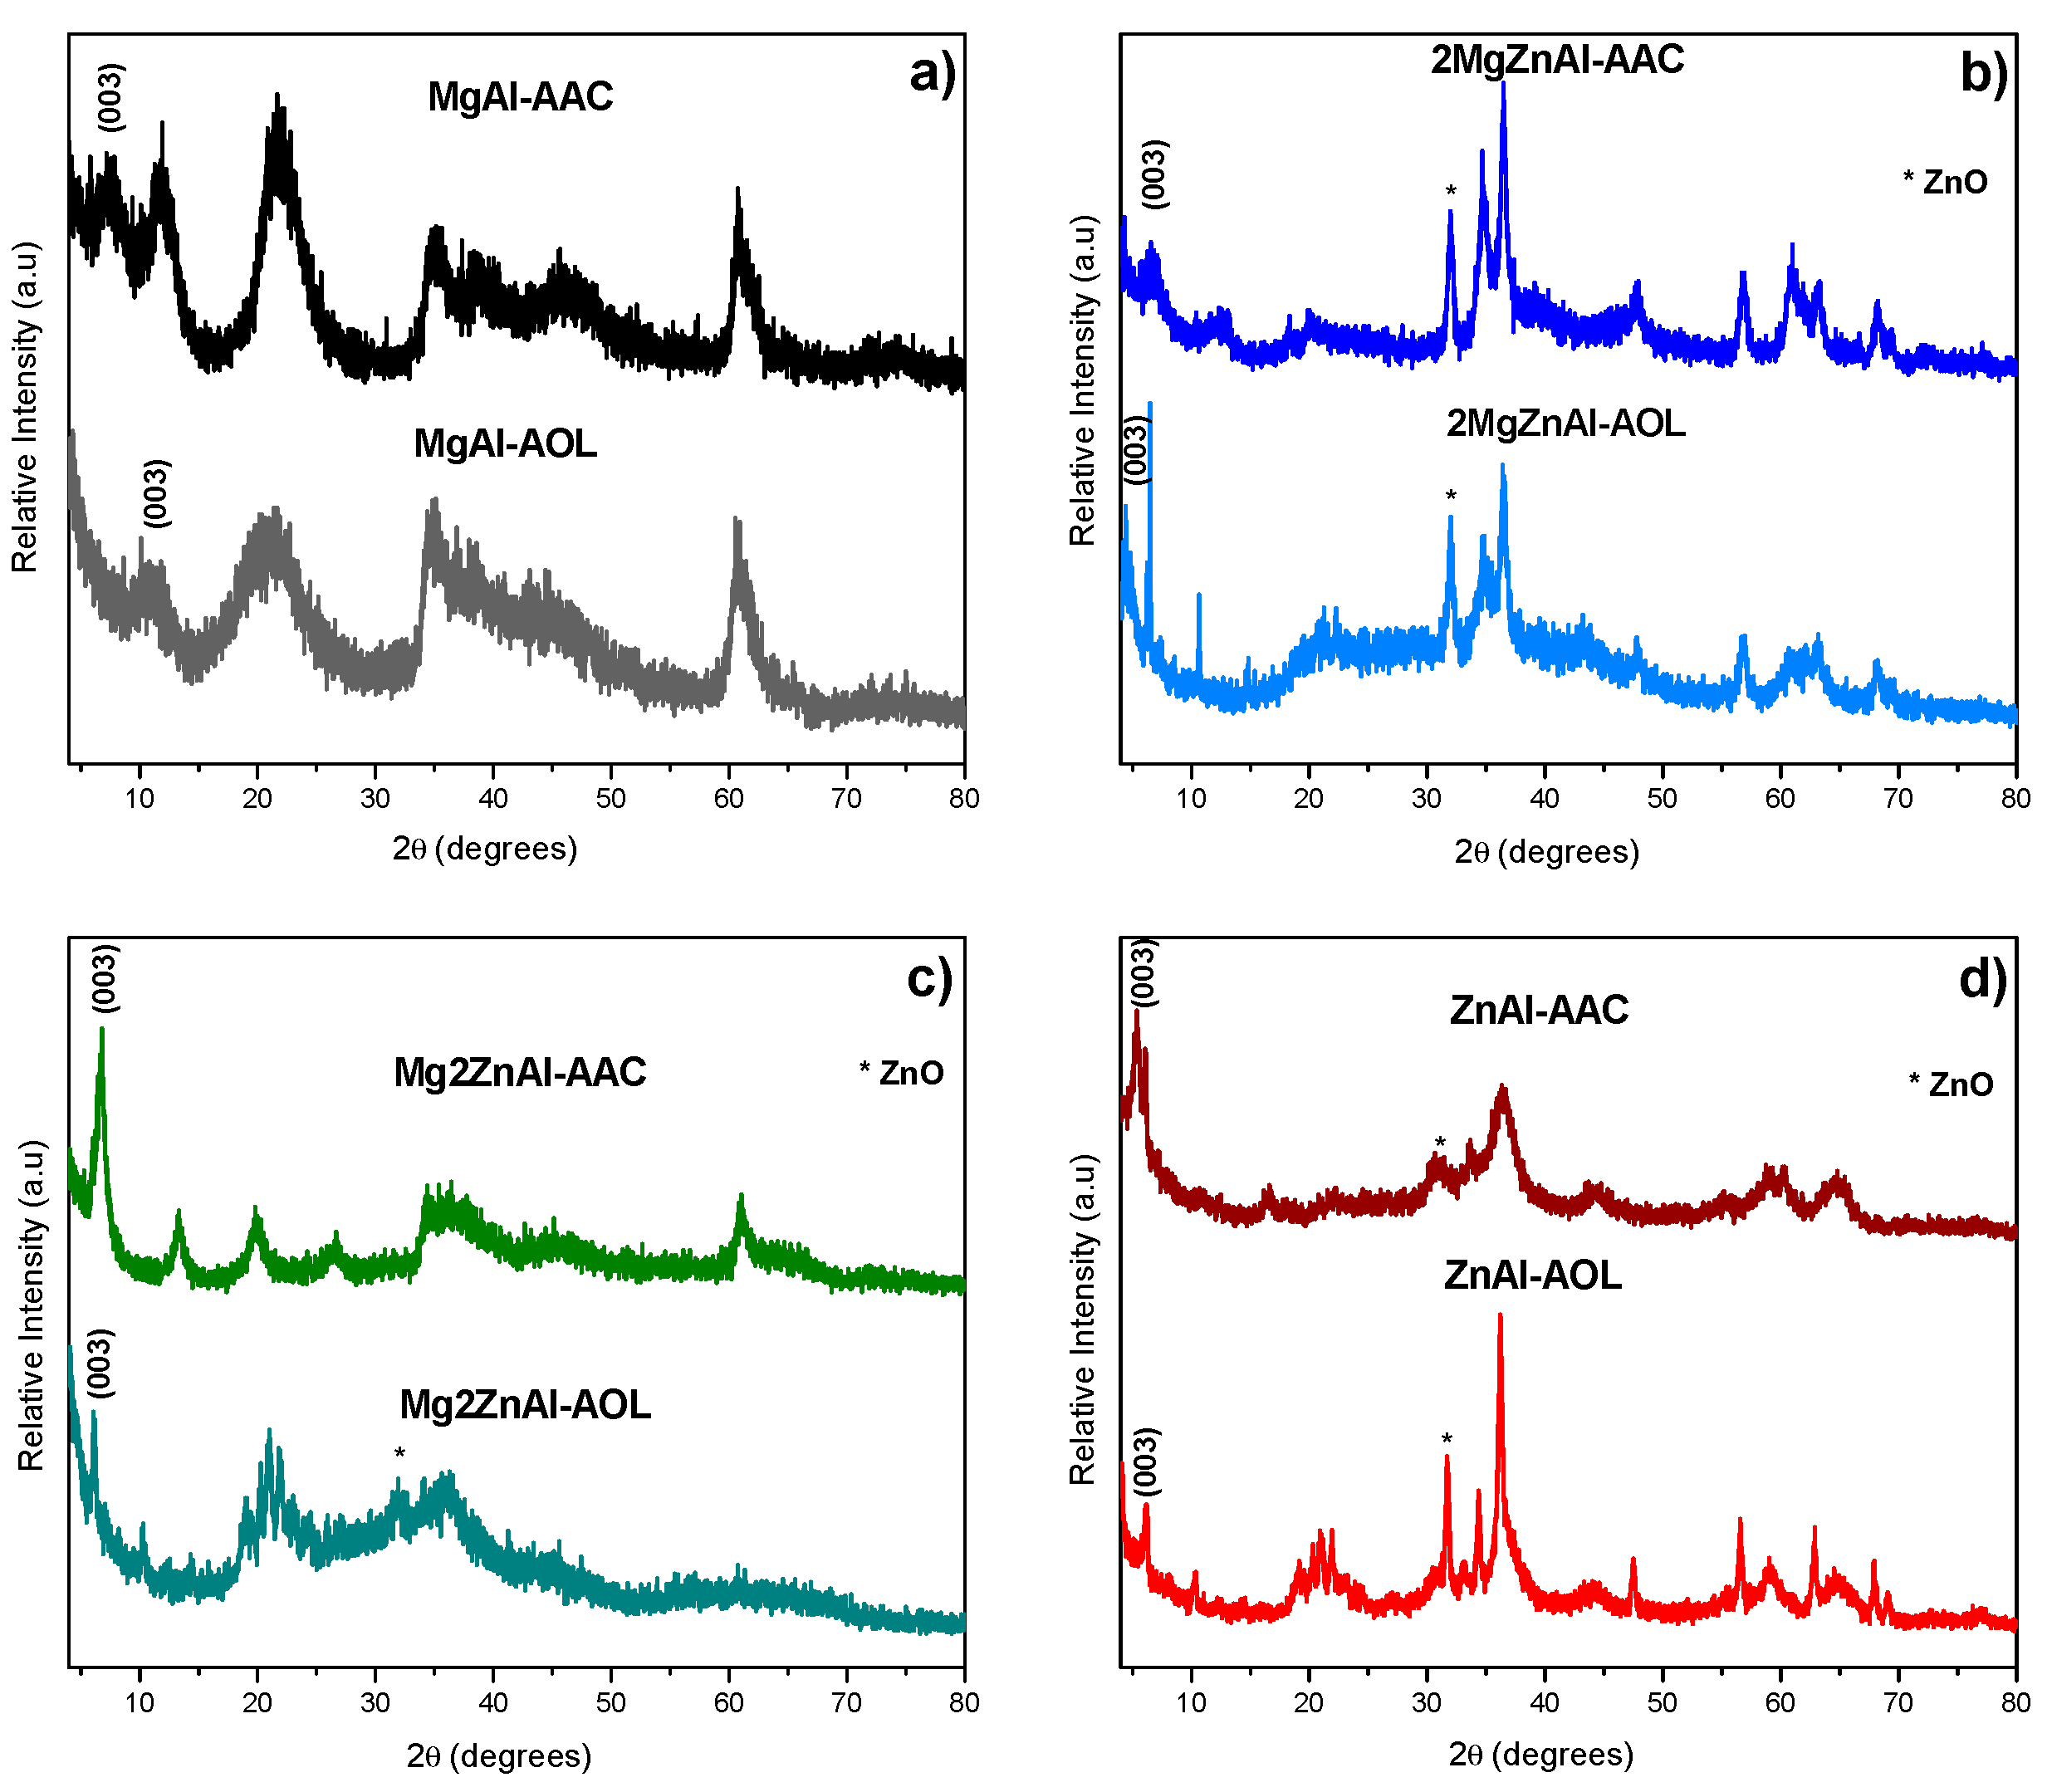
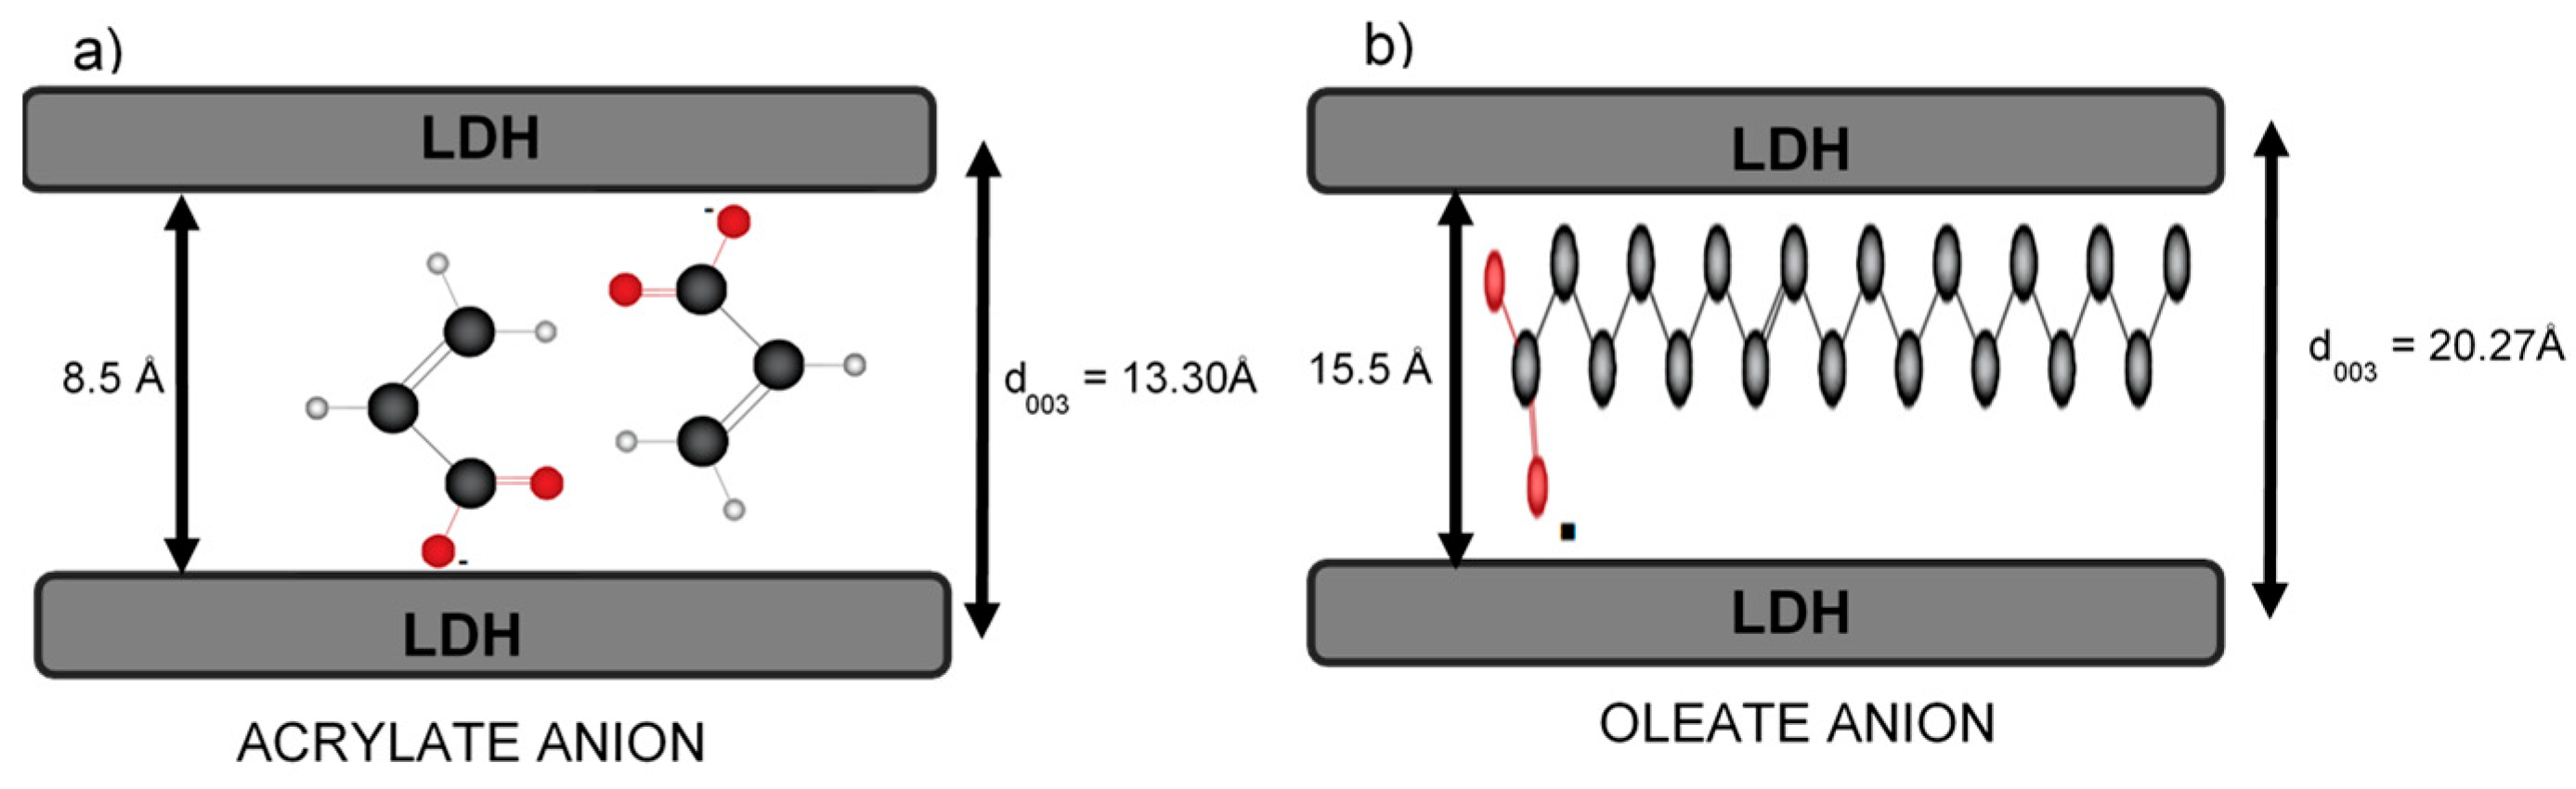
3.1. XRD Results

The crystallographic structures of fresh and calcined samples were identified while using powder X-ray diffraction (Figure 2).
Freshly-prepared LDH materials showed the structure corresponding to the natural mineral hydrotalcite (JCPDS: 22-0700 [34,35,36], Figure 2a). After thermal treatment (Figure 2b), the diffraction patterns showed characteristic reflections that corresponded to the periclase phase (JCPDS: 00-042-1022), and for samples containing Zn, zincite phase was also observed (ZnO) (JCPDS: 00-036-1451) [37,38,39]. Figure 3 presents the obtained diffractograms for the materials after anion exchange with acrylic or oleic acids.
The results showed that the LDH materials treated with acrylate and oleate species lost crystallinity with respect to the original samples. However, the diffractograms (Figure 3) present the characteristic peaks of the hydrotalcite phase. In the case of samples with Zn, an additional peak, corresponding ZnO phase is observed, except for the sample Mg2ZnAl-AAC, where a pure hydrotalcite like material is obtained and its crystalline degree is higher when compared to the rest of materials [37,38,40].
It is also important to remark that all of the samples showed a shift toward smaller angles in the (003) plane, which is attributed to the incorporation of the organic anions (acrylate (AAC) and oleate (AOL)) into the interlayer space. Table 3 shows the cell parameters of fresh and modified LDH.
When considering the sizes of the anionic species intercalated into the layer space of the LDH materials, the changes in the cell parameters shown in Table 3 can be explained with the schemes of Figure 4. For the acrylate anion, it is proposed that its incorporation into the interlayer space occurs in pairs; this is suggested by the increment of d003 distance. For example, the d003 distance is 13.3 Å for 2MgZnAl-AAC material. This value resulted in the thickness of an LDH sheet (4.8 Å) and the incorporation of two acrylate anions in interaction with the material sheets, where the average length of each anion is 6 Å and the thickness is 2.8 Å, giving a distance that is occupied by the anions of 8.5 Å. This value is smaller than the sum of two acrylate species, because the anion is not incorporated in a parallel way (Figure 4a) [26,41,42]. On the other hand, the oleate anion has a length close to 50 Å (in its extended form) and a thickness of 6 Å. In this case, it is assumed that oleate is inserted into the interlayer space parallel to the LDH sheets (Figure 4b) [26]. Following the above example, the obtained distance for 2MgZnAl-AOL is 15.5 Å, attributed to the contribution of oleate as compensation anion.

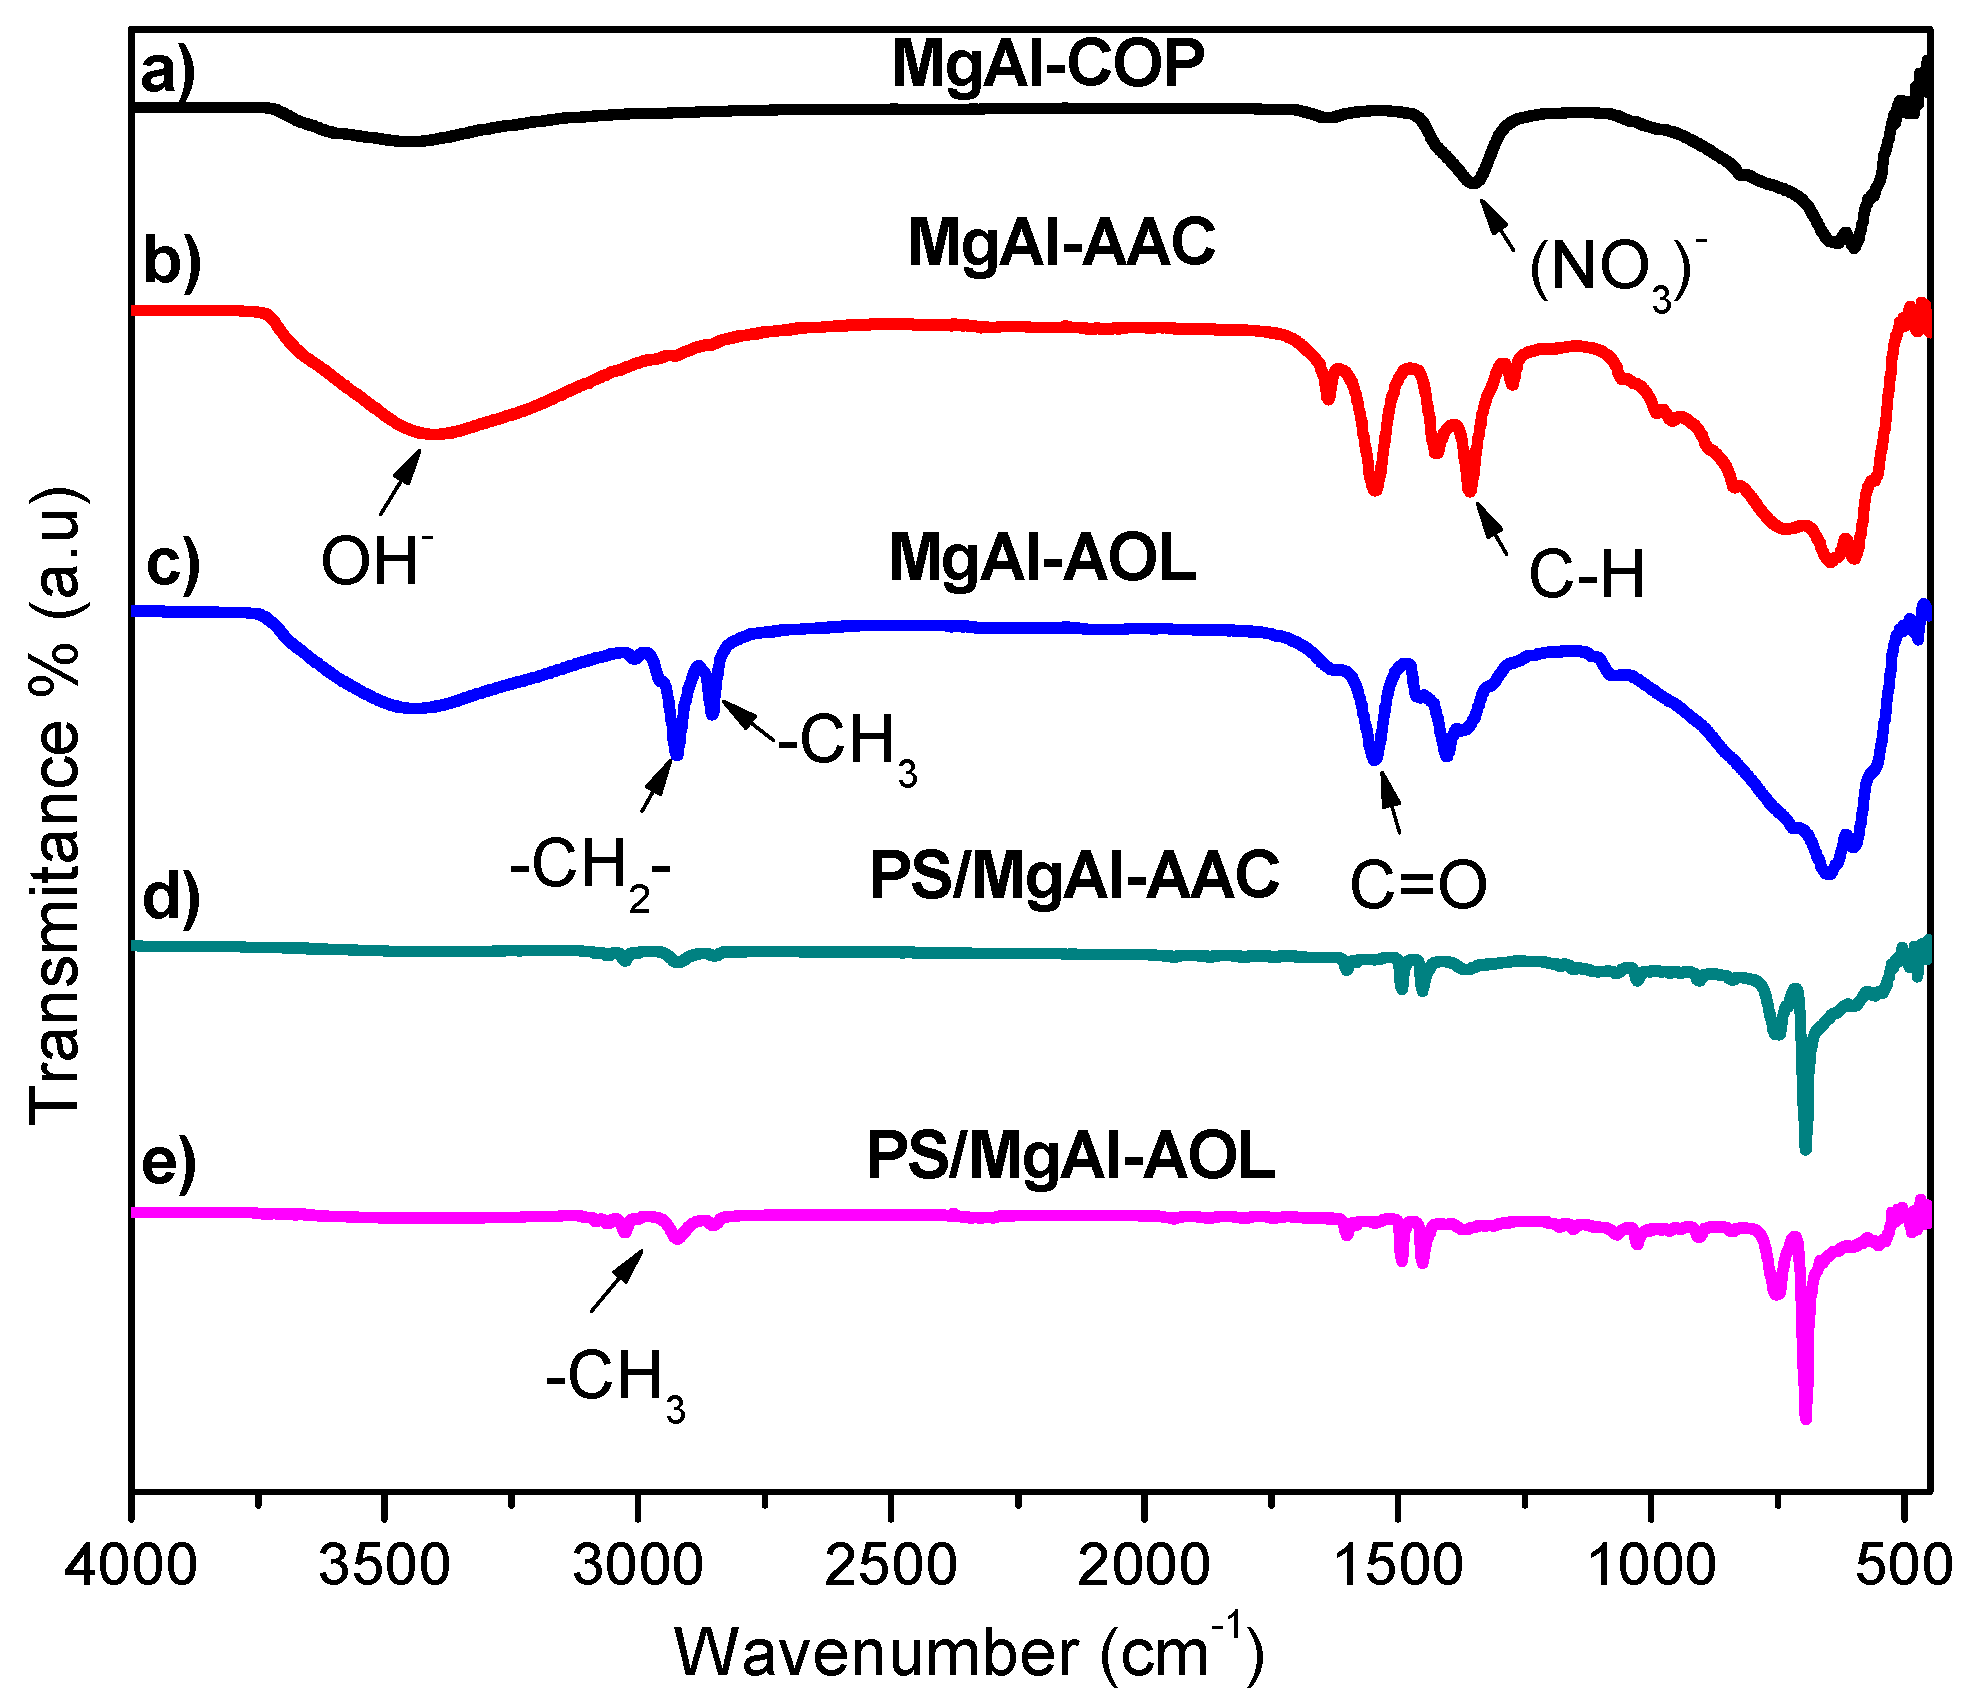
3.2. FTIR Spectroscopy

Fresh samples, modified LDH, and nanocomposites were analyzed by FT-IR spectroscopy. The spectra present similar bands for each family of samples. Figure 5 shows the FTIR spectra for all MgAl materials as an example.
The FTIR spectrum (Figure 5a) for the fresh MgAl LDH presents a band around 3400–3600 cm−1, which corresponded to the stretching vibration of the OH functional group. The vibration around 1640 cm−1 is attributed to hydrogen bonding due to hydration, as well as the remaining carbonates that are found as compensating anions in the interlaminar space. Finally, around 1380 cm−1, the band corresponding to NO3 compensation anions was observed [30].
Modified MgAl LDH (Figure 5b,c) presented an additional vibration at 3100 cm−1, corresponding to -CH2- bands, and the band between 2850 and 2950 cm−1 is associated to the saturation vibration of -CH3 groups in the oleate anion, while, for acrylate-modified samples, these bands are smaller and less defined. The vibration corresponding to C=O of the carboxylate group appears around 1605 cm−1; the -C=C- double bond was located at 1492 cm−1; while, the C-H deformation vibrations are located at 1400 cm−1.
The spectra of the nanocomposite materials (Figure 5d,e) showed the characteristic polystyrene bands: the stretching vibration of -CH2 at 3000–2700 cm−1; the overtones of aromatic groups bonded to the main polystyrene chain at 1600 cm−1. A characteristic band of the -C=C- group close to 1750 cm−1 would indicate the presence of residual monomer, but it was absent from all spectra (Figure 5). The presence of -CH3 and -CH2- moieties was consistent with the spectral features between 1750 and 1450 cm−1.

3.3. MALDI-TOF Mass Spectrometry

The molecular weight distribution was obtained by MALDI-TOF mass spectrometry by duplicate, and the average molecular weight and polydispersity index (PDI) were then calculated (Table 4).
The polydispersity index (PDI) establishes the relationship between the average molar mass and the number of polymer chains [43,44]. The results show PDI that is close to 1; this means the length of the chains of the polystyrene have similar size [45,46].

3.4. Scanning Electron Microscopy (SEM)
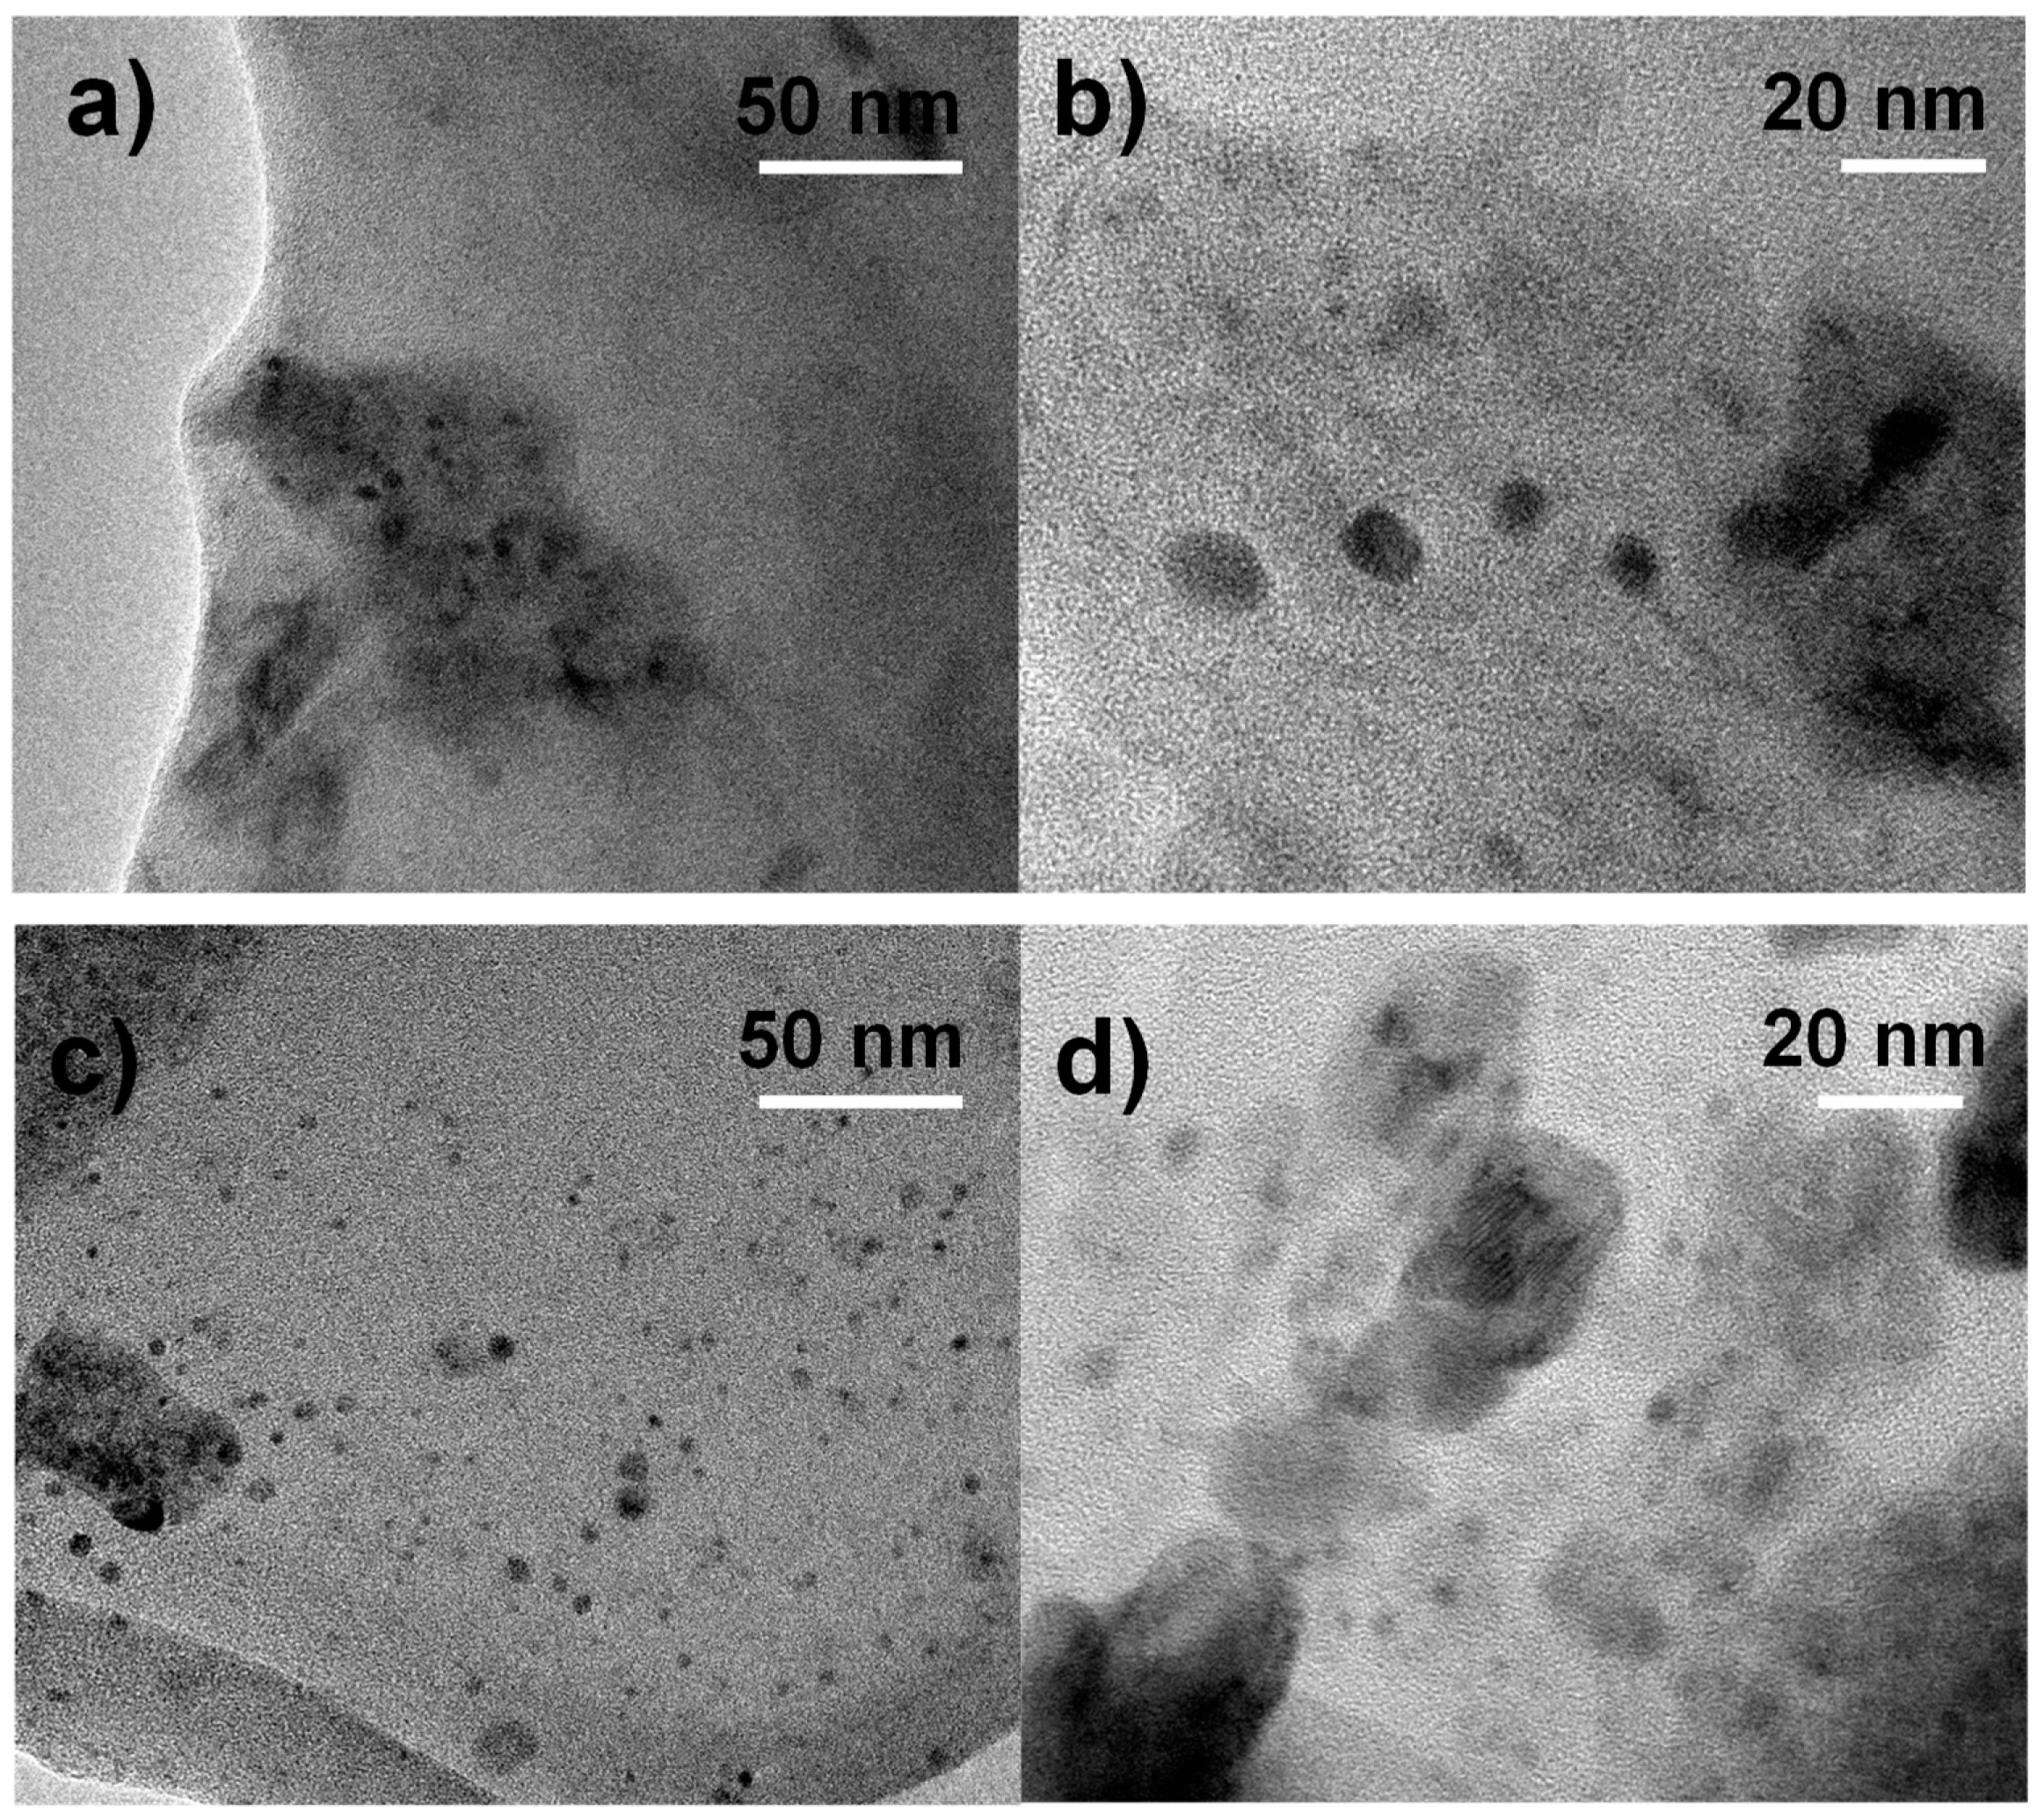
A key factor in obtaining the nanocomposites is the interaction of the polymeric matrix with the organic clay [47]. Thus, SEM characterized composite materials. Figure 6 presents the micrographs of PS/2MgZnAl-AAC (15 wt.%) and PS/Mg2ZnAl-AAC (15 wt.%) as examples. Figure 6a) shows a porous surface with heterogeneous sizes. Segregated additive particles were observed in the border of the pores, which indicates incomplete incorporation of them into the polymeric matrix. Figure 6b) presents a dense and homogeneous surface with less porosity. This suggests that modified LDH were better dispersed into the PS, generating higher compatibility in the final composite material.

3.5. TEM

For a better understanding of SEM results, the corresponding samples were analyzed by TEM. PS/2MgZnAl-AAC (15 wt.%) sample is shown in Figure 7a,b, and the images show that effectively, heterogeneous size aggregates of LDH particles are observed in the border of the material pores. One can also observe aggregates of 20, 11, 7, and 3 nm on the film surface. On the other side, PS/Mg2ZnAl-AAC (15 wt.%) sample, Figure 7c,d, present homogeneous and well dispersed LDH particles on the film surface with an average size from 1.3 to 1.7 nm.

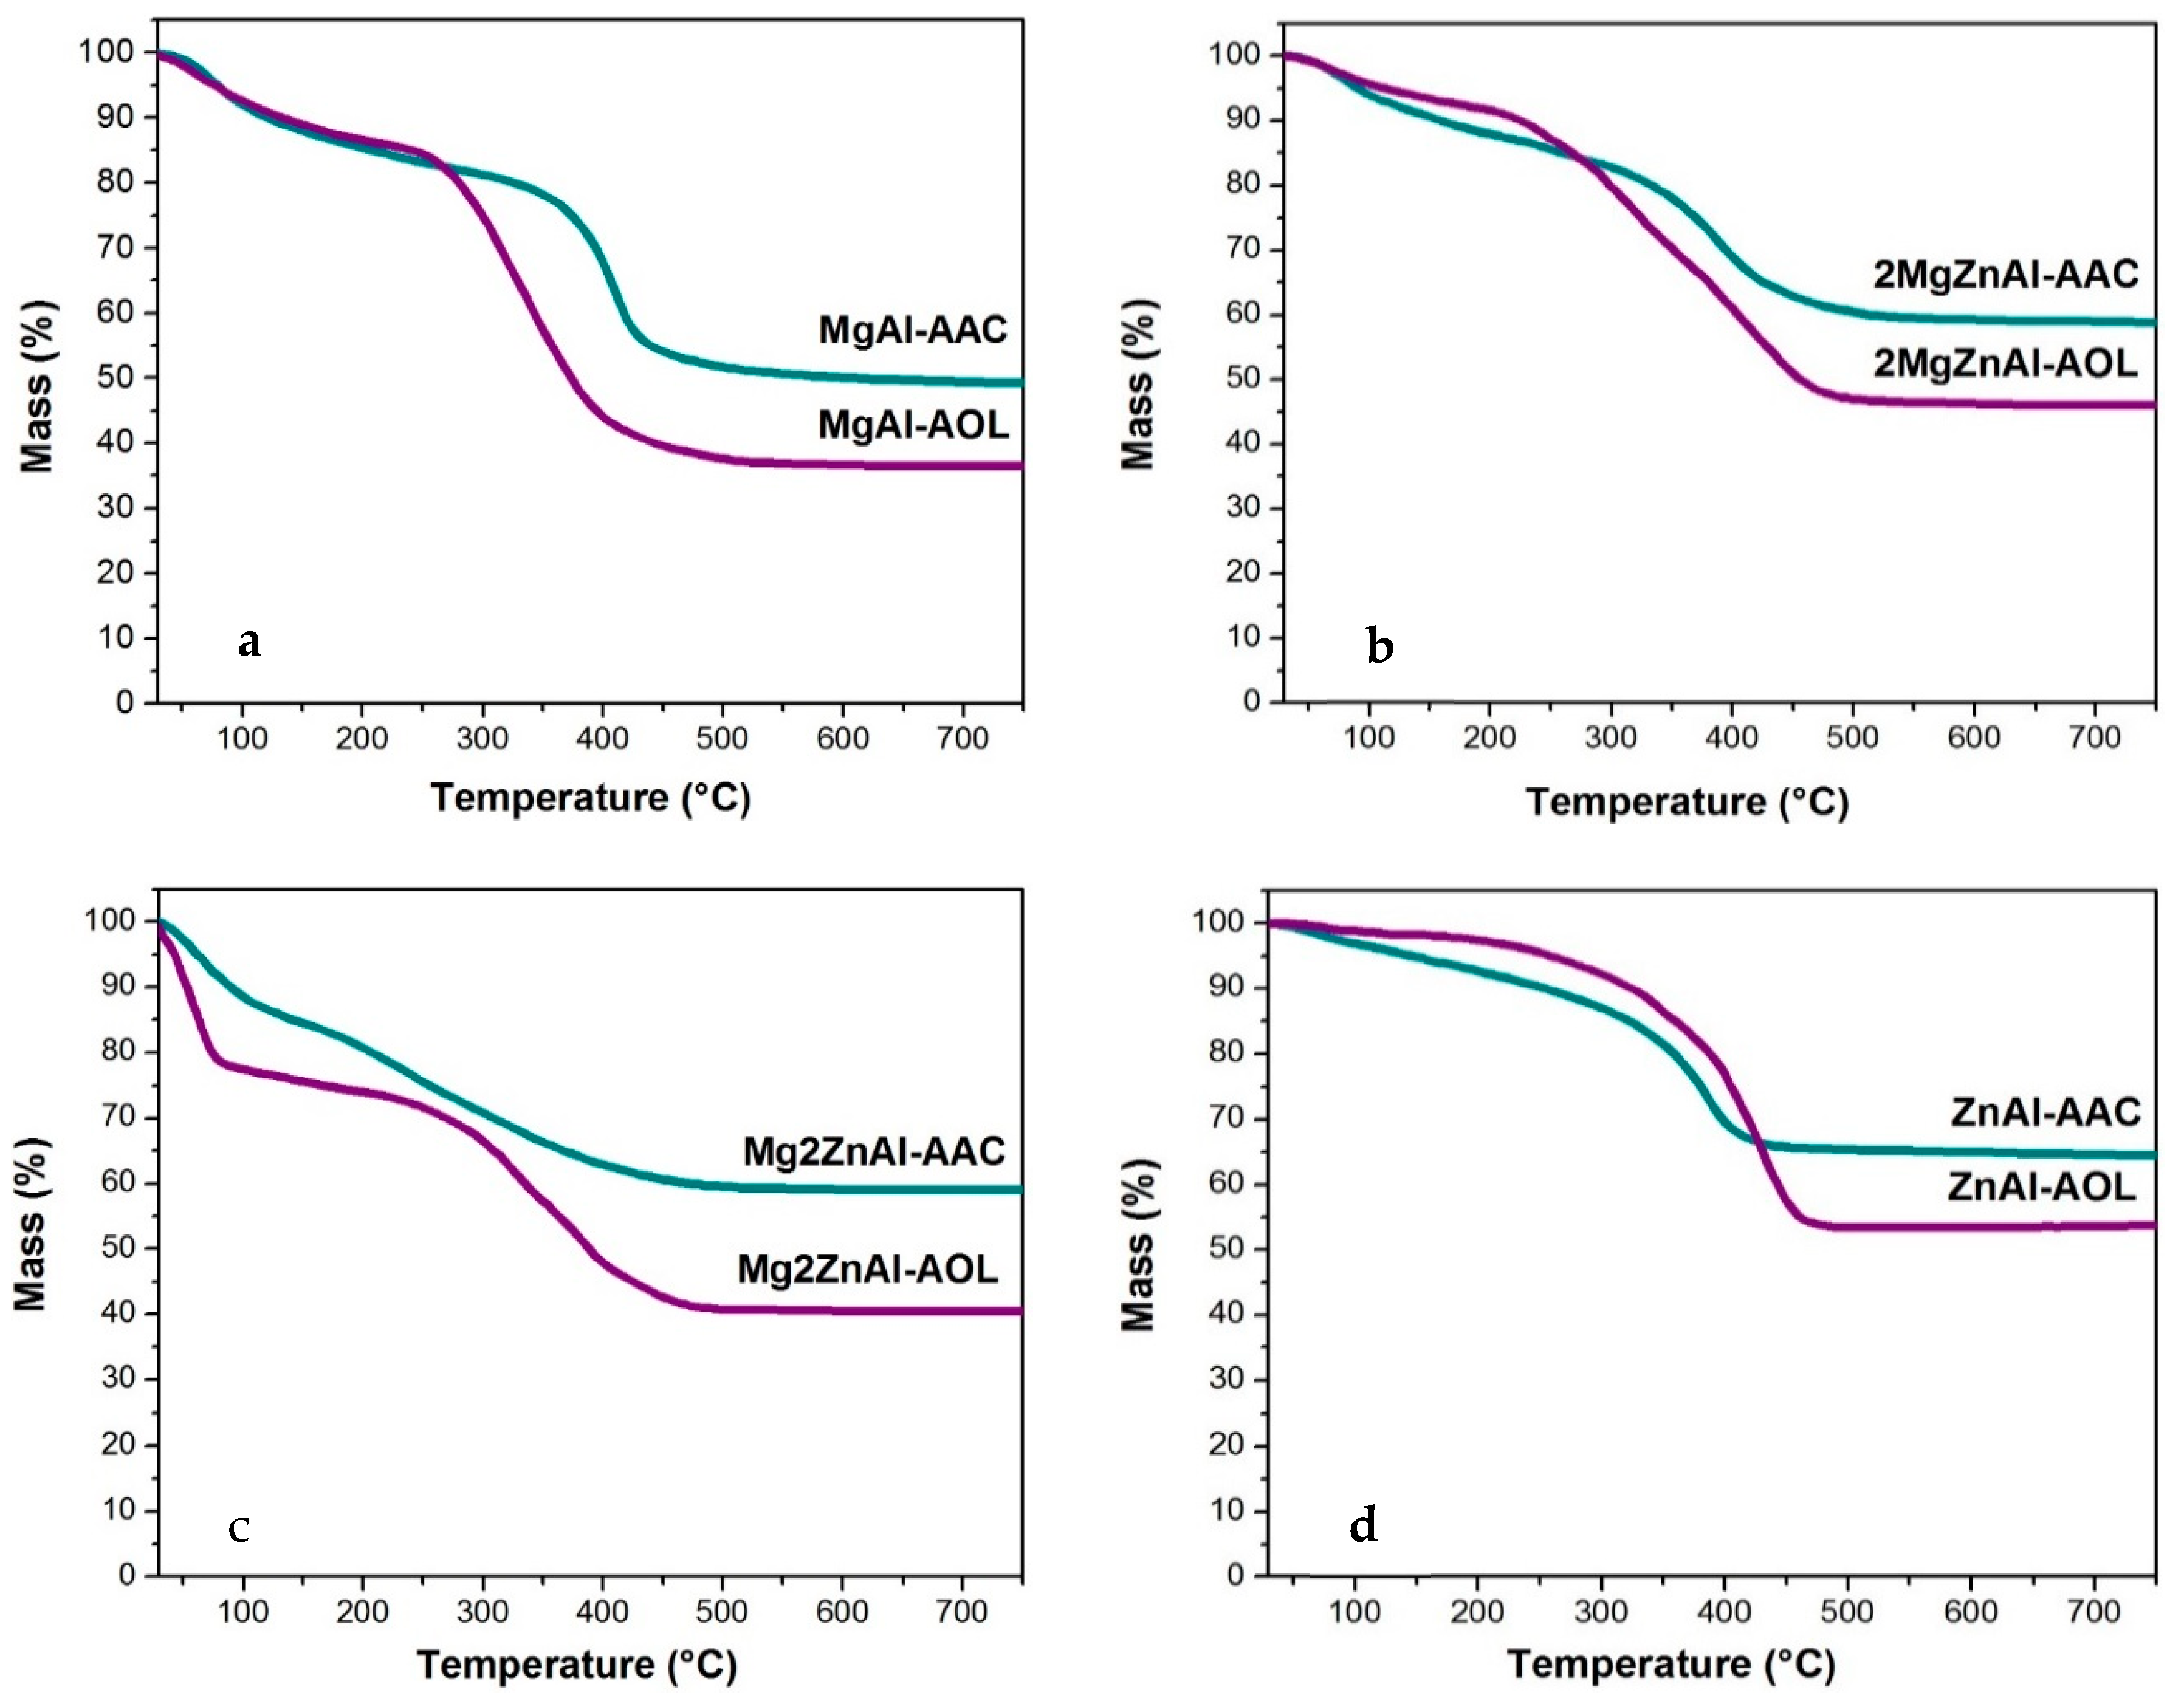
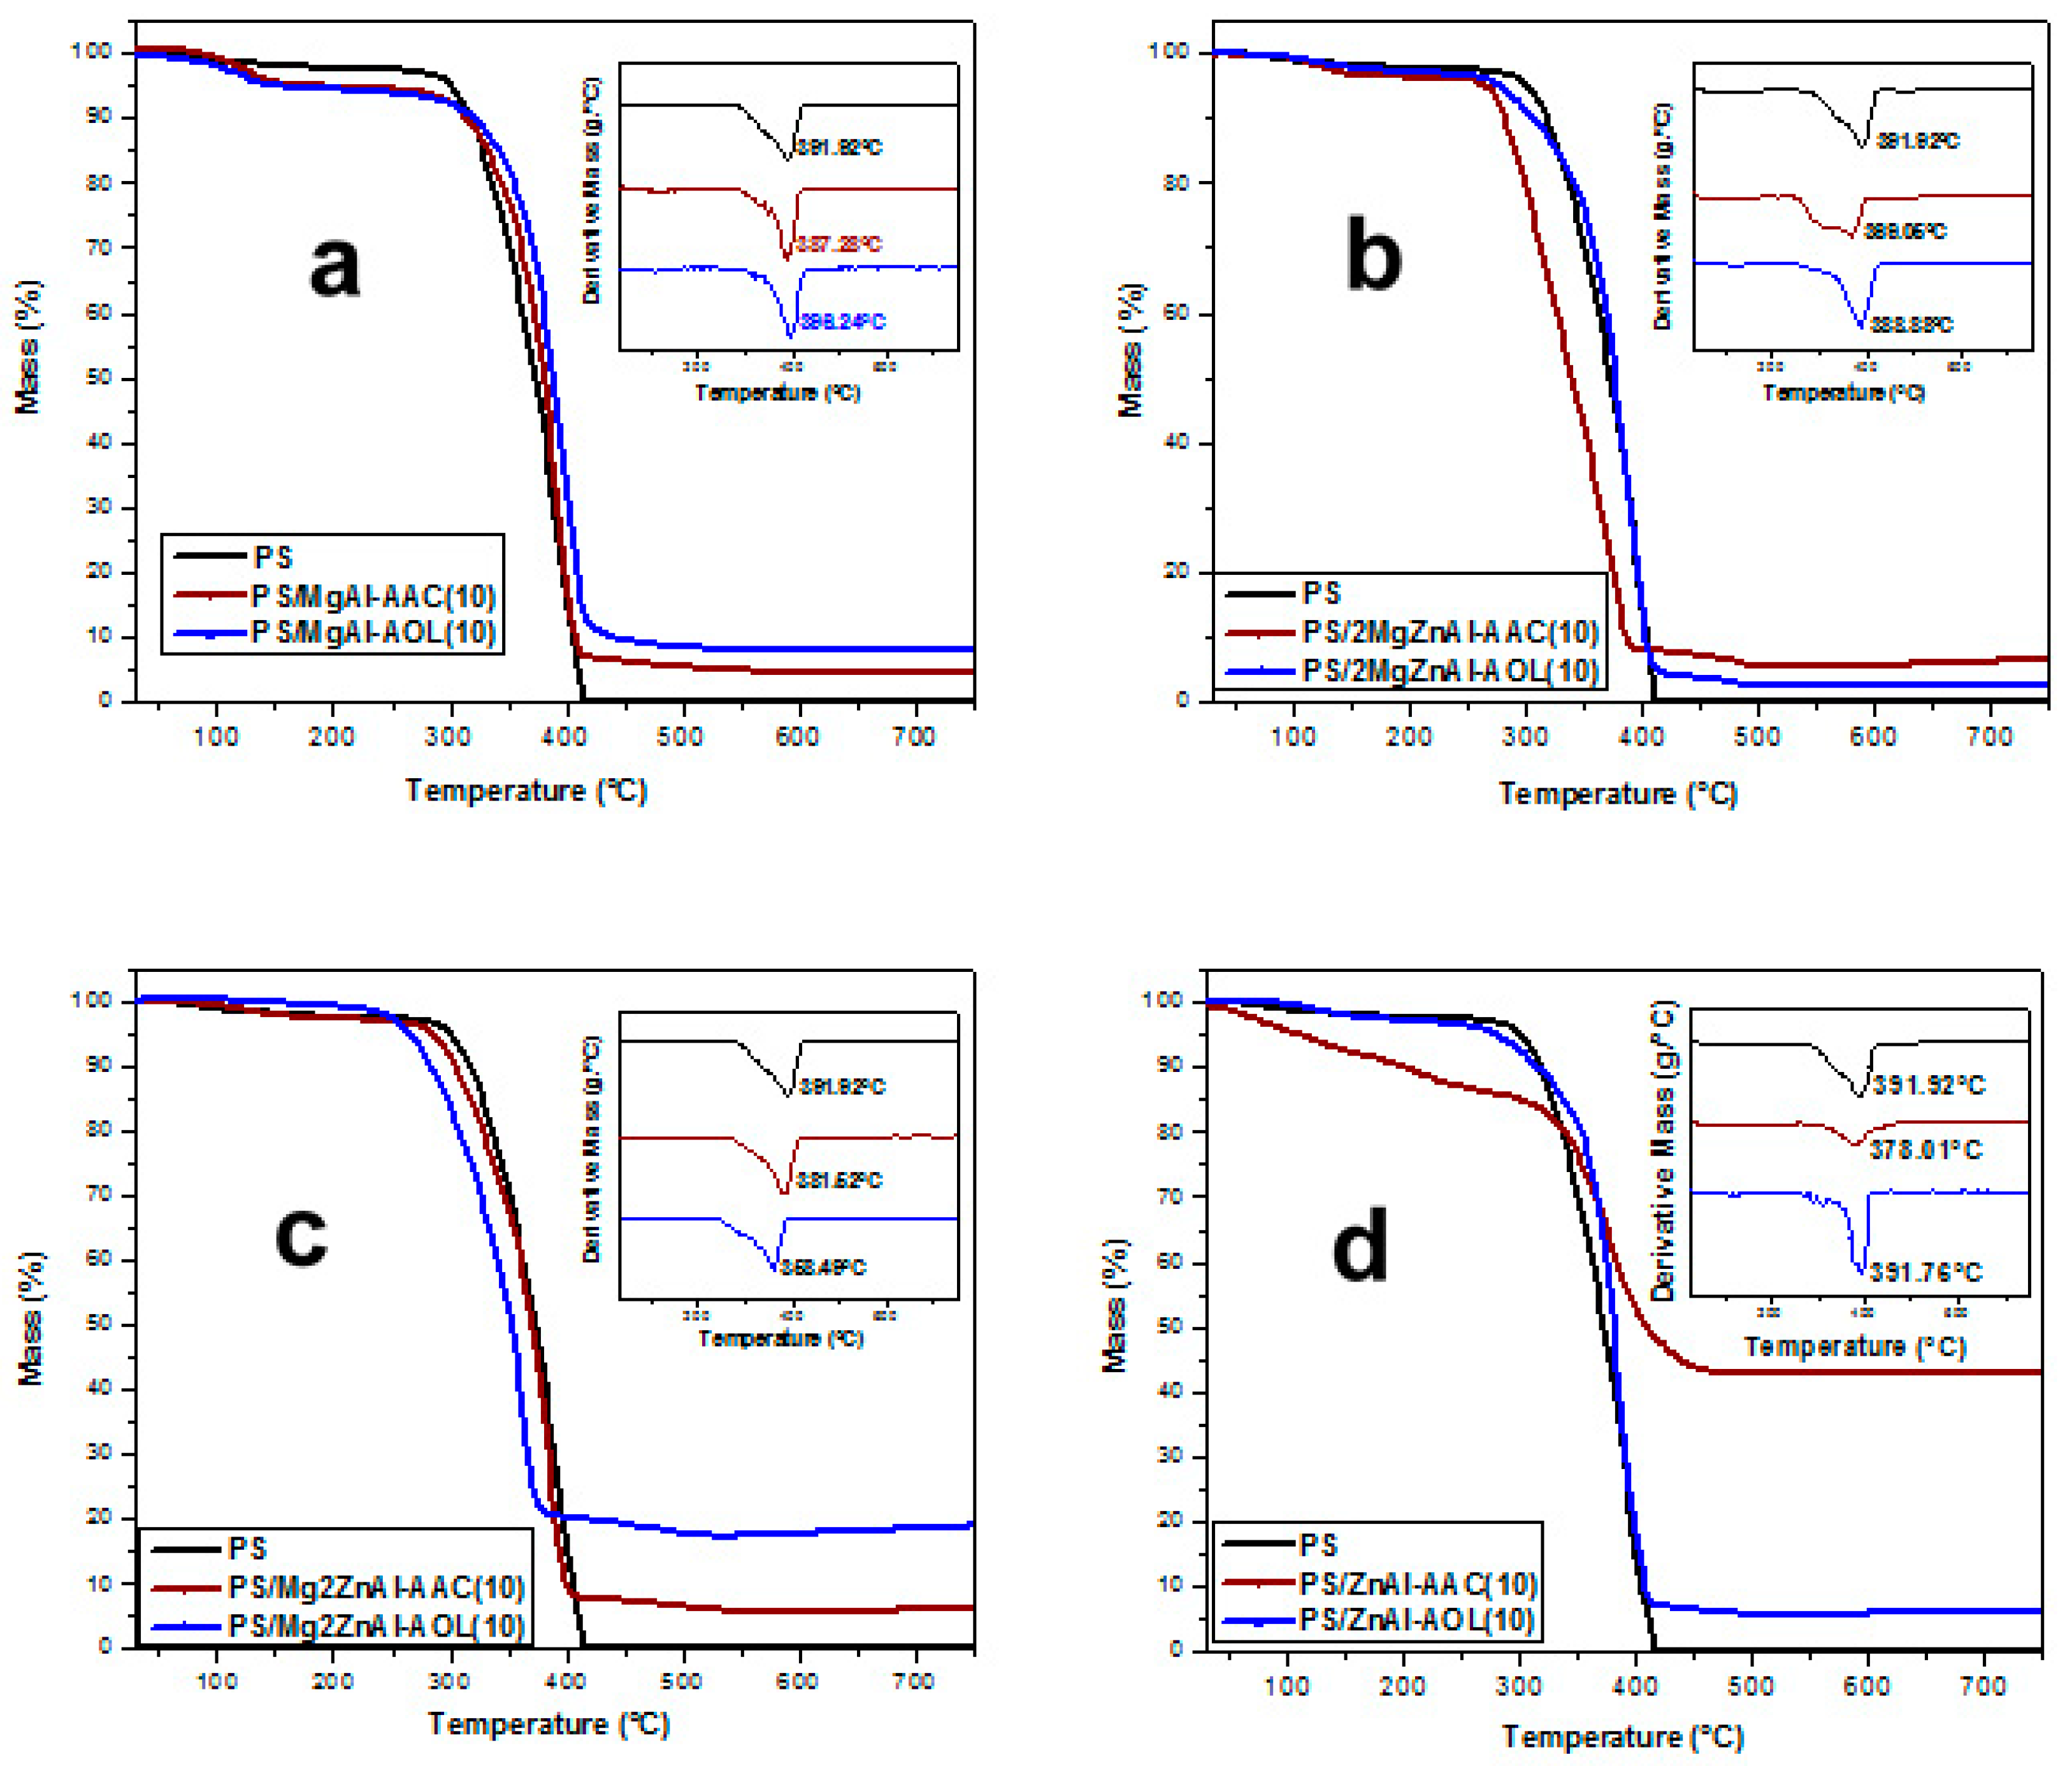
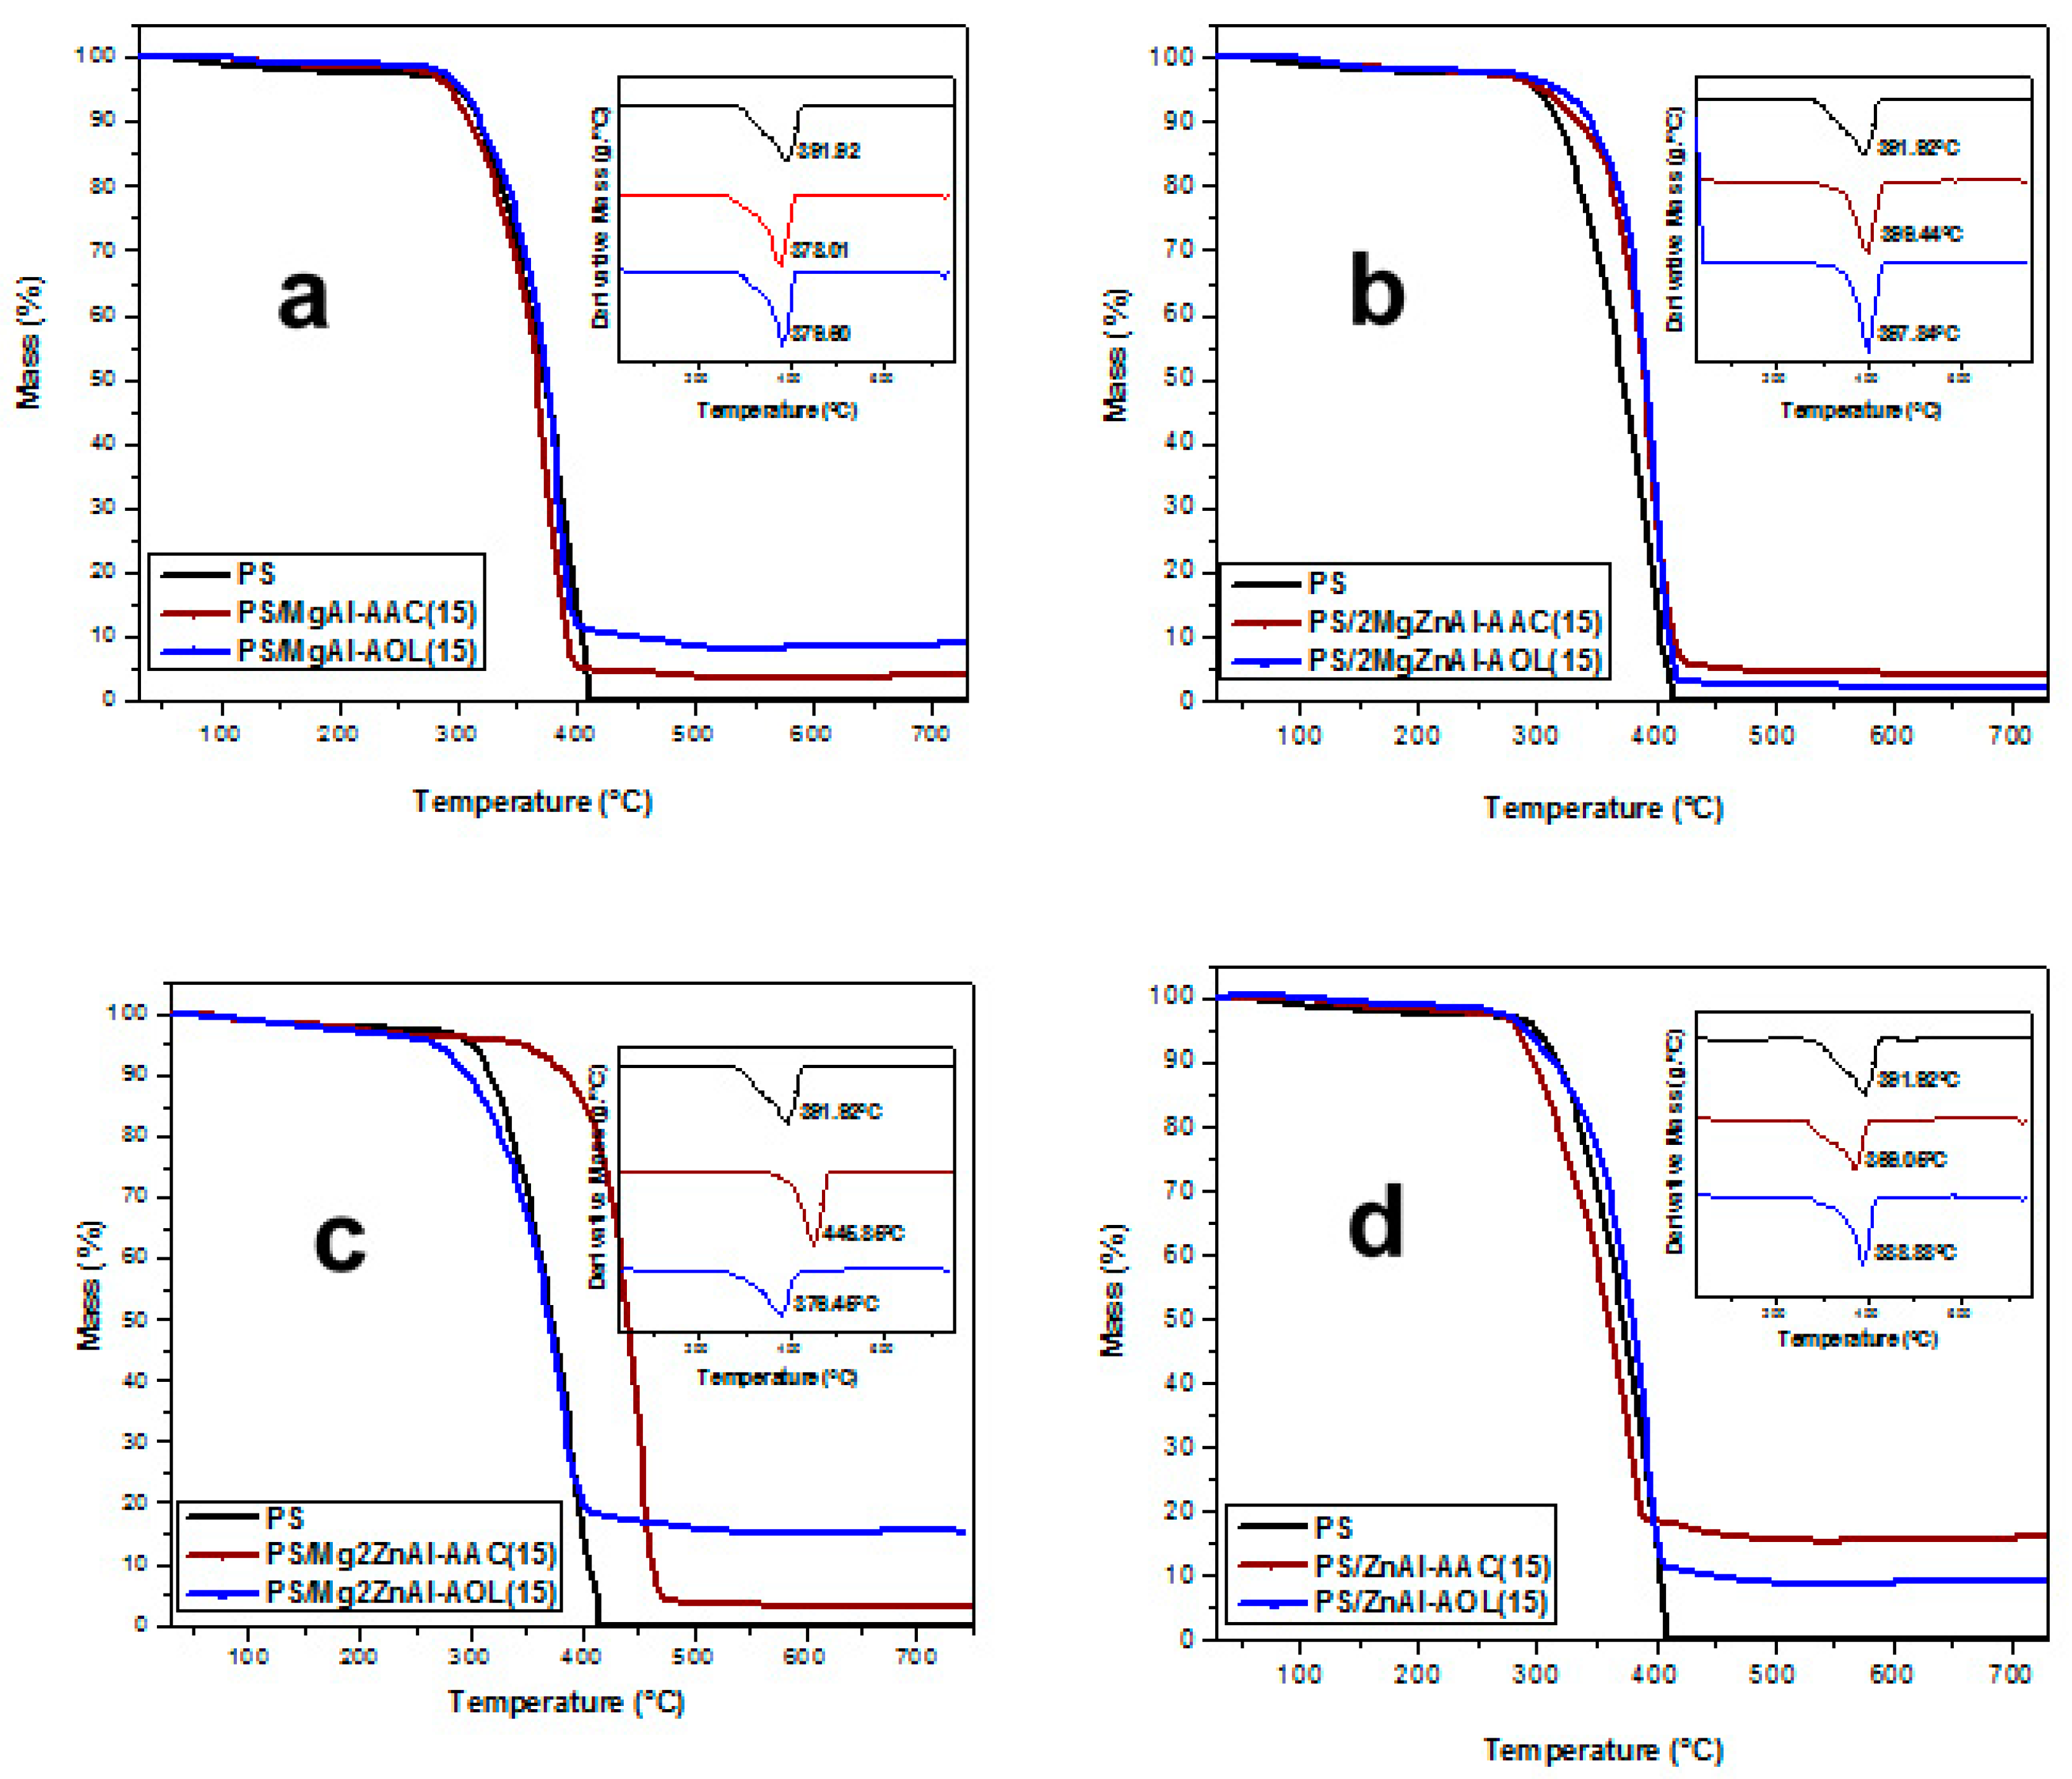
3.6. Thermal Analysis

Modified LDH with AAC and AOL were analyzed by thermogravimetry (Figure 8). The curves show a first weight loss at 180 °C, which is attributed to physisorbed and interlaminar water loss. After that, at 200 < T/°C < 450, the dehydroxylation of inorganic material sheets, the decomposition of the intercalated organic anions (acrylate and oleate), as well as the nitrates and CO2 release are observed. Above 450 °C, the material decomposes until the formation of mixed oxides. Finally, the last stage of decompositions process happens up to 700 °C when the spinel phases are formed [48,49,50]. In all thermograms, it is observed that there was a greater weight loss for samples containing AOL; this is normal, since it is a larger anionic species when compared to AAC. In addition, weight loss decreases as Zn content does and this is a consequence of the difference in the anionic exchange capacity (see Table 1).
Figure 9 shows thermograms (and their derivatives) for polystyrene (PS) and nanocomposites with 10 wt.% LDH. The samples showed a mass loss at 150 °C, which corresponded to the gradual loss of water adsorbed in the inorganic materials. Some works have reported that physisorbed water loss happens between 30 to 180 °C [51,52]. The main mass loss occurs over the range 300 < T/°C < 450, corresponding to the decomposition of the AAC and AOL anionic species and the polymeric chains, and dehydroxylation of LDH layers. Above 420 °C, the total loss of polymer occurs and mixed oxides are formed [53]. Indeed, it is noted that, at higher temperatures, there is not residues after total thermal degradation of the polymer.
Figure 10 shows thermograms (and their derivatives) for PS and nanocomposites with 15 wt.% LDH. The latter present similar thermal decomposition profiles to the composite materials presented in Figure 9. However, the first mass loss at around 150 °C is not clearly observed in the nanocomposites because a gradual decomposition occurs. This can be attributed to LDH materials being better incorporated into the polymeric matrix, causing the water to gradually desorb during all decomposition processes and not suddenly, as occurs in samples with 10 wt.% of LDH [54,55].
Table 5 summarizes the decomposition temperatures obtained from the thermograms.
The depolymerization of the samples PS/MgAl-AOL (10 wt.%), PS/2MgZnAl-AAC, PS/2MgZnAl-AOL, and PS/Mg2ZnAl-AAC (15 wt.%) occurs at higher temperatures than neat PS (Table 5) [56]. This increment of decomposition temperature shows that the incorporation of modified LDH improves the thermal properties of the polystyrene matrix by slowing its decomposition, which reduces the mobility of the polymeric chains and therefore retards the degradation of PS [56,57].

3.7. Decomposition Kinetic Analysis

The decomposition kinetics were obtained from the thermogravimetric data by fitting them while using several models. This analysis was performed on all samples, but only the results for PS/Mg2ZnAl-AAC (15 wt.%) are presented as example, because of its remarkable value of decomposition temperature (445.85 °C).
In general, it has been reported that the thermal decomposition of polymeric matrices with inorganic additives occurs by the breaking of the macromolecular chains [58], and it typically follows the pattern:
P o l y m e r v o l a t i l e s + a s h .
The conversion degree ( α ) is defined as Equation (1):
α = w 0 w n w 0 w × 100 %
where w n is mass at time n, w 0 is the initial mass, and w is the mass at the end of the thermogravimetric analysis. The kinetics of decomposition can be represented according to Equation (2) [58,59,60,61].
d α d t = k f ( α )
and the decomposition constant can be determined by the Arrhenius Equation (3):
k = A   exp ( E R T )
where A represents the pre-exponential factor, E denotes the activation energy, R is the ideal gas constant ( 8.314   J · m o l 1 · K 1 )   and T is the temperature in Kelvin. Experiments are performed using a constant heating ramp ( β ) as shown in Equation (4) [58,60].
d α d t = A β exp ( E R T ) f ( α )
All kinetic models of decomposition establish the kinetic parameters via Equation (4).

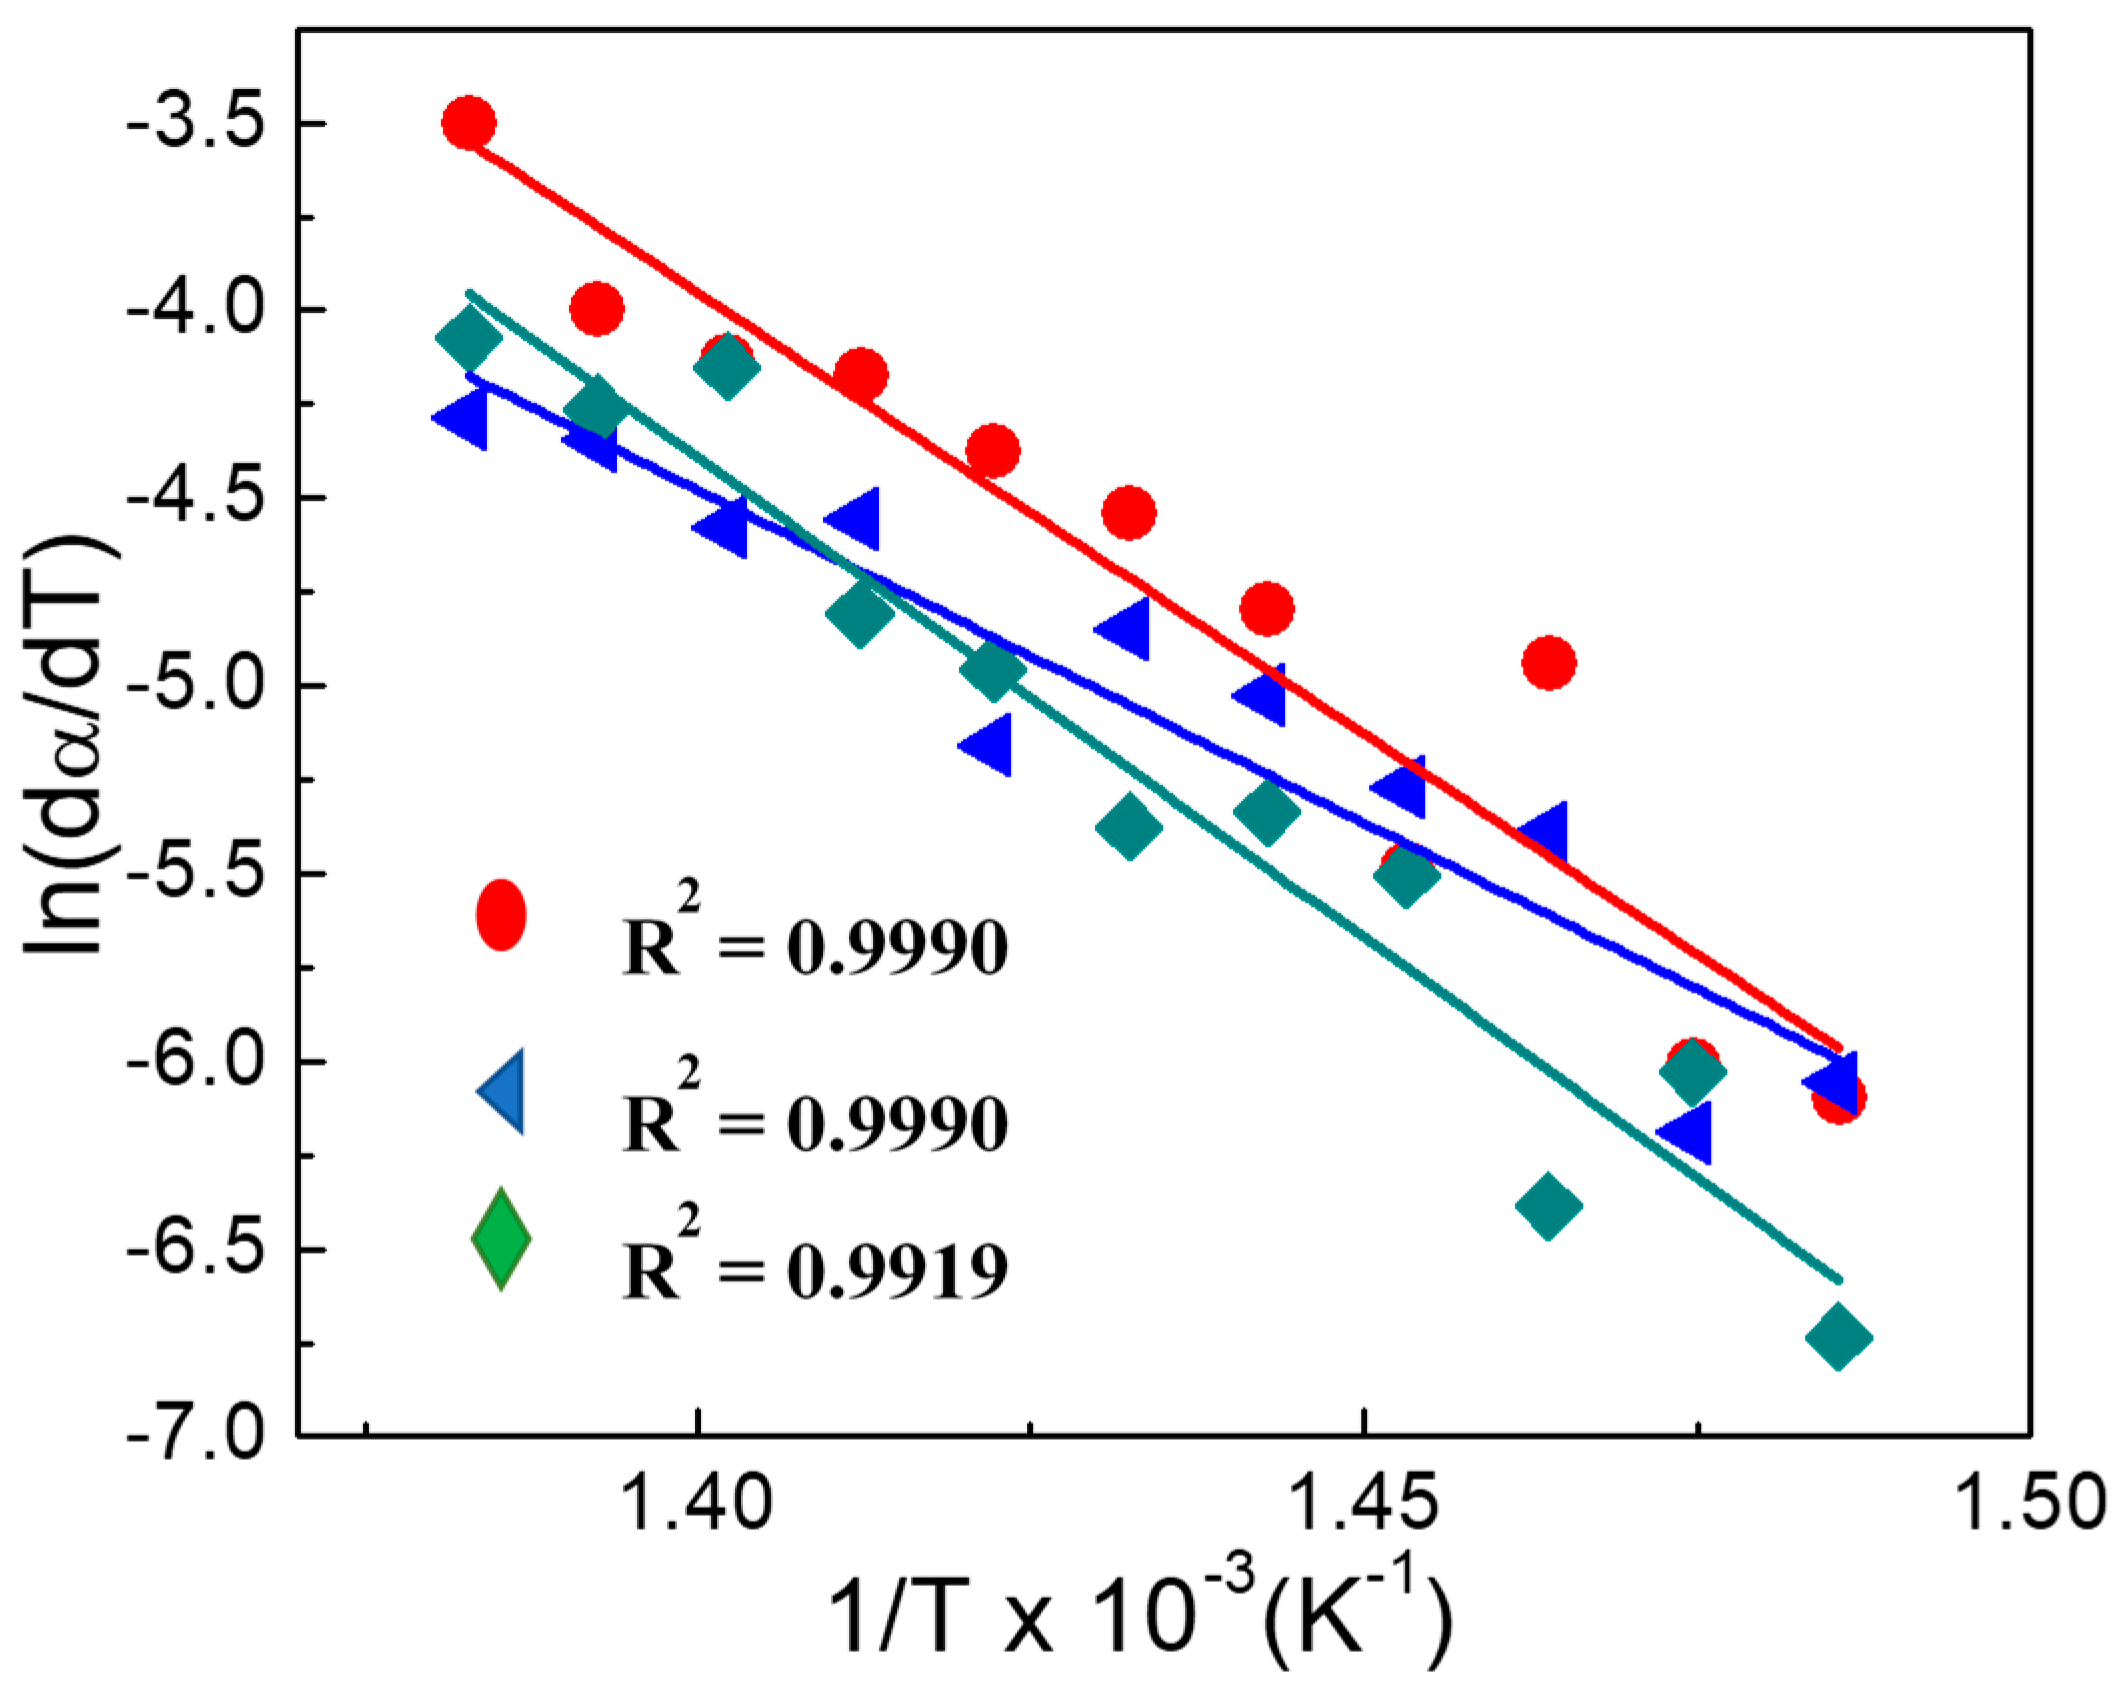
3.7.1. Friedman Method

The Friedman kinetic model works in the conversion range (α) for which d α d T is linear, as shown in Equation (5) [62]:
ln ( d α d T ) = f ( 1 T )
The data that were obtained from the thermogravimetric analysis of the sample PS/Mg2ZnAl-AAC 15 wt.% were plotted as d α d T against α at several β (10, 20 and 30 °C/min). This enabled the line adjustment at the beginning of the thermal decomposition (Figure 11) to be established. The data that were made at 5 °C/min are not reported because they did not present lineal behavior for the Friedman model, which causes high uncertainty.
The linear part of the Friedman model was obtained at 0.1 < α < 0.6 and fitted to Equation (6) [59].
[ ln ( β · d α d T ) ] y = ln   ( f ( α ) · A ) E a R · [ 1 T α ] x
Figure 12 shows the obtained results, from the fit of (ln (dα/dT)) as function of 1/T for the sample PS/Mg2ZnAl-AAC 15 wt.% at several heating rates. The slopes of the straight lines (−Ea/R) were obtained by linear regression.
Table 6 sows the activation energies for the obtained linear range via the Friedman method for all composites for each heating rate.
The data from Table 6 show an increase of the activation energy (a stabilizing effect) of the PS matrix by the presence of the LDH materials in the composite materials [63]. It is reasonable to propose that the presence of modified LDH dispersed in the matrix generates a barrier that prevents oxygen diffusion to the polymer and thus hinders the degradation of the PS-LDH nanocomposites [55,64].
Thus, the activation energy variations indicate that thermal decomposition of the nanocomposites depends on good dispersion of the additive in the polymeric matrix, as well as the concentration of additive used in the formulation [65].

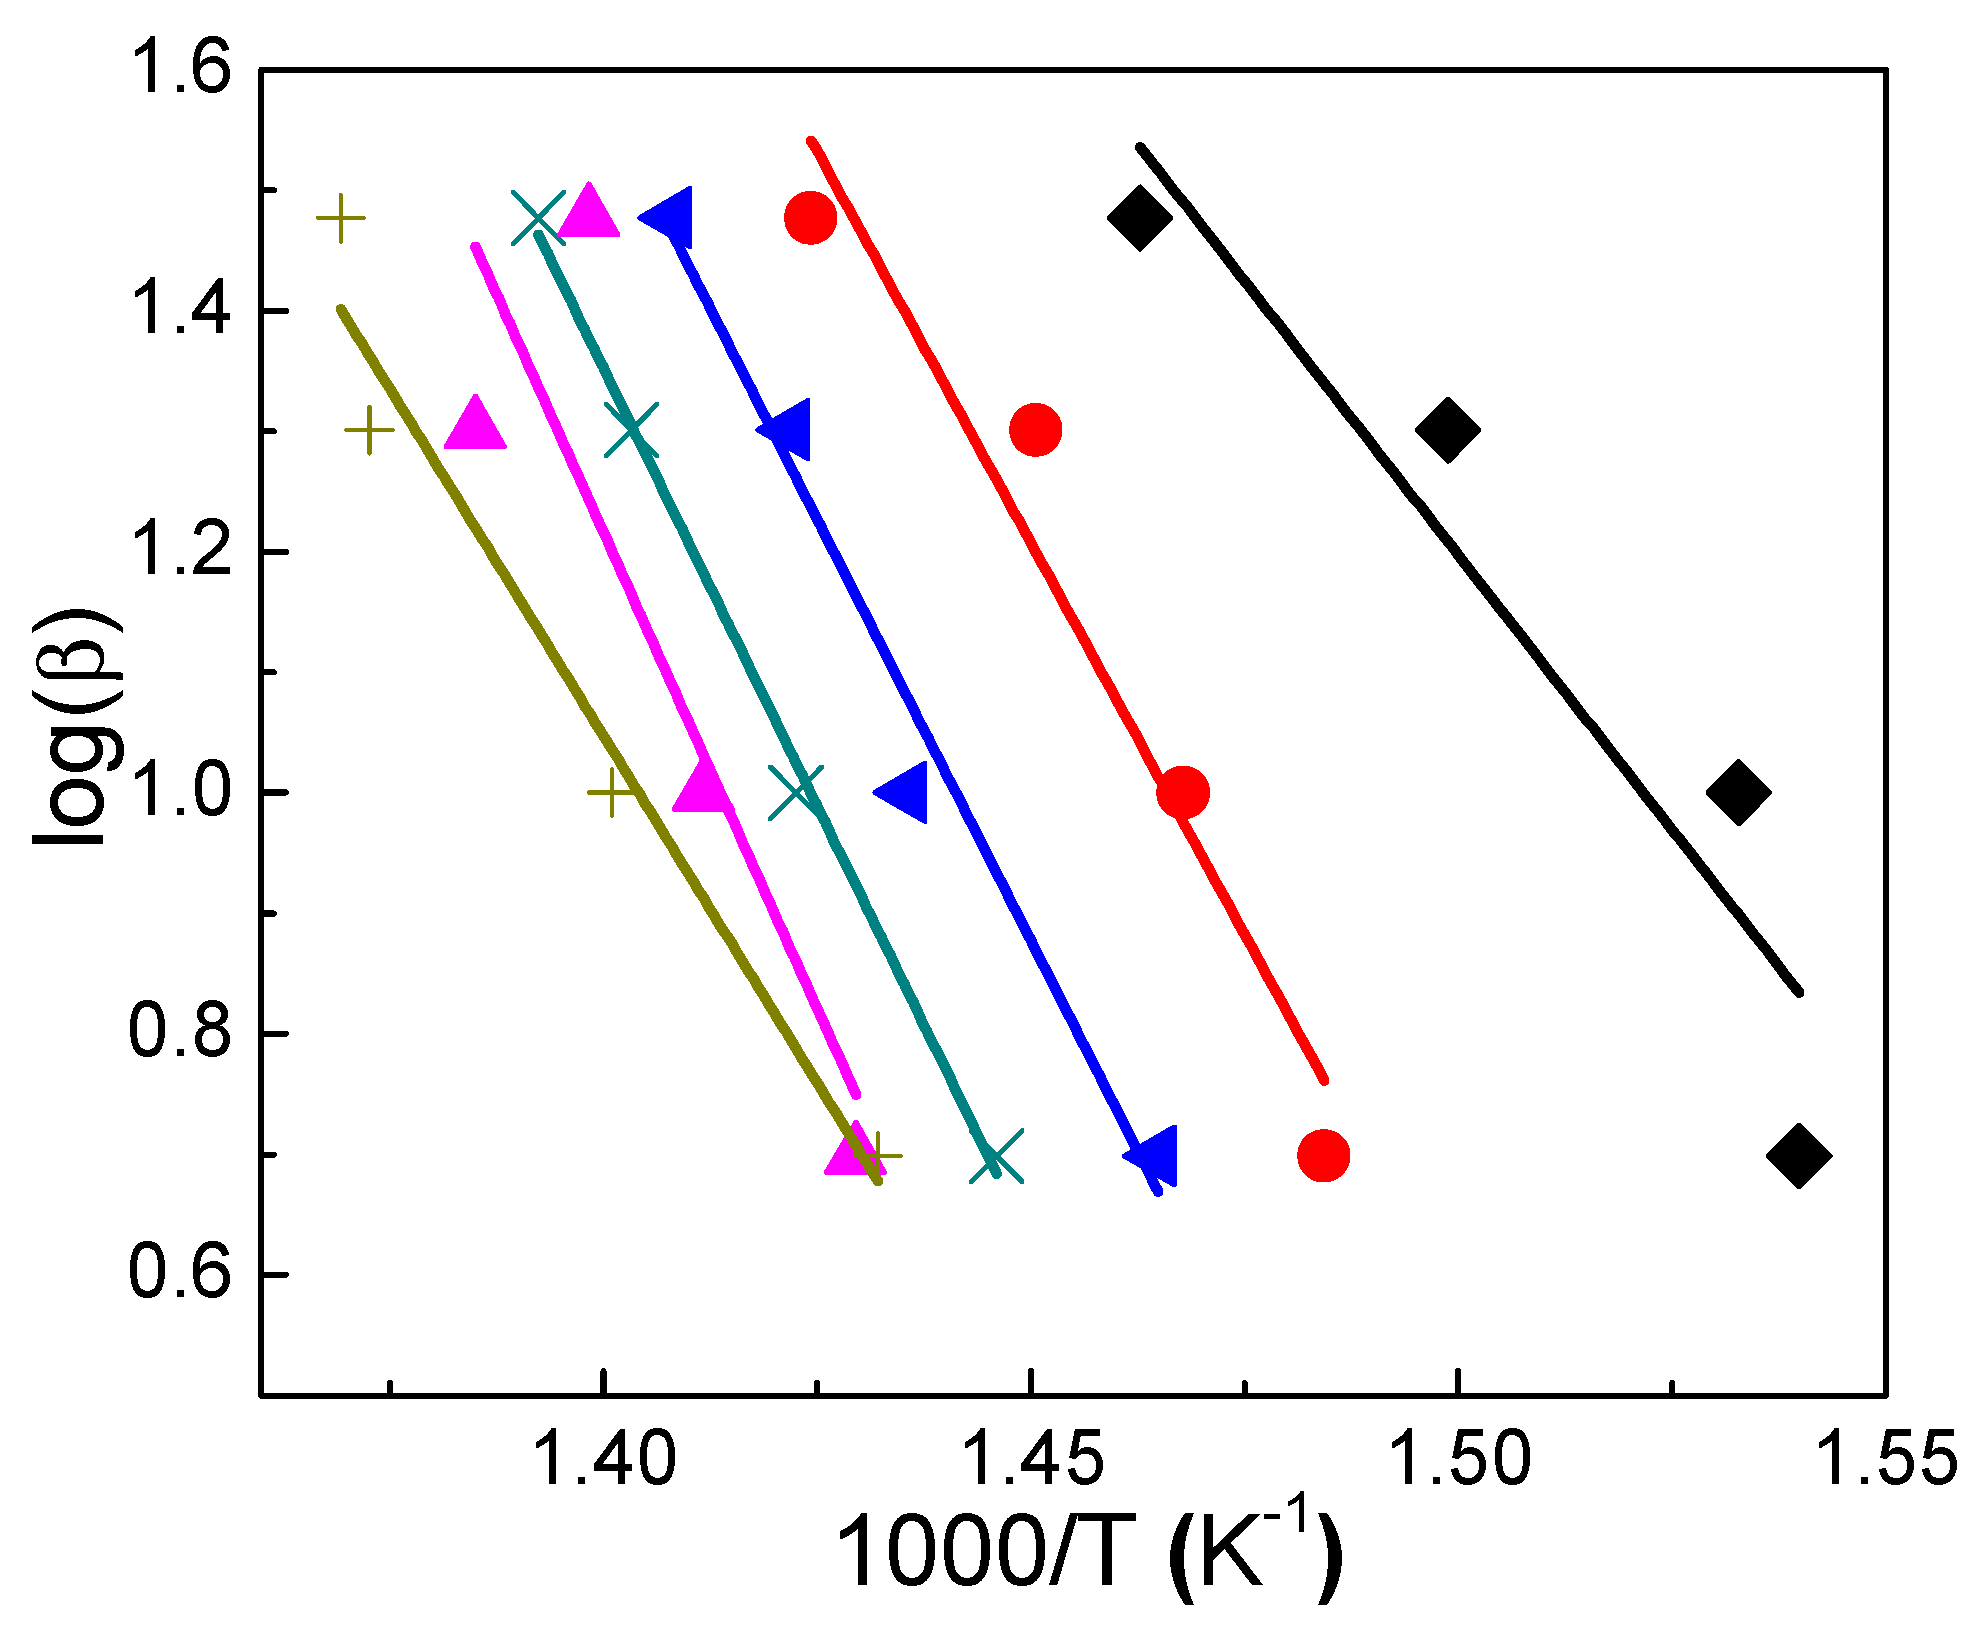
3.7.2. Flynn–Wall–Ozawa Method

Some authors consider that the Friedman model has an erroneous estimation of the activation energy, because it only takes the linear interval of decomposition reaction into account [66,67,68]. For this reason, the thermodynamic data were tested in the Flynn–Wall–Ozawa (FWO) method, which allows for the activation energy to be obtained from advanced degree data as function of temperature. The main advantage of this method is that it does not assume a decomposition mechanism [66]. This model makes use of the Doyle approximation [58], yielding Equation (7), which involves α at different heating rates (β) [58,66].
[ log β ] y = log A E a g ( α ) R 2.315 0.457 E a R [ 1 T α ] x
This model was applied to PS/Mg2ZnAl-AAC (15 wt.%) as an example, because this nanocomposite showed the greatest increment of decomposition at 0.1 < α < 0.6. Figure 13 summarizes the results, which plots log (β) as function of 1/T, obtained at 5, 10, 20, and 30 °C/min heating rates. The slope of the straight-line fits (−0.457 Ea/R) provides the activation energy.
The calculated activation energy for all composite materials by means of the FWO method shows two ranges of activation energies. The first corresponds to 0.1 < α < 0.3 (390–425) °C and the second to 0.4 < α < 0.6 (433–445) °C (Table 7). It has been reported that this behavior occurs when Ea is dependent of conversion, because the degradation process takes place in multi-steps, that is, where the mechanism of thermal decomposition is not known or complex [69,70]. Some works report that the first stage (0.1 < α < 0.3) is associated with the breaking of weak bonds. For polystyrene, it corresponds to the breaking of –CH2– bonds in the polymeric chain [69,71]. At the second stage (0.4 < α < 0.6), the weak bonds have been consumed and the complete degradation of the material occurs, which breaks the aromatic structures (–C=C–) [71].
These results suggest that the LDH materials have a fire-retardant effect on the present composites, mainly in the second stage of the decomposition process.
The Friedman and FWO methods are considered as complementary models and it can be assumed that the average activation energy (Ea-M) from the two models (Table 8) is a reasonable estimate of the overall activation energy for decomposition [66].
The obtained average activation energies for the two models are higher for the composite materials than for polystyrene. The increment of the decomposition temperature is generated thanks to the addition of modified LDH, as these materials release water vapor (interlayer water) and this decreases the oxygen concentration on the surface of the composites, which protects the polymeric chains before the total decomposition of inorganic layered structures takes place [55].
Furthermore, the formation of MgO and Al2O3 during the calcination of the inorganic sheets allows for them to absorb the acidic combustion gases and releases more water vapor due to the decomposition of hydroxyl groups [55]. Moreover, the formation of ZnO as a decomposition product generates denser residues, which is more environmentally friendly [72,73].
Some of the activation energies that were obtained by the Friedman and FWO models are substantially different. This behavior is thought to arise from the dispersion of the LDH materials in the matrix. They help to form a barrier effect trapping the radical species that formed during the decomposition process, causing these species to perhaps react between themselves avoiding or slowing down the total decomposition of polymer matrix [11,69,74].
It is important to mention that the Ea-M for samples with 15 wt.% of LDH present a higher standard deviation than those with 10 wt.% LDH content.

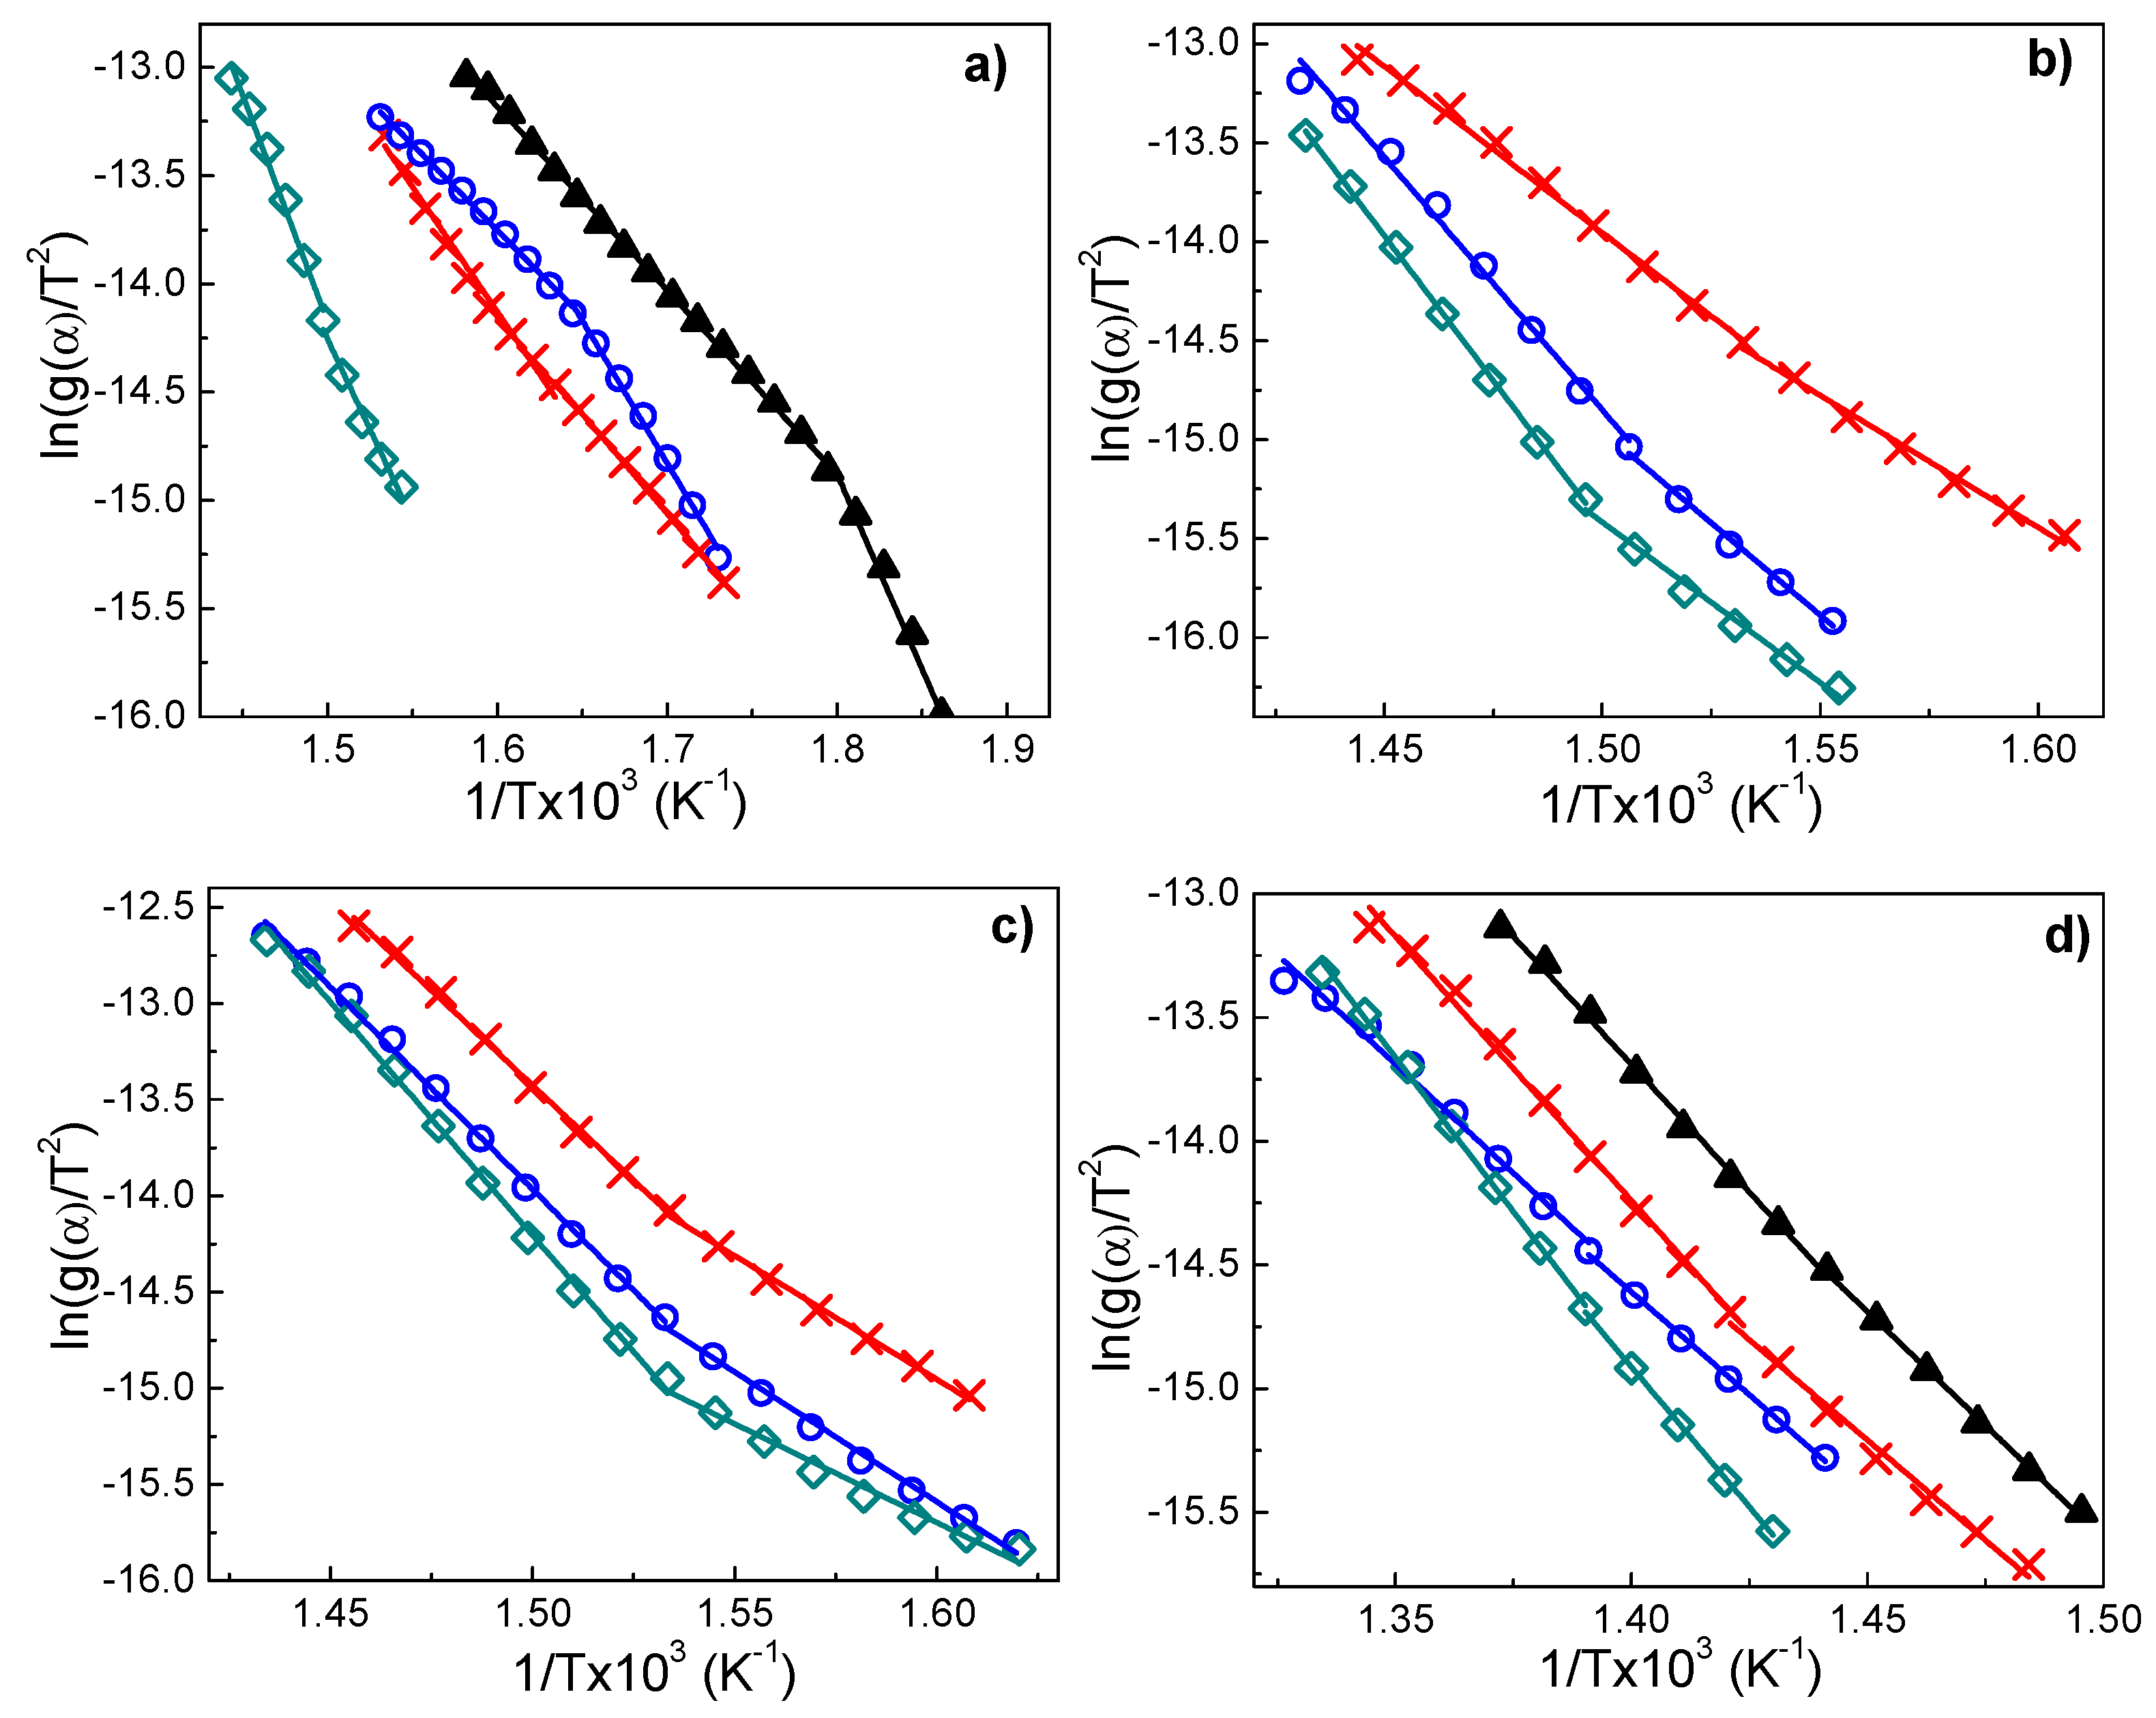
3.7.3. Coats–Redfern Method

The thermogravimetry data were tested in the Coats–Redfern (CR) method, because it considers the mechanism of thermal decomposition. This is an integral version of the Arrhenius method that was employed for the determination of kinetic parameters in the thermal decomposition processes (Equation (8)) [70,75].
[ ln ( g ( α ) T 2 ) ] y = ln ( A R β E ) [ E R T ] x
In this case, g ( α ) is an integral function that allows for the thermal decomposition process to be described by different reaction models in the solid phase and considers the order of reaction (n). The function g ( α ) can be represented according to Equation (9) or (10), depending on the reaction order (n) [71,76,77].
[ ln ( 1 ( 1 α ) 1 n ( 1 n ) T 2 ) ] y = ln ( A R β E ) [ E R T ] x   for   ( n 1 )
[ l n ( l n ( 1 α ) T 2 ) ] y = l n ( A R β E ) [ E R T ] x   for   ( n = 1 )
Using Equation (8), the activation energy, pre-exponential factor, and n can be obtained. Figure 13 shows a plot of l n ( g ( α ) T 2 ) as a function of 1/T, for PS/MgAl (10 wt.%), PS/2MgZnAl-AAC (15 wt.%), PS/2MgZnAl-AOL (15 wt.%), and PS/Mg2ZnAl-AAC (15 wt.%). These samples were analyzed by this method, because they presented the highest increment in the decomposition temperature with respect to the polystyrene matrix.
The obtained results by CR confirm those that were calculated by the Friedman and FWO methods, but with a clearer tendency of the existence of a multi-stage decomposition process [71,78].
All of the materials of Figure 14 exhibited two zones that were attributed to two different decomposition processes. In the first stage, the activation energy is greater as a result of the presence of hydrotalcite-type materials [8,79] (see Table 9). When these materials are used as additives, they generate an endothermic process that can absorb the heat supplied [8,79]. With increasing temperature, the LDH materials begin to release water. This causes a cooling in the polymeric matrix and the produced gases during the pyrolysis process are encapsulated [8]. Finally, mixed oxides (that are produced by the thermal decomposition of LDH materials) cover the polymeric matrix that is similar to a sheet that blocks the heat flow [8,79].
Once the most unstable structures have been degraded, there is a continuous increment of the heat flow and the second stage starts. This implies that an exothermic process begins, causing the decomposition of more stable organic structures, such as aromatic C bonds. This process requires a lower activation energy, because there is an excess of energy coming from the first stage of pyrolysis (see Table 9) [80].
Table 9 shows the obtained reaction orders and it is observed that, in all cases, is 1/3. This is consistent with the “contracting cylinder” mechanism of polymer decomposition processes [76,77], because Coats and Redfern refer that the reaction rate is determined by several steps, which might be due to the diffusion of the gaseous products out of the solid, or the transport of a particular ion, or the breakage of structures bonds [24]. In this work, in addition to the phenomena that were described by Coats and Redfern, the recombination of free radicals from PS could be possible during the decomposition process due to the presence of LDH materials that were modified with organic short chain compounds. Table 9 also shows the parameters of activation energy, frequency factor, and reaction order.

4. Conclusions

Mg/Zn/Al LDH nanomaterials were prepared by coprecipitation and urea hydrolysis and their structures were hydrophobized with the acrylate and oleate anions. By XRD analysis, it was observed that hydrotalcite like material phase was obtained for all fresh samples. After the intercalation of acrylate and oleate anions, besides the main hydrotalcite phase, an additional ZnO phase was also observed in the synthetized samples, except for Mg2ZnAl-AAC. The characteristic bands for fresh and intercalated LDH samples were observed by infrared spectroscopy.
PS was synthetized by emulsion polymerization with an average molecular weight of 1526.9 Da. After that, the composites materials were prepared with 10 and 15 wt.% of modified LDH with the aim of increasing the decomposition temperature of PS and they were characterized by TGA, where the materials containing Zn presented the best results of thermal stability with an increasing of 7 < T/°C < 54 °C with respect to PS (391.9 °C).
According to the XRD results, most of the modified materials with Zn presented an additional ZnO phase, which could cause a part of the additive to not be hydrophobized, which decreases the LDH dispersion into the polymer matrix and, therefore, the thermal stability. The material PS/Mg2ZnAl-AAC (15 wt.%) with the best thermal stability did not present the additional ZnO phase.
Using the TGA data, the decomposition kinetic was calculated while using Friedman, Flynn–Wall–Ozawa and Coats–Redfern methods in order to obtain the activation energy (Ea). The obtained Ea by the Friedman and Flynn–Wall–Ozawa methods presents different values attributed to a two stages decomposition process. This was confirmed by the results of the Coats–Redfern method, where, in the first stage, Ea was higher than the second stage while assuming that this behavior was due to the presence of the modified LDH into the polymeric matrix. From this model, a reaction order of 1/3 was obtained; this indicates that, during the decomposition process, a recombination of free radicals takes place due to the addition of LDH materials modified with organic short chain compounds.
In this work, it was demonstrated that, while using low contents (10 and 15 wt.%) of hydrophobized LDH, it was possible to obtain polymeric composites with a higher thermal stability than neat PS. Finally, these materials have great potential to be applied as flame retardants.

Author Contributions

Experimental work, M.Á.D.l.R.-G.; methodology, M.Á.D.l.R.-G., M.C., M.d.J.M.-O., A.G.-V., N.C.-C., J.M.D.R.; formal analysis, M.Á.D.l.R.-G., M.C., M.d.J.M.-O.; investigation, M.Á.D.l.R.-G., M.C., M.d.J.M.-O., performed measurements and the data analysis by characterization techniques, A.G.-V., N.C.-C., J.M.D.R.; supervision, M.C., M.d.J.M.-O.; writing-original draft preparation, M.Á.D.l.R.-G.; writing-review and editing, M.C., M.d.J.M.-O.; all authors contributed to the paper writing.

Funding

This research received no external funding.

Acknowledgments

M. A. De la Rosa-Guzmán thanks CONACYT for a scholarship. The authors wish to thank the CNMN-IPN, and also wish to thank SIP 20180102 and 20181236 projects for financial support. The authors wish to thank to Glenn Hefter for the revision of the manuscript and his valuable comments. The authors also wish to thank to COFAA-IPN for the financial support.

Conflicts of Interest

The authors declare no conflict of interest.

References

  1. Edenharter, A.; Feicht, P.; Diar-Bakerly, B.; Beyer, G.; Breu, J. Superior flame retardant by combining high aspect ratio layered double hydroxide and graphene oxide. Polymer 2016, 91, 41–49. [Google Scholar] [CrossRef]
  2. Fromme, H.; Becher, G.; Hilge, B.; Völkel, W. Brominated flame retardants-Exposure and risk assessment for the general population. Int. J. Hyg. Environ. Health 2016, 219, 1–23. [Google Scholar] [CrossRef]
  3. Sun, G.; Liu, L.; Wang, J.; Wang, H.; Wang, W.; Han, S. Effects of hydrotalcites and tris (1-chloro-2-propyl) phosphate on thermal stability, cellular structure and fire resistance of isocyanate-based polyimide foams. Polym. Degrad. Stab. 2015, 115, 1–15. [Google Scholar] [CrossRef]
  4. Dasari, A.; Yu, Z.-Z.; Cai, G.-P.; Mai, Y.-W. Recent developments in the fire retardancy of polymeric materials. Prog. Polym. Sci. 2013, 38, 1357–1387. [Google Scholar] [CrossRef]
  5. Gao, Y.; Wu, J.; Wang, Q.; Wilkie, C.A.; O’Hare, D. Flame retardant polymer/layered double hydroxide nanocomposites. J. Mater. Chem. A 2014, 2, 10996–11016. [Google Scholar] [CrossRef]
  6. Wang, D.Y.; Das, A.; Costa, F.R.; Leuteritz, A.; Wang, Y.Z.; Wagenknecht, U.; Heinrich, G. Synthesis of organo cobalt-aluminum layered double hydroxide via a novel single-step self-assembling method and its use as flame retardant nanofiller in PP. Langmuir 2010, 26, 14162–14169. [Google Scholar] [CrossRef] [PubMed]
  7. Alongi, J.; Carosio, F.; Malucelli, G. Current emerging techniques to impart flame retardancy to fabrics: An overview. Polym. Degrad. Stab. 2014, 106, 138–149. [Google Scholar] [CrossRef]
  8. Hollingbery, L.A.; Hull, T.R. The fire retardant behaviour of huntite and hydromagnesite—A review. Polym. Degrad. Stab. 2010, 95, 2213–2225. [Google Scholar] [CrossRef]
  9. Suresh, K.; Kumar Vinoth, R.; Pugazhenthi, G. Processing and characterization of polystyrene nanocomposites based on CoAl layered double hydroxide. J. Sci. Adv. Mater. Devices 2016, 1, 351–361. [Google Scholar] [CrossRef] [Green Version]
  10. Wang, L.; Su, S.; Chen, D.; Wilkie, CA. Variation of anions in layered double hydroxides: Effects on dispersion and fire properties. Polym. Degrad. Stab. 2009, 94, 770–781. [Google Scholar] [CrossRef] [Green Version]
  11. Jang, B.N.; Wilkie, C.A. The thermal degradation of polystyrene nanocomposite. Polymer 2005, 46, 2933–2942. [Google Scholar] [CrossRef]
  12. Bera, O.; Pilić, B.; Pavličević, J.; Jovičić, M.; Holló, B.; Szécsényi, K.M.; Mészáros-Szécsényi, K.; Špirkova, M. Preparation and thermal properties of polystyrene/silica nanocomposites. Thermochim. Acta 2011, 515, 1–5. [Google Scholar] [CrossRef]
  13. Hood, M.A.; Mari, M.; Muñoz-Espí, R. Synthetic strategies in the preparation of polymer/inorganic hybrid nanoparticles. Materials 2014, 7, 4057–4087. [Google Scholar] [CrossRef] [PubMed]
  14. Pereira, C.M.C.; Herrero, M.; Labajos, F.M.; Marques, A.T.; Rives, V. Preparation and properties of new flame retardant unsaturated polyester nanocomposites based on layered double hydroxides. Polym. Degrad. Stab. 2009, 94, 939–946. [Google Scholar] [CrossRef]
  15. Jiao, C.; Wang, Z.; Chen, X.; Yu, B.; Hu, Y. Irradiation crosslinking and halogen-free flame retardation of EVA using hydrotalcite and red phosphorus. Radiat. Phys. Chem. 2006, 75, 557–563. [Google Scholar] [CrossRef]
  16. Montañez, M.K.; Molina, R.; Moreno, S. Nickel catalysts obtained from hydrotalcites by coprecipitation and urea hydrolysis for hydrogen production. Int. J. Hydrogen Energy 2014, 39, 8225–8237. [Google Scholar] [CrossRef]
  17. Liu, Q.; Wang, C.; Qu, W.; Wang, B.; Tian, Z.; Ma, H.; Xu, R. The application of Zr incorporated Zn-Al dehydrated hydrotalcites as solid base in transesterification. Catal. Today 2014, 234, 161–166. [Google Scholar] [CrossRef]
  18. Conterosito, E.; Gianotti, V.; Palin, L.; Boccaleri, E.; Viterbo, D.; Milanesio, M. Facile preparation methods of hydrotalcite layered materials and their structural characterization by combined techniques. Inorganica Chim. Acta 2018, 470, 36–50. [Google Scholar] [CrossRef]
  19. Berber, M.R.; Hafez, I.H.; Minagawa, K.; Katoh, M.; Mori, T.; Tanaka, M. Uniform nanoparticles of hydrotalcite-like materials and their textural properties at optimized conditions of urea hydrothermal treatment. J. Mol. Struct. 2013, 1033, 104–112. [Google Scholar] [CrossRef]
  20. Pilch-Pitera, B.; Kędzierski, M.; Olejnik, E.; Zapotoczny, S. Structure and properties of polyurethane-based powder clear coatings systems modified with hydrotalcites. Prog. Org. Coat. 2016, 95, 120–126. [Google Scholar] [CrossRef]
  21. Soori, M.M.; Ghahramani, E.; Kazemian, H.; Al-Musawi, T.J.; Zarrabi, M. Intercalation of tetracycline in nano sheet layered double hydroxide: An insight into UV/VIS spectra analysis. J. Taiwan Inst. Chem. Eng. 2016, 63, 271–285. [Google Scholar] [CrossRef]
  22. Peng, H.; Tjiu, W.C.; Shen, L.; Huang, S.; He, C.; Liu, T. Preparation and mechanical properties of exfoliated CoAl layered double hydroxide (LDH)/polyamide 6 nanocomposites by in situ polymerization. Compos. Sci. Technol. 2009, 69, 991–996. [Google Scholar] [CrossRef]
  23. Mostafa, M.S.; Bakr, A.A.; Naggar, A.M.A.; Sultan, E.A. Water decontamination via the removal of Pb (II) using a new generation of highly energetic surface nano-material: Co+2 Mo+6 LDH. J. Colloid Interface Sci. 2016, 461, 261–272. [Google Scholar] [CrossRef] [PubMed]
  24. Coats, A.W.; Redfern, J.P. Thermogravimetric Analysis. Analyst 1963, 88, 906–924. [Google Scholar] [CrossRef]
  25. Nikiforidis, C.V.; Gilbert, E.P.; Scholten, E. Organogel formation via supramolecular assembly of oleic acid and sodium oleate. RSC Adv. 2015, 5, 47466–47475. [Google Scholar] [CrossRef] [Green Version]
  26. Vaysse, C.; Guerlou-Demourgues, L.; Duguet, E.; Delmas, C. Acrylate intercalation and in situ polymerization in iron-, cobalt-, or manganese-substituted nickel hydroxides. Inorg Chem. 2003, 42, 4559–4567. [Google Scholar] [CrossRef]
  27. Crespo, I.; Barriga, C.; Ulibarri, M.A.; Gonza, G.; Malet, P.; Rives, V. An X-ray Diffraction and Absorption Study of the Phases Formed upon Calcination of Zn–Al–Fe Hydrotalcites. Chem. Mater. 2001, 13, 1518–1527. [Google Scholar] [CrossRef]
  28. Bezen, M.C.I.; Breitkopf, C.; Lercher, J.A. On the acid-base properties of Zn-Mg-Al mixed oxides. Appl. Catal. A Gen. 2011, 399, 93–99. [Google Scholar] [CrossRef]
  29. Smoláková, L.; Frolich, K.; Kocík, J.; Kikhtyanin, O.; Čapek, L. Surface properties of hydrotalcite-based Zn(Mg)Al oxides and their catalytic activity in aldol condensation of furfural with acetone. Ind. Eng. Chem. Res. 2017, 56, 4638–4648. [Google Scholar] [CrossRef]
  30. De La Rosa-Guzmán, M.A.; Martínez-Ortiz, M.J.; Castillo, N.; Ramírez-Salazar, C.A.; Méndez-Ceja, A.; Canseco-Morales, J.E. Spectroscopic and structural characterization of Pd nanoparticles supported on hydrotalcite-like materials. In Materials Characterization; Pérez-Campos, R., Contreras-Cuevas, A., Esparza-Muñoz, R., Eds.; Springer International Publishing: Cham, Switzerland, 2015; p. 51. [Google Scholar]
  31. Inayat, A.; Klumpp, M.; Schwieger, W. The urea method for the direct synthesis of ZnAl layered double hydroxides with nitrate as the interlayer anion. Appl. Clay Sci. 2011, 51, 452–459. [Google Scholar] [CrossRef]
  32. Álvarez, M.G.; Chimentão, R.J.; Barrabés, N.; Föttinger, K.; Gispert-Guirado, F.; Kleymenov, E.; Tichit, D.; Medina, F. Structure evolution of layered double hydroxides activated by ultrasound induced reconstruction. Appl. Clay Sci. 2013, 83–84, 1–11. [Google Scholar] [CrossRef]
  33. Kunde, L.B.; Gade, S.M.; Kalyani, V.S.; Gupte, S.P. Catalytic synthesis of chalcone and flavanone using Zn-Al hydrotalcite adhere ionic liquid. Catal. Commun. 2009, 10, 1881–1888. [Google Scholar] [CrossRef]
  34. Xu, S.; Liao, M.C.; Zeng, H.Y.; Zhang, Z.Q.; Liu, X.J.; Zhu, P.H. Ultrafine hydrotalcite particles prepared with novel technology to improve the flame retardancy of polypropylene. Appl. Clay Sci. 2015, 108, 215–221. [Google Scholar] [CrossRef]
  35. Kowalik, P.; Konkol, M.; Kondracka, M.; Próchniak, W.; Bicki, R.; Wiercioch, P. Memory effect of the CuZnAl-LDH derived catalyst precursor—In situ XRD studies. Appl. Catal. A Gen. 2013, 464–465, 339–347. [Google Scholar] [CrossRef]
  36. Miranda, L.D.L.; Bellato, C.R.; Fontes, M.P.F.; de Almeida, M.F.; Milagres, J.L.; Minim, L.A. Preparation and evaluation of hydrotalcite-iron oxide magnetic organocomposite intercalated with surfactants for cationic methylene blue dye removal. Chem. Eng. J. 2014, 254, 88–97. [Google Scholar] [CrossRef]
  37. Heredia, A.C.; Oliva, M.I.; Zandalazini, C.I.; Aguú, U.A.; Eimer, G.A.; Casuscelli, S.G.; Herrero, E.R.; Pérez, C.F.; Crivello, M.E. Synthesis, Characterization, and Catalytic Behavior of Mg–Al–Zn–Fe Mixed Oxides from Precursors Layered Double Hydroxide. Ind. Eng. Chem. Res. 2011, 50, 6695–6703. [Google Scholar] [CrossRef]
  38. Ivanova, A.S.; Korneeva, E.V.; Bondareva, V.M.; Glazneva, T.S. Gas-phase dehydration of glycerol over calcined tungsten-modified Zn-Al-O hydrotalcite-type catalysts. J. Mol. Catal. A Chem. 2015, 408, 98–106. [Google Scholar] [CrossRef]
  39. Carriazo, D.; Del Arco, M.; García-López, E.; Marc, G.; Martín, C.; Palmisano, L. Zn,Al hydrotalcites calcined at different temperatures: Preparation, characterization and photocatalytic activity in gas-solid regime. J. Mol. Catal. A Chem. 2011, 342–343, 83–90. [Google Scholar] [CrossRef]
  40. Cavani, F.; Trifiro, F.; Vaccari, A. Hydrotalcite-type anionic clays: Preparation, properties and applications. Catal. Today 1991, 11, 173–301. [Google Scholar] [CrossRef]
  41. Tanaka, M.; Park, I.Y.; Kuroda, K.; Kato, C. Formation of Hydrotalcite-Acrylate Compounds Their Heat-Treated Products. Bull. Chem. Soc. Jpn. 1989, 62, 3442–3445. [Google Scholar] [CrossRef]
  42. Aguzzi, A.; Ambrogi, V.; Costantino, U.; Marmottini, F. Intercalation of acrylate anions into the galleries of Zn-Al layered double hydroxide. J. Phys. Chem. Solids 2007, 68, 808–812. [Google Scholar] [CrossRef]
  43. Viéville, J.; Tanty, M.; Delsuc, M.A. Polydispersity index of polymers revealed by DOSY NMR. J. Magn. Reson. 2011, 212, 169–173. [Google Scholar] [CrossRef] [PubMed]
  44. Lynd, N.A.; Meuler, A.J.; Hillmyer, M.A. Polydispersity and block copolymer self-assembly. Prog. Polym. Sci. 2008, 33, 875–893. [Google Scholar] [CrossRef]
  45. Li, L. Maldi Mass Spectrometry for Synthetic Polymer Analysis; John Wiley & Sons, Inc.: Hoboken, NJ, USA, 2010; Volume 175, pp. 1–9. [Google Scholar]
  46. Rogosic, M.; Mencer, H.J.; Gomzi, Z. Polydispersity index and molecular weight distributions of polymers. Eur. Polym. J. 1996, 32, 1337–1344. [Google Scholar] [CrossRef]
  47. Paul, D.R.; Robeson, L.M. Polymer nanotechnology: Nanocomposites. Polymer 2008, 49, 3187–3204. [Google Scholar] [CrossRef] [Green Version]
  48. Yahyaoui, R.; Sánchez-Jimenez, P.E.; Pérez-Maqueda, L.A.; Nahdi, K.; Criado-Luque, J.M. Synthesis, characterization and combined kinetic analysis of thermal decomposition of hydrotalcite (Mg6Al2(OH)16CO3·4H2O). Thermochim. Acta 2018, 667, 177–184. [Google Scholar] [CrossRef]
  49. Pérez-Ramírez, J.; Abelló, S. Thermal decomposition of hydrotalcite-like compounds studied by a novel tapered element oscillating microbalance (TEOM). Comparison with TGA and DTA. Thermochim. Acta 2006, 444, 75–82. [Google Scholar] [CrossRef]
  50. Reverón, H.; Gutiérrez-Campos, D.; Rodríguez, R.M.; Bonassin, J.C.; Yahyaoui, R.; Sánchez-Jimenez, P.E.; Pérez-Maqueda, L.A.; Nahdi, K.; Criado-Luque, J.M. Chemical synthesis and thermal evolution of MgAl2O4 spinel precursor prepared from industrial gibbsite and magnesia powder. Thermochim. Acta 2006, 667, 75–82. [Google Scholar] [CrossRef]
  51. Oliveira-Corrêa, C.L.; Licea, Y.E.; Palacio, L.A.; Zanon-Zotin, F.M. Effect of the composition and thermal treatment in catalysts derived from Cu-Al hydrotalcites-like compounds in the NO reduction by CO. Catal. Today 2016, 289, 1–10. [Google Scholar] [CrossRef]
  52. Aristizábal, A.; Kolafa, M.; Contreras, S.; Domínguez, M.; Llorca, J.; Barrabés, N.; Tichit, D.; Medina, F. Catalytic activity and characterization of Pt/calcined CuZnAl hydrotalcites in nitrate reduction reaction in water. Catal. Today 2011, 175, 370–379. [Google Scholar] [CrossRef]
  53. Yei, D.R.; Fu, H.K.; Chang, Y.H.; Kuo, S.W.; Huang, J.M.; Chang, F.C. Thermal properties of polystyrene nanocomposites formed from rigid intercalation agent-treated montmorillonite. J. Polym. Sci. Part B Polym. Phys. 2007, 45, 1781–1787. [Google Scholar] [CrossRef]
  54. Li, S.; Bhushan, B. Lubrication performance and mechanisms of Mg/Al-, Zn/Al-, and Zn/Mg/Al-layered double hydroxide nanoparticles as lubricant additives. Appl. Surf. Sci. 2016, 378, 308–319. [Google Scholar] [CrossRef]
  55. Zejiang, Z.; Chenghua, X.; Fali, Q.; Xiujuan, M.; Bin, L.; Shuosheng, Z. Study on fire-retardant nanocrystalline Mg-Al layered double hydroxides synthesized by micro-wave-crystallization method. Sci. China Ser. B 2004, 47, 488–498. [Google Scholar]
  56. Ahmed, L.; Zhang, B.; Hawkins, S.; Sam-Mannan, M.; Cheng, Z. Study of thermal and mechanical behaviors of flame retardant polystyrene-based nanocomposites prepared via in-situ polymerization method. J. Loss Prev. Process Ind. 2017, 49, 228–239. [Google Scholar] [CrossRef]
  57. Zonglin, Z.; Yongqin, H.; Tingxi, L.; Xiaoxiao, W.; Qing, L.; Liang, C. Polyaniline/montmorillonite nanocomposites as an effective flame retardant and smoke suppressant for polystyrene. Synth. Met. 2016, 221, 28–38. [Google Scholar]
  58. Chen, G.; He, S.; Cheng, Z.; Guan, Y.; Yan, B.; Ma, W.; Leung, D.Y.C. Comparison of kinetic analysis methods in thermal decomposition of cattle manure by themogravimetric analysis. Bioresour. Technol. 2017, 243, 69–77. [Google Scholar] [CrossRef] [PubMed]
  59. Criado, J.M.; Otega, A.; Rouquerol, J.; Rouquerol, F. Un nuevo método de análisis térmico: El analisis térmico a velocidad de transformación controlada. Bol. Soc. Española Cerámica Vidr. 1986, 26, 3–11. [Google Scholar]
  60. Singh, A.; Soni, P.K.; Singh, M.; Srivastava, A. Thermal degradation, kinetic and correlation models of poly(vinylidene fluoride-chlorotrifluoroetheylene) copolymers. Thermochim. Acta 2012, 548, 88–92. [Google Scholar] [CrossRef]
  61. Ebrahimi-Kahrizsangi, R.; Abbasi, M.H. Evaluation of reliability of Coats-Redfern method for kinetic analysis of non-isothermal TGA. Trans. Nonferrous Met. Soc. China 2008, 18, 217–221. [Google Scholar] [CrossRef]
  62. Arrieta, M.P.; López, J.; Ferrándiz, S.; Parres, F. Aplicación de modelos matemáticos para el estudio de degradación térmica de polímeros. Model. Sci. Educ. Learn. 2013, 6, 119–130. [Google Scholar] [CrossRef]
  63. Majoni, S.; Chaparadza, A. Thermal degradation degradation kinetic study of polystyrene/organophosphate composite. Thermochim. Acta 2018, 662, 8–15. [Google Scholar] [CrossRef]
  64. Costantino, U.; Gallipoli, A.; Nocchetti, M.; Camino, G.; Bellucci, F.; Frache, A. New nanocomposites constituted of polyethylene and organically modified ZnAl-hydrotalcites. Polym. Degrad. Stab. 2005, 90, 586–590. [Google Scholar] [CrossRef]
  65. Font, R.; Garrido, M.A. Friedman and n-reaction order methods applied to pine needles and polyurethane thermal decompositions. Thermochim. Acta 2018, 660, 124–133. [Google Scholar] [CrossRef] [Green Version]
  66. Venkatesh, M.; Ravi, P.; Tewari, S.P. Isoconversional kinetic analysis of decomposition of nitroimidazoles: Friedman method vs Flynn-Wall-Ozawa method. J. Phys. Chem. A 2013, 117, 10162–10169. [Google Scholar] [CrossRef] [PubMed]
  67. Bercic, G. The universality of Friedman’s isoconversional analysis results in a model-less prediction of thermodegradation profiles. Thermochim. Acta 2017, 650, 1–7. [Google Scholar] [CrossRef]
  68. Huidobro, J.A.; Iglesias, I.; Alfonso, B.F.; Espina, A.; Trobajo, C.; Garcia, J.R. Reducing the effects of noise in the calculation of activation energy by the Friedman method. Chemom. Intell. Lab. Syst. 2016, 151, 146–152. [Google Scholar] [CrossRef]
  69. Muhamad-Bisyrul.Hafi, O.; Zulkifli, A.; Hasnan, O.; Mohd-Firdaus, O.; Hazizan, A.; Muhamad-Bisyrul. Thermal degradation behavior of a flame retardant melamine derivative hyperbranched polyimide with different terminal groups. RSC Adv. 2015, 5, 92664–92676. [Google Scholar]
  70. Hu, J.; Chen, M.; Tian, H.; Deng, W. Preparation and pyrolysis characteristics of PNIPAM-grafted SiO2 hollow spheres loading vitamin C. RSC Adv. 2015, 5, 81134–81141. [Google Scholar] [CrossRef]
  71. Liu, J.; Ma, J.; Luo, L.; Zhang, H.; Jiang, X. Pyrolysis of superfine pulverized coal. Part 5. Thermogravimetric analysis. Energy Convers. Manag. 2017, 154, 491–502. [Google Scholar] [CrossRef]
  72. Nyambo, C.; Wilkie, C.A. Layered double hydroxides intercalated with borate anions: Fire and thermal properties in ethylene vinyl acetate copolymer. Polym. Degrad. Stab. 2009, 94, 506–512. [Google Scholar] [CrossRef] [Green Version]
  73. Xu, S.; Zhang, L.; Lin, Y.; Li, R.; Zhang, F. Layered double hydroxides used as flame retardant for engineering plastic acrylonitrile–butadiene–styrene (ABS). J. Phys. Chem. Solids 2012, 73, 1514–1517. [Google Scholar] [CrossRef]
  74. Kaspersma, J.; Doumen, C.; Munro, S.; Prins, A.M. Fire retardant mechanism of aliphatic bromine compounds in polystyrene and polypropylene. Polym. Degrad. Stab. 2002, 77, 325–331. [Google Scholar] [CrossRef]
  75. Fernandez, A.; Mazza, G.; Rodriguez, R. Thermal decomposition under oxidative atmosphere of lignocellulosic wastes: Different kinetic methods application. J. Environ. Chem. Eng. 2018, 6, 404–415. [Google Scholar] [CrossRef]
  76. Xu, F.; Wang, B.; Yang, D.; Hao, J.; Qiao, Y.; Tian, Y. Thermal degradation of typical plastics under high heating rate conditions by TG-FTIR: Pyrolysis behaviors and kinetic analysis. Energy. Convers. Manag. 2018, 171, 1106–1115. [Google Scholar] [CrossRef]
  77. Zhao, W.; Zhang, Q.; Chen, T.; Lu, T. Preparation and thermal decomposition of PS/Ni microspheres. Mater. Chem. Phys. 2009, 113, 428–434. [Google Scholar] [CrossRef]
  78. Ge, J.; Wang, R.Q.; Liu, L. Study on the Thermal Degradation Kinetics of the Common Wooden Boards. Procedia Eng. 2016, 135, 72–82. [Google Scholar] [CrossRef] [Green Version]
  79. Nyambo, C.; Chen, D.; Su, S.; Wilkie, C.A. Does organic modification of layered double hydroxides improve the fire performance of PMMA? Polym. Degrad. Stab. 2009, 94, 1298–1306. [Google Scholar] [CrossRef] [Green Version]
  80. Azizul-Haque, M.; Paliwal, L.J. Synthesis, spectral characterization and thermal aspects of coordination polymers of some transition metal ions with adipoyl bis(isonicotinoylhydrazone). J. Mol. Struct. 2017, 1134, 278–291. [Google Scholar] [CrossRef]
Figure 1. Scheme of the LDH structure.
Nanomaterials 09 01528 g001
Figure 2. X-ray diffraction patterns of: (a) as-prepared, and (b) calcined samples.
Nanomaterials 09 01528 g002
Figure 3. X-ray diffraction patterns of LDHs modified with acrylate (ACC) and oleate (AOL) for: (a) MgAl, (b) 2MgZnAl, (c) Mg2ZnAl, and (d) ZnAl.
Nanomaterials 09 01528 g003
Figure 4. Intercalation scheme of: (a) acrylate and (b) oleate anions in LDH materials.
Nanomaterials 09 01528 g004
Figure 5. Fourier transform infrared spectroscopy (FTIR) spectra of: (a) MgAl-COP, (b) MgAl-AAC, (c) MgAl-AOL, (d) PS/MgAl-AAC, and (e) PS/MgAl-AOL.
Nanomaterials 09 01528 g005
Figure 6. Scanning electron microscope (SEM) images of (a) PS/2MgZnAl-AAC (15 wt.%) and (b) PS/Mg2ZnAl-AAC (15 wt.%).
Nanomaterials 09 01528 g006
Figure 7. Transmission electron microscopy (TEM) images of PS/2MgZnAl-AAC (15 wt.%) (a) Low magnification, (b) High magnification, of PS/Mg2ZnAl-AAC (15 wt.%), (c) Low magnification image, and and (d) High magnification.
Nanomaterials 09 01528 g007
Figure 8. Thermogravimetric analysis for modified materials with acrylate anion (AAC) and oleate anion (AOL) for: (a) MgAl, (b) 2MgZnAl, (c) Mg2ZnAl, and (d) ZnAl.
Nanomaterials 09 01528 g008
Figure 9. Thermograms for nanocomposites with 10 wt.% of LDH modified with acrylate (AAC) and oleate (AOL) anions for: (a) MgAl, (b) 2MgZnAl, (c) Mg2ZnAl, and (d) ZnAl.
Nanomaterials 09 01528 g009
Figure 10. Thermogravimetric analysis for nanocomposites 15 wt.% of LDH modified with acrylate (AAC) and oleate (AOL) anions for: (a) MgAl, (b) 2MgZnAl, (c) Mg2ZnAl, and (d) ZnAl.
Nanomaterials 09 01528 g010
Figure 11. d α d T as function of α for the sample PS/Mg2ZnAl-AAC (15 wt.%) at ● β = 10 °C/min, ◄ β = 20 °C/min, and ♦ β = 30 °C/min.
Nanomaterials 09 01528 g011
Figure 12. Plot of ln (dα/dT) vs. 1/T for sample PS/Mg2ZnAl_AAC (15 wt.%) at ● β = 10 °C/min, ◄ β = 20 °C/min, and ♦ β = 30 °C/min.
Nanomaterials 09 01528 g012
Figure 13. Plot of log (β) vs. 1000/T for sample PS/Mg2ZnAl-AAC (15 wt.%) at ♦ α = 0.1, ● α = 0.2, ◄ α = 0.3, × α = 0.4, ▲ α = 0.5, and + α = 0.6.
Nanomaterials 09 01528 g013
Figure 14. Plot of l n ( g ( α ) T 2 ) vs. 1/T for (a) PS/MgAl-AOL (10), (b) PS/2MgZnAl-AAC (15), (c) PS/2MgZnAl-AOL (15), (d) PS/Mg2ZnAl-AAC(15) at ▲ β = 5 °C/min, × β = 10 °C/min, ○ β = 20 °C/min and ◊ β = 30 °C/min.
Nanomaterials 09 01528 g014
Table 1. Layered Double Hydroxides (LDH) materials.
LDHMg/ZnFormulaSynthesis MethodAEC (mmol·g−1)
MgAl-COP2/0Mg6Al2(OH)16(NO3)2·4H2OCo-precipitation3.00
2MgZnAl-COP2/1Mg4Zn2Al2(OH)16(NO3)2·4H2OCo-precipitation2.67
Mg2ZnAl-U1/2Mg2Zn4Al2(OH)16(NO3)2·4H2OUrea2.40
ZnAl-U0/2Zn6Al2(OH)16(NO3)2·4H2OUrea2.19
Table 2. Polystyrene formulation for the semicontinuous emulsion polymerization.
ReagentsReactor (g)Addition Tank (g)
Surfactant sol. 2.66 wt.%3-
Surfactant sol. 6.5 wt.%-30
Styrene-120
Na2S2O8 sol. 3.86 wt.% 110
Distilled water37-
Table 3. Cell parameters of fresh and modified samples.
Sampled003 (Å)c (Å)a (Å)
MgAl-COP7.4322.293.07
MgAl-AAC11.6234.853.05
MgAl-AOL8.7226.173.05
2MgZnAl-COP8.7326.173.05
2MgZnAl-AAC13.3039.913.03
2MgZnAl-AOL20.2760.813.05
Mg2ZnAl-U7.5822.753.06
Mg2ZnAl-AAC12.7338.203.03
Mg2ZnAl-AOL14.4043.903.05
ZnAl-U8.7326.183.07
ZnAl-AAC15.9847.942.87
ZnAl-AOL14.4043.192.95
Table 4. Average molecular weight and polydispersity index.
M ¯ n   ( Da ) M ¯ w   ( Da ) PDI
1505.8 ± 121526.9 ± 131.01
Table 5. Decomposition temperature of PS and nanocomposites.
MaterialDecomposition Temperature (°C)
10 wt.% LDH15 wt.% LDH
PS391.9
PS/MgAl-AAC387.3378.0
PS/MgAl-AOL396.2379.6
PS/2MgZnAl-AAC369.1399.4
PS/2MgZnAl-AOL389.9397.8
PS/Mg2ZnAl-AAC381.5445.9
PS/Mg2ZnAl-AOL358.5376.5
PS/ZnAl-AAC378.0369.1
PS/ZnAl-AOL391.8388.9
Table 6. Activation energies obtained using the Friedman method.
MaterialActivation Energy (Ea-F) (kJ·mol−1)
Heating Rate (°C/min)Average
102030
PS50.250.2
PS/MgAl-AAC (10 wt.%)103.686.9102.497.6 ± 9
PS/MgAl-AAC (15 wt.%)78.0103.8107.696.5 ± 16
PS/MgAl-AOL (10 wt.%)53.9169.4104.1109.1 ± 58
PS/MgAl-AOL (15 wt.%)78.4109.0118.0101.8 ± 21
PS/2MgZnAl-AAC (10 wt.%)92.455.5151.399.8 ± 48
PS/2MgZnAl-AAC (15 wt.%)134.8196.4211.4180.9 ± 41
PS/2MgZnAl-AOL (10 wt.%)92.268.3139.5100.0 ± 36
PS/2MgZnAl-AOL (15 wt.%)126.8186.1198.4170.5 ± 38
PS/Mg2ZnAl-AAC (10 wt.%)80.7118.5110.8103.3 ± 20
PS/Mg2ZnAl-AAC (15 wt.%)170.6122.6180.8158.0 ± 31
PS/Mg2ZnAl-AOL (10 wt.%)51.1157.8181.0130.0 ± 69
PS/Mg2ZnAl-AOL (15 wt.%)93.661.0163.8106.2 ± 52
PS/ZnAl-AAC (10 wt.%)119.9100.1133.9118.0 ± 17
PS/ZnAl-AAC (15 wt.%)57.869.970.966.2 ± 7
PS/ZnAl-AOL (10wt.%)105.1107.2109.4107.2 ± 2
PS/ZnAl-AOL (15wt.%)67.4101.5125.498.1 ± 29
Table 7. Activation energies obtained using the Flynn–Wall–Ozawa method.
MaterialActivation Energy (Ea-FWO) (kJ·mol−1)
Conversion (α)Average
0.10.20.30.40.50.6
PS50.250.2
PS/MgAl-AAC (10 wt.%)83.964.274.8118.8113.2120.395.8 ± 22
PS/MgAl-AAC (15 wt.%)110.399.5113.2123.4136.8132.4119.3 ± 13
PS/MgAl-AOL (10 wt.%)71.462.360.856.757.767.962.8 ± 5
PS/MgAl-AOL (15 wt.%)107.0139.5161.2172.6174.7170.2154.2 ± 24
PS/2MgZnAl-AAC (10 wt.%)71.987.9115.9134.5138.5146.4115.8 ± 27
PS/2MgZnAl-AAC (15 wt.%)71.0117.3121.0137.2149.0163.9126.6 ± 29
PS/2MgZnAl-AOL (10 wt.%)78.093.9118.5135.0139.4146.4118.5 ± 25
PS/2MgZnAl-AOL (15 wt.%)133.5179.6259.2215.8207.7222.0203.0 ± 39
PS/Mg2ZnAl-AAC (10 wt.%)80.285.0100.3115.6137.3138.0109.4 ± 23
PS/Mg2ZnAl-AAC (15 wt.%)165.6236.5254.3264.3287.7209.5236.3 ± 40
PS/Mg2ZnAl-AOL (10 wt.%)50.348.859.264.871.787.063.6 ± 13
PS/Mg2ZnAl-AOL (15 wt.%)23.528.934.941.346.448.837.3 ± 9
PS/ZnAl-AAC (10 wt.%)35.167.777.290.1101.0111.080.3 ± 25
PS/ZnAl-AAC (15 wt.%)84.689.3105.7119.9127.2137.5110.7 ± 19
PS/ZnAl-AOL (10 wt.%)122.8123.0114.9102.190.874.4104.7 ± 17
PS/ZnAl-AOL (15 wt.%)75.3112.4117.0119.9125.9131.4113.6 ± 18
Table 8. Activation energy of the mechanism.
MaterialActivation Energy (kJ·mol−1)
Ea-FEa-FWOEa-M
PS--50.2
PS/MgAl-AAC (10 wt.%)97.695.896.7 ± 1
PS/MgAl-AAC (15 wt.%)96.5119.3107.9 ± 11
PS/MgAl-AOL (10 wt.%)109.163.386.2 ± 23
PS/MgAl-AOL (15 wt.%)101.8154.2128.0 ± 26
PS/2MgZnAl-AAC (10 wt.%)99.8115.8107.8 ± 8
PS/2MgZnAl-AAC (15 wt.%)180.9126.6153.7 ± 27
PS/2MgZnAl-AOL (10 wt.%)100.0118.5109.3 ± 9
PS/2MgZnAl-AOL (15 wt.%)170.5203.0186.7 ± 16
PS/Mg2ZnAl-AAC (10 wt.%)103.3109.4106.4 ± 3
PS/Mg2ZnAl-AAC (15 wt.%)158.0236.3197.2 ± 39
PS/Mg2ZnAl-AOL (10 wt.%)130.063.696.8 ± 33
PS/Mg2ZnAl-AOL (15 wt.%)106.237.371.7 ± 34
PS/ZnAl-AAC (10 wt.%)118.080.399.2 ± 19
PS/ZnAl-AAC (15 wt.%)66.2110.788.4 ± 22
PS/ZnAl-AOL (10 wt.%)107.2104.7105.9 ± 1
PS/ZnAl-AOL (15 wt.%)98.1113.6105.9 ± 8
Table 9. Kinetic parameters obtained using the Coats–Redfern model.
SamplenPyrolysis Process
First StageSecond Stage
Ea (kJ·mol−1)A (s−1)R2Ea (kJ·mol−1)A (s−1)R2
PS/MgAl-AOL 10 wt.%1/3101.88.4 × 10110.9926118.78.5 × 10110.9919
PS/2MgZnAl-AAC 15 wt.%1/3198.42.1 × 10170.9995133.51.3 × 10100.9915
PS/2MgZnAl-AOL 15 wt.%1/3180.21.8 × 10140.9866101.51.5 × 1070.9810
PS/Mg2ZnAl-AAC 15 wt.%1/3175.81.5 × 10130.9900153.65.7 × 10110.9375

