Aqueous Gold Nanoparticles Generated by AC and Pulse-Power-Driven Plasma Jet


Abstract
1. Introduction
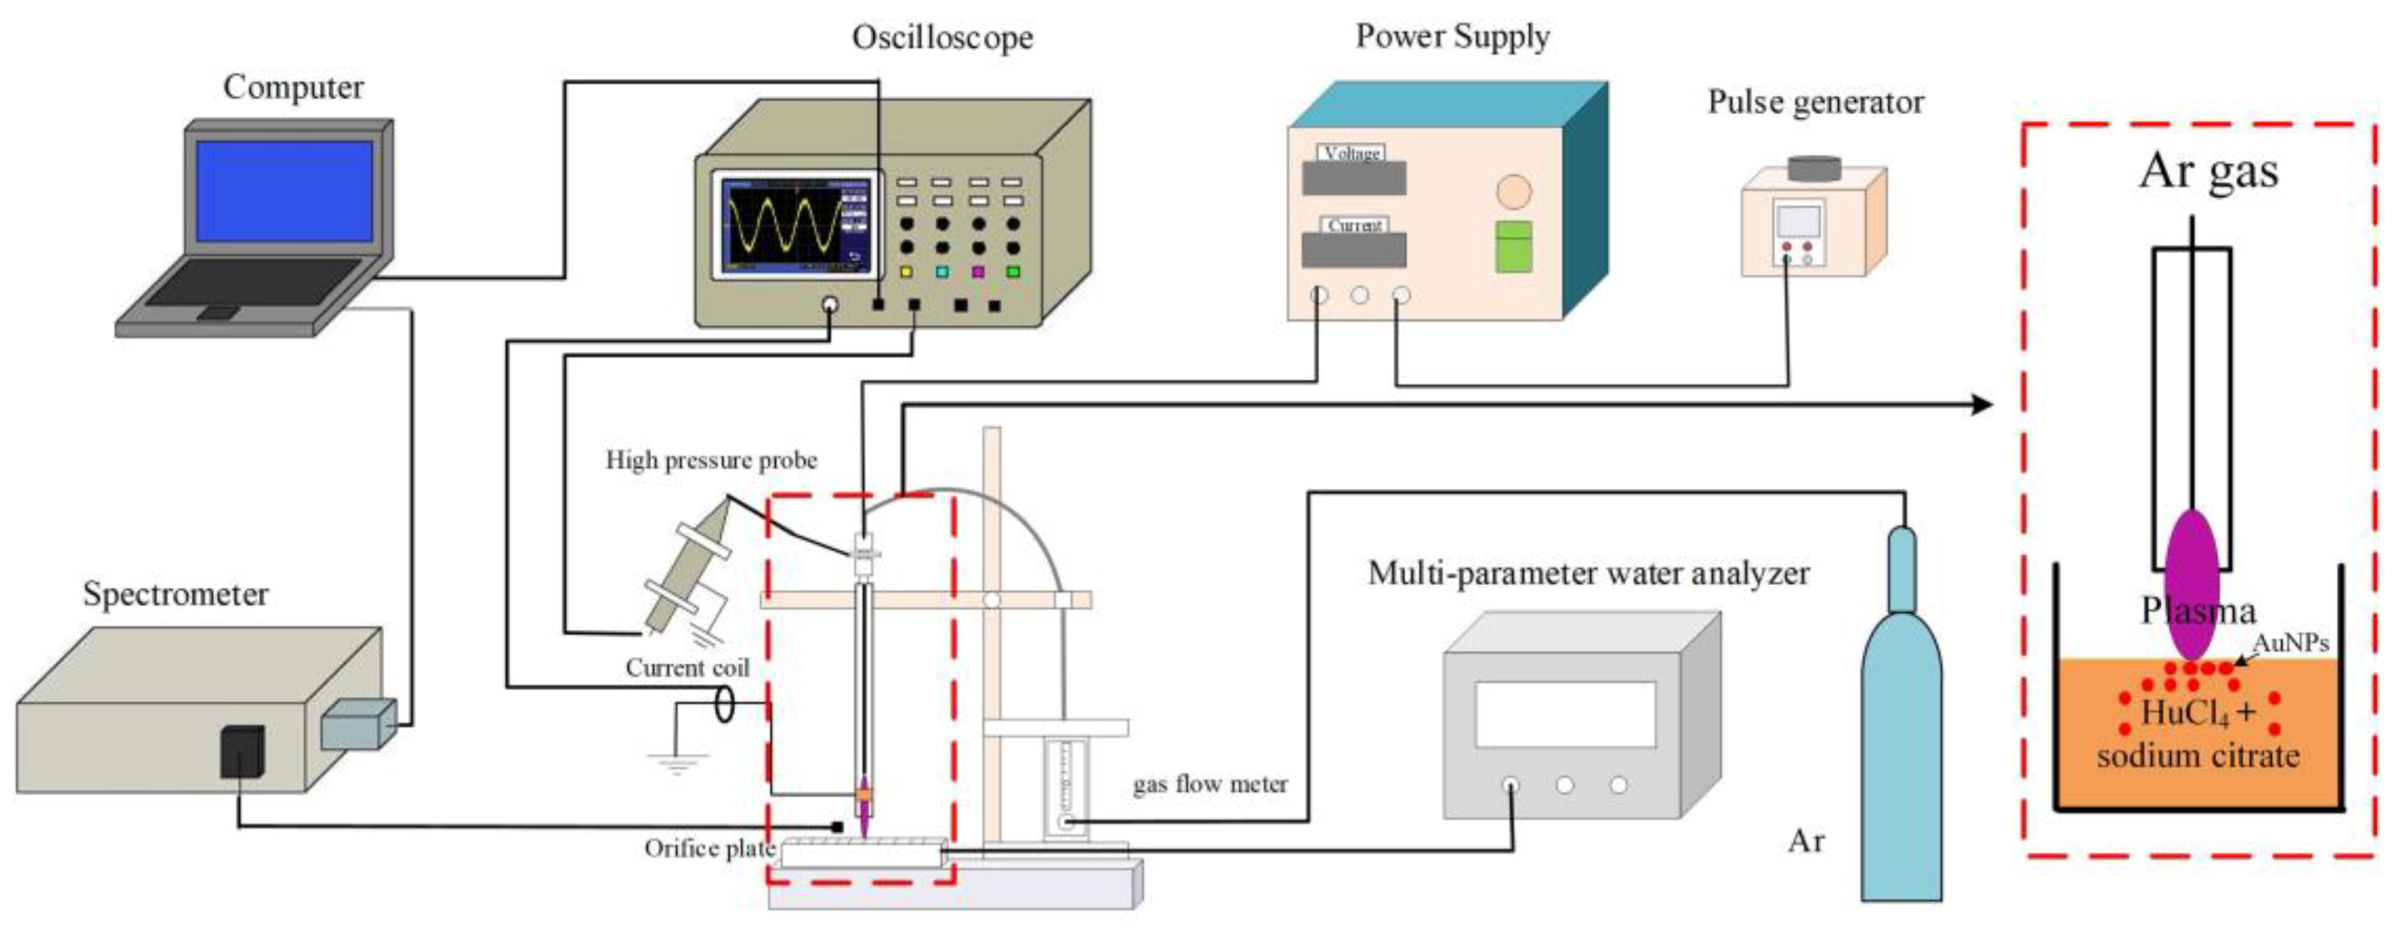
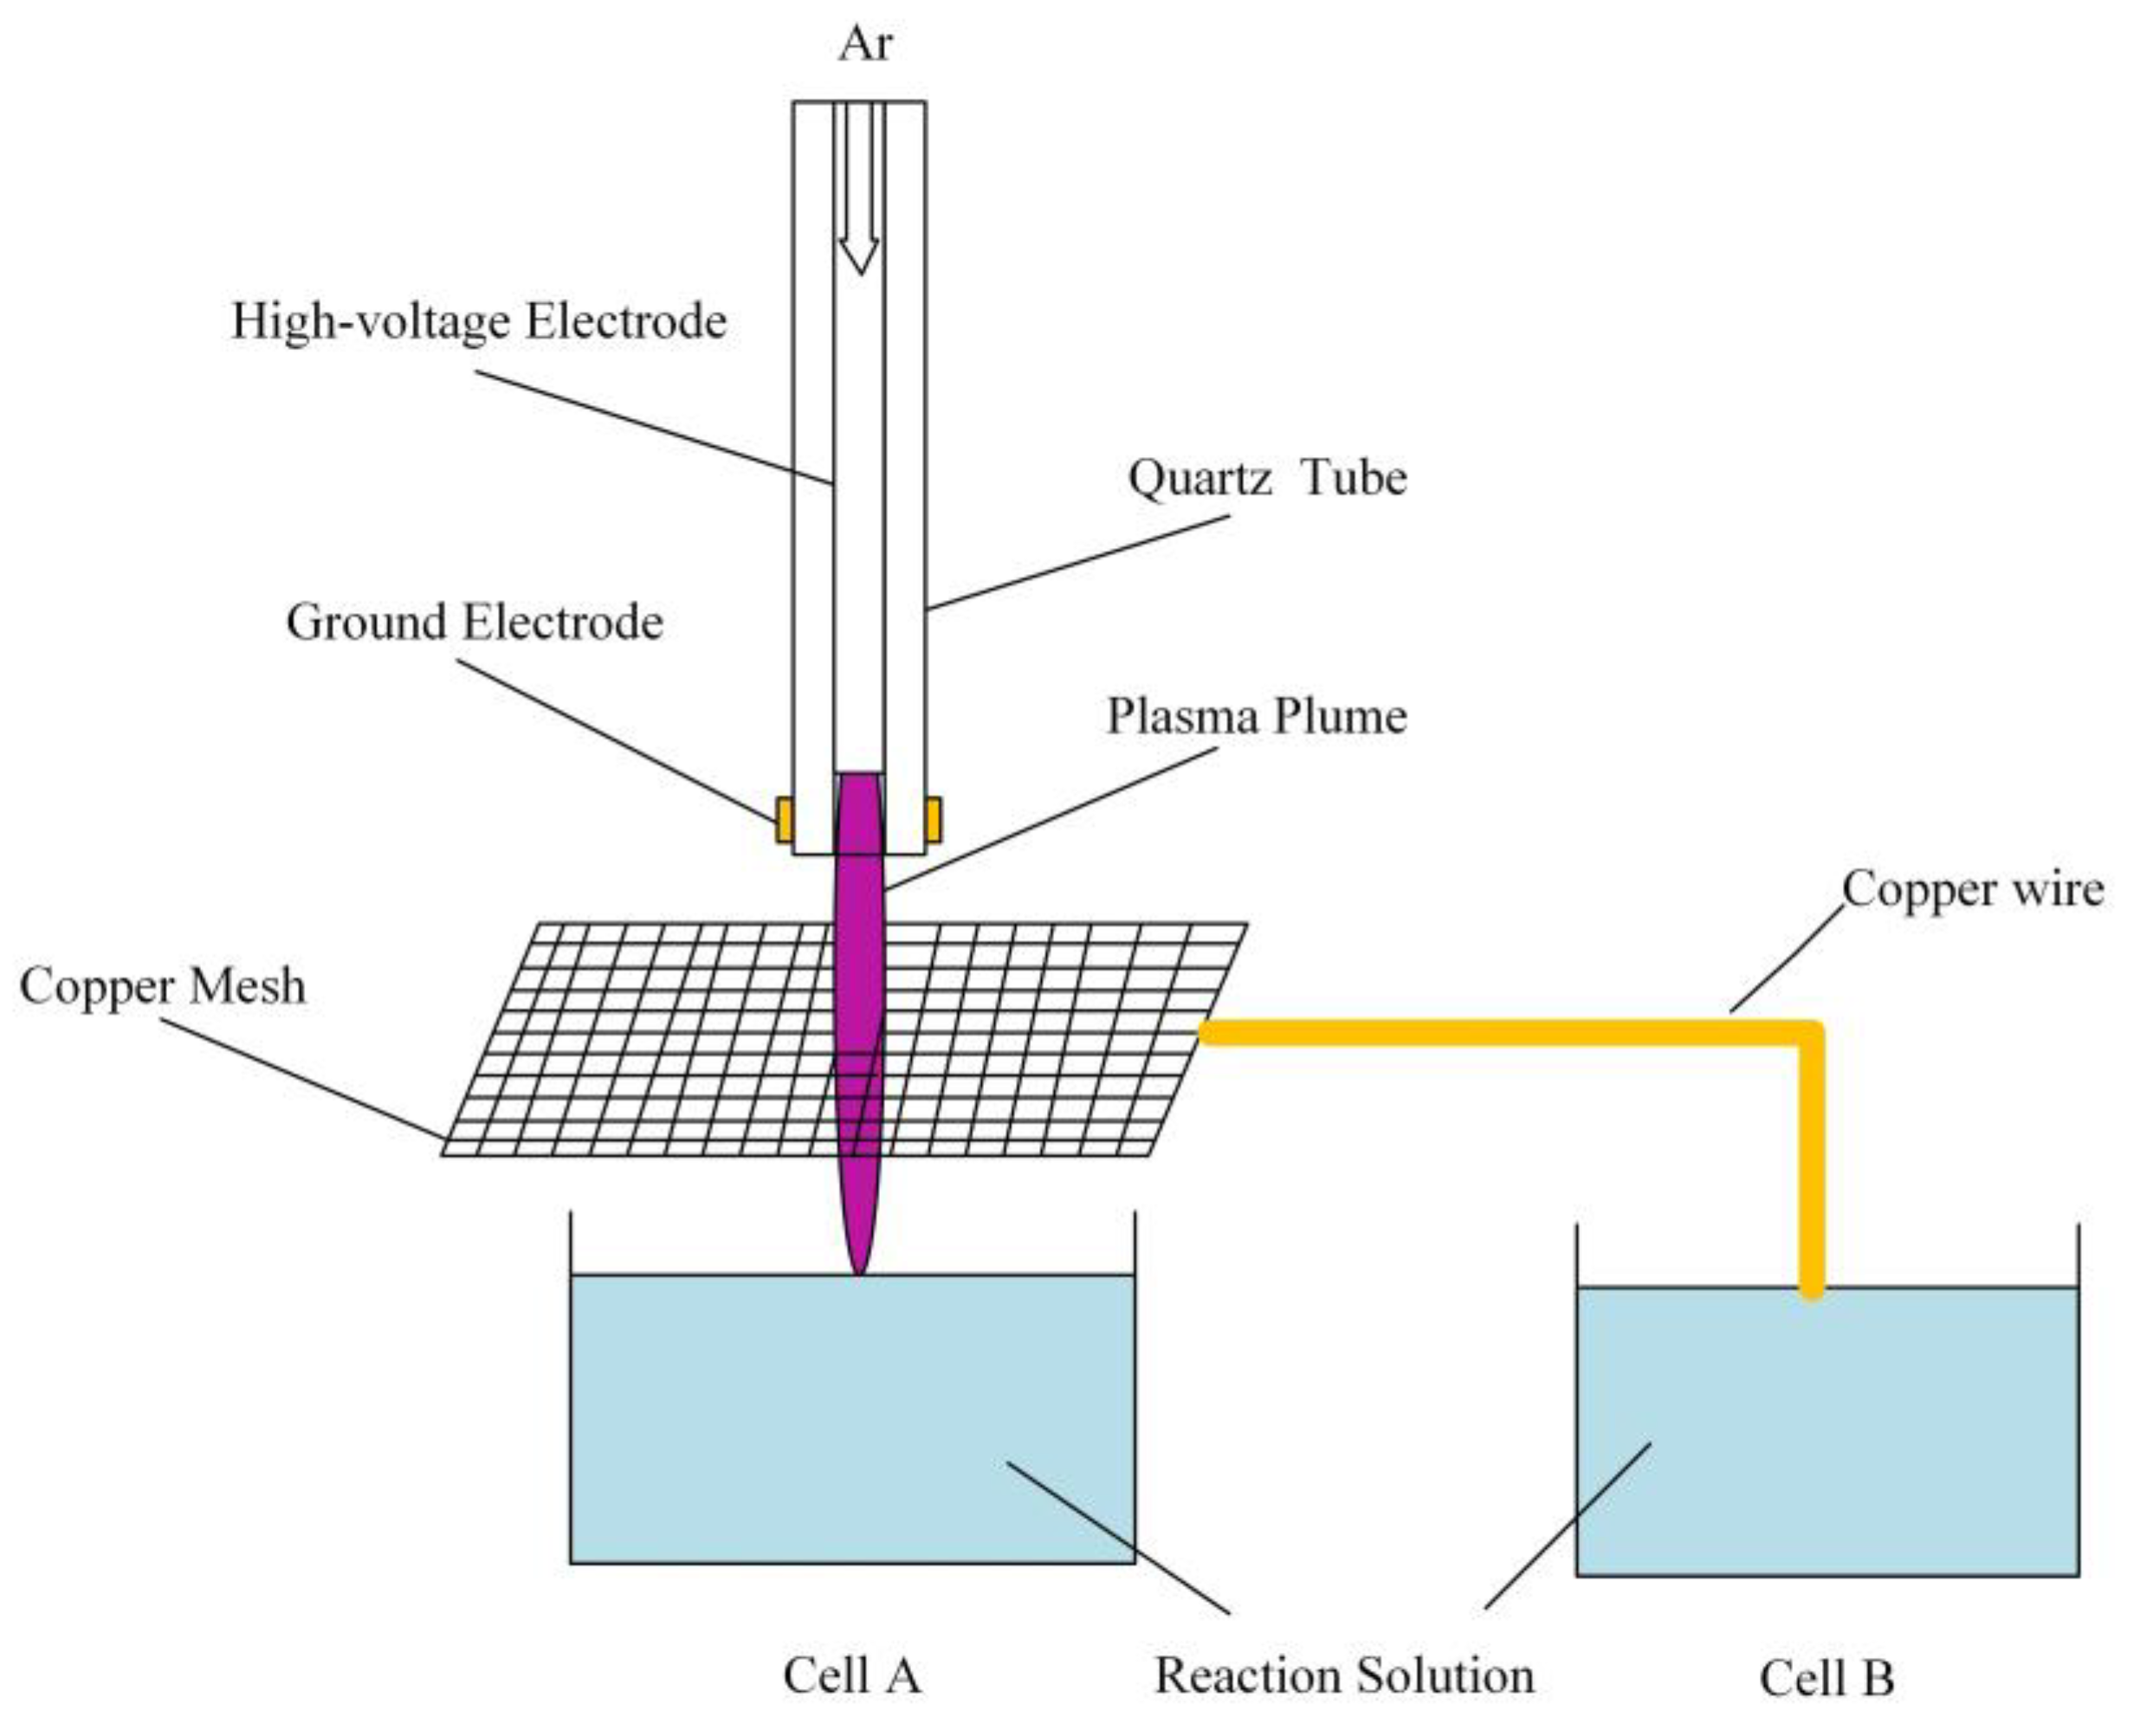
2. Materials and Methods
3. Results
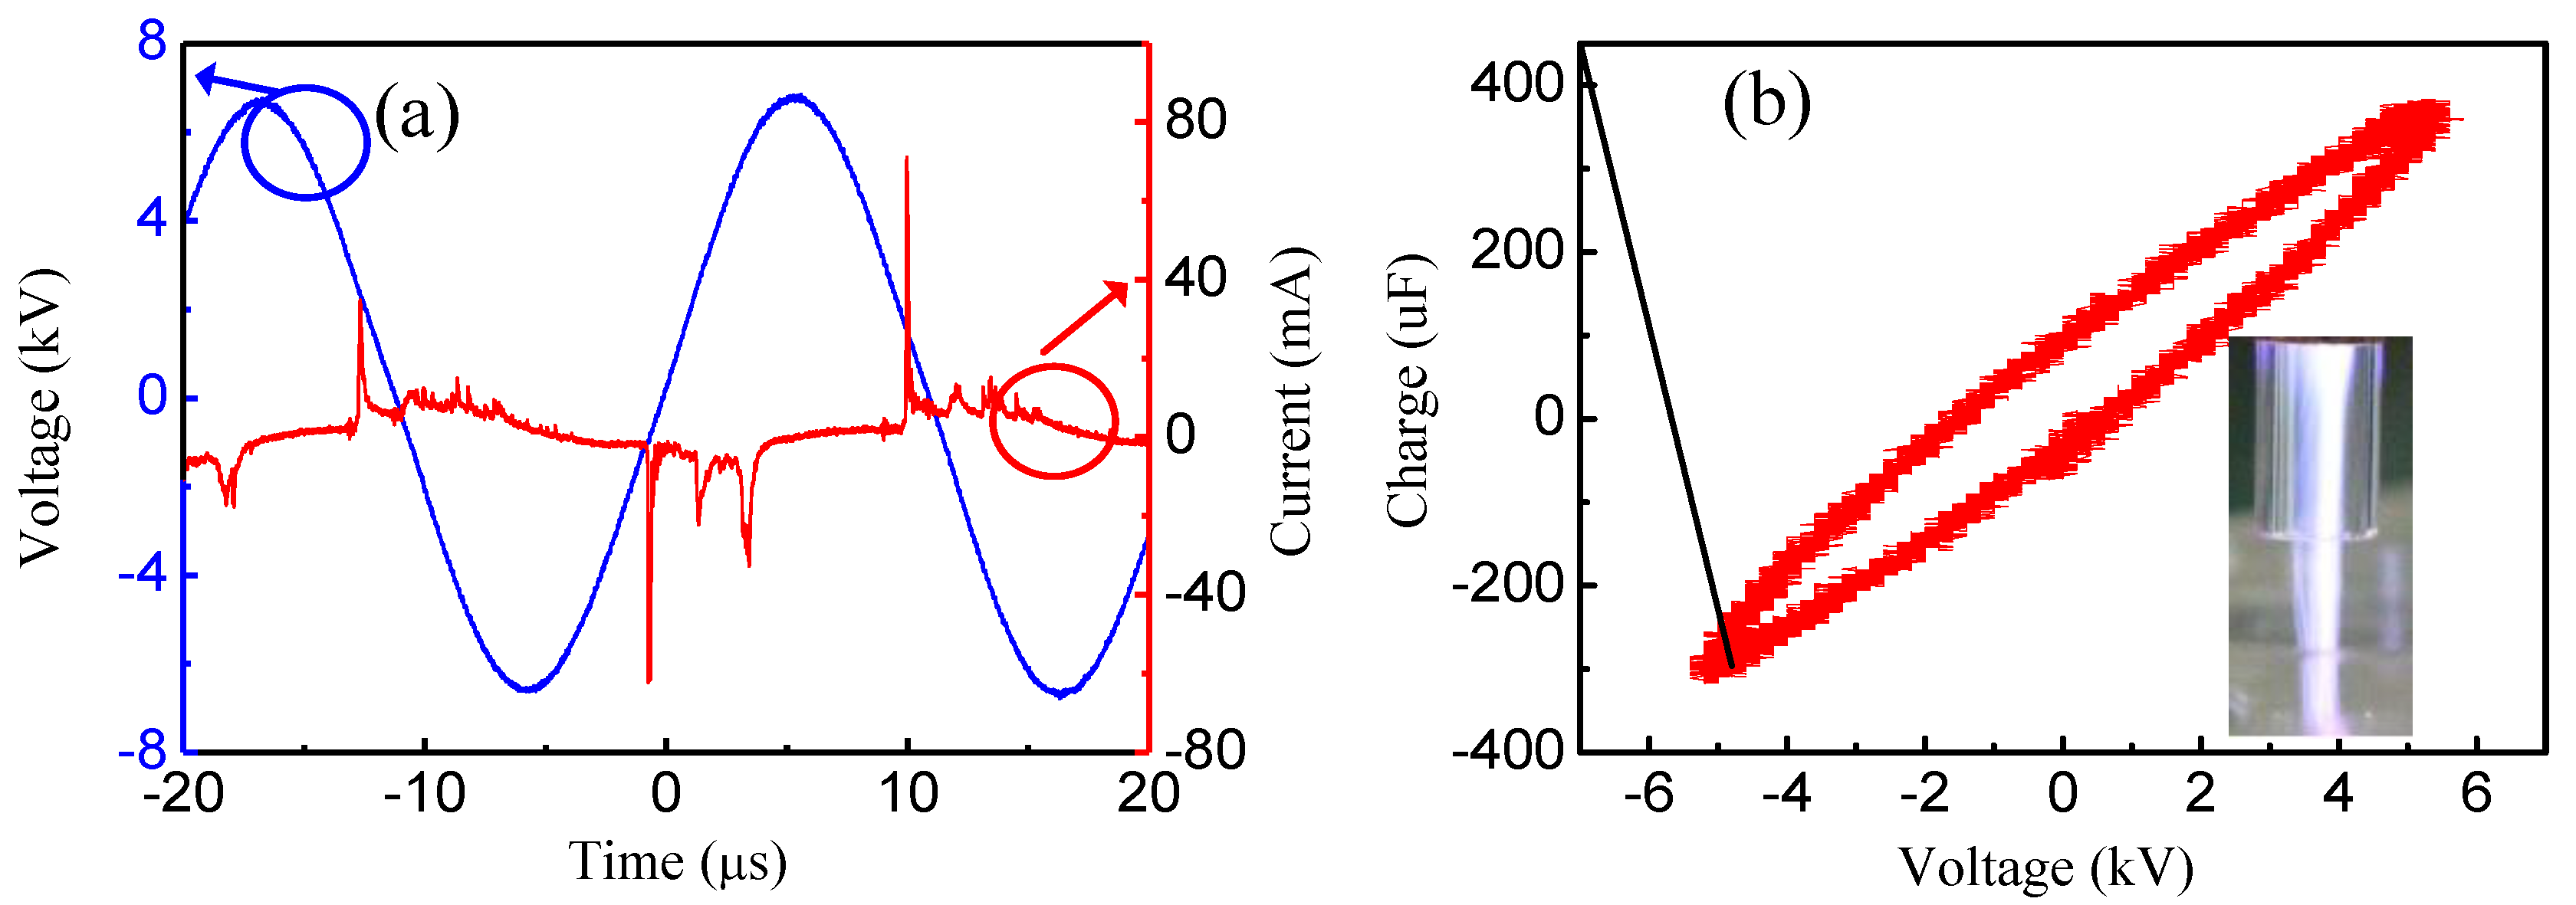
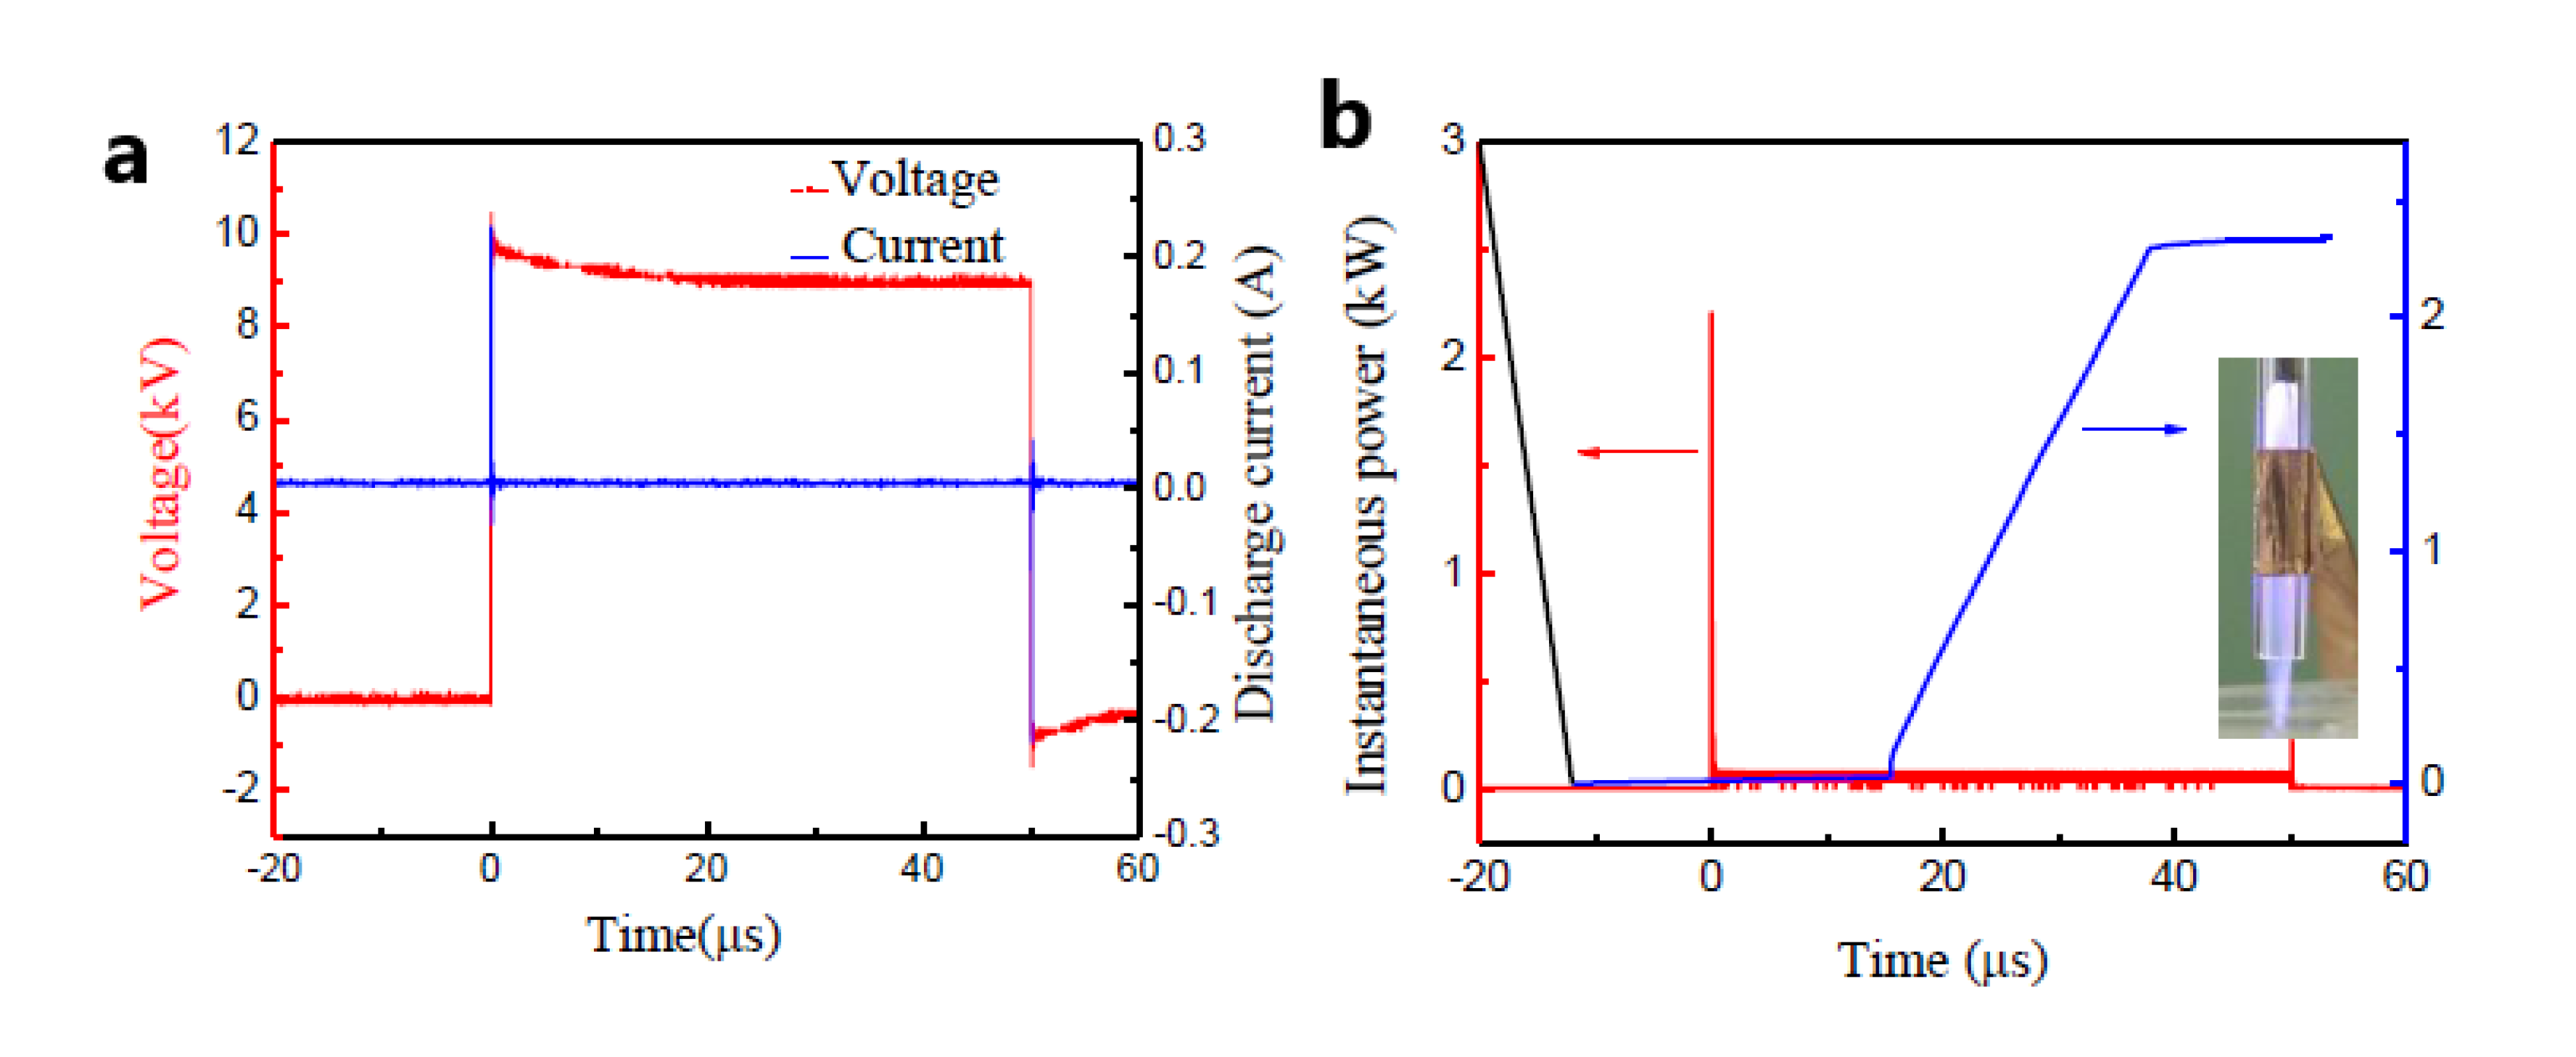
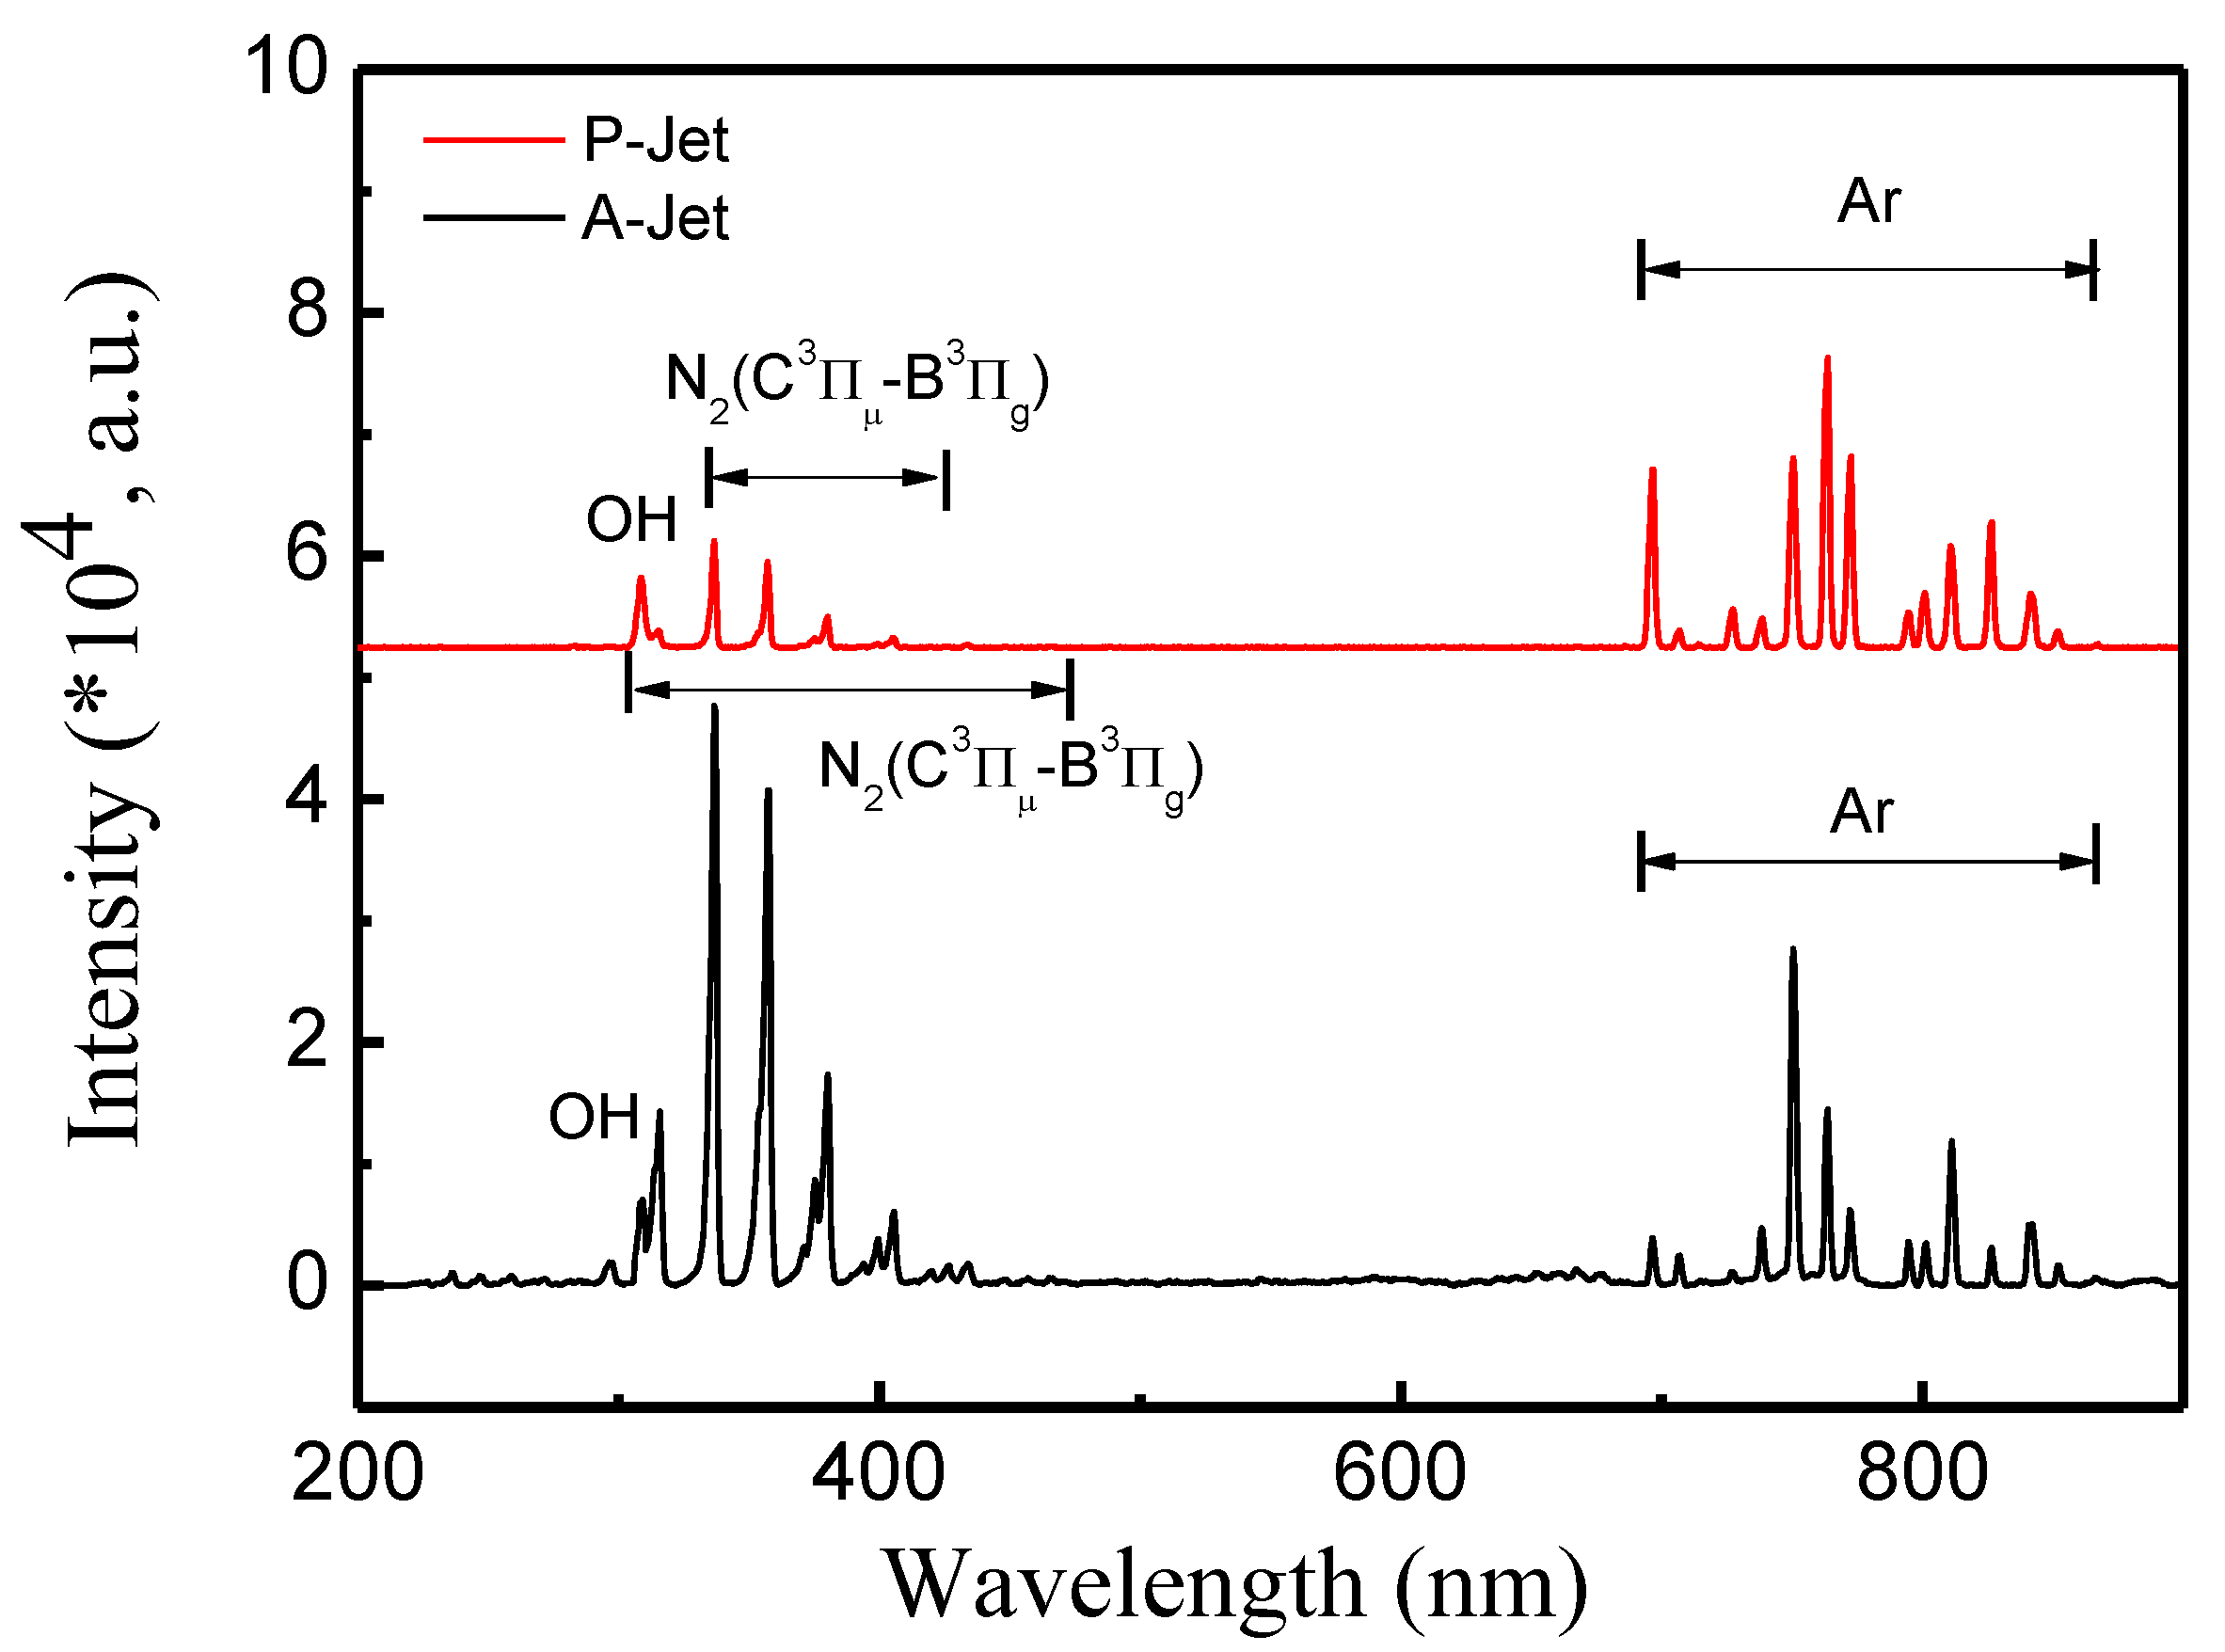
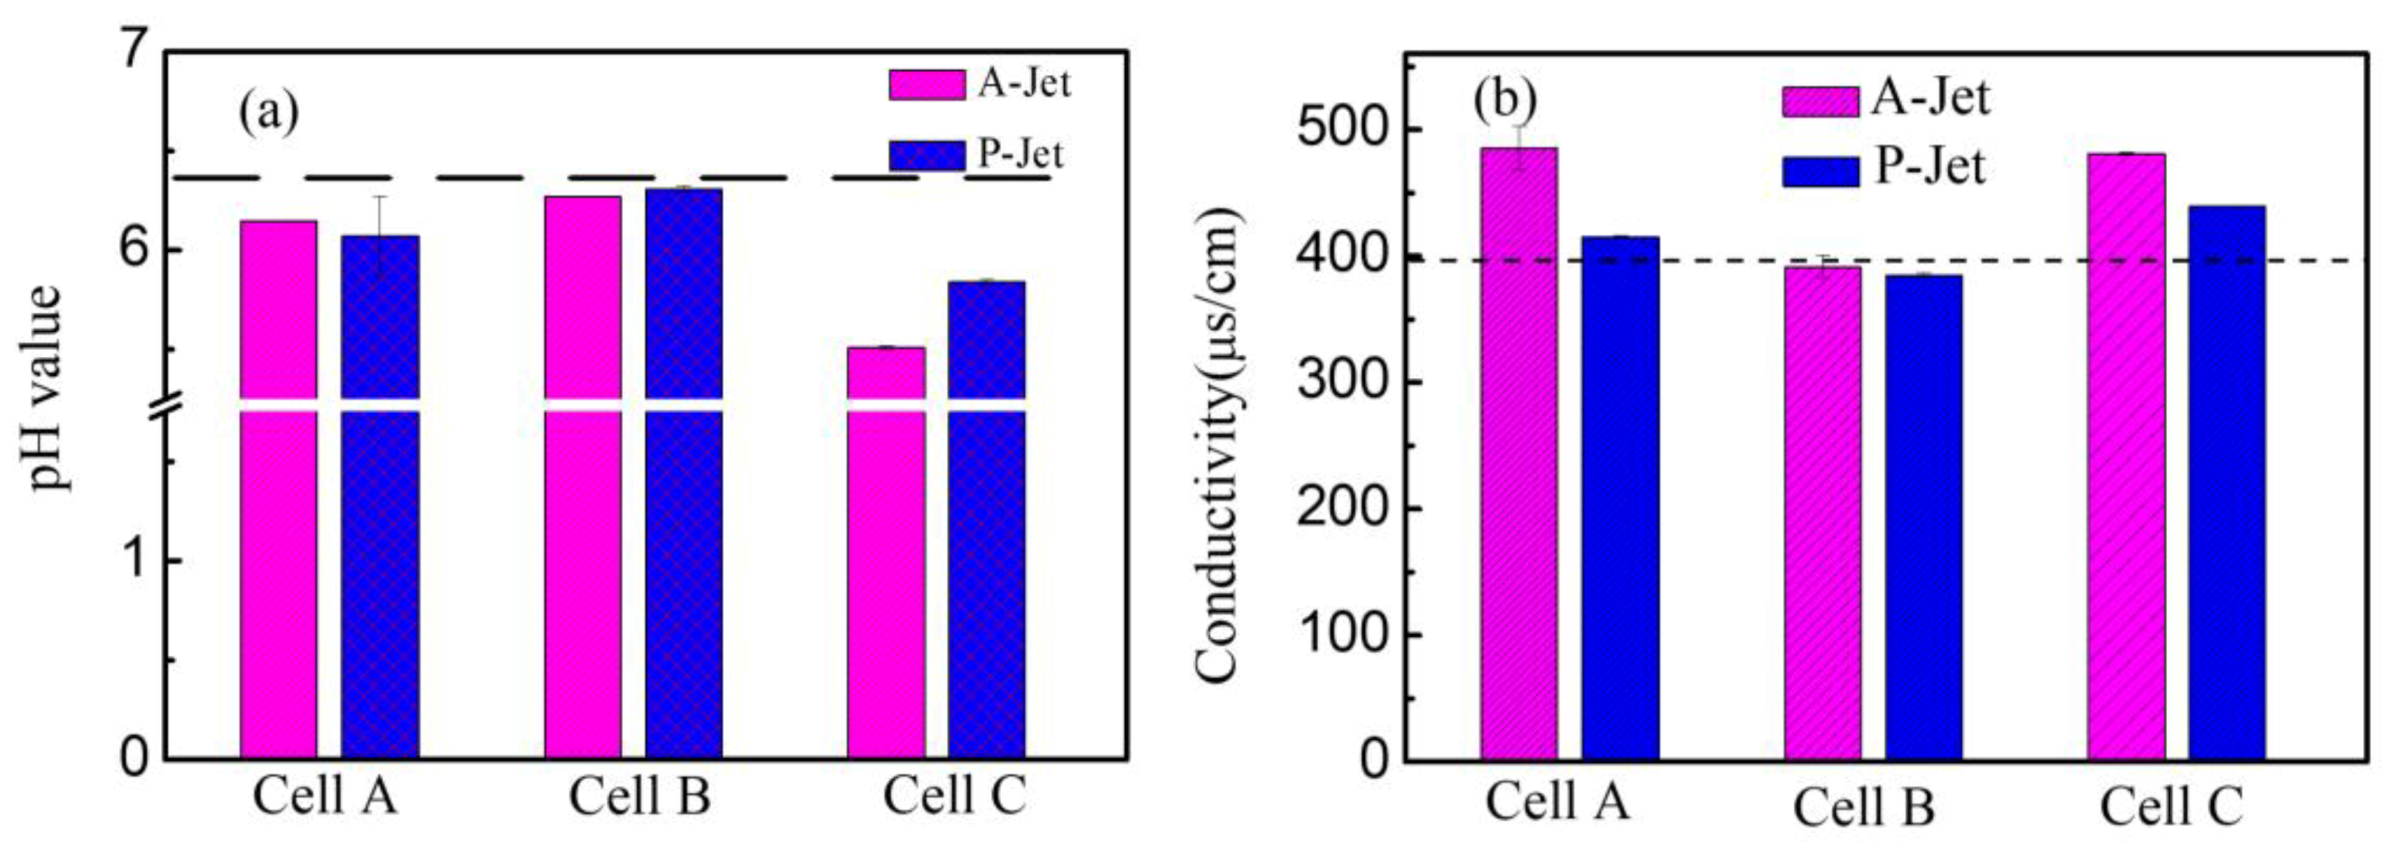
3.1. Characterization of A-Jet and P-Jet
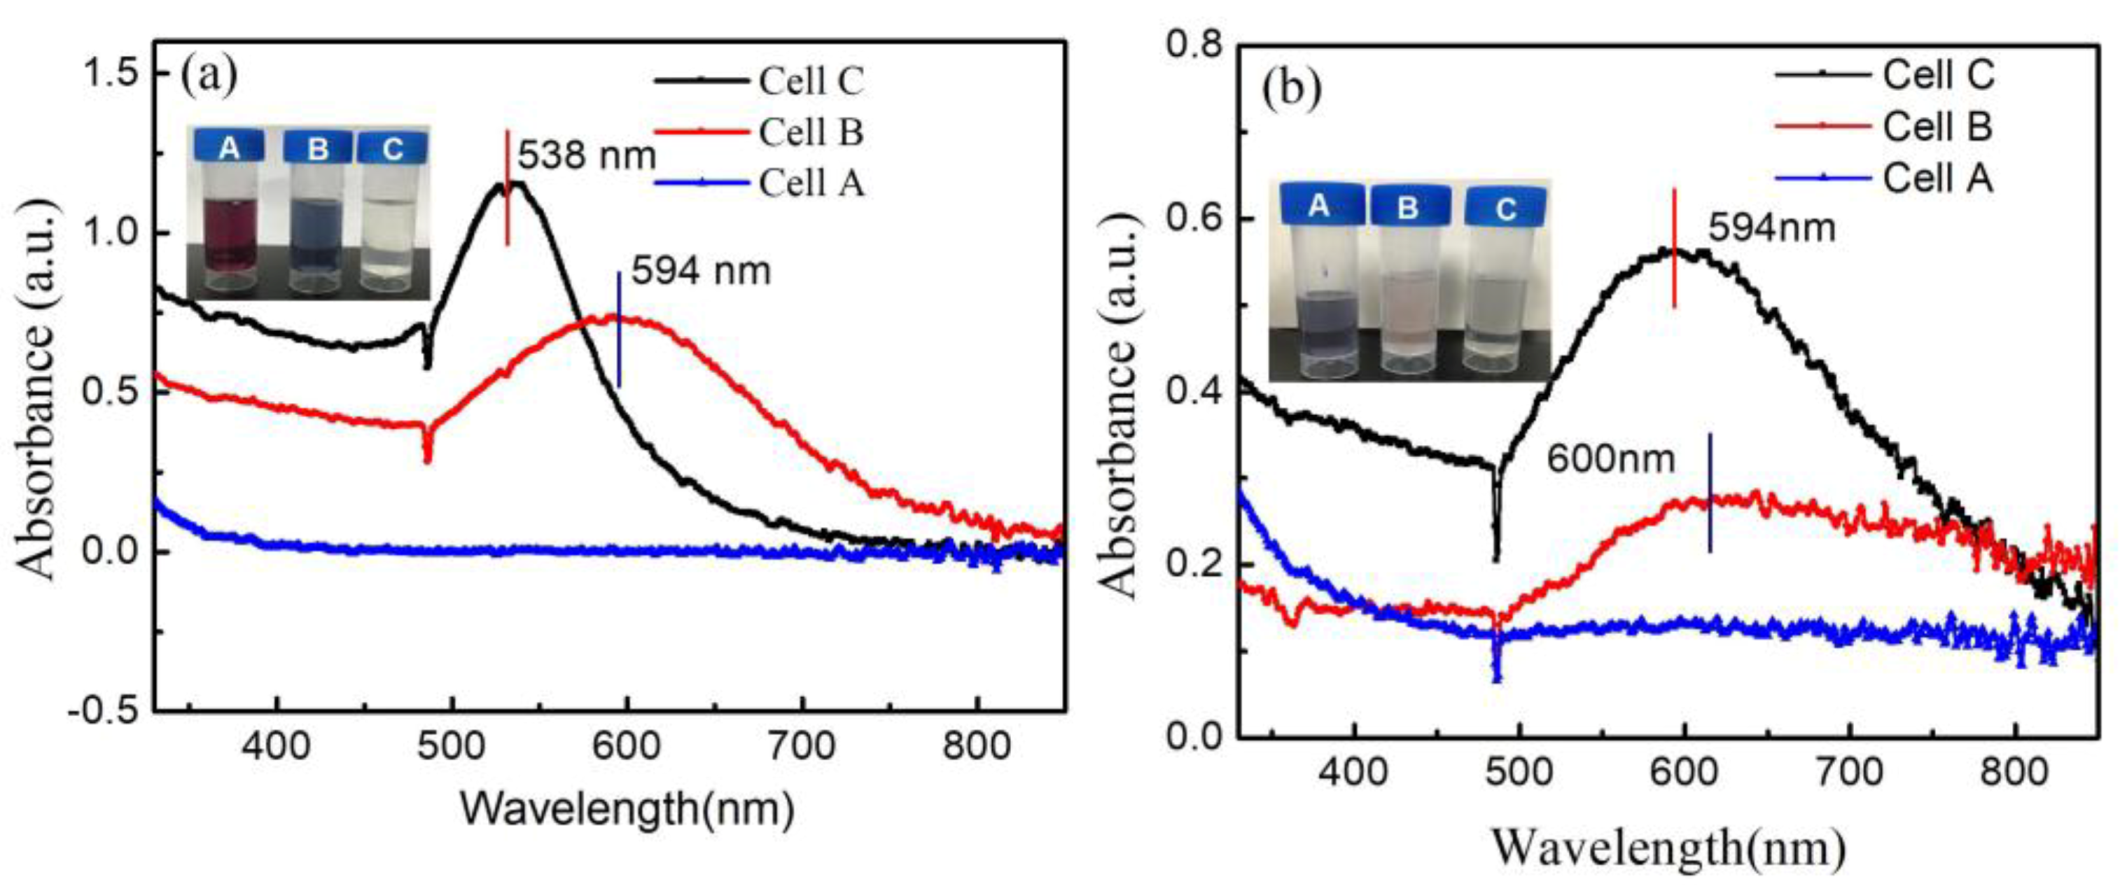
3.2. Synthesis of AuNP by A-Jet and P-Jet
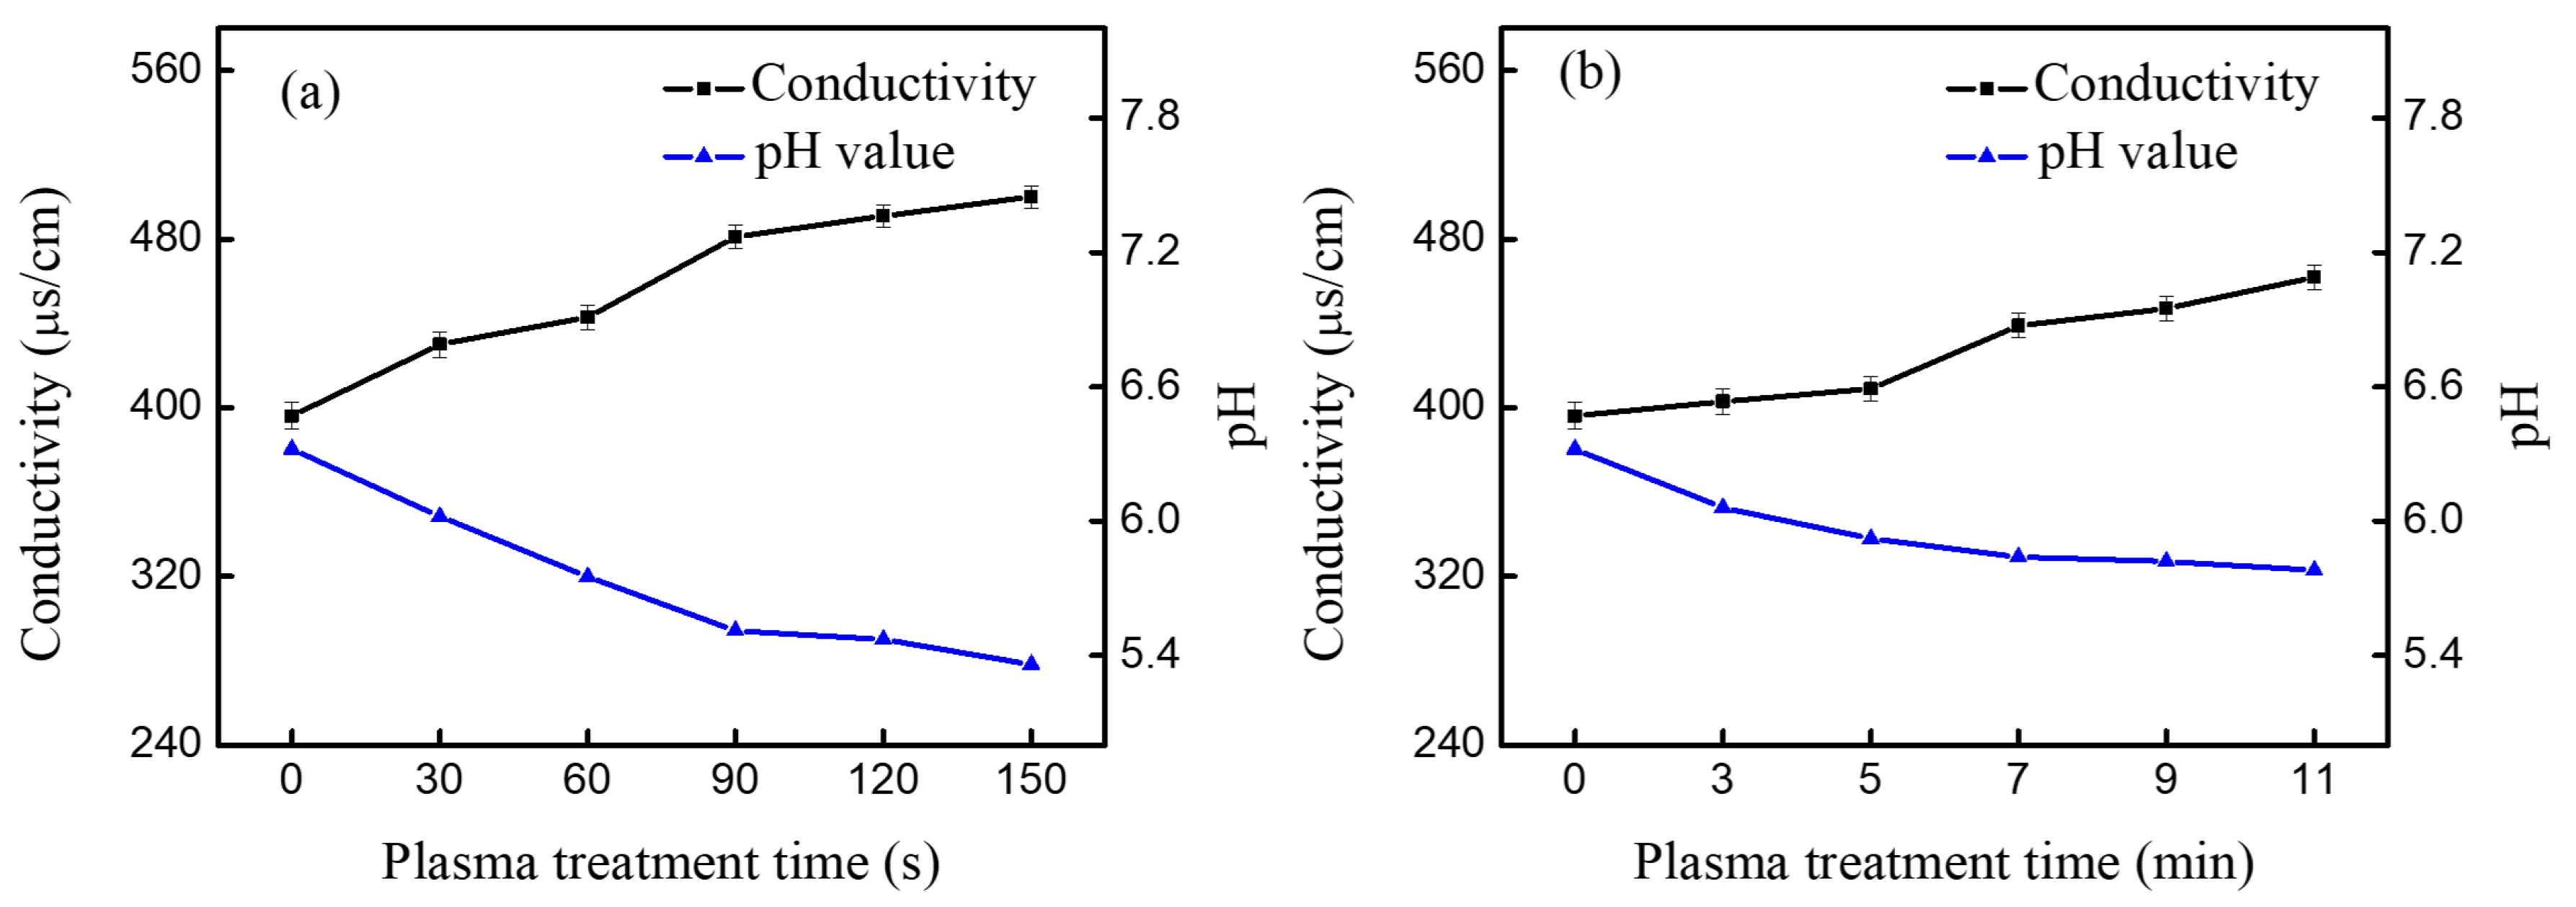
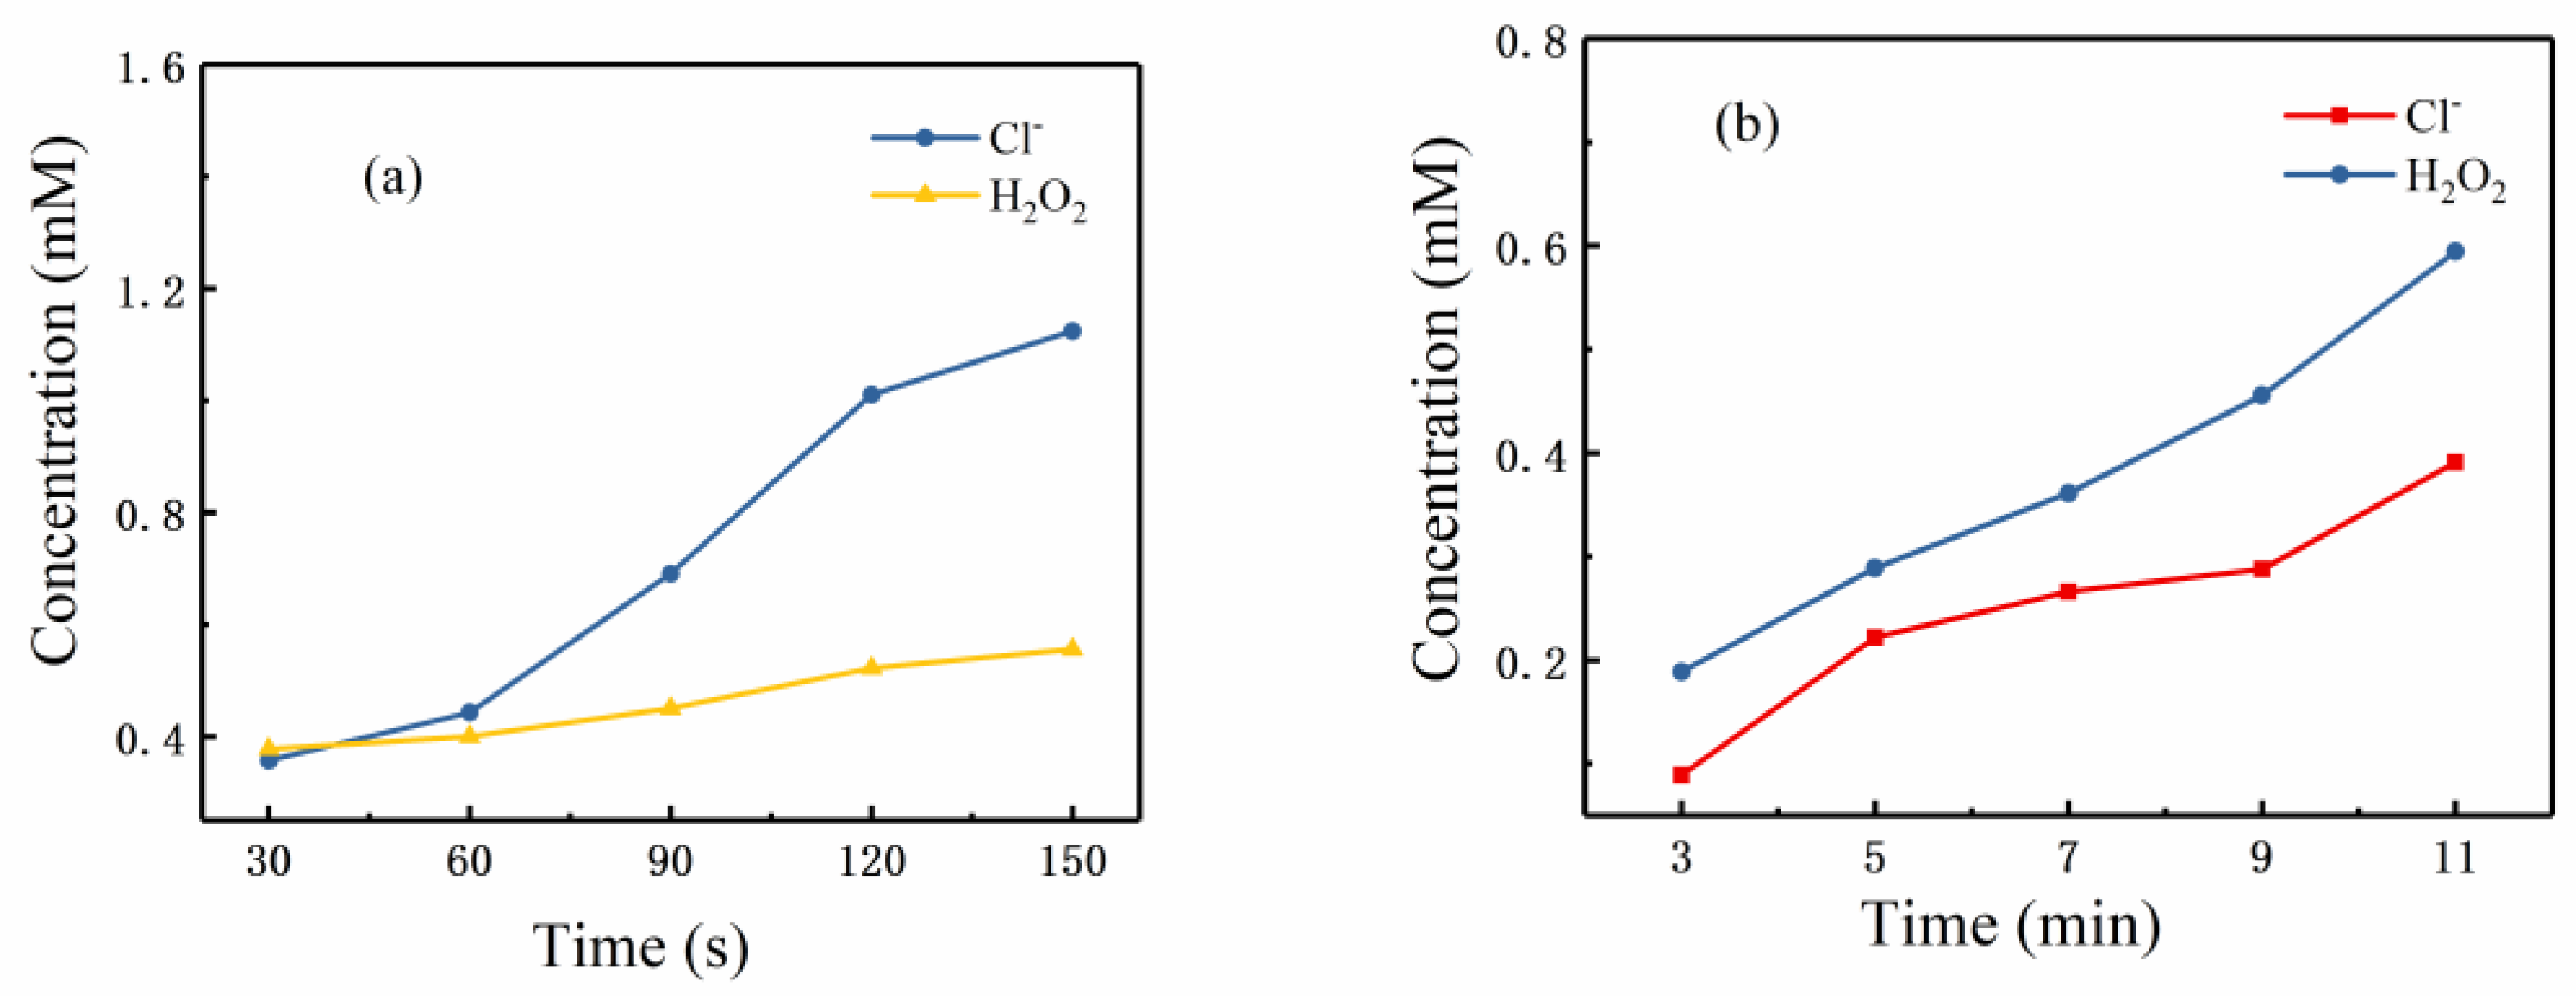
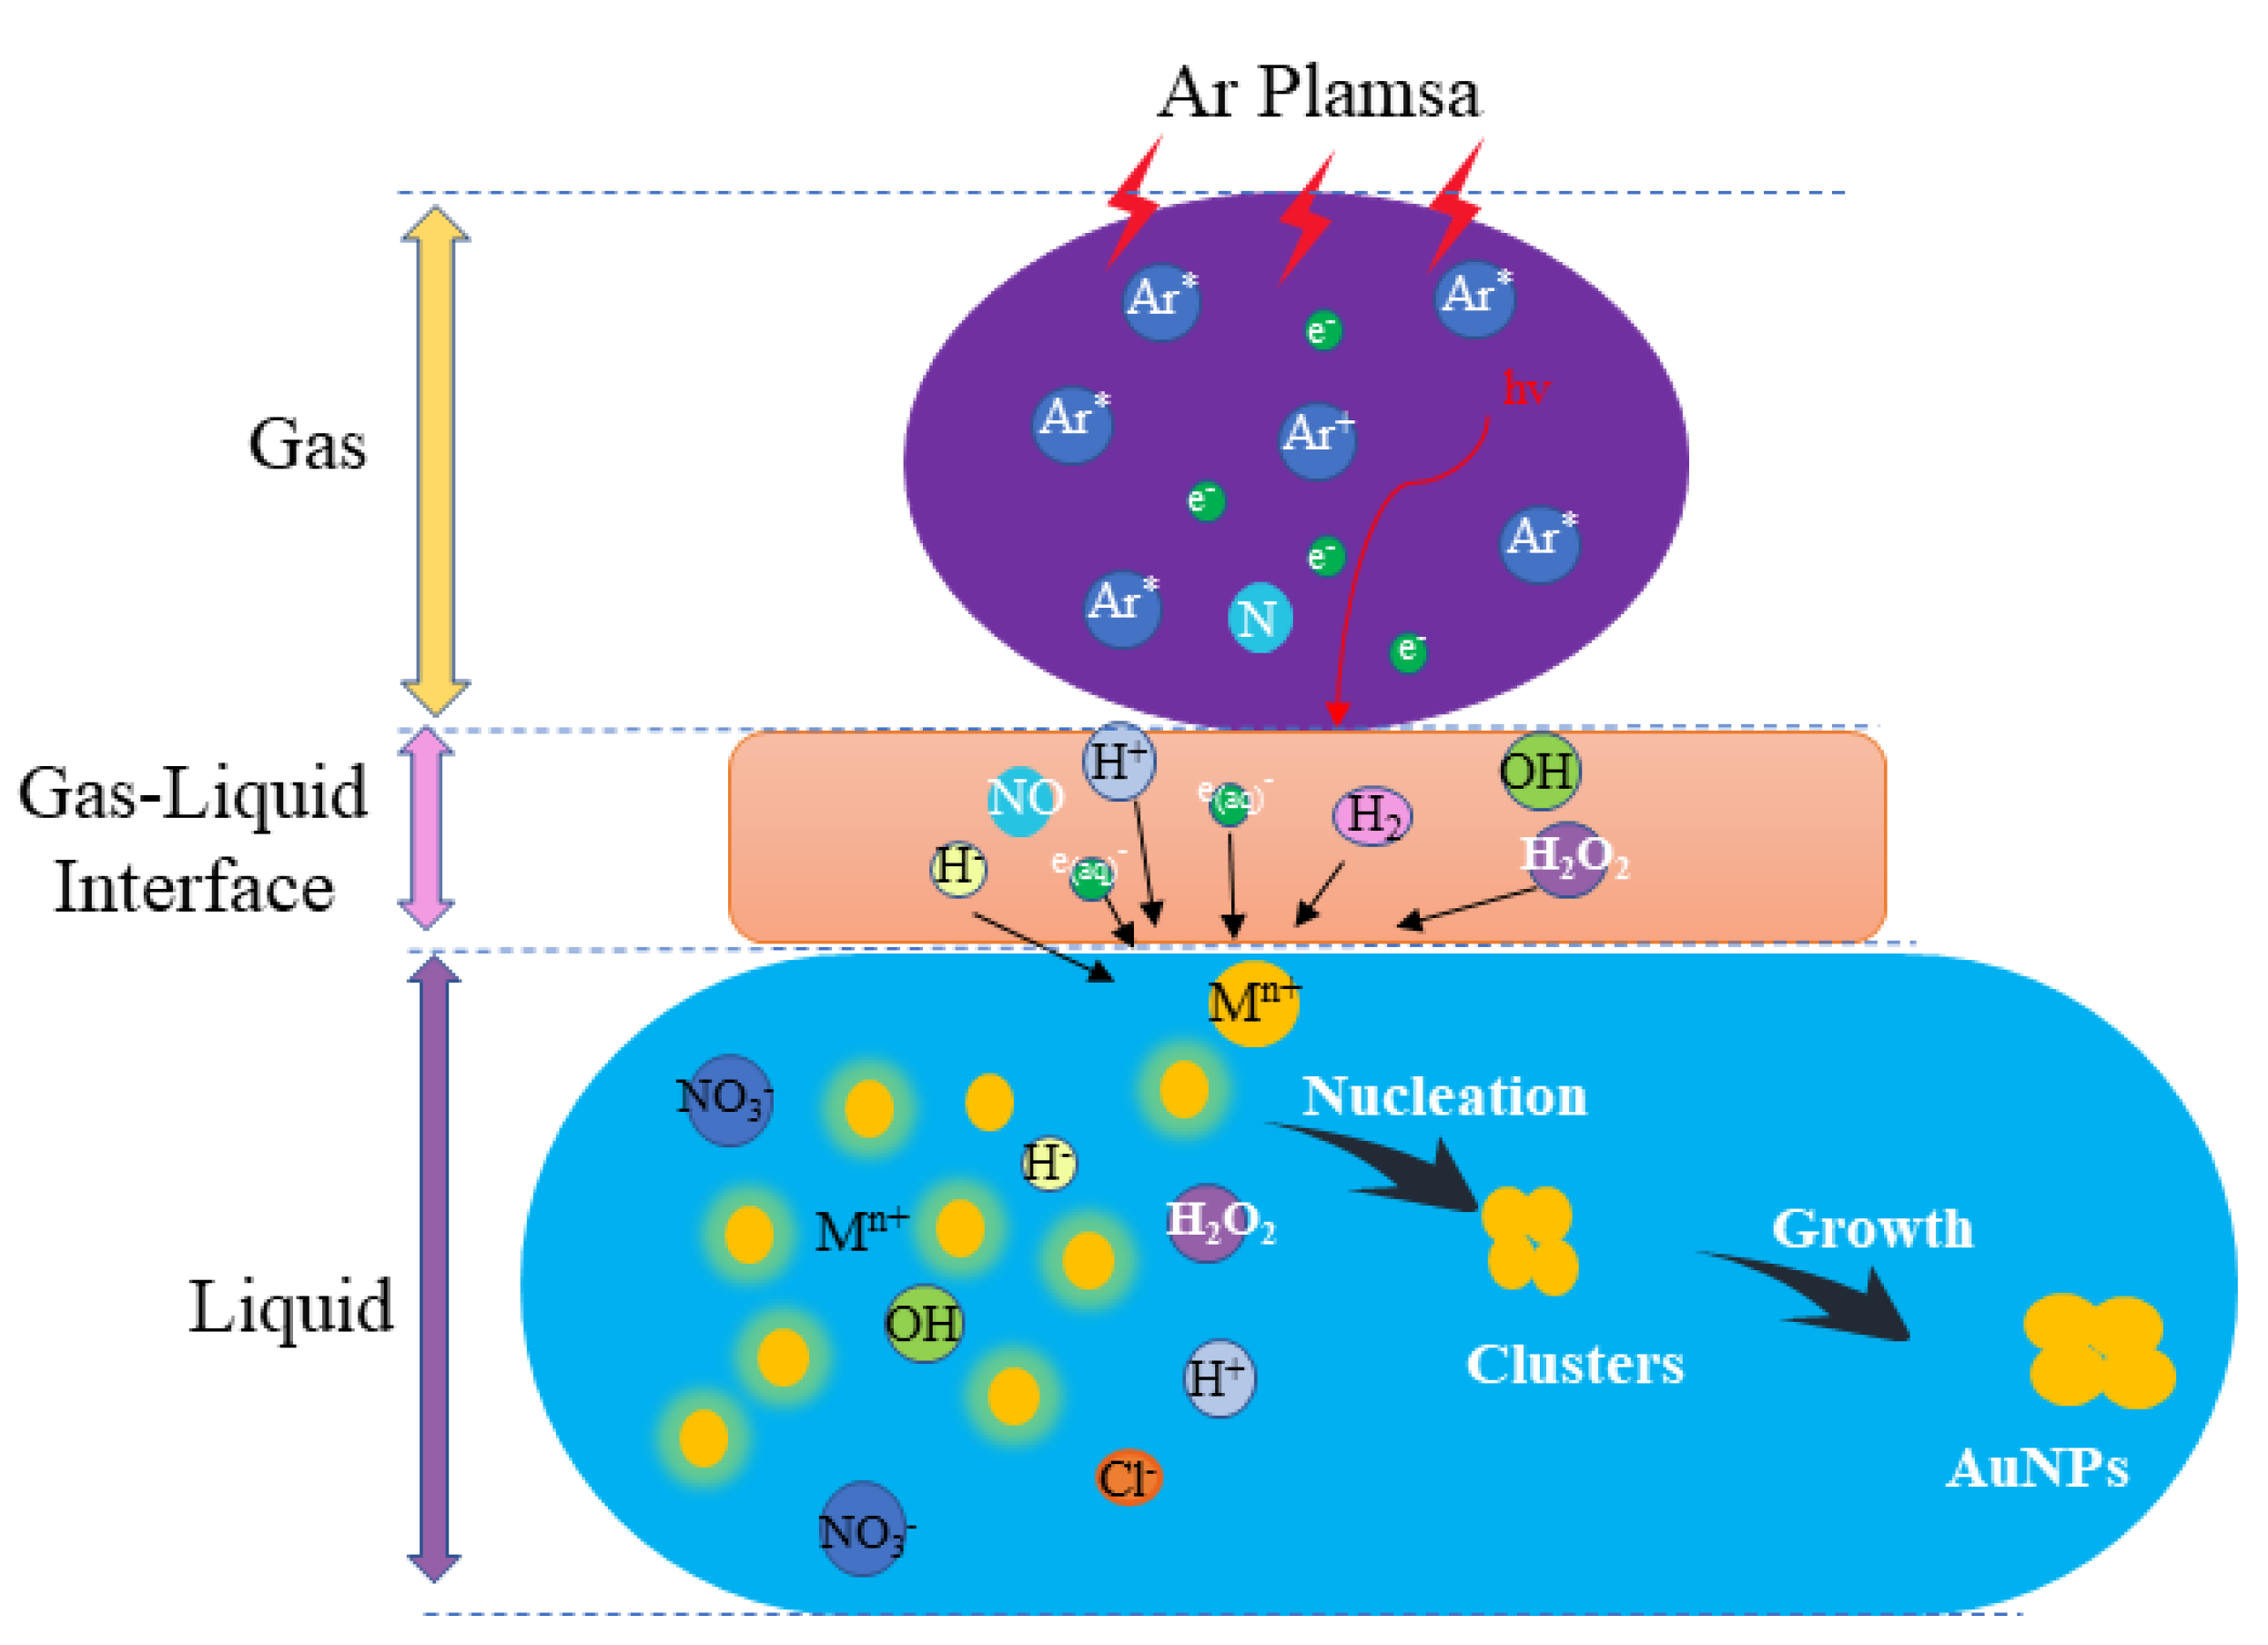
3.3. Plasma-Induced Chemistry Involved in A-Jet and P-Jet
3.4. The Role of Electrons and Neutral Species
4. Discussions
4.1. Chemical Reactions for AuNP Generation
4.2. The Effect of A-Jet and P-Jet
5. Conclusions
Author Contributions
Funding
Conflicts of Interest
References
- Ma, Y.; Huang, Z.; Li, S.; Zhao, C. Surface-Enhanced Raman Spectroscopy on Self-Assembled Au Nanoparticles Arrays for Pesticides Residues Multiplex Detection under Complex Environment. Nanomaterials 2019, 9, 426. [Google Scholar] [CrossRef] [PubMed]
- Mahan, M.M.; Doiron, A.L. Gold Nanoparticles as X-Ray, CT, and multimodal imaging contrast agents: Formulation, targeting, and methodology. Nanomaterials 2018, 15, 5837276. [Google Scholar] [CrossRef]
- Roya, B.; Hassan, H.; Hossein, F.; Farid, H.H.; Fatemeh, A.; Seyedeh, Z.M. In situ generation of the gold nanoparticles–bovine serum albumin (AuNPs–BSA) bioconjugated system using pulsed-laser ablation (PLA). Mater. Chem. Phys. 2016, 177, 360–370. [Google Scholar]
- Guo, Z.X.; Zhang, M.; Zhao, L.B.; Guo, S.S.; Zhao, X.Z. Generation of alginate gel particles with AuNPs layers by polydimethylsiloxan template. Biomicrofluidics 2011, 5, 026502. [Google Scholar] [CrossRef] [PubMed]
- Peng, C.F.; Duan, X.H.; Xie, Z.J.; Liu, C.L. Shape-controlled generation of gold nanoparticles assisted by dual-molecules: The development of hydrogen peroxide and oxidase-based biosensors. J. Nanomater. 2014, 7, 576082. [Google Scholar] [CrossRef]
- Chen, Q.; Li, J.; Li, Y. A review of plasma–liquid interactions for nanomaterial synthesis. J. Phys. D 2015, 48, 424005. [Google Scholar] [CrossRef]
- Wang, S.; Qian, K.; Bi, X.Z.; Huang, W. Influence of Speciation of Aqueous HAuCl4 on the synthesis, structure, and property of Au colloids. J. Phys. Chem. C 2009, 113, 6505–6510. [Google Scholar] [CrossRef]
- Genki, S.; Tomohiro, A. Nanomaterial synthesis using plasma generation in liquid. J. Nanomater. 2015, 2015, 123696. [Google Scholar]
- Wang, R.; Zuo, S.; Zhu, W.; Zhang, J.; Fang, J. Rapid synthesis of aqueous-phase magnetite nanoparticles by atmospheric pressure non-thermal microplasma and their application in magnetic resonance imaging. Plasma Process. Polym. 2014, 11, 448–454. [Google Scholar] [CrossRef]
- Patel, J.; Nemcova, L.; Maguire, P.; Graham, W.G.; Mariotti, D. Synthesis of surfactant-free electrostatically stabilized gold nanoparticles by plasma-induced liquid chemistry. Nanotechnology 2013, 24, 245604. [Google Scholar] [CrossRef]
- Hattori, Y.; Nomura, S.; Mukasa, S.; Toyota, H.; Inoue, T.; Usui, T. Synthesis of tungsten oxide, silver, and gold nanoparticles by radio frequency plasma in water. J. Alloy. Compd. 2013, 578, 148–152. [Google Scholar] [CrossRef]
- Jiang, N.; Hu, J.; Li, J.; Shang, K.F.; Lu, N.; Wu, Y. Plasma-catalytic degradation of benzene over Ag–Ce bimetallic oxide catalysts using hybrid surface/packed-bed discharge plasmas. Appl. Catal. B 2016, 184, 355–3635. [Google Scholar] [CrossRef]
- Maguire, P.; Rutherford, D.; Montero, M.M.; Mahony, C.; Kelsey, C.; Weedie, M.T.; Martin, F.P.; Mcquid, H.; Diver, D.; Mariotti, D. Continuous In-Flight Synthesis for On-Demand Delivery of Ligand-Free Colloidal Gold Nanoparticles. Nano Lett. 2017, 17, 1336–1343. [Google Scholar] [CrossRef] [PubMed]
- Meiss, S.A.; Rohnke, M.; Kienle, L.; Zein El Abedin, S.; Endres, F.; Janek, J. Employing plasmas as gaseous electrodes at the free surface of ionic liquids: Deposition of nanocrystalline silver particles. J. Chem. Phys. Chem. 2007, 8, 50–53. [Google Scholar] [CrossRef]
- Kaneko, T.; Baba, K.; Hatakeyama, R. Gas–liquid interfacial plasmas: Basic properties and applications to nanomaterial synthesis. Plasma Phys. Controll. Fusion 2009, 51, 124011. [Google Scholar] [CrossRef]
- Wu, S.; Wu, F.; Liu, C.; Liu, X.; Chen, Y.; Shao, T.; Zhang, C. The effects of the tube diameter on the discharge ignition and the plasma properties of atmospheric-pressure micro plasma confined inside capillary. Plasma Process. Polym. 2019, 16, 1800176. [Google Scholar] [CrossRef]
- Wang, Y.Q.; Yu, F.; Zhu, M.Y.; Ma, C.H.; Zhao, D.; Wang, C.; Zhou, A.M.; Dai, B.; Ji, J.Y.; Guo, X.H. N-Doping of plasma exfoliated graphene oxide via dielectric barrier discharge plasma treatment for the oxygen reduction reaction. J. Mater. Chem. A 2018, 6, 2011–2017. [Google Scholar] [CrossRef]
- Di, L.B.; Zhan, Z.B.; Zhang, X.L.; Qi, B.; Xu, W.J. Atmospheric-Pressure DBD Cold Plasma for Preparation of High Active Au/P25 Catalysts for Low-Temperature CO Oxidation. Plasma Sci. Technol. 2016, 18, 544–548. [Google Scholar] [CrossRef]
- Wang, R.; Zhang, C.; Shen, Y.; Zhu, W.; Yan, P.; Shao, T.; Babaeva, N.Y.; Naidis, G.V. Temporal and spatial profiles of emission intensities in atmospheric pressure helium plasma jet driven by microsecond pulse: Experiment and simulation. J. Appl. Phys. 2015, 118, 123303. [Google Scholar]
- Wang, R.; Zhang, K.; Shen, Y.; Zhang, C.; Zhu, W.; Shao, T. Effect of pulse polarity on the temporal and spatial emission of an atmospheric pressure helium plasma jet. Plasma Sources Sci. Technol. 2016, 25, 015020. [Google Scholar] [CrossRef]
- Konesky, G. Dwell time considerations for large area cold plasma decontamination. Proc. SPIE 2009, 7304, 73040N–73041N. [Google Scholar]
- Wang, R.; Gao, Y.; Zhang, C.; Yan, P.; Shao, T. Dynamics of plasma bullets in a microsecond-pulse driven atmospheric pressure He plasma jet. IEEE Trans. Plasma Sci. 2016, 4, 393–397. [Google Scholar] [CrossRef]
- Patrick, V.; Anton, N.; Annemie, B.; Christophe, L. Study of an AC dielectric barrier single micro-discharge filament over a water film. Sci. Rep. 2018, 8, 10919. [Google Scholar]
- Shao, T.; Wang, R.; Zhang, C.; Yan, P. Atmospheric-pressure pulsed discharges and plasmas: Mechanism, characteristics and application. High Volt. 2018, 3, 14–20. [Google Scholar] [CrossRef]
- Wang, R.; Zuo, S.; Wu, D.; Zhang, J.; Zhu, W.; Becker, K.H.; Fang, J. Micro plasma-assisted synthesis of colloidal gold nanoparticles and their use in the detection of cardiac troponin I (cTn-I). Plasma Process. Polym. 2015, 12, 380–391. [Google Scholar] [CrossRef]
- Wang, R.; Sun, H.; Zhu, W.; Zhang, C.; Zhang, S.; Shao, T. Uniformity optimization and dynamic studies of plasma jet array interaction in argon. Phys. Plasmas 2017, 24, 093507. [Google Scholar] [CrossRef]
- Liu, Y.; Zhang, H.; Sun, J.; Liu, J.; Shen, X.; Zhan, J.; Zhang, A.; Ogniger, S.; Cavadias, S.; Li, P. Degradation of aniline in aqueous solution using non-thermal plasma generated in microbubbles. Chem. Eng. J. 2018, 345, 679–687. [Google Scholar] [CrossRef]
- Dang, T.H.; Denat, A.; Lesaint, O.; Teissedre, G. Degradation of organic molecules by streamer discharges in water: Coupled electrical and chemical measurements. Plasma Sources Sci. Technol. 2008, 17, 024013. [Google Scholar] [CrossRef][Green Version]
- Saito, N.; Hieda, J.; Takai, O. Synthesis process of gold nanoparticles in solution plasma. Thin Solid Film. 2009, 518, 912–917. [Google Scholar] [CrossRef]
- Hart, E.J.; Anbar, M. The Hydrated Electron; Wiley: New York, NY, USA, 1970; Volume 276, p. 5126764. [Google Scholar]
- Chen, Z.; Liu, D.; Xu, H.; Xia, W.; Liu, Z.; Xu, D.; Rong, M.; Kong, G. Decoupling analysis of the production mechanism of aqueous reactive species induced by a helium plasma jet. Plasma Sources Sci. Technol. 2019, 28, 025001. [Google Scholar] [CrossRef]
- Tani, A.; Ono, Y.; Fukui, S.; Ikawa, S.; Kitano, K. Free radicals induced in aqueous solution by non-contact atmospheric-pressure cold plasma. Appl. Phys. Lett. 2012, 100, 254103. [Google Scholar] [CrossRef]
- Bruggeman, P.J.; Kushner, M.J.; Locke, B.R.; Gardeniers, J.G.; Graham, W.G.; Graves, D.B.; Hofman-Caris, R.C.; Maric, D.; Reid, J.P.; Ceriani, E.; et al. Plasma-liquid interactions: A review and roadmap. Plasma Sources Sci. Technol. 2016, 25, 053002. [Google Scholar] [CrossRef]
- Minagawa, Y.; Shirai, N.; Uchida, S.; Tochikubo, F. Analysis of effect of ion irradiation to liquid surface on water molecule kinetics by classical molecular dynamics simulation. Jpn. J. Appl. Phys. 2014, 53, 010210. [Google Scholar] [CrossRef]
- Rumbach, P.; Witzke, M.; Sankaran, R.M.; Go, D.B. Decoupling interfacial reactions between plasmas and liquids: Charge transfer vs plasma neutral reactions. J. Am. Chem. Soc. 2013, 135, 16264–16267. [Google Scholar] [CrossRef] [PubMed]
- Zhang, L.; Yang, D.; Wang, W.; Wang, S.; Yuan, H.; Zhao, Z.; Sang, C.; Jia, L. Needle-array to plate DBD plasma using sine AC and nanosecond pulse excitations for purpose of improving indoor air quality. Sci. Rep. 2016, 6, 25242. [Google Scholar] [CrossRef]


| Parameters | A-Jet | ||||
|---|---|---|---|---|---|
| Wavelength (nm) | Absorbance (a.u.) | Average Size (nm) | Particles Type | ||
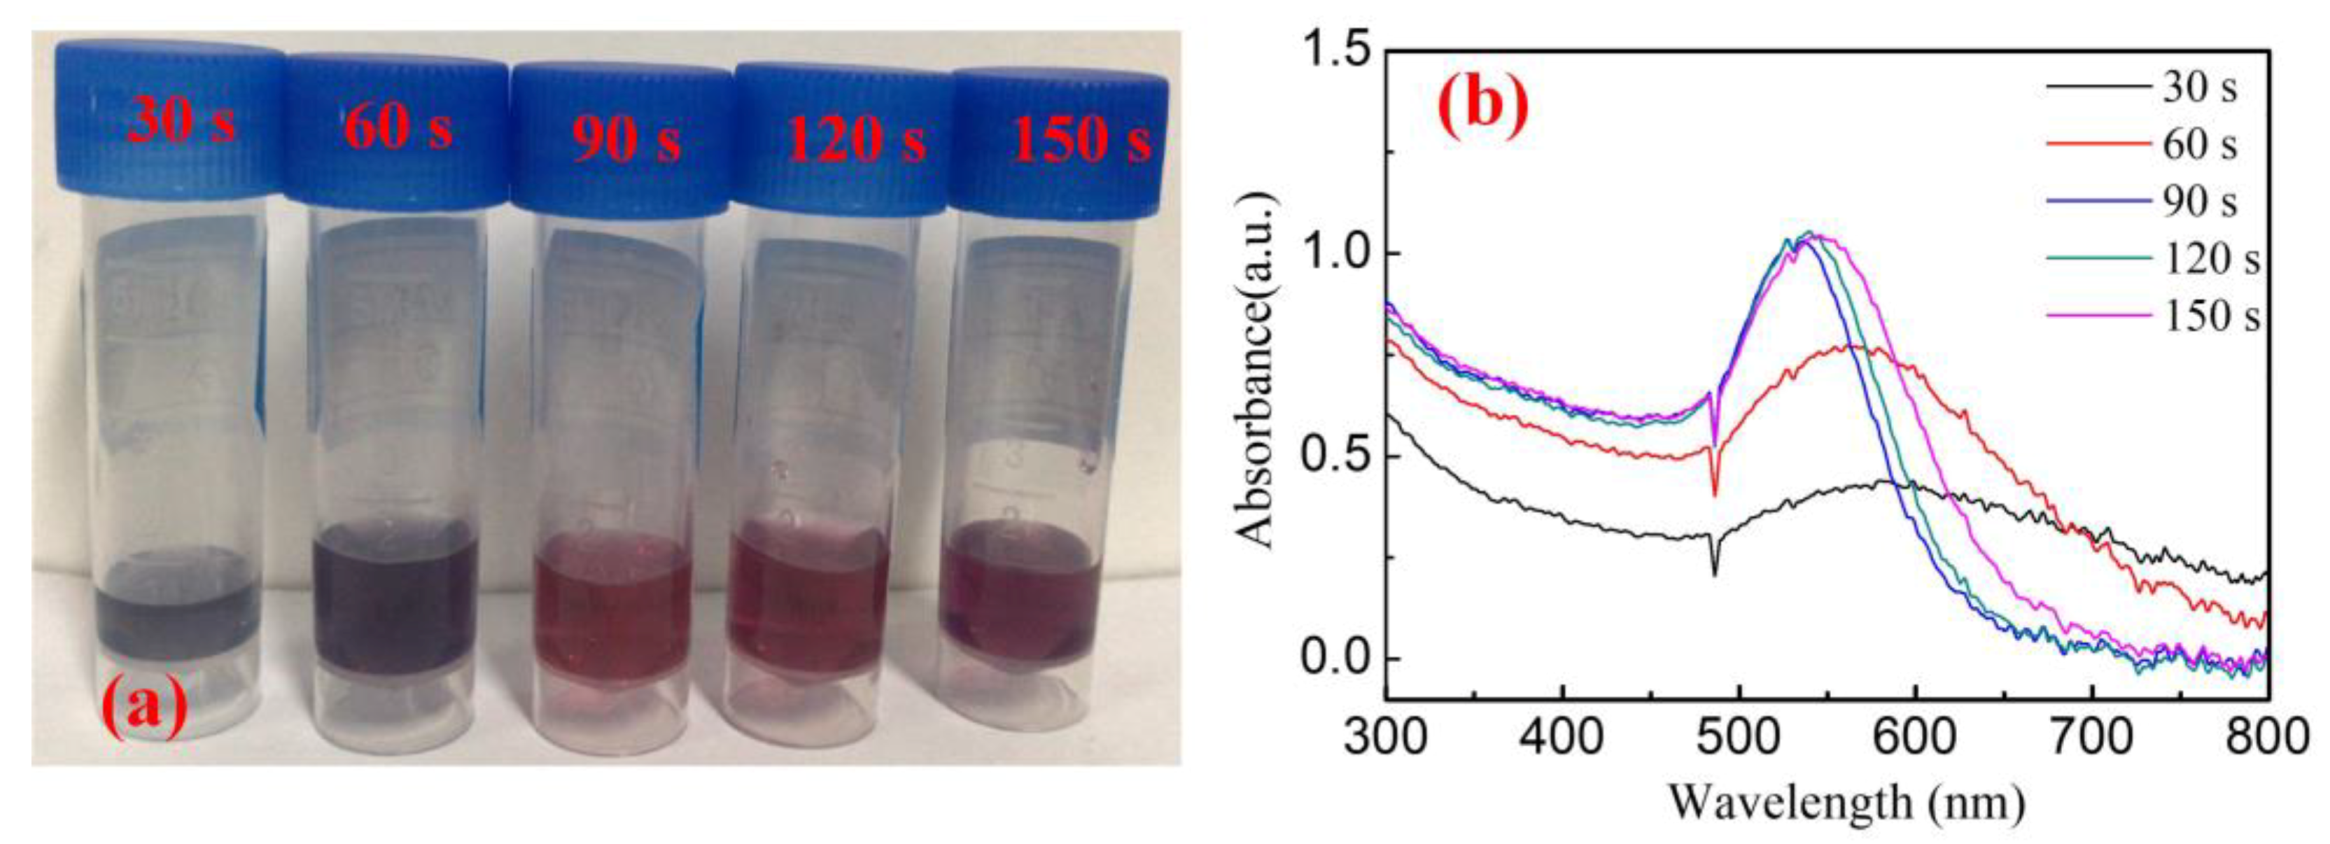
| Time (s) | 30 | 584 | 0.437 | - | - |
| 60 | 566 | 0.772 | - | - | |
| 90 | 535 | 1.028 | 20.3 ± 12.2 | Spherical, cylindrical, hexagon | |
| 120 | 541 | 1.053 | 27.4 ± 10.4 | Spherical, cylindrical, hexagon | |
| 150 | 545 | 1.046 | - | - | |
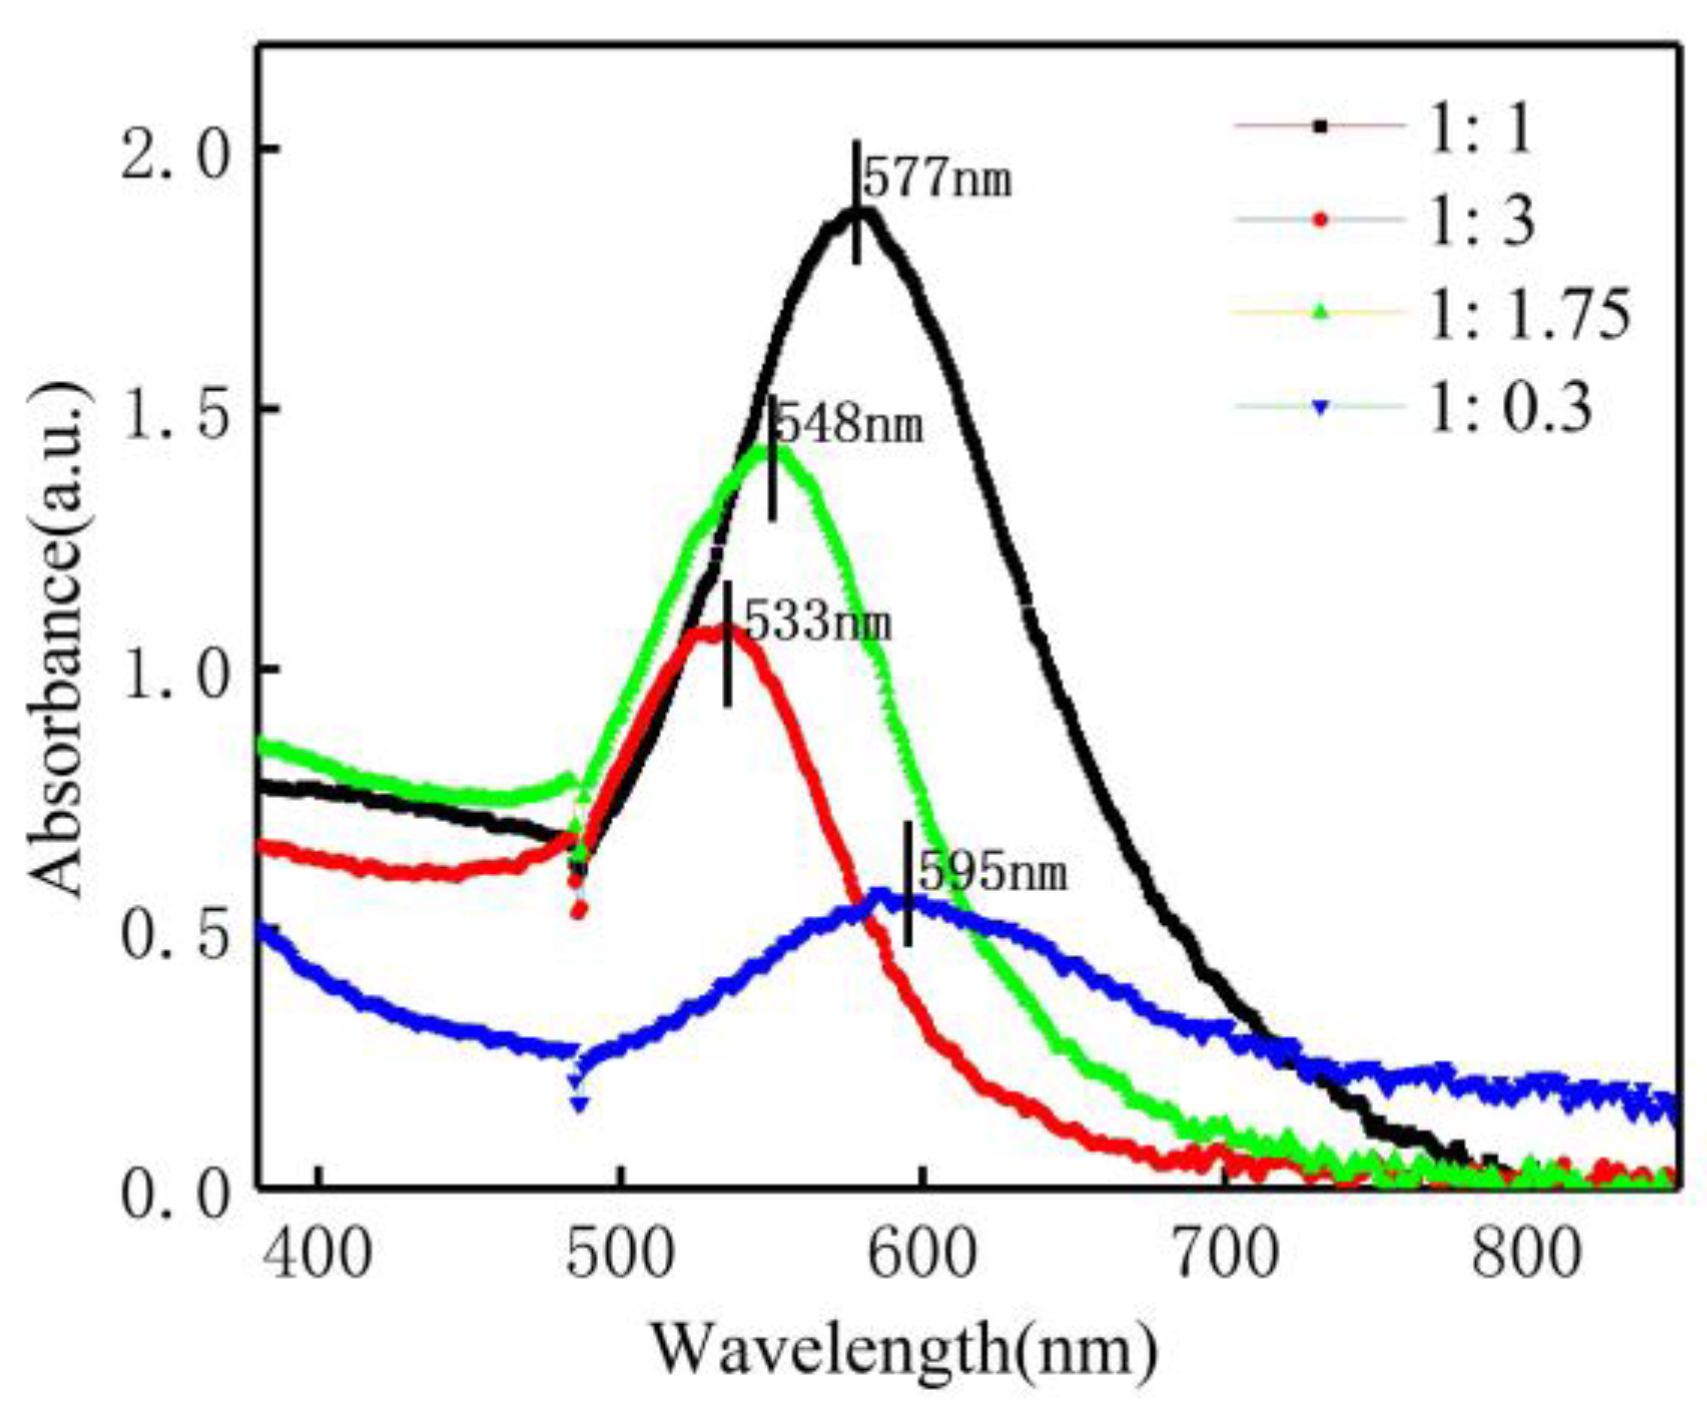
| AuHCl4/Sodium citrate ratio | 1:1 | 577 | 1.877 | - | |
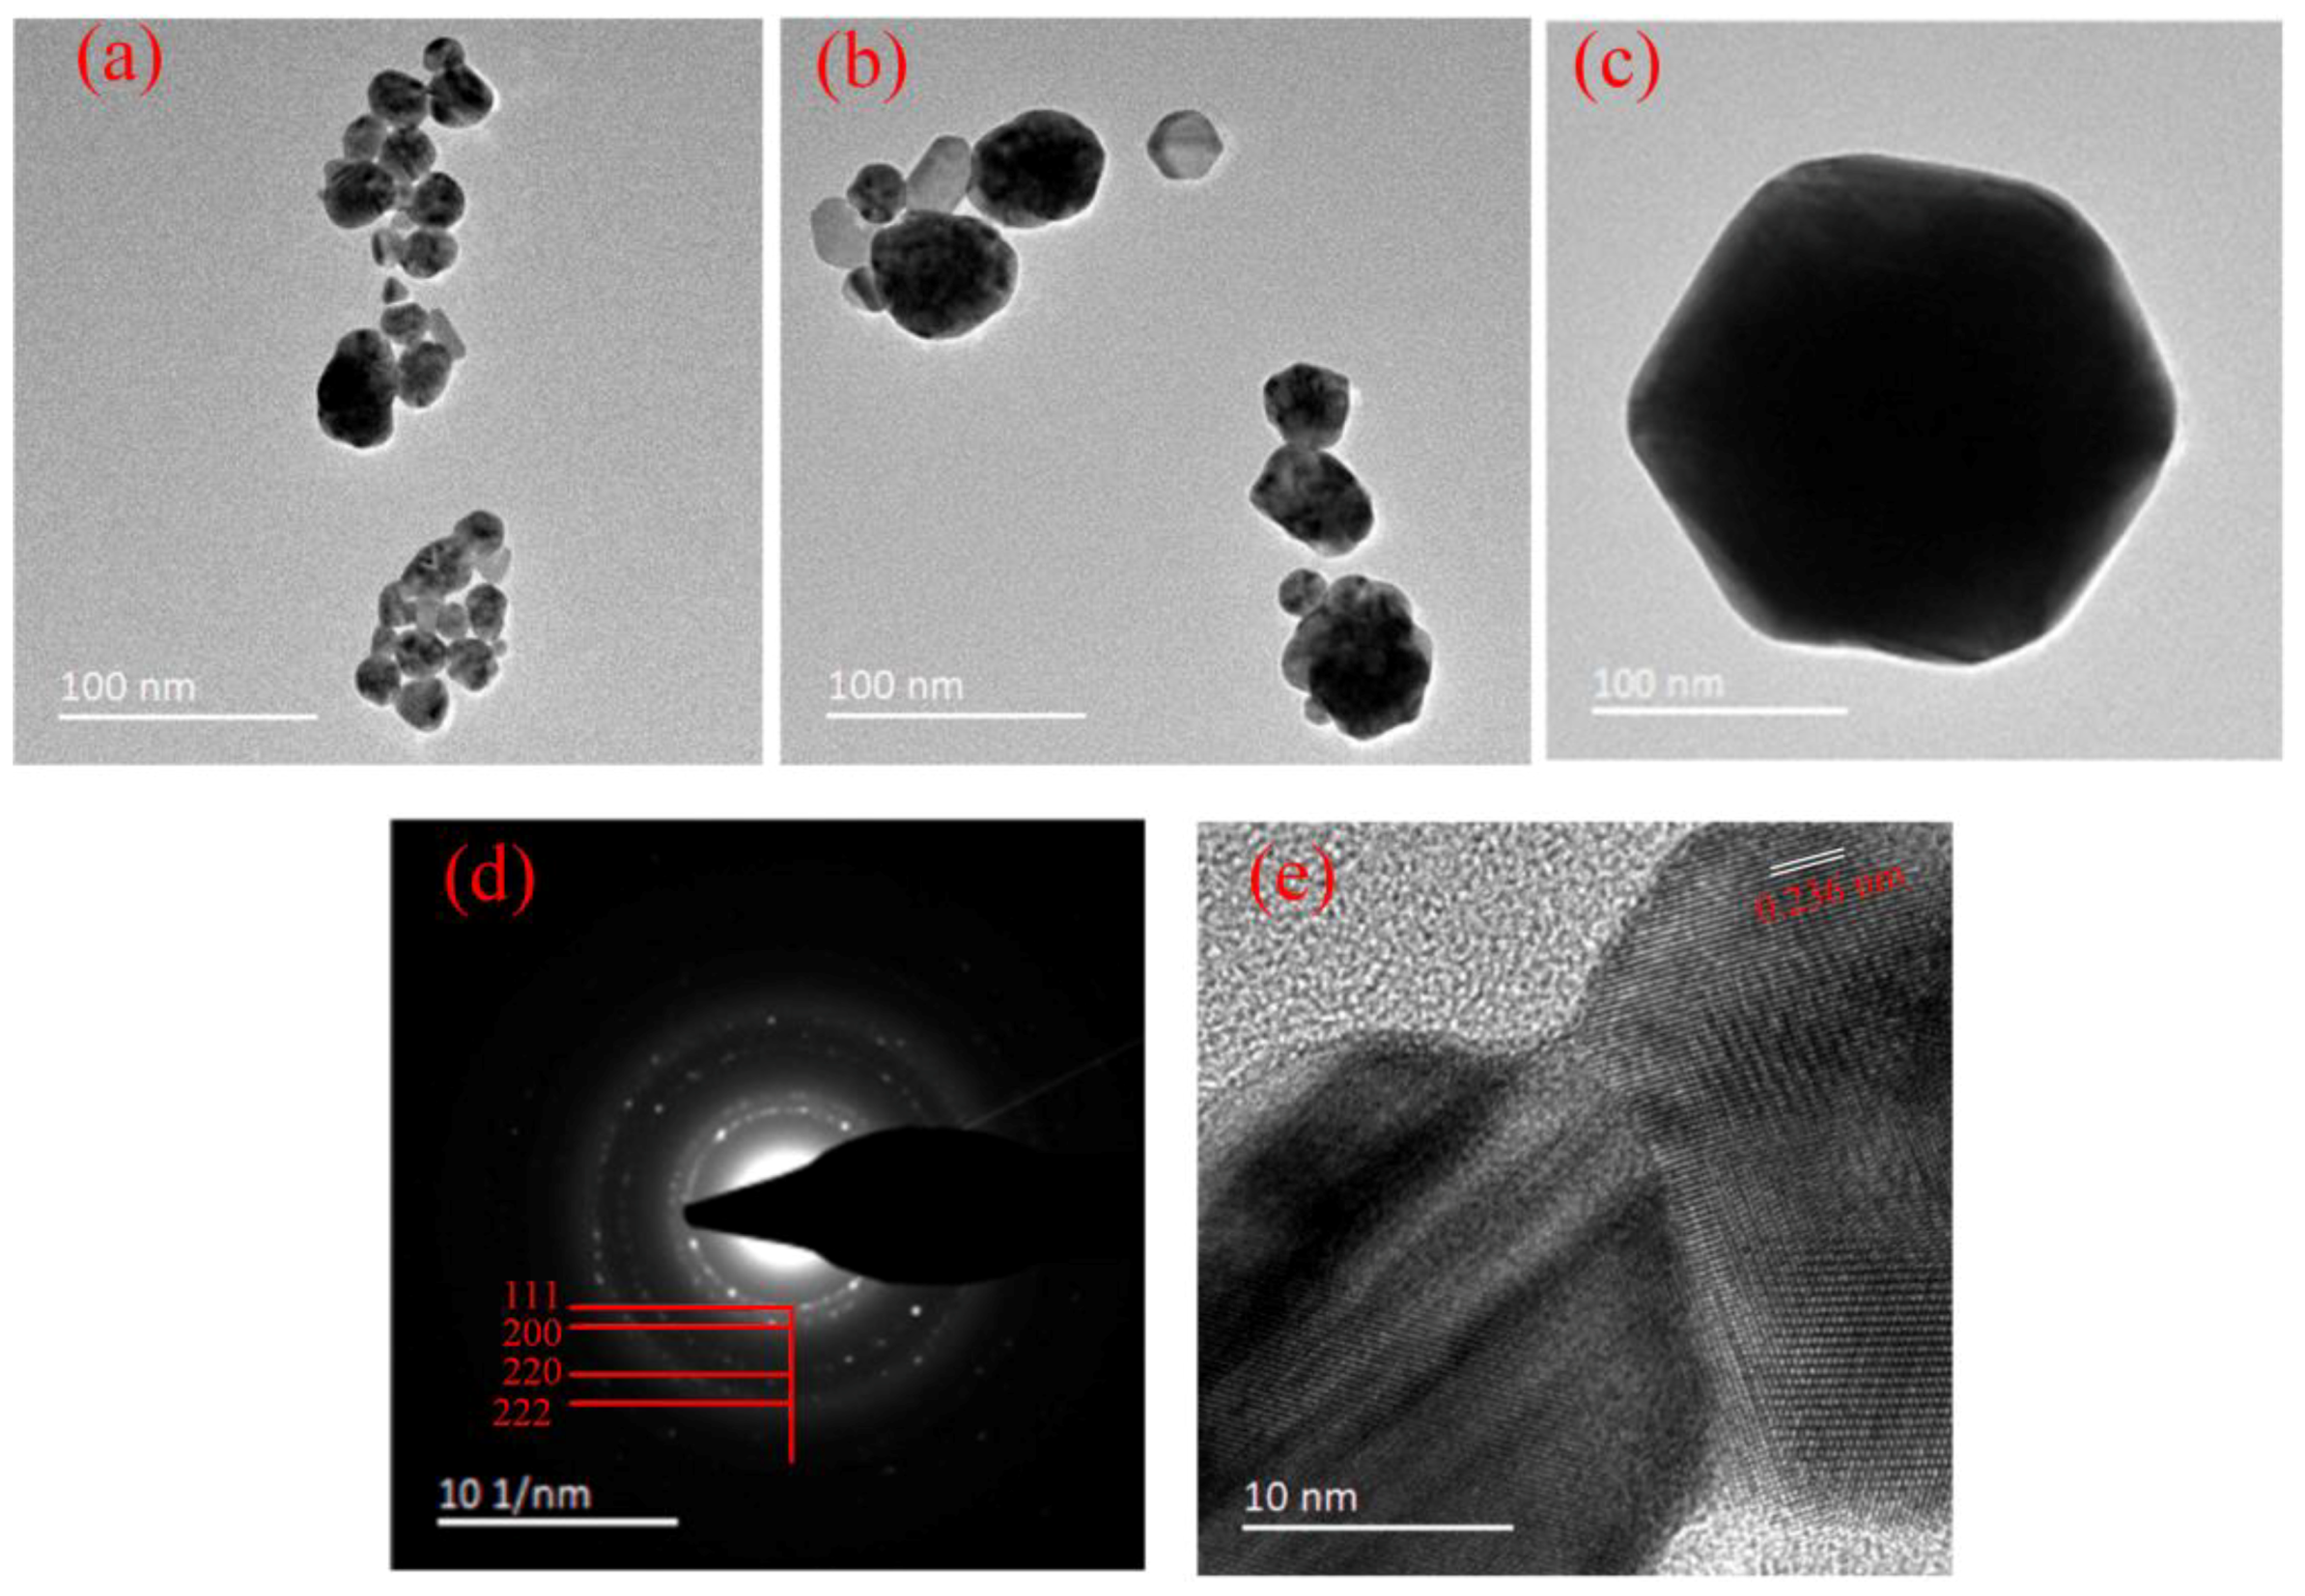
| 1:3 | 533 | 1.072 | 18.2 ± 9.0 | Spherical, cylindrical, hexagon | |
| 1:1.75 | 548 | 1.410 | 32.9 ± 14.1 | Spherical, cylindrical, hexagon | |
| 1:0.3 | 595 | 0.550 | 180.6 ± 20.5 | Spherical, cylindrical, hexagon | |
| Parameters | P-Jet | ||||
|---|---|---|---|---|---|
| Wavelength (nm) | Absorbance (a.u.) | Average Size (nm) | Particles Type | ||
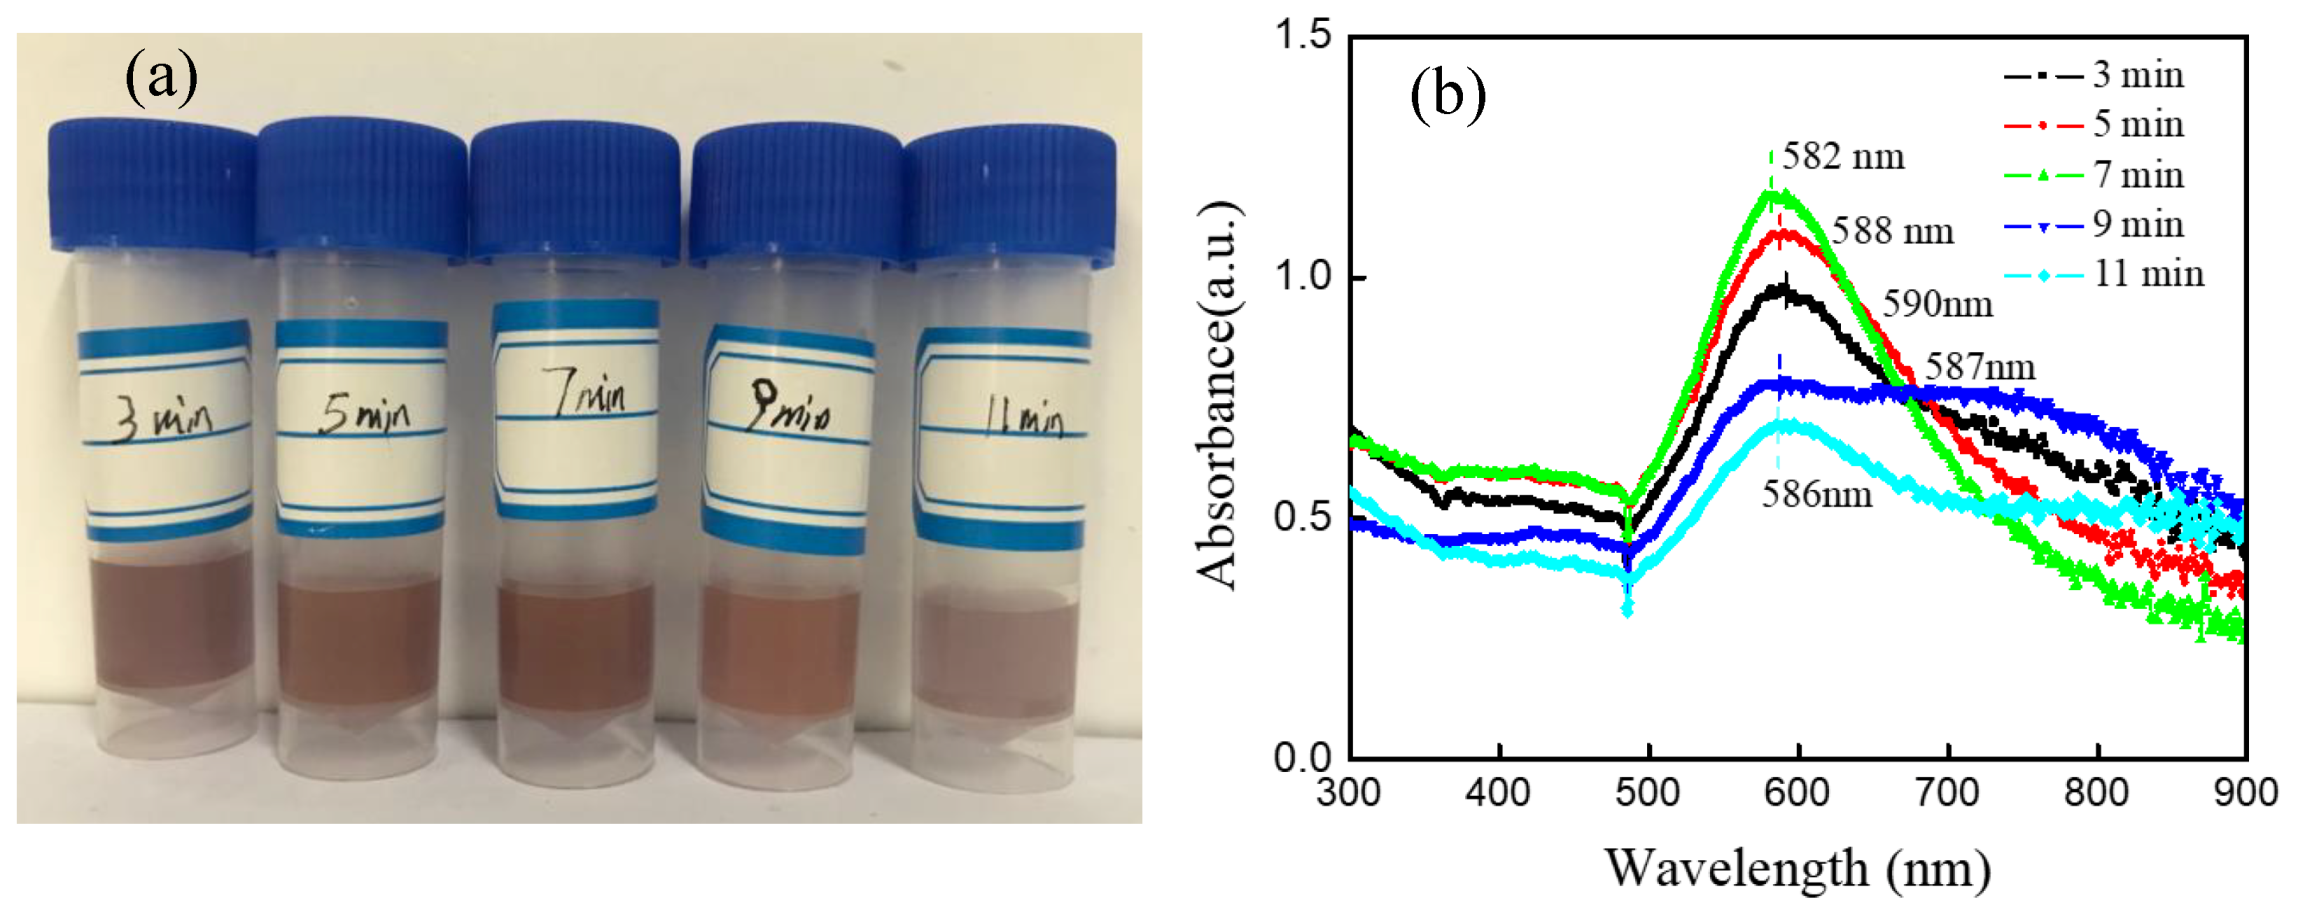
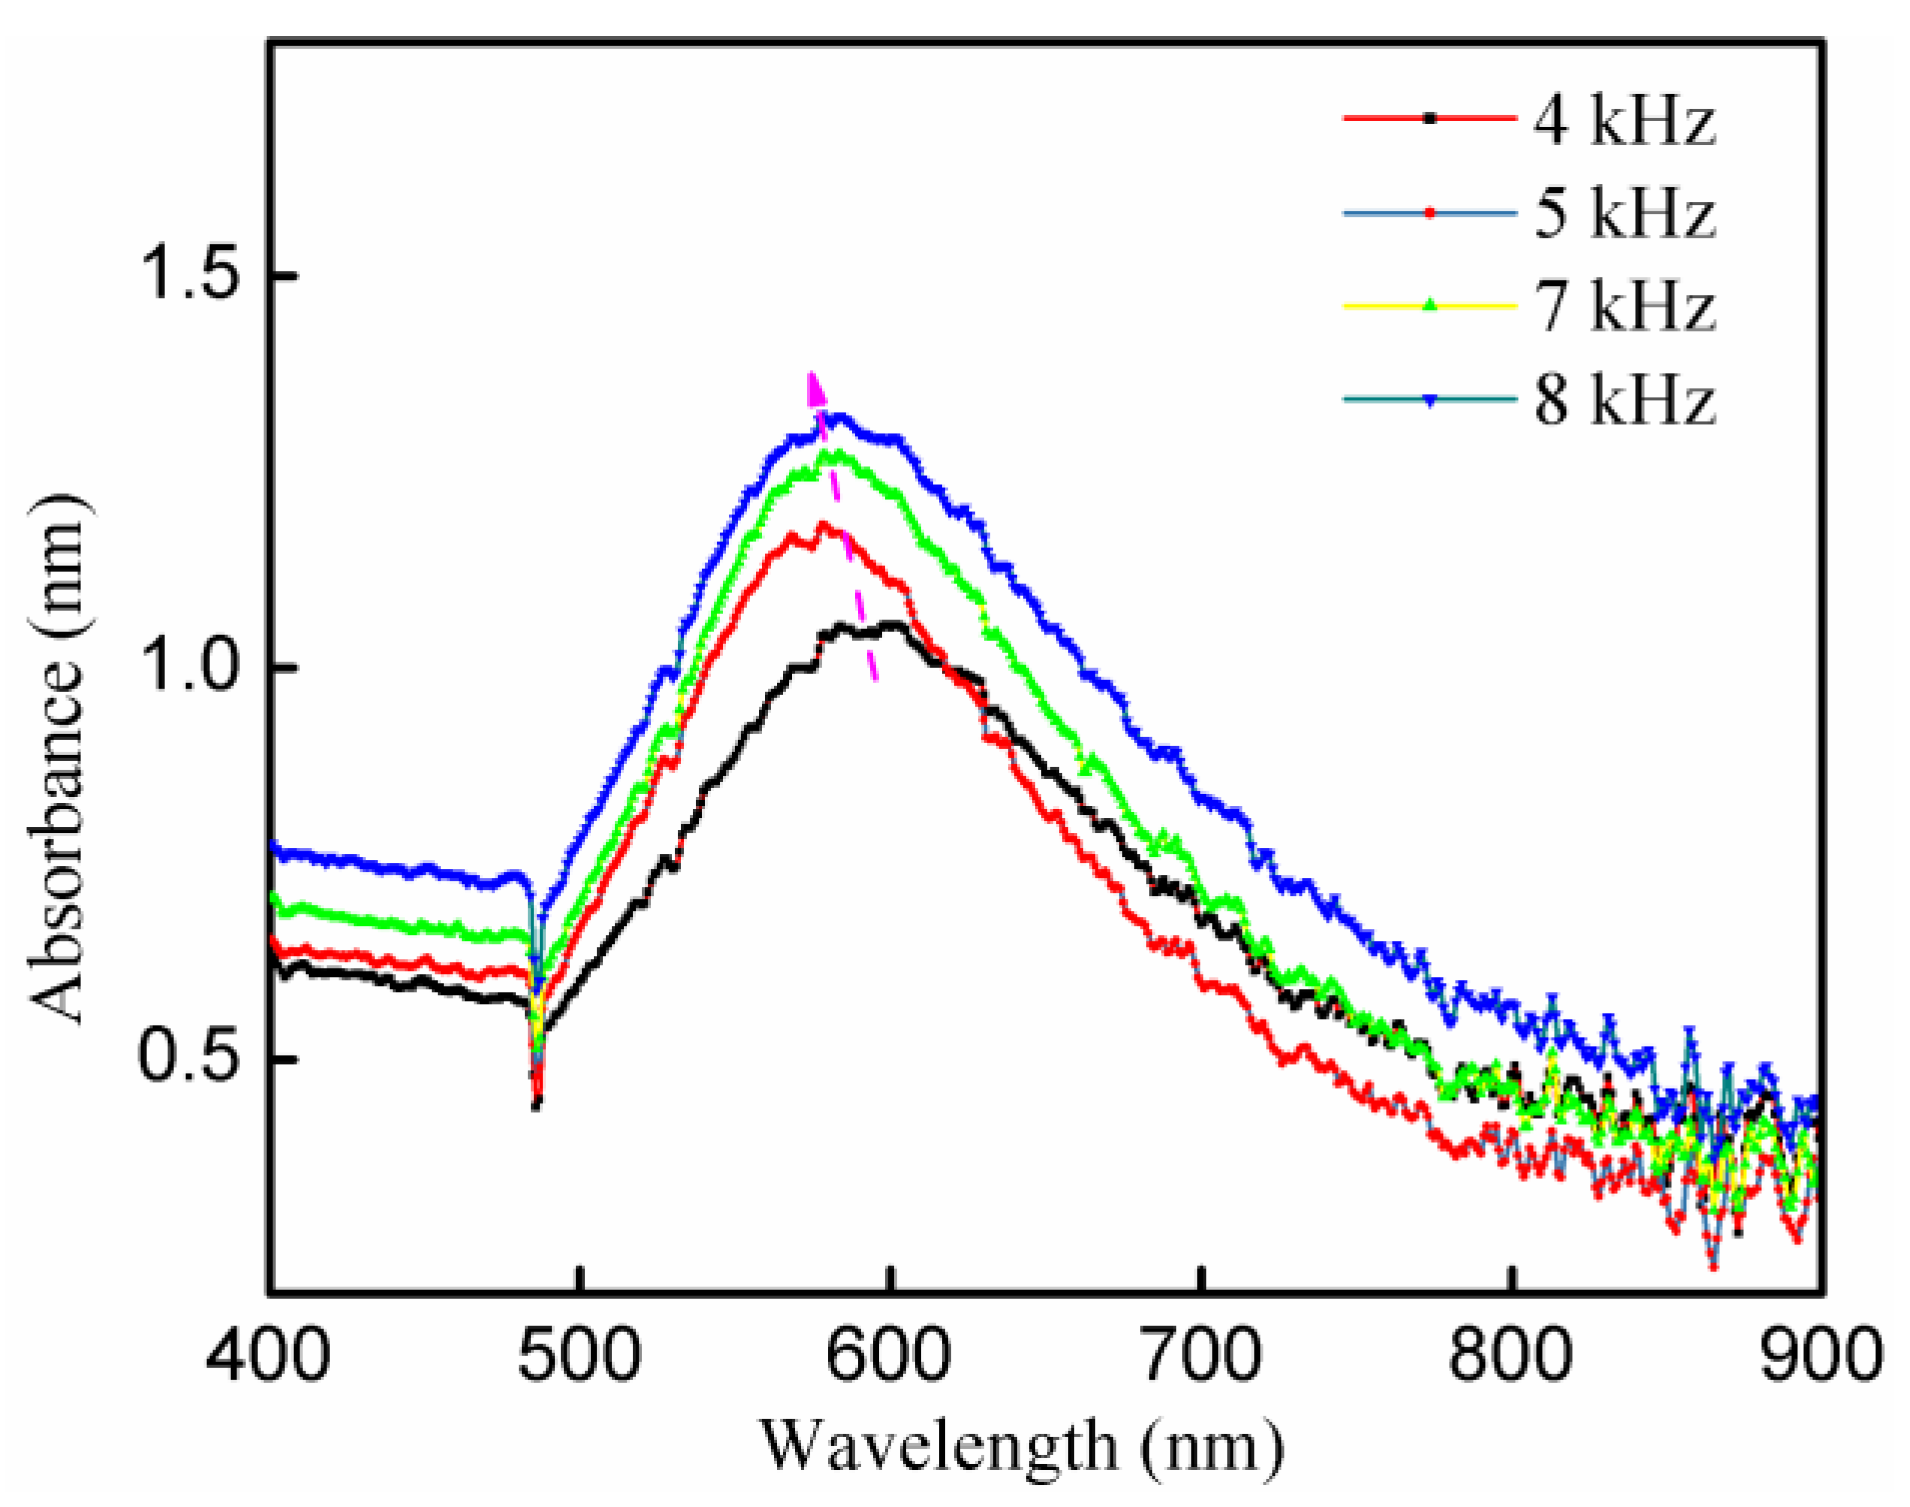
| Time (min) | 3 | 590 | 0.977 | - | - |
| 5 | 588 | 1.087 | - | - | |
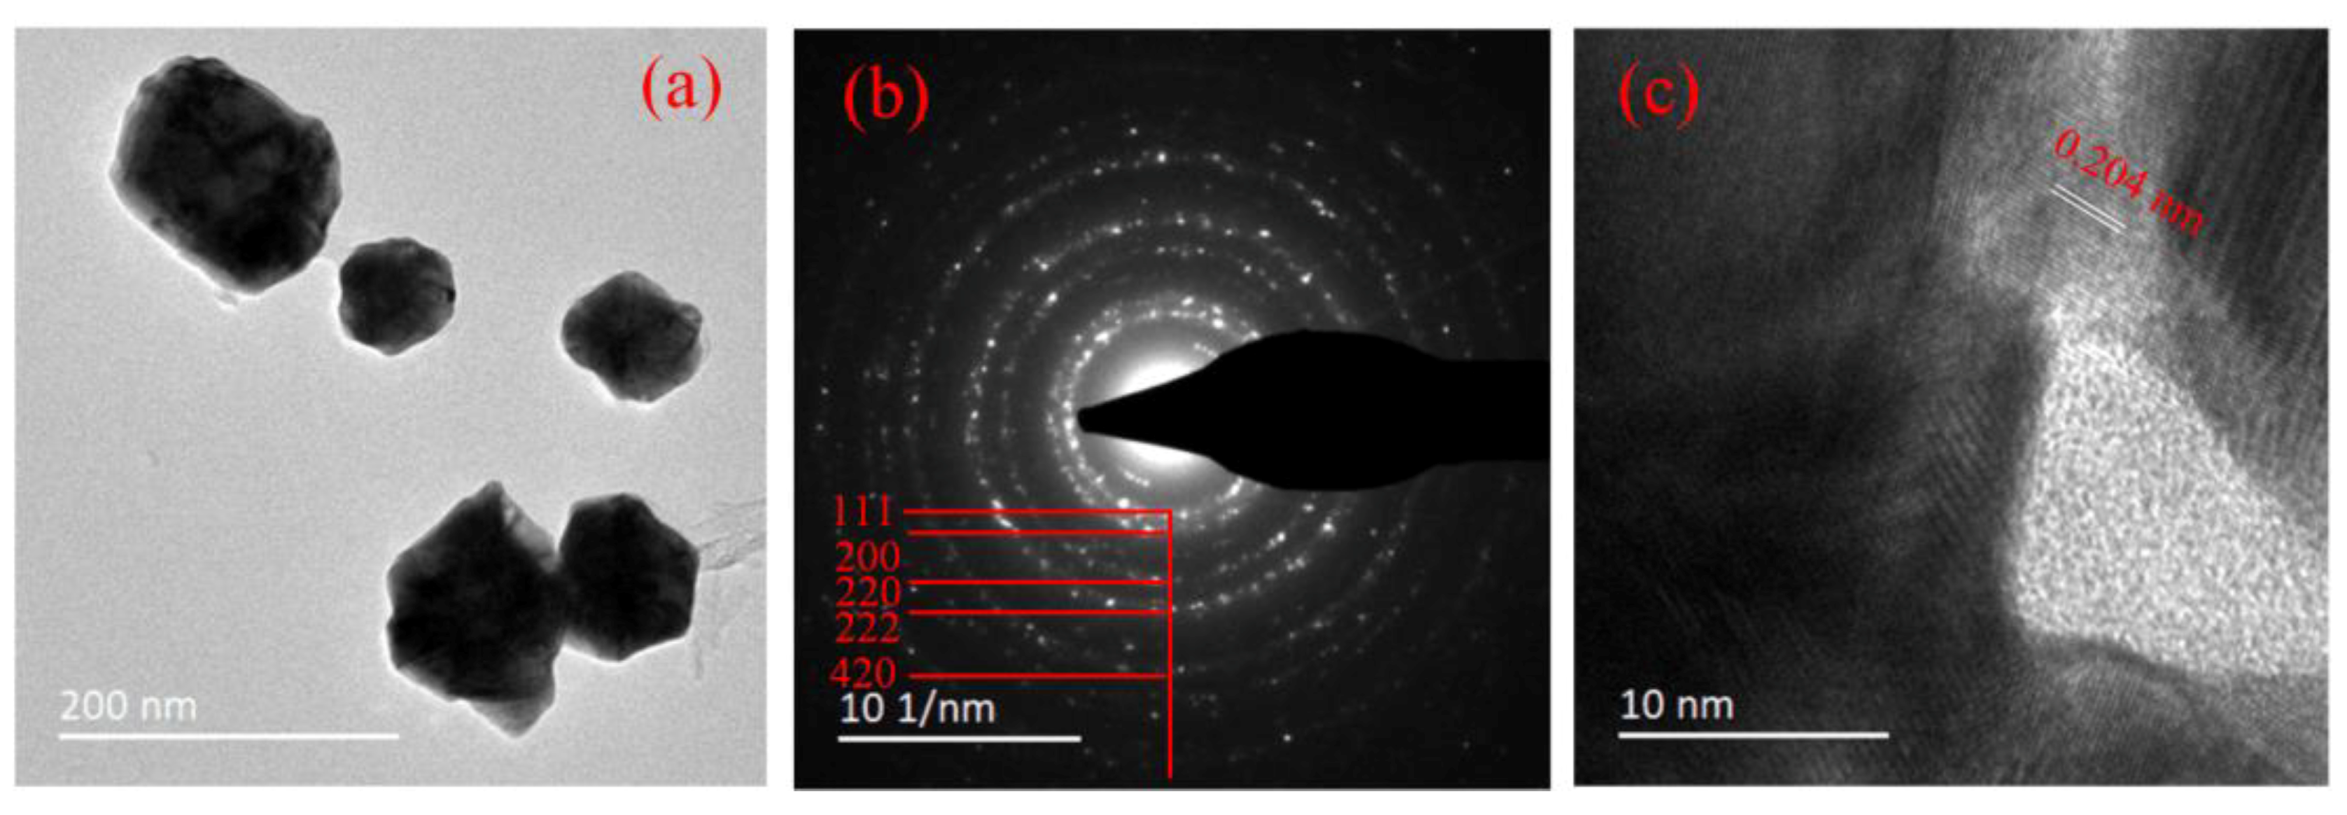
| 7 | 582 | 1.167 | 81.2 ± 19.2 | Spherical, cylindrical, hexagon | |
| 9 | 587 | 0.779 | 100.2 ± 20.3 | Spherical, cylindrical, hexagon | |
| 11 | 586 | 0.694 | 95.3 ± 29.8 | Spherical, cylindrical, hexagon | |
| AuHCl4/Sodium citrate ratio | 1:1 | 594 | 1.923 | - | - |
| 1:3 | 582 | 1.167 | 82.5 ± 21.5 | Spherical, cylindrical, hexagon | |
| 1:1.75 | 589 | 1.285 | - | - | |
| 1:0.3 | 603 | 0.716 | - | - | |
© 2019 by the authors. Licensee MDPI, Basel, Switzerland. This article is an open access article distributed under the terms and conditions of the Creative Commons Attribution (CC BY) license (http://creativecommons.org/licenses/by/4.0/).
Share and Cite
Xie, P.; Qi, Y.; Wang, R.; Wu, J.; Li, X. Aqueous Gold Nanoparticles Generated by AC and Pulse-Power-Driven Plasma Jet. Nanomaterials 2019, 9, 1488. https://doi.org/10.3390/nano9101488
Xie P, Qi Y, Wang R, Wu J, Li X. Aqueous Gold Nanoparticles Generated by AC and Pulse-Power-Driven Plasma Jet. Nanomaterials. 2019; 9(10):1488. https://doi.org/10.3390/nano9101488
Chicago/Turabian StyleXie, Pengcheng, Yi Qi, Ruixue Wang, Jina Wu, and Xiaosen Li. 2019. "Aqueous Gold Nanoparticles Generated by AC and Pulse-Power-Driven Plasma Jet" Nanomaterials 9, no. 10: 1488. https://doi.org/10.3390/nano9101488
APA StyleXie, P., Qi, Y., Wang, R., Wu, J., & Li, X. (2019). Aqueous Gold Nanoparticles Generated by AC and Pulse-Power-Driven Plasma Jet. Nanomaterials, 9(10), 1488. https://doi.org/10.3390/nano9101488