Magnetic Binary Supersaturated Solid Solutions Processed by Severe Plastic Deformation

 , ,
, ,  , , and
Abstract
1. Introduction
2. Materials and Methods
3. Results and Disussion
3.1. Microstructure
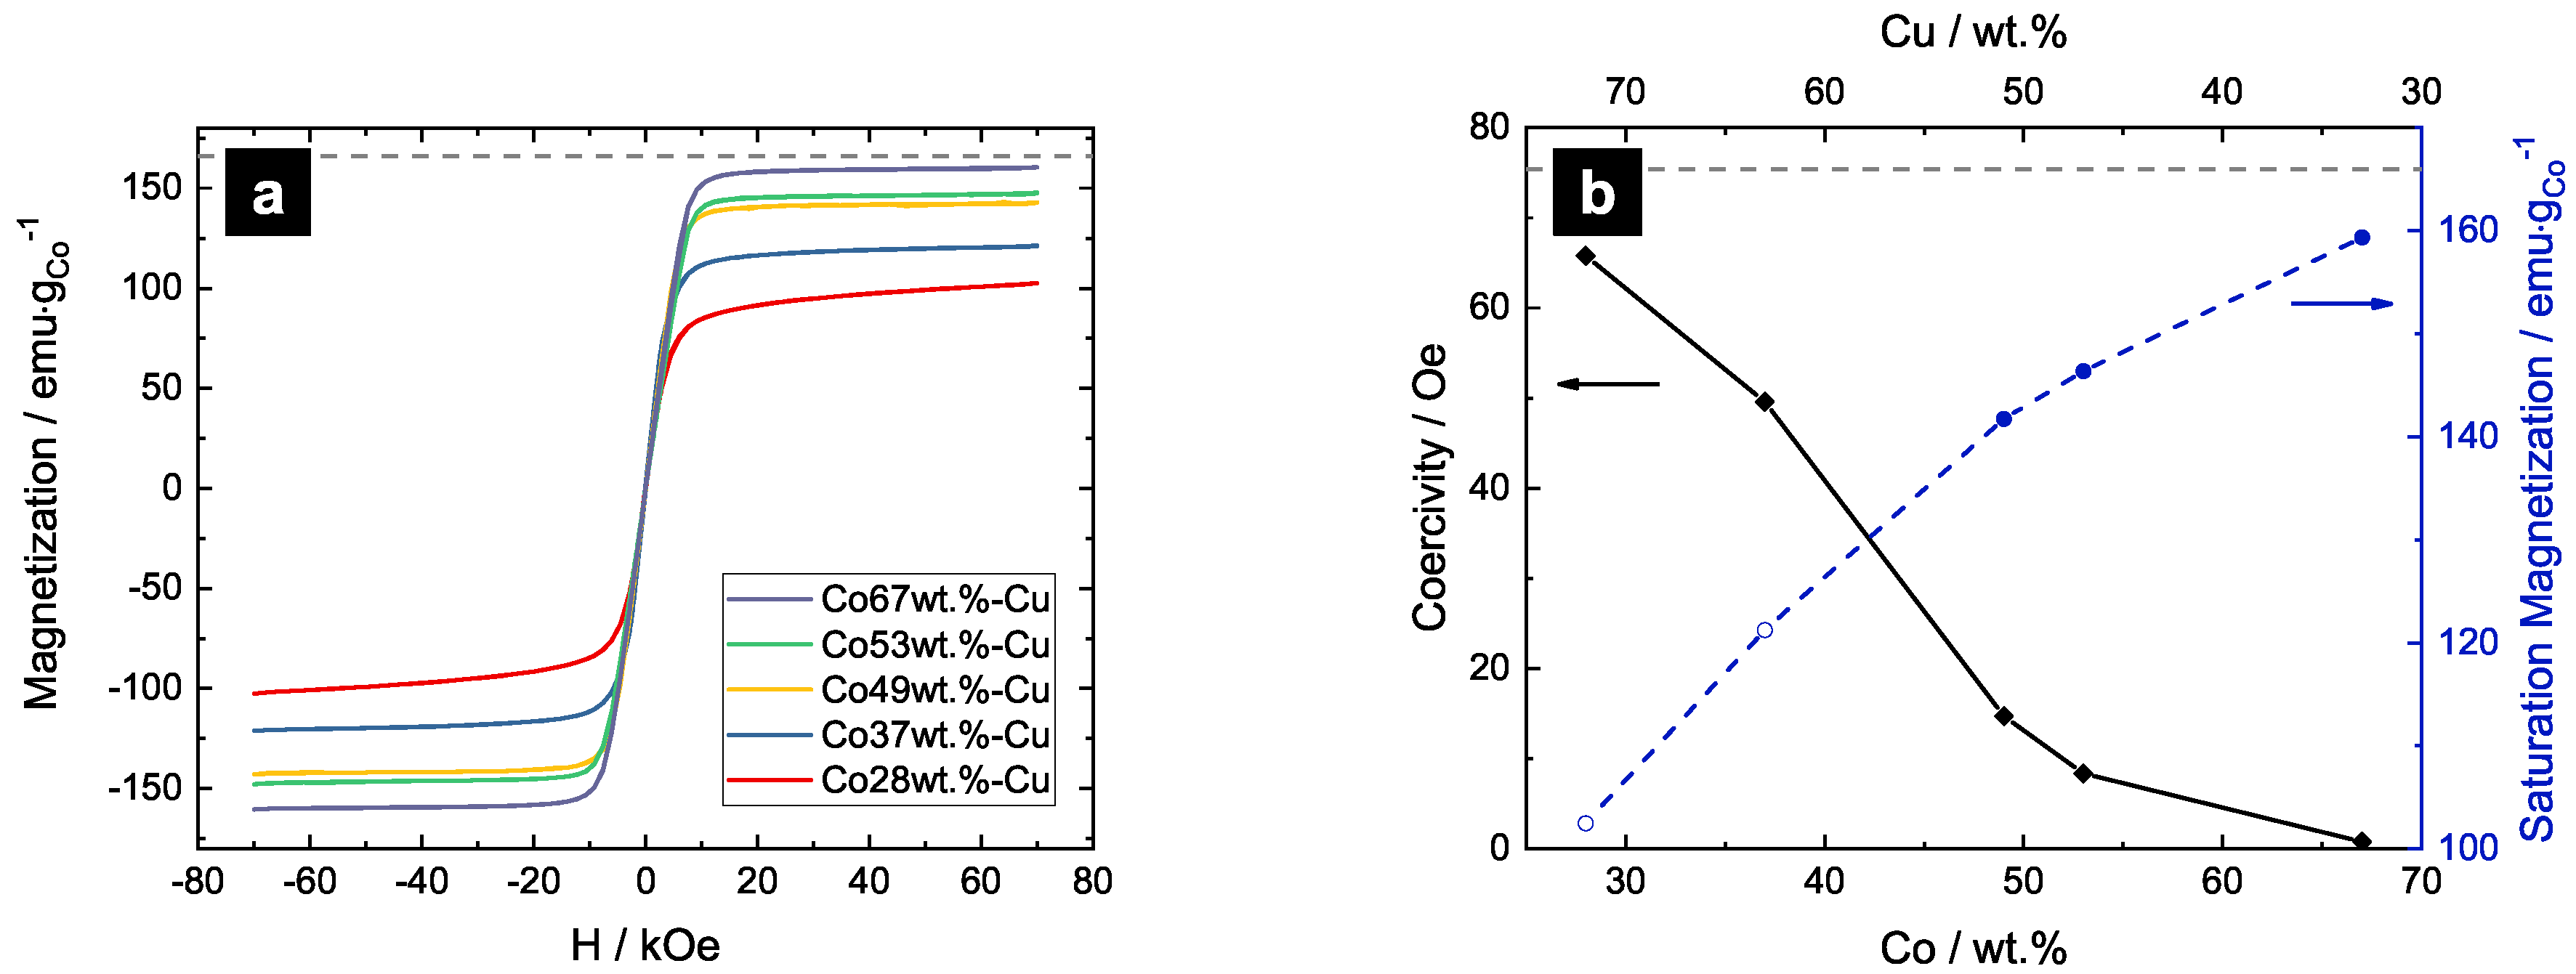
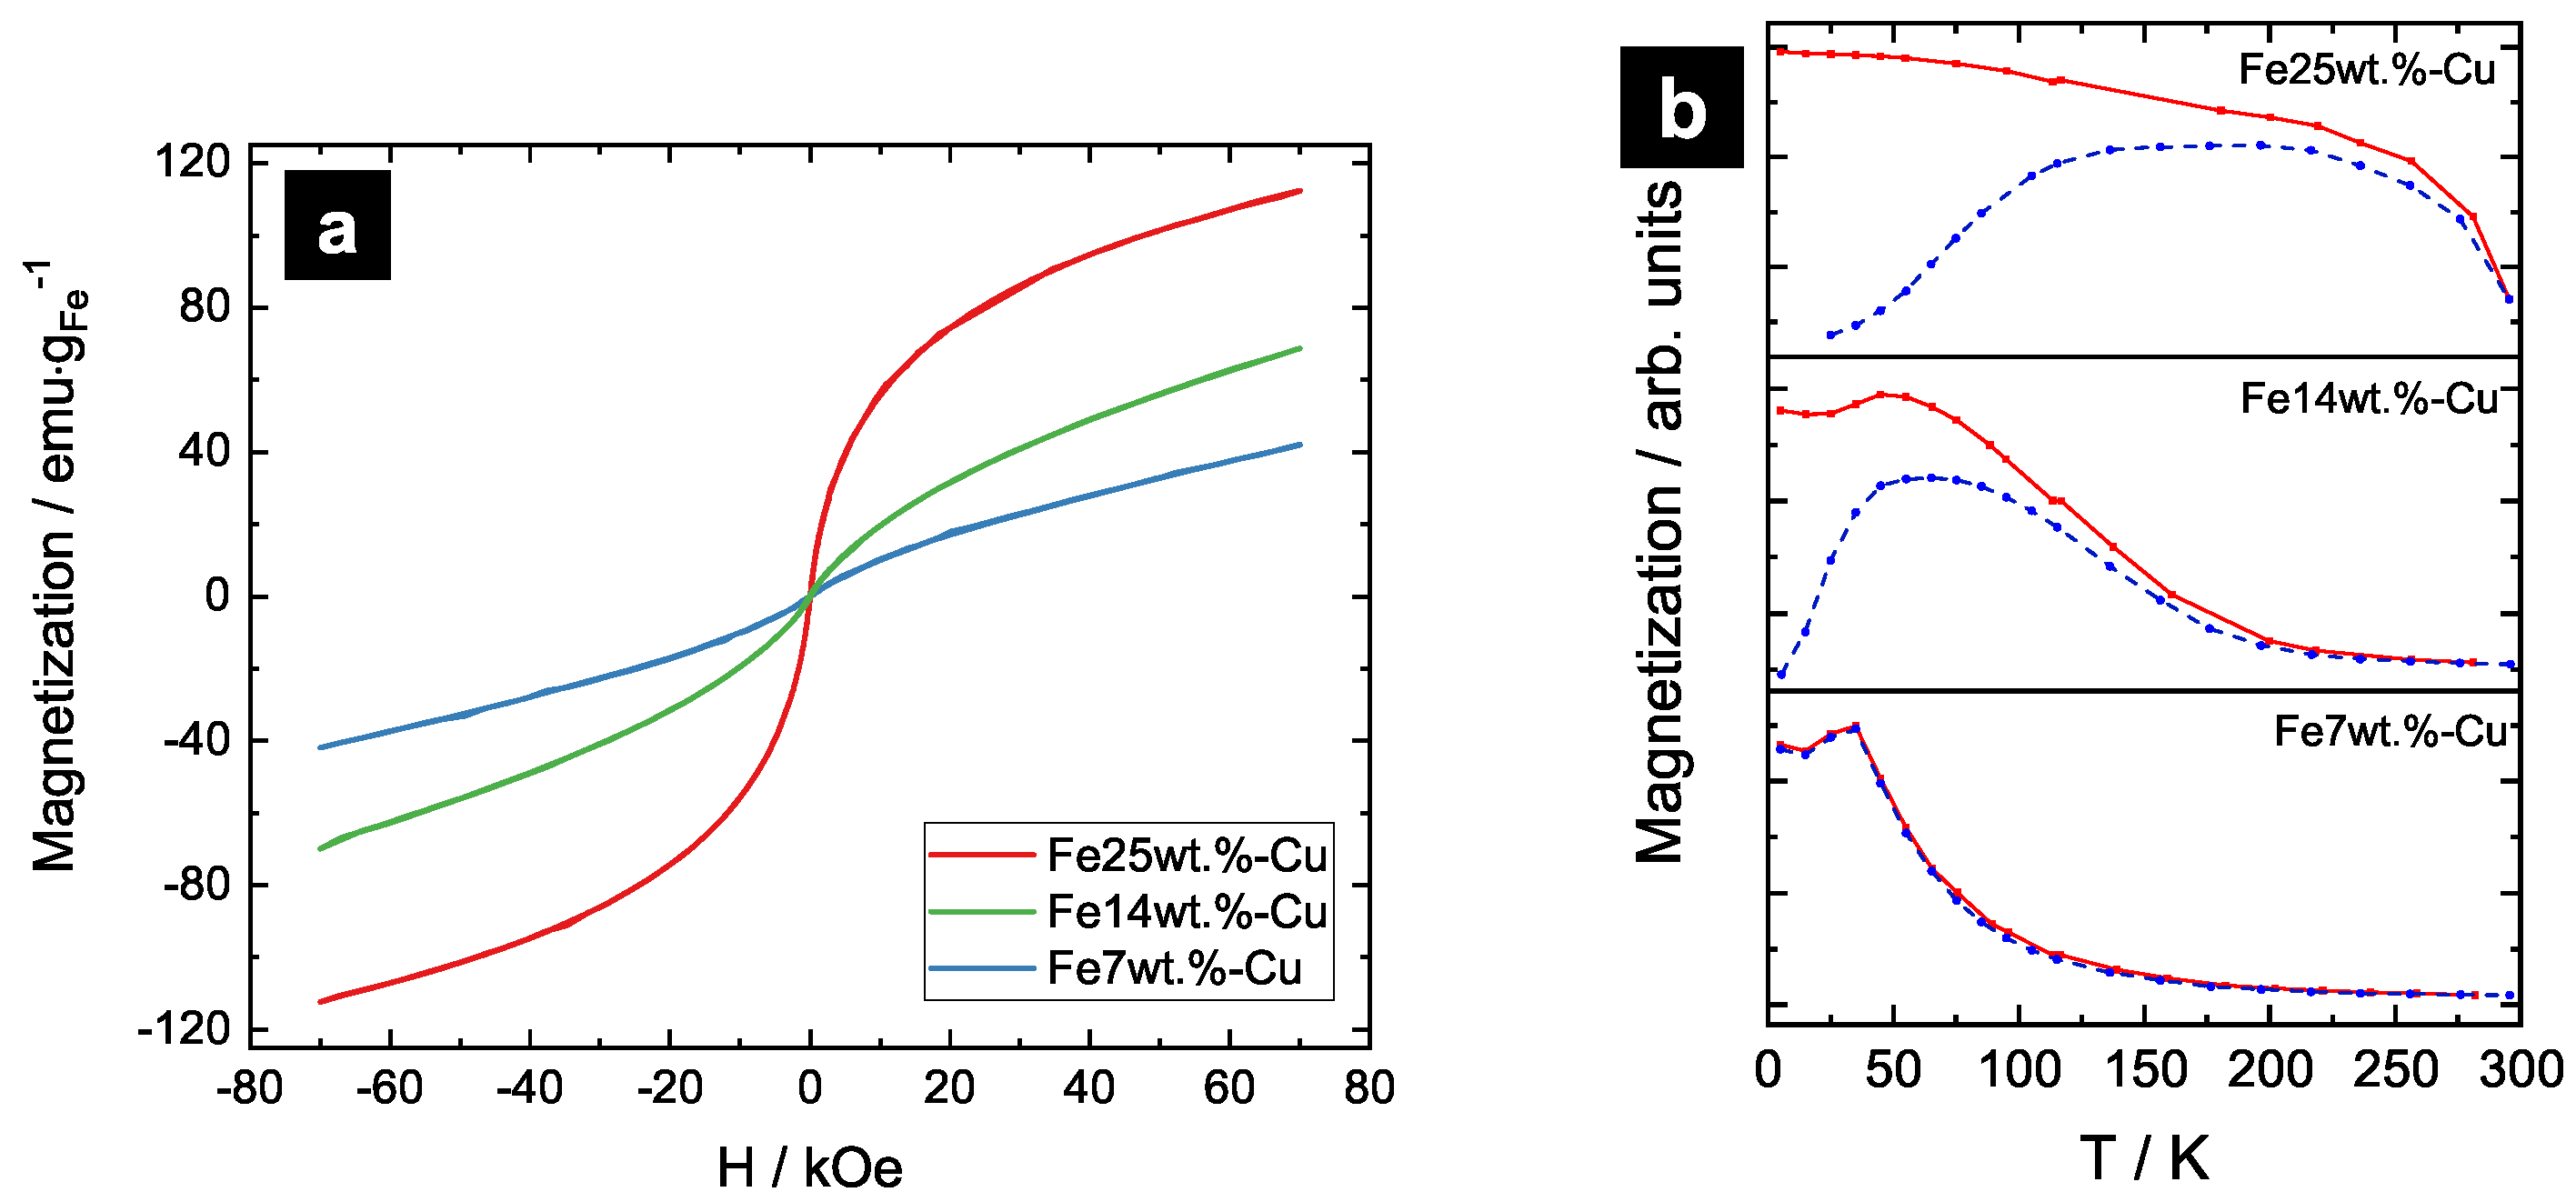
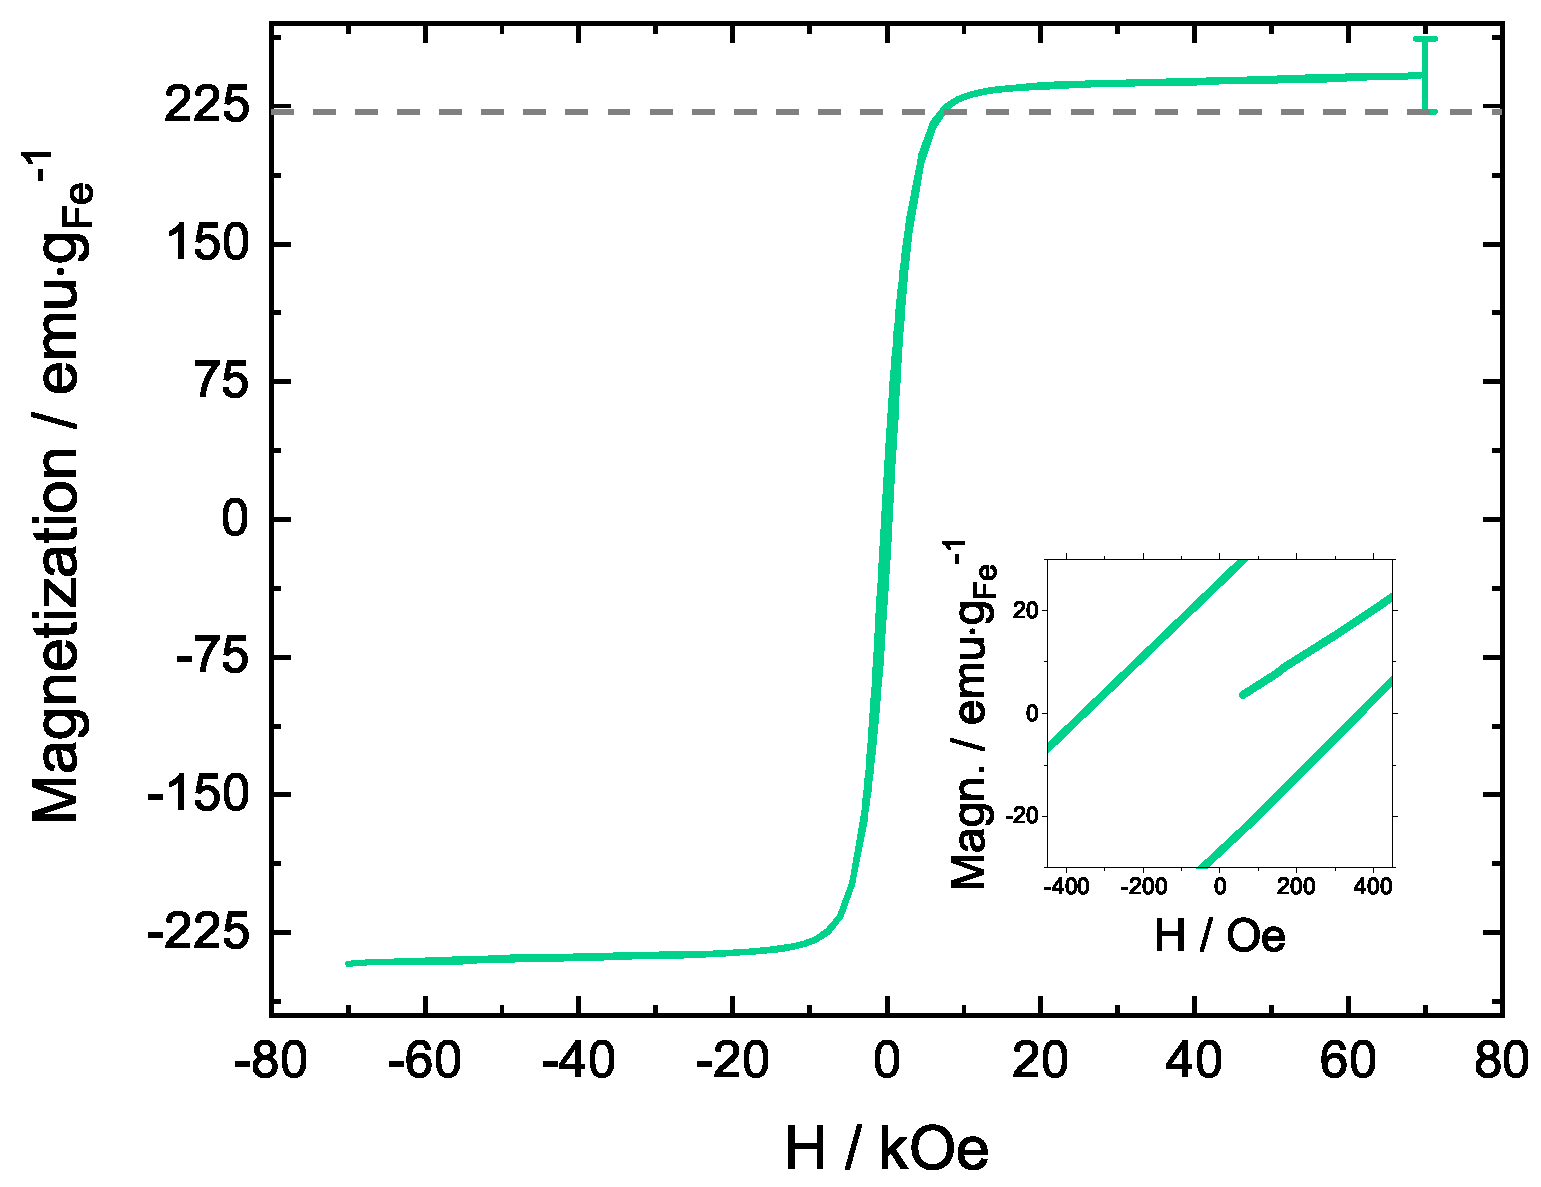
3.2. Magnetism
4. Conclusions
Author Contributions
Funding
Acknowledgments
Conflicts of Interest
Abbreviations
| BSE | Backscattered Electrons |
| EBSD | Electron Backscatter Diffraction |
| EDX | Energy Dispersive X-Ray Spectroscopy |
| FC | Field Cooling |
| HPT | High-Pressure Torsion |
| SEM | Scanning Electron Microscopy |
| SPD | Severe Plastic Deformation |
| SQUID | Superconducting Quantum Interference Device |
| TKD | Transmission Kikuchi Diffraction |
| ZFC | Zero Field Cooling |
References
- Traußnig, T.; Topolovec, S.; Nadeem, K.; Vinga Szabó, D.; Krenn, H.; Würschum, R. Magnetization of Fe-oxide based nanocomposite tuned by surface charging. Phys. Status Solidi 2011, 5, 150–152. [Google Scholar] [CrossRef]
- Chien, C.L.; Liou, S.H.; Gatzke, M.A. Magnetic Percolation in new crystalline fcc Fe-Cu Alloys. MRS Proc. 1987, 80, 395–400. [Google Scholar] [CrossRef]
- Childress, J.R.; Chien, C.L. Reentrant magnetic behavior in fcc Co-Cu alloys. Phys. Rev. B 1991, 43, 8089–8093. [Google Scholar] [CrossRef]
- Crespo, P.; Navarro, I.; Hemando, A.; Rodríguez, P.; García Escorial, A.; Barandiarán, J.M.; Drbohlav, O.; Yavad, A.R. Magnetic and structural properties of as-milled and heat-treated bcc-Fe70Cu30 alloy. J. Magn. Magn. Mater. 1995, 150, 409–416. [Google Scholar] [CrossRef]
- Ambrose, T.; Gavrin, A.; Chien, C.L. Magnetic propeties of metastable fcc Fe-Cu alloys prepared by high energy ball milling. J. Magn. Magn. Mater. 1993, 124, 15–19. [Google Scholar] [CrossRef]
- Pippan, R.; Scheriau, S.; Taylor, A.; Hafok, M.; Hohenwarter, A.; Bachmaier, A. Saturation of Fragmentation During Severe Plastic Deformation. Ann. Rev. Mater. Res. 2010, 40, 319–343. [Google Scholar] [CrossRef]
- Valiev, R.Z.; Islamgaliev, R.K.; Alexandrov, I.V. Bulk nanostructured materials from severe plastic deformation. Prog. Mater. Sci. 2000, 45, 103–189. [Google Scholar] [CrossRef]
- Kormout, K.S.; Pippan, R.; Bachmaier, A. Deformation-Induced Supersaturation in Immiscible Material Systems during High-Pressure Torsion. Adv. Eng. Mater. 2017, 19, 1–19. [Google Scholar] [CrossRef]
- Sauvage, X.; Wetscher, F.; Pareige, P. Mechanical alloying of Cu and Fe induced by severe plastic deformation of a Cu-Fe composite. Acta Mater. 2005, 53, 2127–2135. [Google Scholar] [CrossRef]
- Bachmaier, A.; Krenn, H.; Knoll, P.; Aboulfadl, H.; Pippan, R. Tailoring the magnetic properties of nanocrystalline Cu-Co alloys prepared by high-pressure torsion and isothermal annealing. J. Alloys Compd. 2017, 725, 744–749. [Google Scholar] [CrossRef]
- Herzer, G. Soft-magnetic nanocrystalline materials. Scr. Metall. Mater. 1995, 33, 1741–1756. [Google Scholar] [CrossRef]
- Alben, R.; Becker, J.J.; Chi, M.C. Random anisotropy in amorphous ferromagnets. J. Appl. Phys. 1978, 49, 1653–1658. [Google Scholar] [CrossRef]
- Hohenwarter, A.; Bachmaier, A.; Gludovatz, B.; Scheriau, S.; Pippan, R. Technical parameters affecting grain refinement by high pressure torsion. Int. J. Mater. Res. 2009, 100, 1653–1661. [Google Scholar] [CrossRef]
- Bachmaier, A.; Pfaff, M.; Stolpe, M.; Aboulfadl, H.; Motz, C. Phase separation of a supersaturated nanocrystalline Cu-Co alloy and its influence on thermal stability. Acta Mater. 2015, 96, 269–283. [Google Scholar] [CrossRef]
- Edalati, K.; Toh, S.; Arita, M.; Watanabe, M.; Horita, Z. High-pressure torsion of pure cobalt: Hcp-fcc phase transformations and twinning during severe plastic deformation. Appl. Phys. Lett. 2013, 102, 1–5. [Google Scholar] [CrossRef]
- Sort, J.; Zhilyaev, A.; Zielinska, M.; Nogués, J.; Surinach, S.; Thibault, J.; Baró, M. Microstructural effects and large microhardness in cobalt processed by high pressure torsion consolidation of ball milled powders. Acta Mater. 2003, 51, 6385–6393. [Google Scholar] [CrossRef]
- Stearns, M.B. Spontaneous Magnetization, Magnetic Moments and High-Field Susceptibility: Datasheet from Landolt-Börnstein—Group III Condensed Matter, Volume 19A: “3d, 4d and 5d Elements, Alloys and Compounds” in Springer Materials; Springer: Berlin, Germany, 1986. [Google Scholar]
- Adachi, K.; Uchiyama, T.; Matsui, M.; Miyazaki, T.; Doi, M.; Miyazaki, T. Spin Glass of liquid-quenched Cu-Fe alloys. J. Magn. Magn. Mater. 1986, 80–81. [Google Scholar] [CrossRef]
- Franz, J.; Sellmyer, D. Magnetic Interactions and High-Field Magnetization in Dilute Magnetic Alloys. Phys. Rev. B 1973, 8. [Google Scholar] [CrossRef]
- Vedyaev, A.; Cherenkov, V. Spin Glass State in Alloys of Copper With Manganese, Iron and Cobalt. Sov. Phys. 1982, 55, 287–290. [Google Scholar]


© 2018 by the authors. Licensee MDPI, Basel, Switzerland. This article is an open access article distributed under the terms and conditions of the Creative Commons Attribution (CC BY) license (http://creativecommons.org/licenses/by/4.0/).
Share and Cite
Stückler, M.; Krenn, H.; Pippan, R.; Weissitsch, L.; Wurster, S.; Bachmaier, A. Magnetic Binary Supersaturated Solid Solutions Processed by Severe Plastic Deformation. Nanomaterials 2019, 9, 6. https://doi.org/10.3390/nano9010006
Stückler M, Krenn H, Pippan R, Weissitsch L, Wurster S, Bachmaier A. Magnetic Binary Supersaturated Solid Solutions Processed by Severe Plastic Deformation. Nanomaterials. 2019; 9(1):6. https://doi.org/10.3390/nano9010006
Chicago/Turabian StyleStückler, Martin, Heinz Krenn, Reinhard Pippan, Lukas Weissitsch, Stefan Wurster, and Andrea Bachmaier. 2019. "Magnetic Binary Supersaturated Solid Solutions Processed by Severe Plastic Deformation" Nanomaterials 9, no. 1: 6. https://doi.org/10.3390/nano9010006
APA StyleStückler, M., Krenn, H., Pippan, R., Weissitsch, L., Wurster, S., & Bachmaier, A. (2019). Magnetic Binary Supersaturated Solid Solutions Processed by Severe Plastic Deformation. Nanomaterials, 9(1), 6. https://doi.org/10.3390/nano9010006