Article

Mesoporous Carbon and Ceria Nanoparticles Composite Modified Electrode for the Simultaneous Determination of Hydroquinone and Catechol

1
School of Chemistry and Environmental Engineering, Wuhan Institute of Technology, Wuhan 430205, China
2
Key Lab for Green Chemical Process of Ministry of Education, Wuhan Institute of Technology, Wuhan 430205, China
3
State Key Laboratory of Oil and Gas Reservoir Geology and Exploitation, Southwest Petroleum University, Chengdu 610500, China
*
Author to whom correspondence should be addressed.
Nanomaterials 2019, 9(1), 54; https://doi.org/10.3390/nano9010054
Submission received: 21 November 2018 / Revised: 24 December 2018 / Accepted: 27 December 2018 / Published: 3 January 2019

Abstract

:
In this work, a novel material that was based on mesoporous carbon and ceria nanoparticles composite (MC–CeNPs) was synthesized, and a modified electrode was fabricated. When compared with a bare glass electrode, the modified electrode exhibited enhanced electrocatalytic activity towards the simultaneous determination of hydroquinone (HQ) and catechol (CC), which is attributed to the large specific area and fast electron transfer ability of MC–CeNPs. Additionally, it exhibited linear response ranges in the concentrations of 0.5–500 µM and 0.4–320 µM for HQ and CC, with detection limits (S/N = 3) of 0.24 µM and 0.13 µM, respectively. This method also displayed good stability and reproducibility. Furthermore, the modified electrode was applied to the simultaneous determination of HQ and CC in tap and lake water samples, and it exhibited satisfactory recovery levels of 98.5–103.2% and 98–103.4% for HQ and CC, respectively. All of these results indicate that a MC–CeNPs modified electrode could be a candidate for the determination of HQ and CC.

1. Introduction

Hydroquinone (HQ) and catechol (CC) are two isomers of dihydroxybenzene and they are easily introduced into the environment during their extensive use as important raw materials and intermediates [1]. In addition, the United States Environmental Protection Agency (EPA) and the European Union (EU) have revealed that HQ and CC are important environmental pollutants in ecological systems, owing to the fact that they are extremely toxic to human health and ecology, even in very low concentration [2]. HQ and CC are similar in structure and properties and they often coexist in the environment, which makes their detection more difficult [3]. Accordingly, it is necessary to establish an efficient method for the simultaneous determination of these two isomers. Many methods have been developed for their determination, such as fluorescence [4], gas chromatography [5], high–performance liquid chromatography [6], chemiluminescence [7], and electrochemical methods [8]. In the last few years, electrochemical methods have attracted wide attention for their fast response, high sensitivity, low–cost, selectivity, and facile to use [9,10,11]. However, numerous challenges exist in the use of electrochemical methods for the simultaneous determination of HQ and CC. The two isomers have overlapped redox potentials on a conventional electrode [12], and another significant obstacle is that the relationship between the electrochemical signal and concentration might be nonlinear. Many excellent nanomaterials, such as Au@Pd/graphene [13], AuNPs–mesoporous silica [14], MWCNT/TiO2 [15], and carbon nano–fragments [16], have been used to modify electrodes to overcome these shortages, and the resulting electrodes have exhibited good detection limits. However, these materials have disadvantages in their complicated synthesis process and high cost. Thus, it is necessary to develop a novel material to detect HQ and CC.
Nanostructured ceria (CeO2) is often used as a catalytic medium due to its oxygen storage capacity via the Ce4+/Ce3+ redox reaction. It is also considered to be an ideal candidate for electrochemical sensors, due to its abundant active sites, oxygen vacancies, biocompatibility, and excellent catalytic performance [17]. However, ceria nanoparticles (CeNPs) tend to form aggregates that cause lower catalytic activity and worse stability [18]. In addition, poor conductivity hinders their application. Therefore, appropriate supporting substrates to anchor CeNPs are expected to enhance the dispersion and conductivity, and improve the catalytic activity.
Currently, some significant breakthroughs have been made concerning nanostructured carbon composite material in electrochemical sensors [19], catalysts [20,21,22,23], and supercapacitors [24]. Additionally, many ceria–carbon composites have been reported, such as CeO2/graphene [25], CeO2/g–C3N4 [26], and MWCNTs/CeO2 [27]. Mesoporous carbon (MC) is a kind of nanostructured porous carbon materials; it can be an excellent carrier for sensors because of its good conductivity, high porosity, high surface area, high corrosion resistance, and easy handling. When compared with other carbon materials, such as graphene [28] and carbon nanotubes [29], MC could have better electrocatalytic ability and electrochemical properties because of its unique pore structure, which is conducive to mass transfer [30,31]. However, few studies have investigated electrochemical sensors using ceria and MC. Thus, it is necessary to synthesis the composite material and investigate its electrochemical performance.
In this work, MC–CeNPs were synthesized via the evaporation induced self-assembly (EISA) approach and characterized by scanning electron microscopy, transmission electron microscope, X-ray diffraction, Raman spectra, nitrogen adsorption–desorption, and X-ray photoelectron spectroscopy. The obtained composite was dispersed in chitosan (CS) solution and dropped on a glassy carbon electrode (GCE) to prepare the sensitive sensor, which exhibited good potential for separation and differentiation for the simultaneous detection of HQ and CC. Scheme 1 exhibits the overall preparation of MC–CeNPs modified electrode. To our best knowledge, this is the first time that HQ and CC have been detected using mesoporous carbon and ceria nanocomposites. The sensing platform exhibited wide linear response ranges, low detection limits, and suitability for practical applications with real water samples due to the large specific area, excellent electrocatalytic performance, and fast electron transfer ability of the nanostructured composite. Furthermore, the selectivity and storage stability of the modified electrode were studied and found to have satisfactory results.

2. Results and Discussion

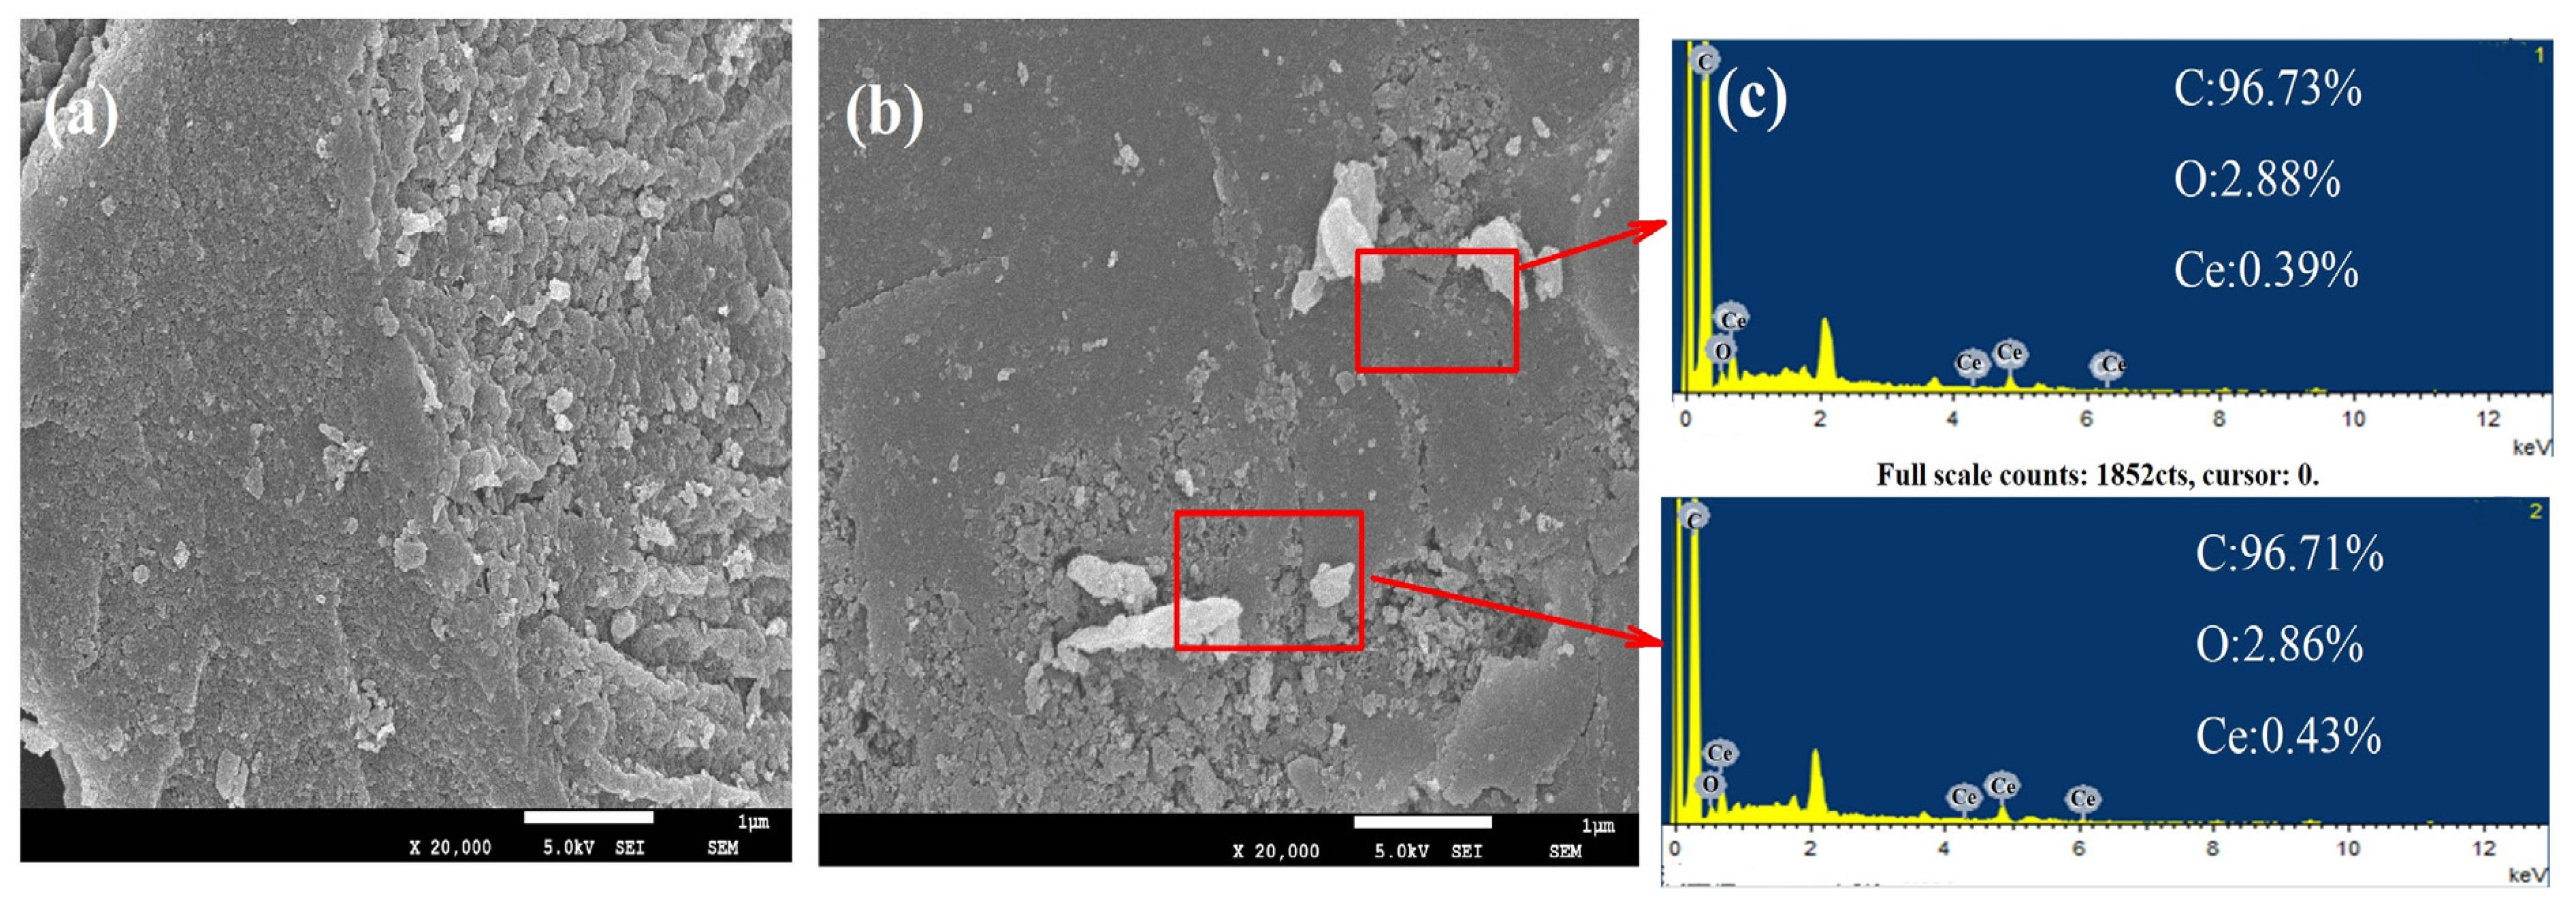
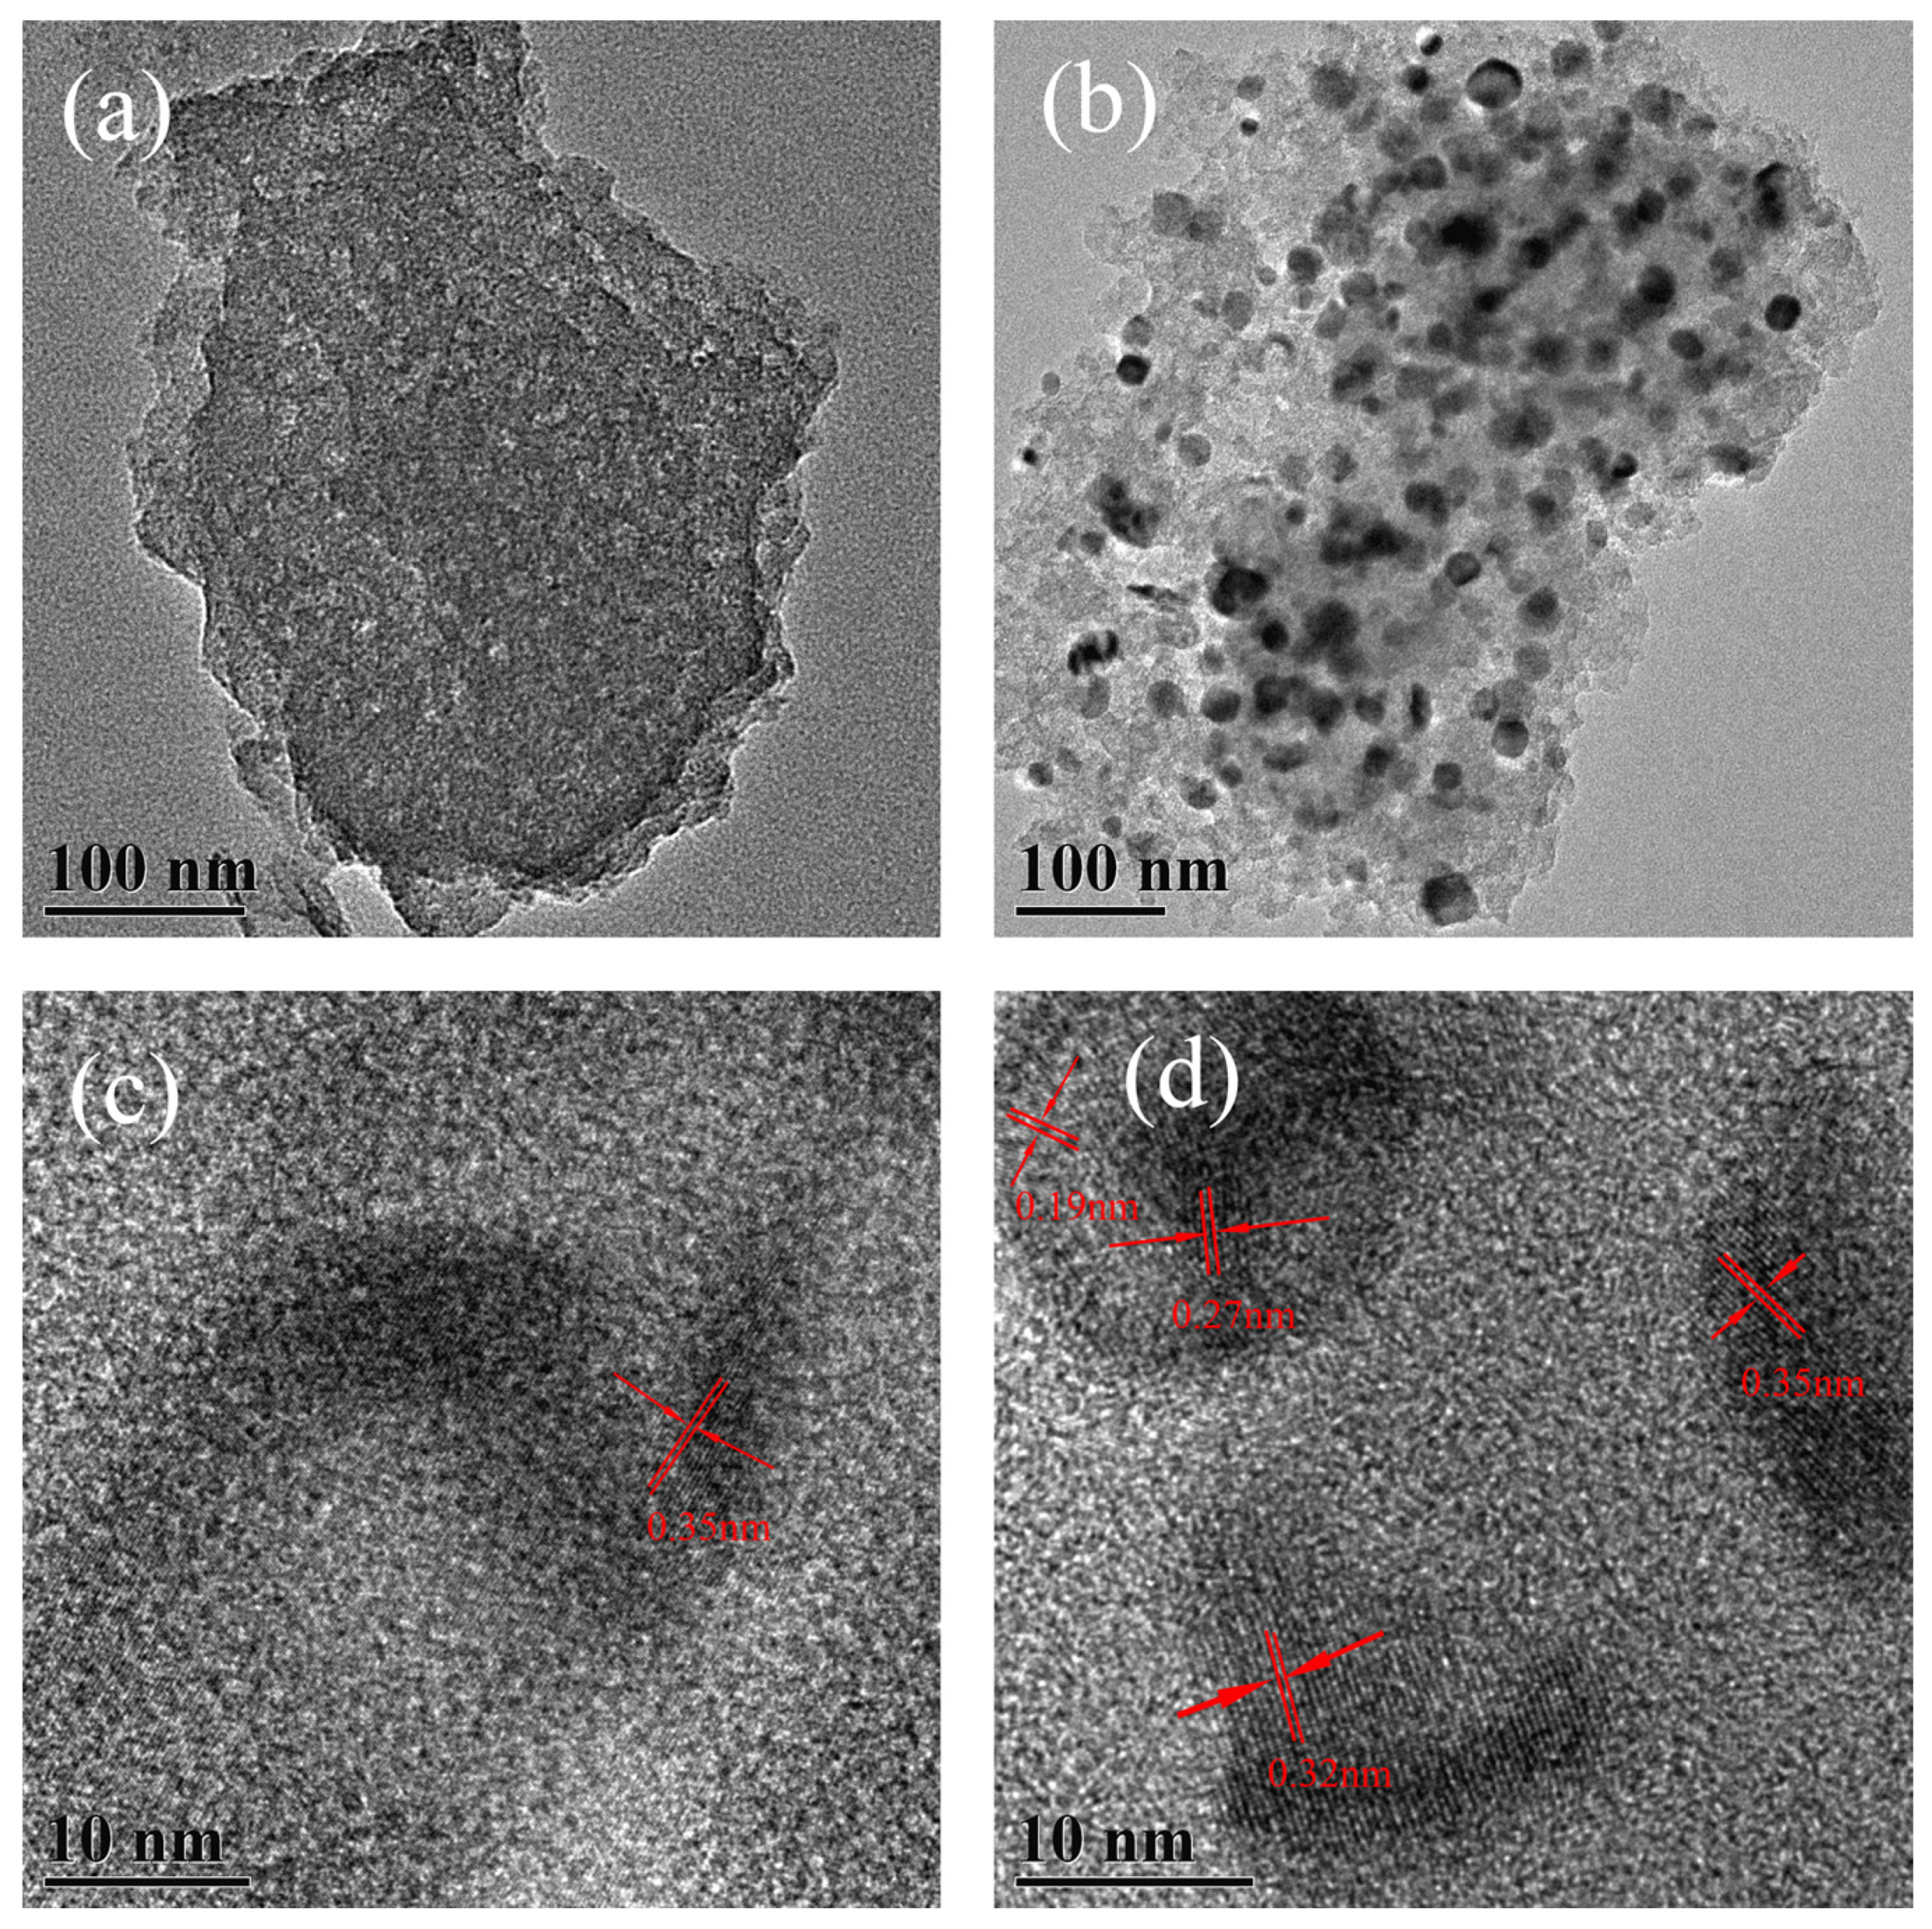
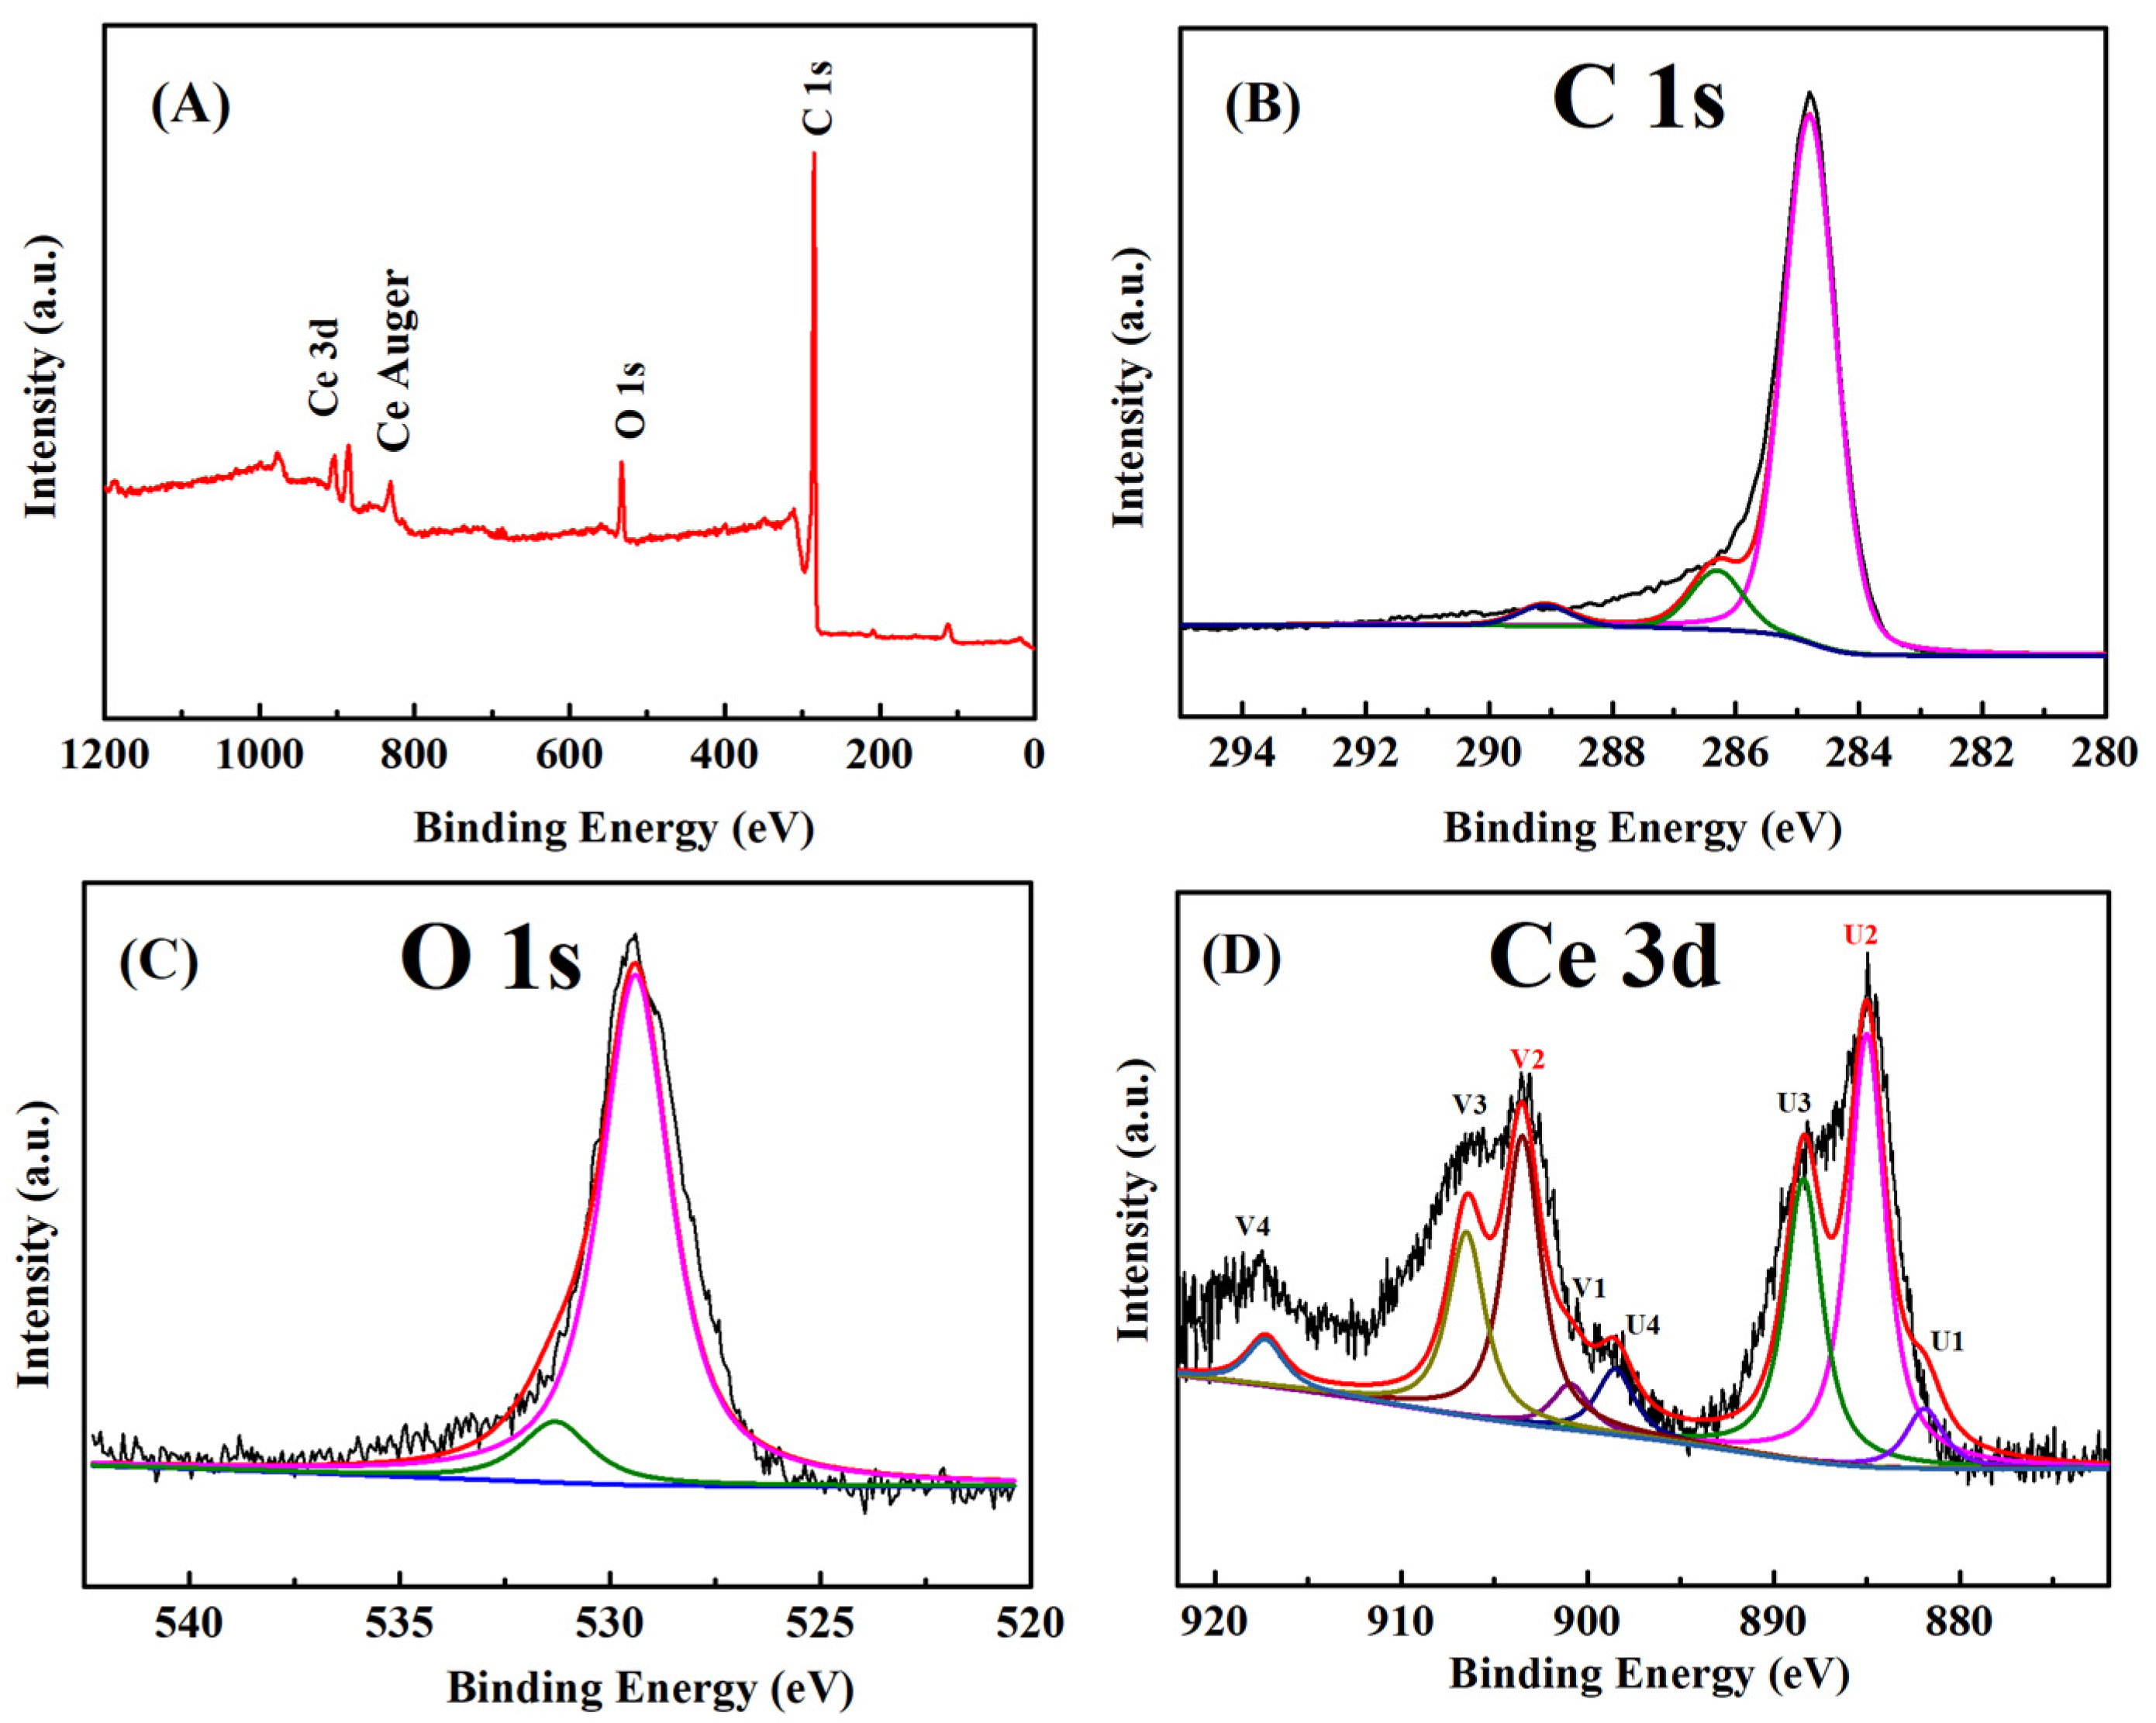
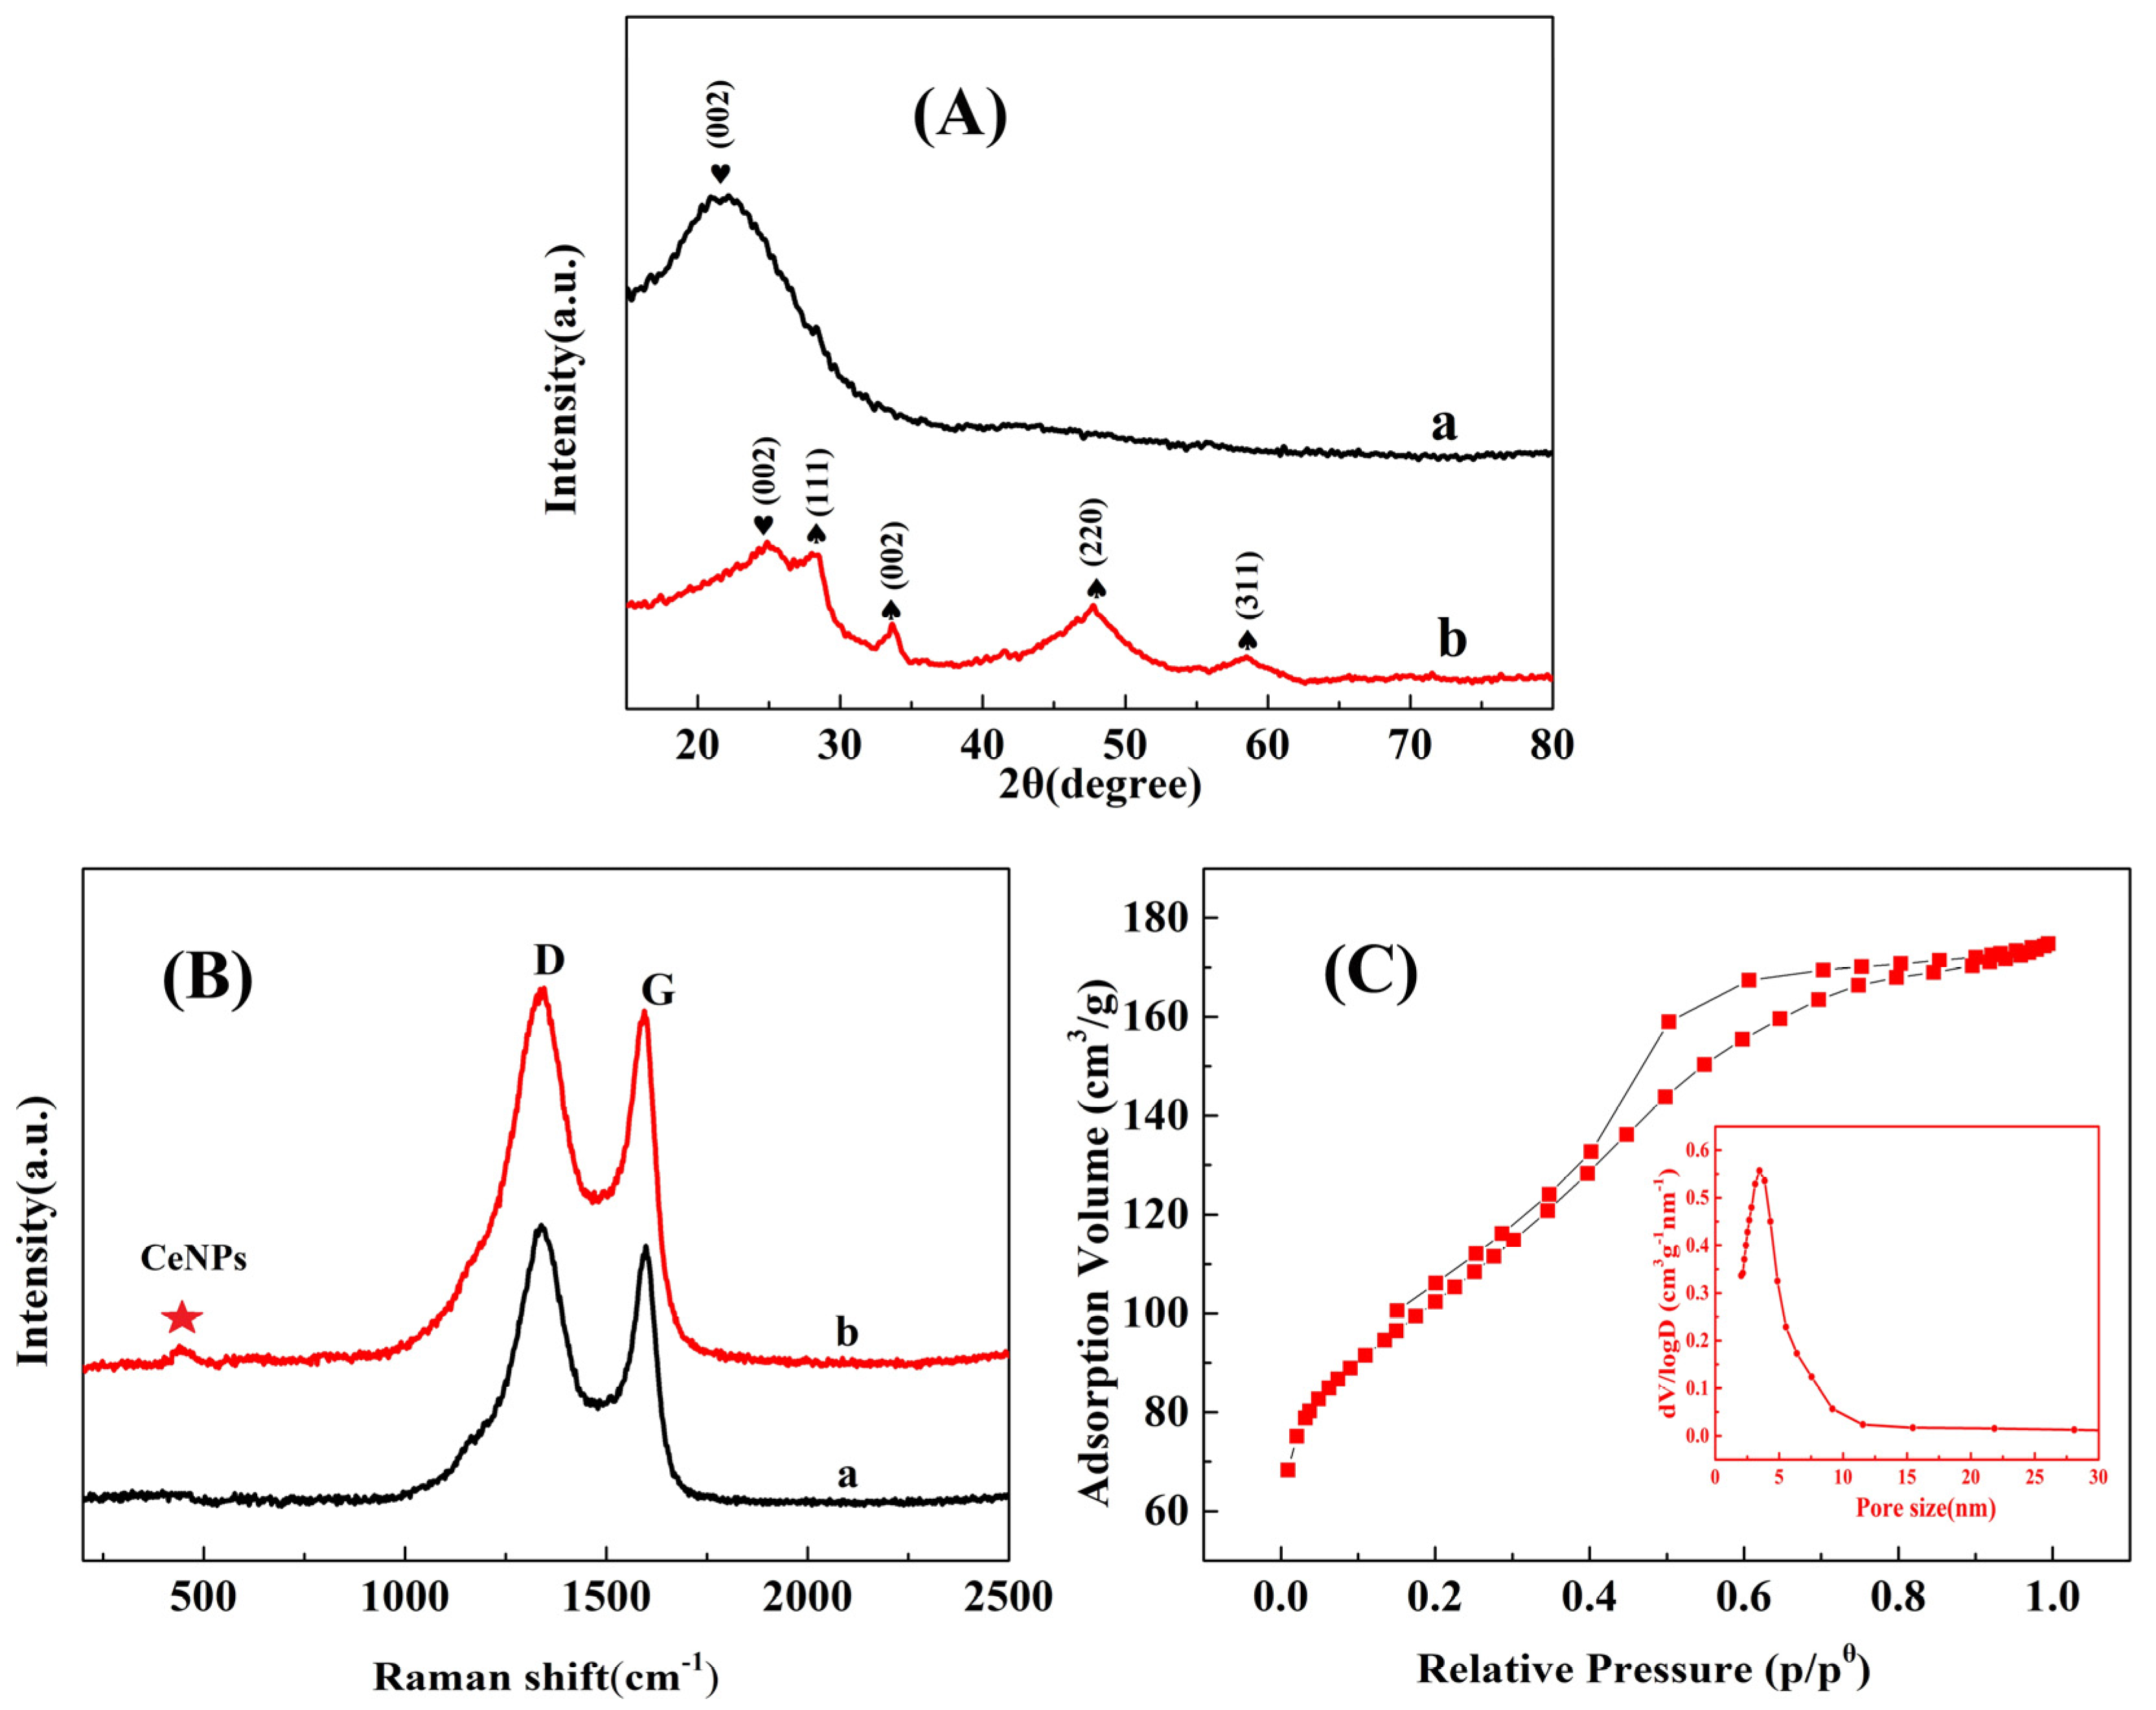
2.1. Characterization of MC–CeNPs

The surface morphology of the composite and its individual component was characterized using FESEM and it is shown in Figure 1 (each scale bar is 1 μM). As illustrated in Figure 1a, MC exhibited a layered structures with wrinkles. Figure 1b depicts that MC–CeNPs tend to form a more whole structure when compared with the MC, and few layers could be observed. Furthermore, the composition of elements was tested by EDX (Figure 1c). Only Ce, C, and O could be observed, suggesting that the MC–CeNPs were of high purity.
The dispersion state and microstructure were further investigated by TEM. Figure 2a shows MC with stacked thin sheets structure with lots of pores. CeNPs were dispersed uniformly on the MC sheets (Figure 2b), suggesting that MC could well act as a support for CeNPs, and an embedded structure was formed. An HRTEM image (Figure 2c) depicts the lattice fringes of MC exhibiting interplanar spacing of 0.35 nm [32], which was attributed to the graphite carbon lattice distance (002) [33]. Moreover, an HRTEM image of the MC–CeNPs (Figure 2d) exhibited the clear lattice fringes (111), (200), and (220) of cubic phase ceria with interplanar spacing of 0.33, 0.27, and 0.19 nm [34], respectively. The crystalline structures of the materials were checked using XRD measurement. In Figure 3A, curve (a) showed the diffraction peak of the graphite (002) at 2θ = 23.6° [35]. In addition, curve (b) exhibited the diffraction peaks at 2θ = 29.2°, 33.7°, 48.1°, and 56.9°, attributed to (111), (200), (220), and (311) planes of the cubic fluorite crystal structure of CeO2 (JCPDS 81-0792) [36], and no impurity was detected. The result corresponded with TEM, both proved that the MC–CeNPs were prepared successfully and they retained a well-defined crystal structure.
The Raman spectra of the MC (a) and MC–CeNPs (b) are shown in Figure 3B. The Raman spectra of MC exhibited two prominent peaks (D and G bonds) for graphite carbon (1338 and 1398 cm−1) [37]. In addition, a new peak in 457 cm−1 could be observed for MC–CeNPs, which was attributed to the F2g vibration of the anchored CeNPs [38]. Nitrogen adsorption–desorption isotherms and the pore size distribution curve of MC–CeNPs are shown in Figure 3C. It could be found that the curve slowly increases at low relative pressure of 0.10–0.40, then a sharp increase occurs in the range of 0.40–0.80, which gives the type–IV shape [39]. Relevantly, the existence of mesopores is supported by the hysteresis of the desorption curve and the sharp increase in the adsorption capacity in the medium relative pressure region. Besides, Brunauer–Emmett–Teller (BET) measurements revealed that the specific surface area of MC–CeNPs was 362.4 m2·g−1 and the clear pore size distribution was concentrated on 3.5 nm.
XPS was employed to analyze the MC–CeNPs composition and the binding state of the elements. The XPS survey of the nanocomposite (Figure 4A) demonstrates three elements Ce, C, and O in the composites; the peak appearing at 831.7 ev belongs to the Auger peak of Ce. As shown in Figure 4B, there were three peaks centered at 284.8, 286.3, and 289.3 eV in the C 1s XPS spectrum, which assigned to C=C, C–O, and C=O [40]. The O1s spectrum (in Figure 4C) exhibited two peaks at 529.6 and 531.6 eV, which were respectively ascribed to the oxygen species of CeO2 and the adsorbed OH- species on the surface [41]. The spectrum of Ce 3d was assigned to the 3d5/2 state (labelled U) and the 3d3/2 state (labelled V). The Ce 3d3/2 displayed four peaks at 882.3, 885.1, 888.4, and 898.6 eV, while 3d5/2 showed four other peaks at 901.1, 904.8, 907.4, and 916.8 eV (in Figure 4D) [42]. The peaks at 885.1 (U2) and 904.8 (V2) eV belonged to Ce3+, and the other peaks were ascribed to Ce4+, suggesting the existence of Ce3+ in MC–CeNPs with oxygen vacancies. This might be ascribed to CeNPs interacting with the MC sheets, and with a certain amount of Ce4+ turned into Ce3+ and some oxygen vacancies possibly produced.

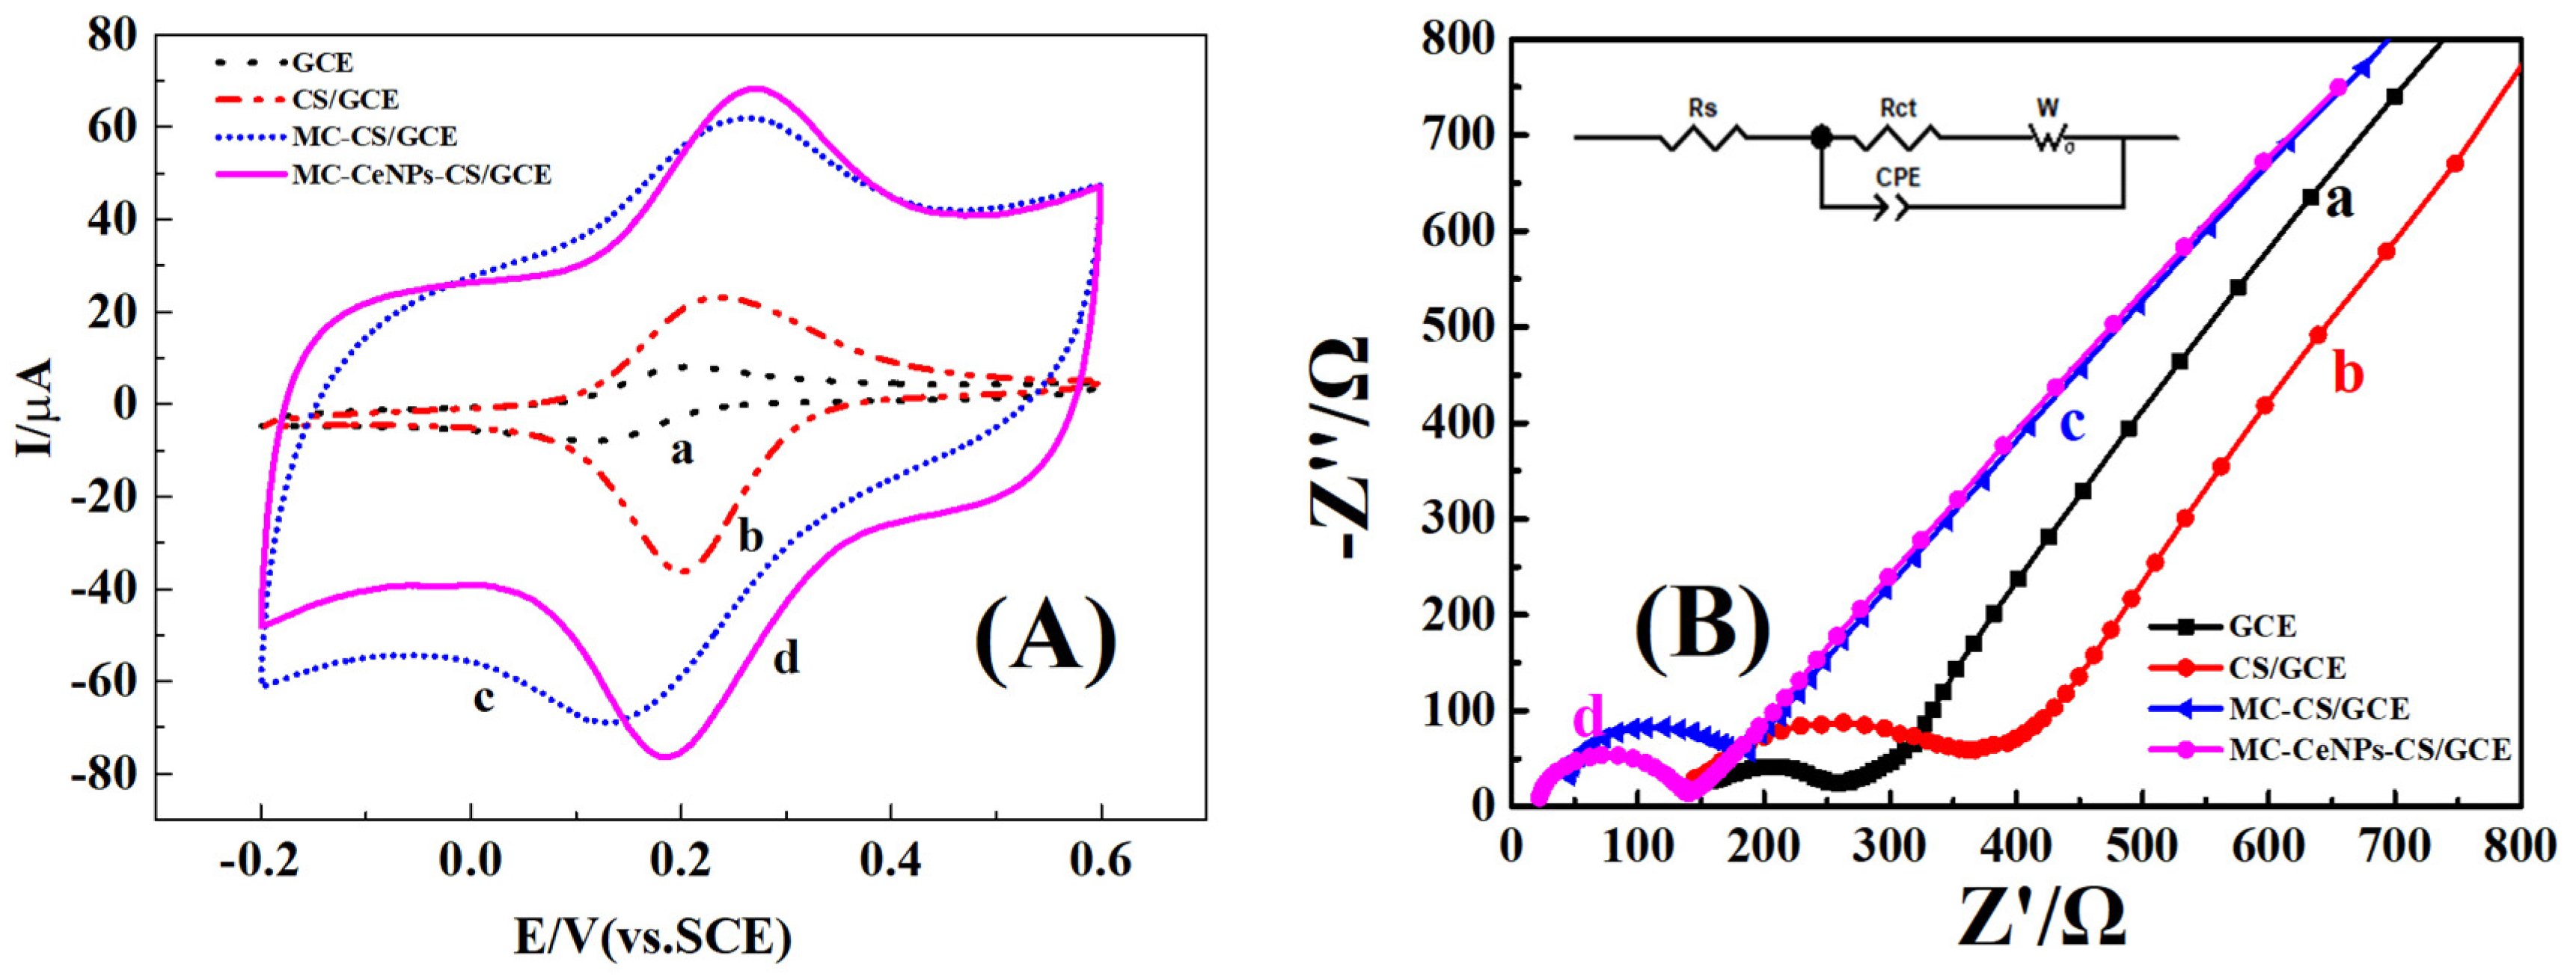
2.2. Electrochemical Behavior of the Modified Electrodes

Cyclic voltammetry (CV) was applied to investigate the electrochemical responses of different modified electrodes in 1 mM K3Fe(CN)6/K4Fe(CN)6 containing 0.1 M KCl. As shown in Figure 5A, a higher pair of redox peaks was observed for MC–CeNPs–CS/GCE as compared with other electrodes, which indicated that MC–CeNPs–CS/GCE had the larger real area and more active sites [43]. Furthermore, the electron transfer capabilities of different modified electrodes were checked using electron impedance spectroscopy (EIS). Figure 5B shows the EIS curves of GCE (a), CS/GCE (b), MC–CS/GCE (c), and MC–CeNPs–CS/GCE (d), with a frequency range of 105 to 0.01 Hz. The inset in Figure 5B exhibits the Randles equivalent circuit model [44]. In the equivalent circuit, Rct is the electron–transfer resistance, Rs is the bulk electrolyte resistance, CPE is the interfacial capacitance, and W is the Warburg resistance, which is related to the diffusion of the electrolyte on the electrode surface. The semicircle in the higher-frequency regions reflects Rct and the straight line in the lower-frequency region corresponds to the diffusion process [45]. The Rct values of the different electrodes were in the order of MC–CeNPs–CS/GCE (119.7 Ω) < MC–CS/GCE (148.6 Ω) < GCE (182.4 Ω) < CS/GCE (301.4 Ω). The result indicated that the MC–CeNPs–CS/GCE had higher conductivity and a faster electron transfer process.

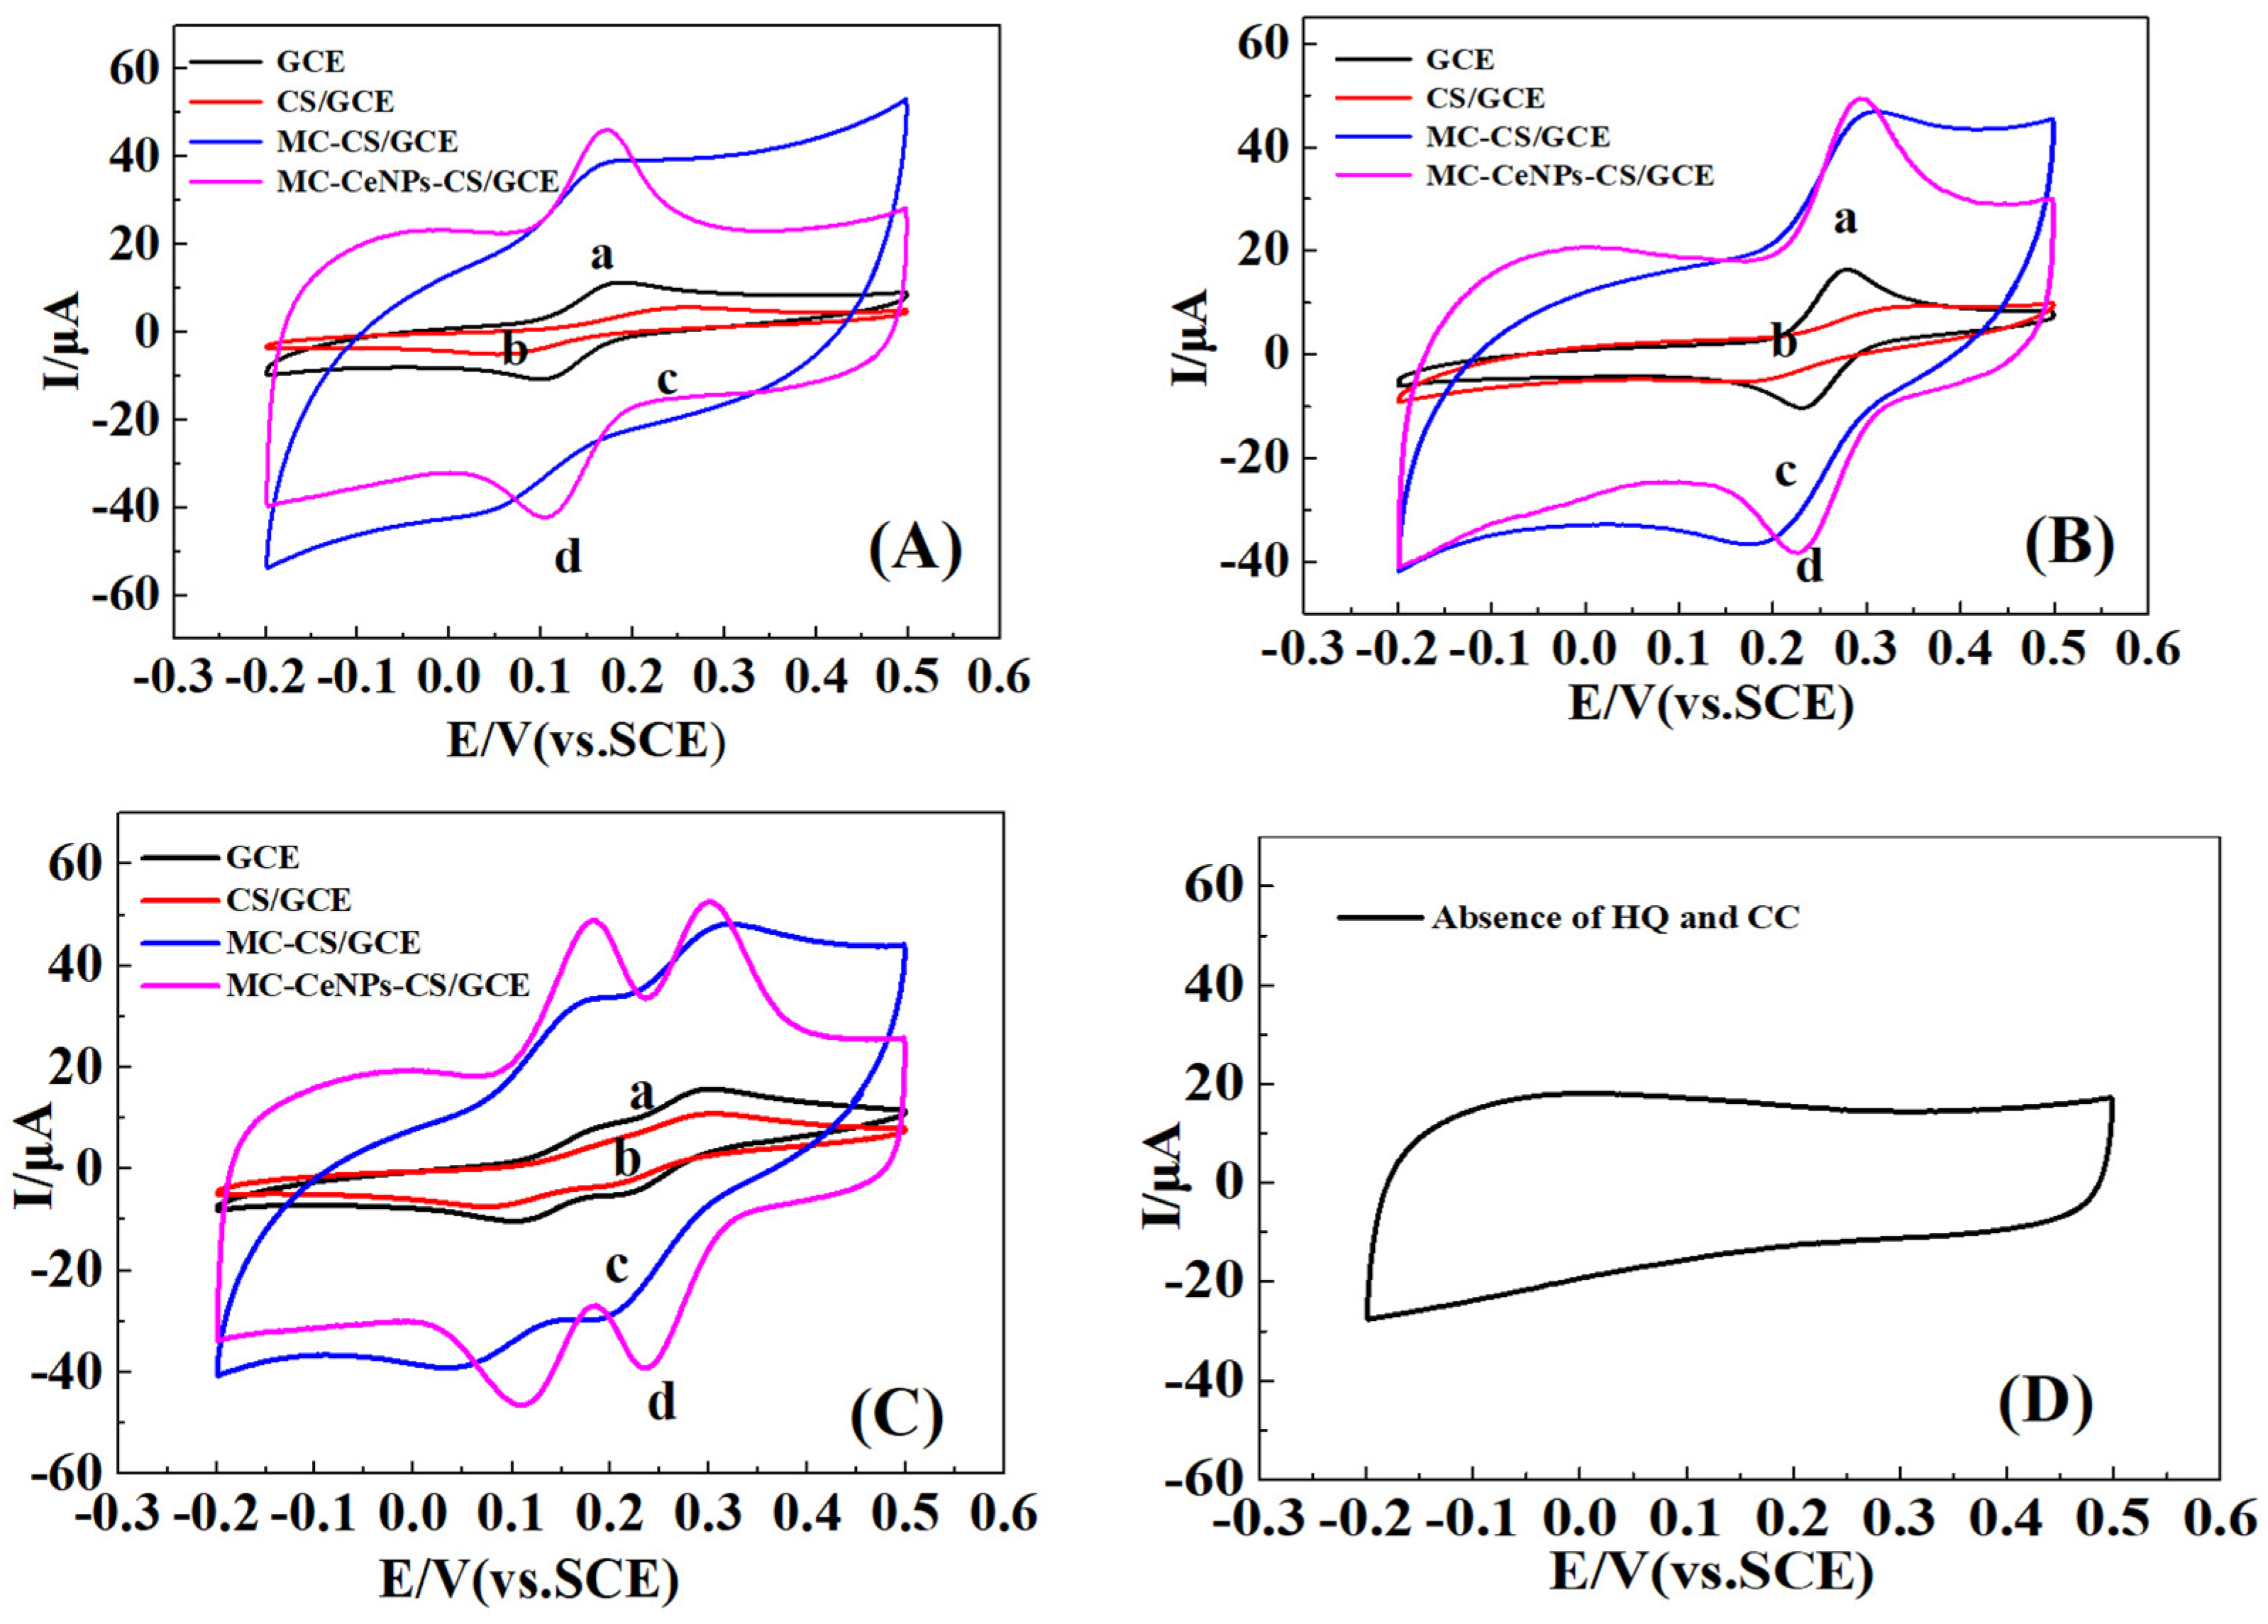
2.3. Electrochemical Behaviors of HQ and CC
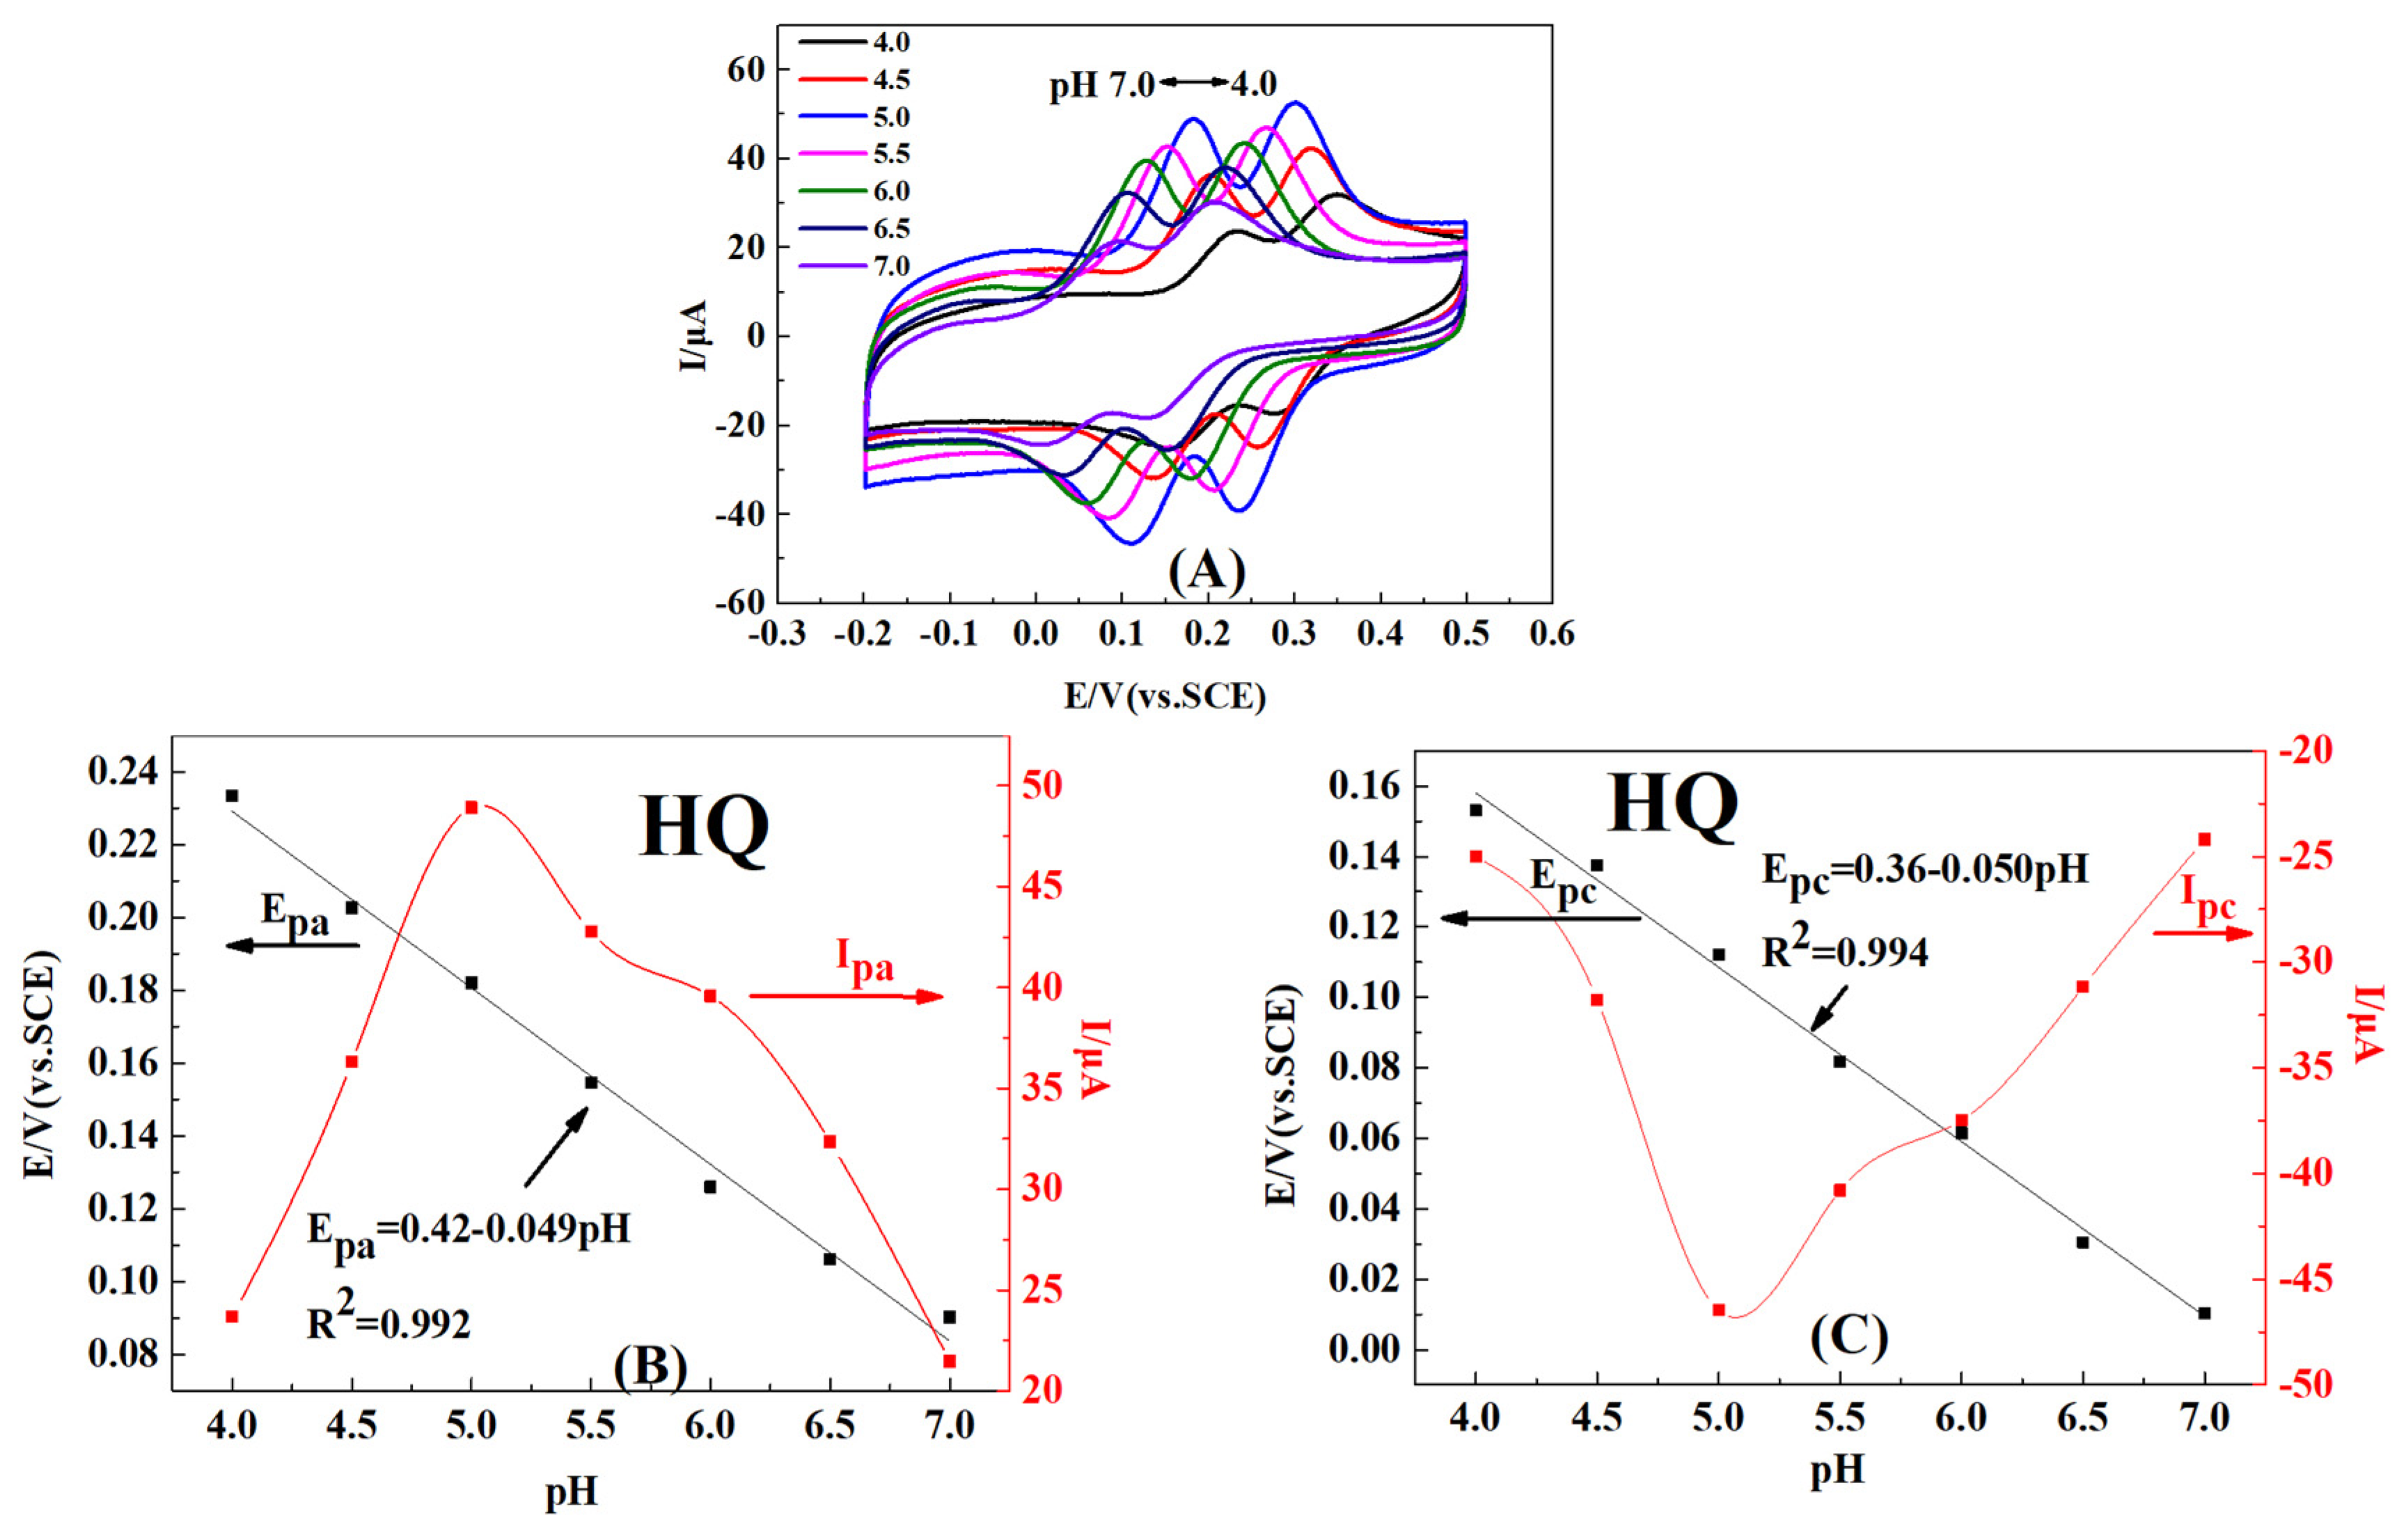
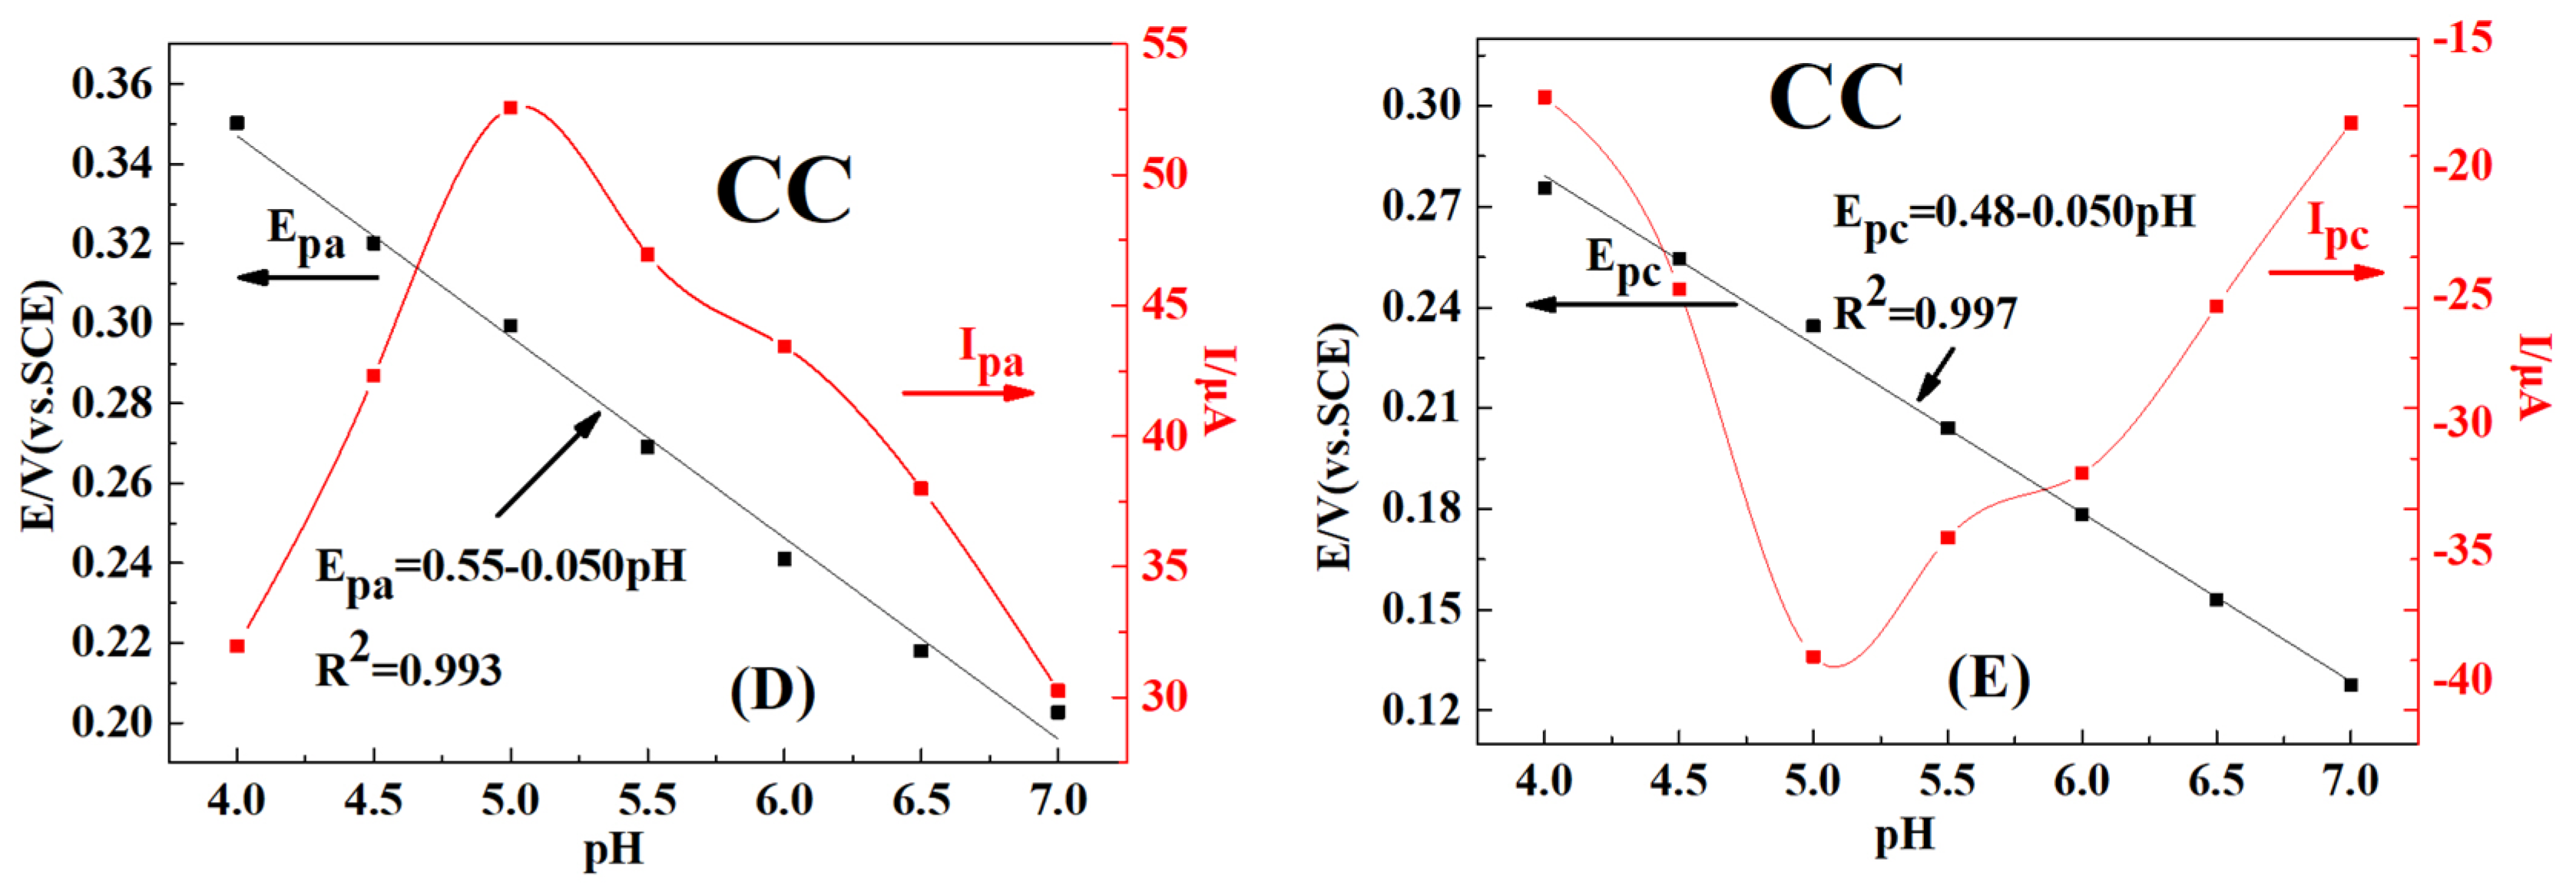
To investigate the potential applications of the different materials, the electrochemical behaviors of HQ and CC were also studied through the CV method. Figure 6A–C show the CV responses of GCE (a), CS/GCE (b), MC–CS/GCE (c), MC–CeNPs–CS/GCE (d) in 0.1 M CBS (pH 5, containing 0.2 mM of HQ, CC, and their mix solution) at 0.1 V s−1(E: −0.2 to 0.5 V (vs. SCE)), respectively. It can be observed that the CS/GCE exhibited the poorest redox peaks in all solutions. Furthermore, the current peaks of the independent presence of HQ and CC on GCE were relatively obvious, but they overlapped in the mix. However, the peak currents that were obtained from the MC–CS and MC–CeNPs–CS modified electrodes increased significantly, and the redox peaks were easy to distinguish. Especially, MC–CeNPs–CS/GCE exhibited well-defined redox currents and selectivity for the analytes, owing to the excellent conductivity, large specific surface area, and prominent catalytic ability of MC–CeNPs. In addition, the behavior of MC–CeNPs–CS/GCE in the absence of HQ and CC was investigated (Figure 6D) and no redox peak was observed, which demonstrated MC–CeNPs–CS did not interfere with the experiment and could be a suitable material for the determination of HQ and CC.

2.4. Effect of pH

The effect of pH on the simultaneous determination of HQ and CC was studied via CV. As depicted in Figure 7A, the CV response of 0.2 mM HQ and CC was recorded; in 0.1 M CBS with different pH values (4.0 to 7.0) at scan rate of 0.1 V s−1; the cathode peak potential (Epc) and anode peak potential (Epa) shifted negatively, indicating that protons were involved in the electrochemical redox process [46]. Furthermore, the Epa and Epc exhibited a linear relationship with increasing pH, expressed as Epa (V) = 0.42–0.049 pH (R2 = 0.992) and Epc (V) = 0.36–0.050 pH (R2 = 0.994), Epa (V) = 0.55–0.050 pH (R2 = 0.993), and Epc (V) = 0.48–0.050 pH (R2 = 0.997) for HQ and CC, respectively. In addition, these slopes were close to the ideal Nernst theoretical value (0.059 V, 25 °C), implying that an equal amount of proton and electron transfer occurred in the electrochemical reaction [47].
In addition, it can be seen from Figure 7B–E that the current signal (the cathode peak current Ipc and oxide peak current Ipa) first increased and reached its maximum value at pH 5 and then decreased with a further increase of the pH value. The pKa values of HQ and CC are 9.85 and 9.4; at higher pH, these two molecules were deprotonated and converted to anions. Furthermore, the functional groups of CS (–NH2) also became deprotonated, which caused the modified electrodes to possess negative charges. Thus, the electrostatic repulsion between electrode and analytes would decrease the adsorption on the electrode. Consequently, the peak currents decreased with increasing pH value. The maximum current responses of HQ and CC appeared at pH 5, hence pH 5 was selected as an optimum condition for the following experiment.

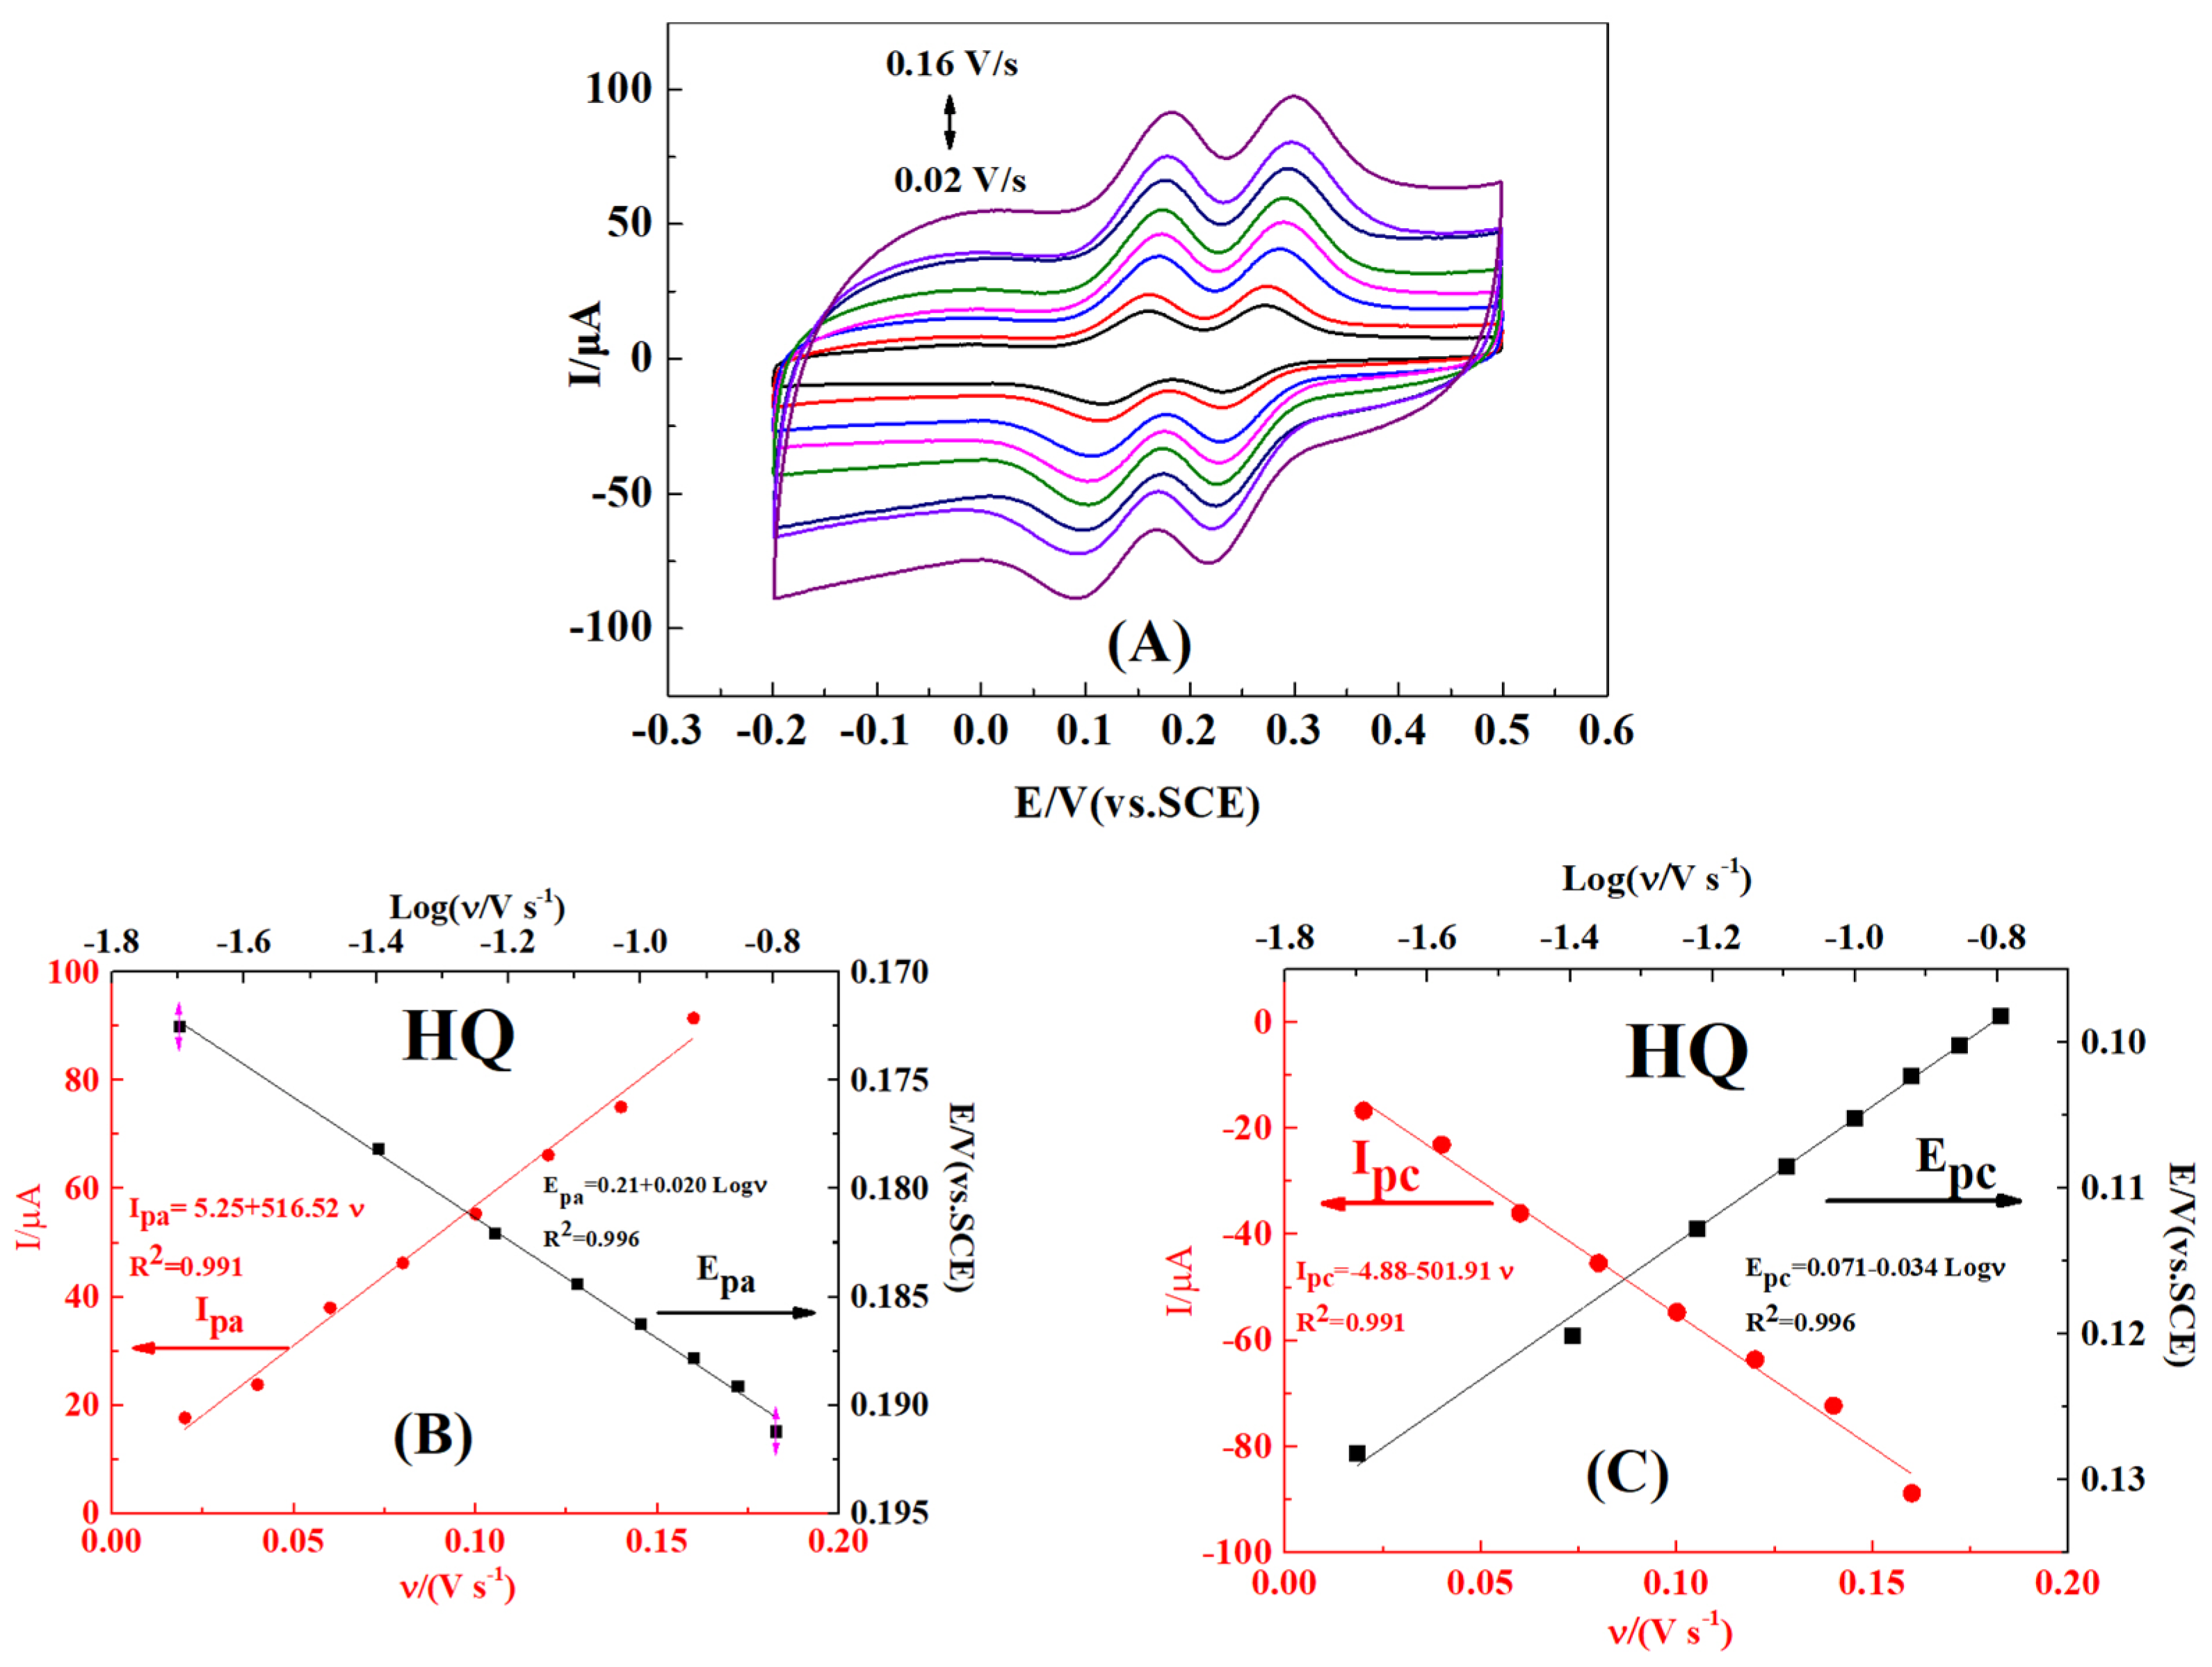
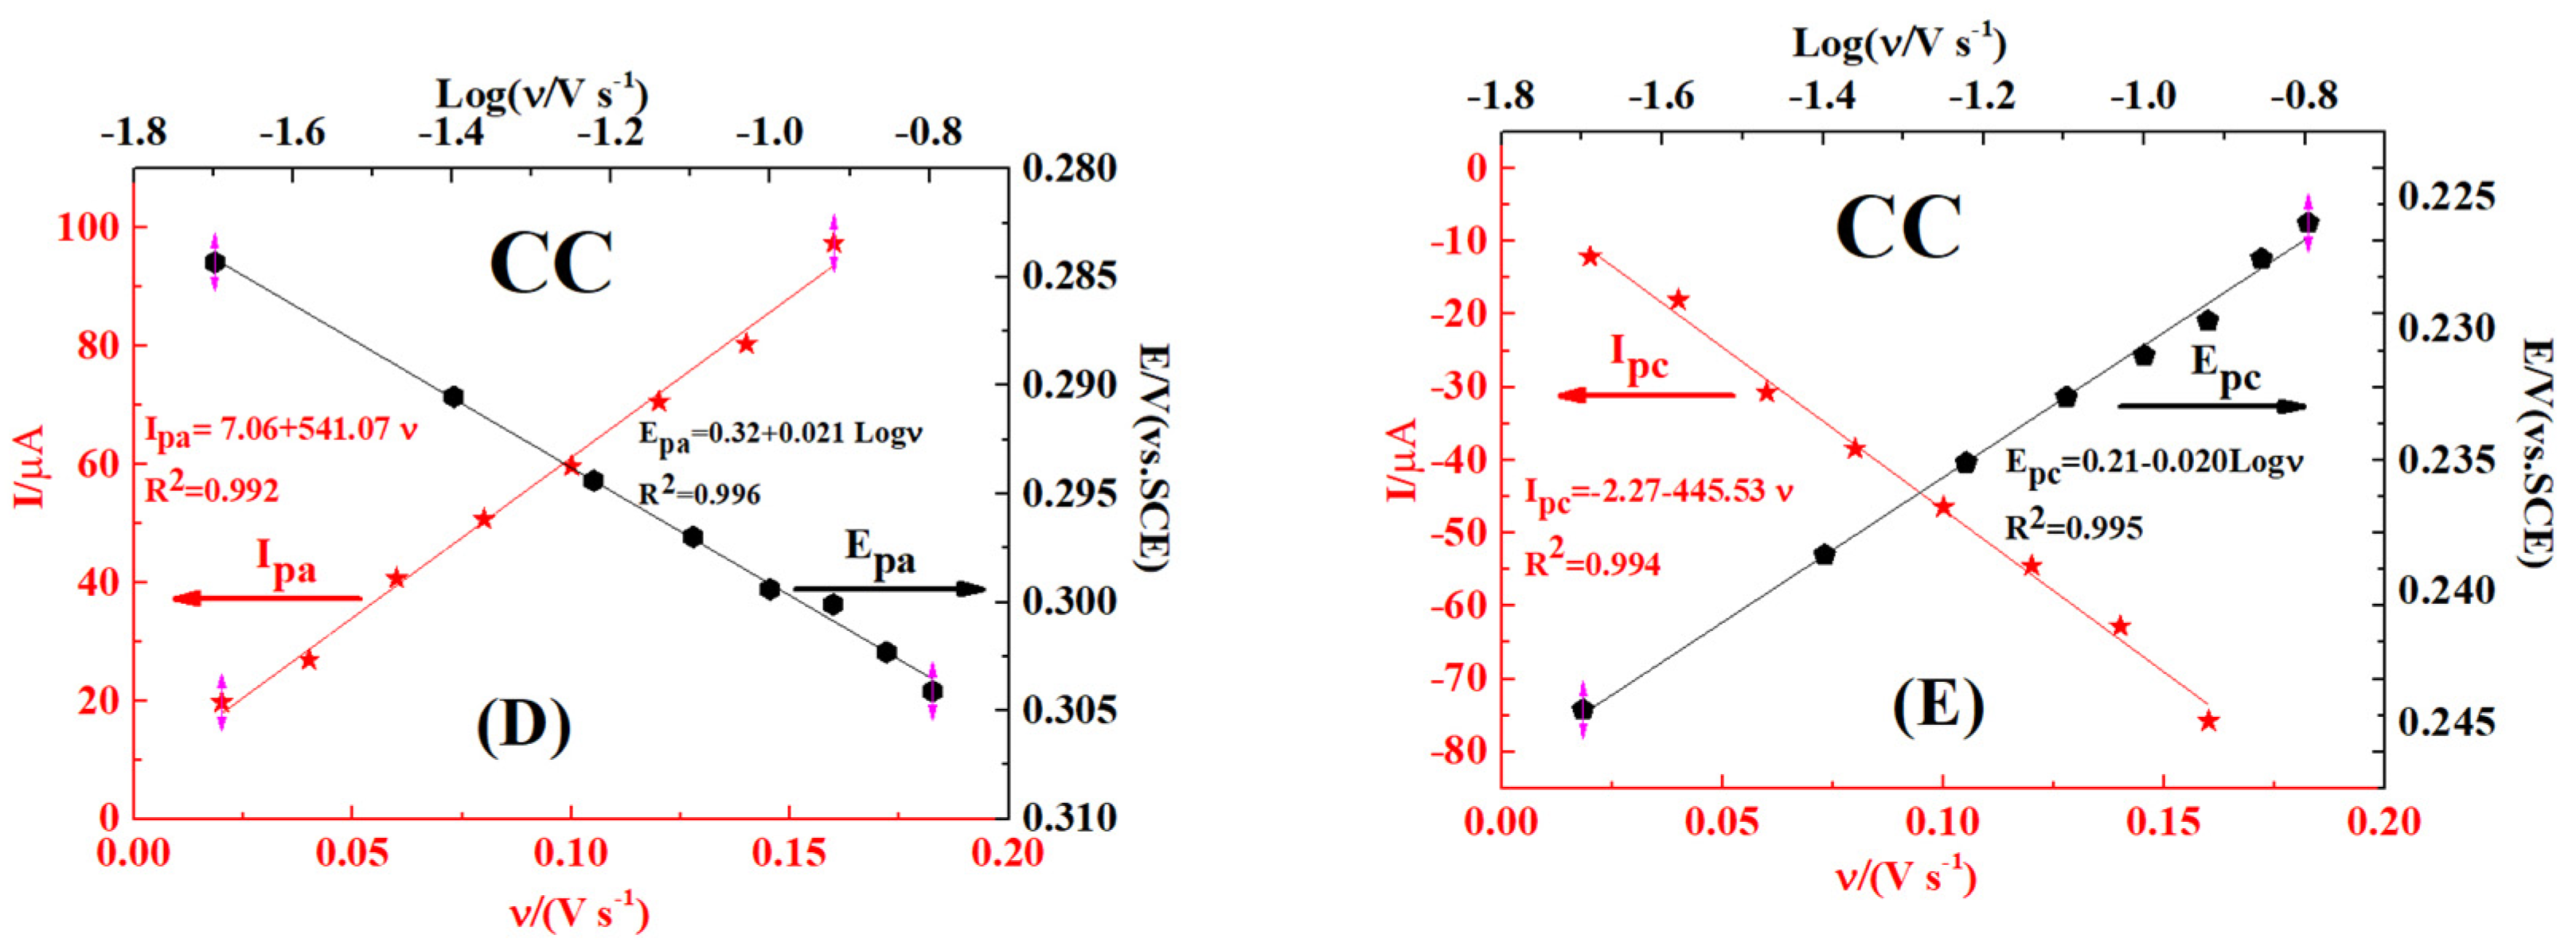
2.5. Effect of Scan Rate

To investigate the reaction mechanism of HQ and CC during the electrochemical process, the effect of scan rate was further studied via CV with different scan rates (0.02, 0.04, 0.06, 0.08, 0.1, 0.12, 0.14, 0.16 V s−1). As displayed in Figure 8A, it can be observed that the peak current signals of HQ and CC were enhanced with increasing scan rates, and that Epa shifted positively and Epc moved negatively.
Furthermore, Figure 8B–E (the red line region) show the linear relationship between Ip and increasing scan rates (ν), which can be expressed as Ipa = 5.25 + 516.52 ν (R2 = 0.991) and Ipc = 4.88–501.91 ν (R2 = 0.991) for HQ and as Ipa = 7.06 + 541.07 ν (R2 = 0.992) and Ipc = 2.27–445.53 ν (R2 = 0.994) for CC. These relationships indicate that the electrochemical process of HQ and CC on MC–CeNPs–CS/GCE is typical adsorption–controlled [48]. Laviron theory [49] was used to study the reaction mechanism:
Ip   =   nFQ ν / 4 RT
where n is the number of electrons, F is the Faraday constant (96485 C mol−1), Q is the electric quantity, R is the universal gas constant (8.314 J K−1 mol−1), and T is the temperature in kelvin. The n can be calculated, the values are 1.69 and 1.85 for HQ and CC, indicating that the reaction of HQ and CC in modified electrode is complex, which is not a simple two–electron process [46,47,48].
In addition, Figure 8B–E (the black line region) depict that the relationship between Ep and the corresponding log ν. The linear regression equations were Epa = 0.21 + 0.020 log ν (R2 = 0.996) and Epc = 0.071–0.034 log ν (R2 = 0.996), Epa = 0.32 + 0.021 log ν (R2 = 0.996) for HQ, and Epc = 0.21–0.020 log ν (R2 = 0.995) for CC. The electrochemical parameters, such as charge transfer coefficient (α) and electron transfer coefficient (Ks), were calculated by following Laviron’s eq [31,49]
E pa   =   E θ   + ( 2.3 RT ( 1 α ) nF ) log   ν  
  E pc   =   E θ ( 2.3 RT α nF ) log   ν  
logk s   =   α log ( 1 α ) + ( 1 α ) log α log ( RT nFv ) ( 1 α ) α nF Δ E 2.3   RT
Here, ΔE represents the potential separation between Epc and Epa; the other notation is as previously defined. Thus, the values of α and ks were estimated to be 0.45, 0.69 s−1 for HQ, and 1.09, 1.05 s−1 for CC. These ks values are better than those for sensors that are based on CS [50,51], indicating that HQ and CC have faster electron transfer kinetics on MC–CeNPs–CS/GCE.

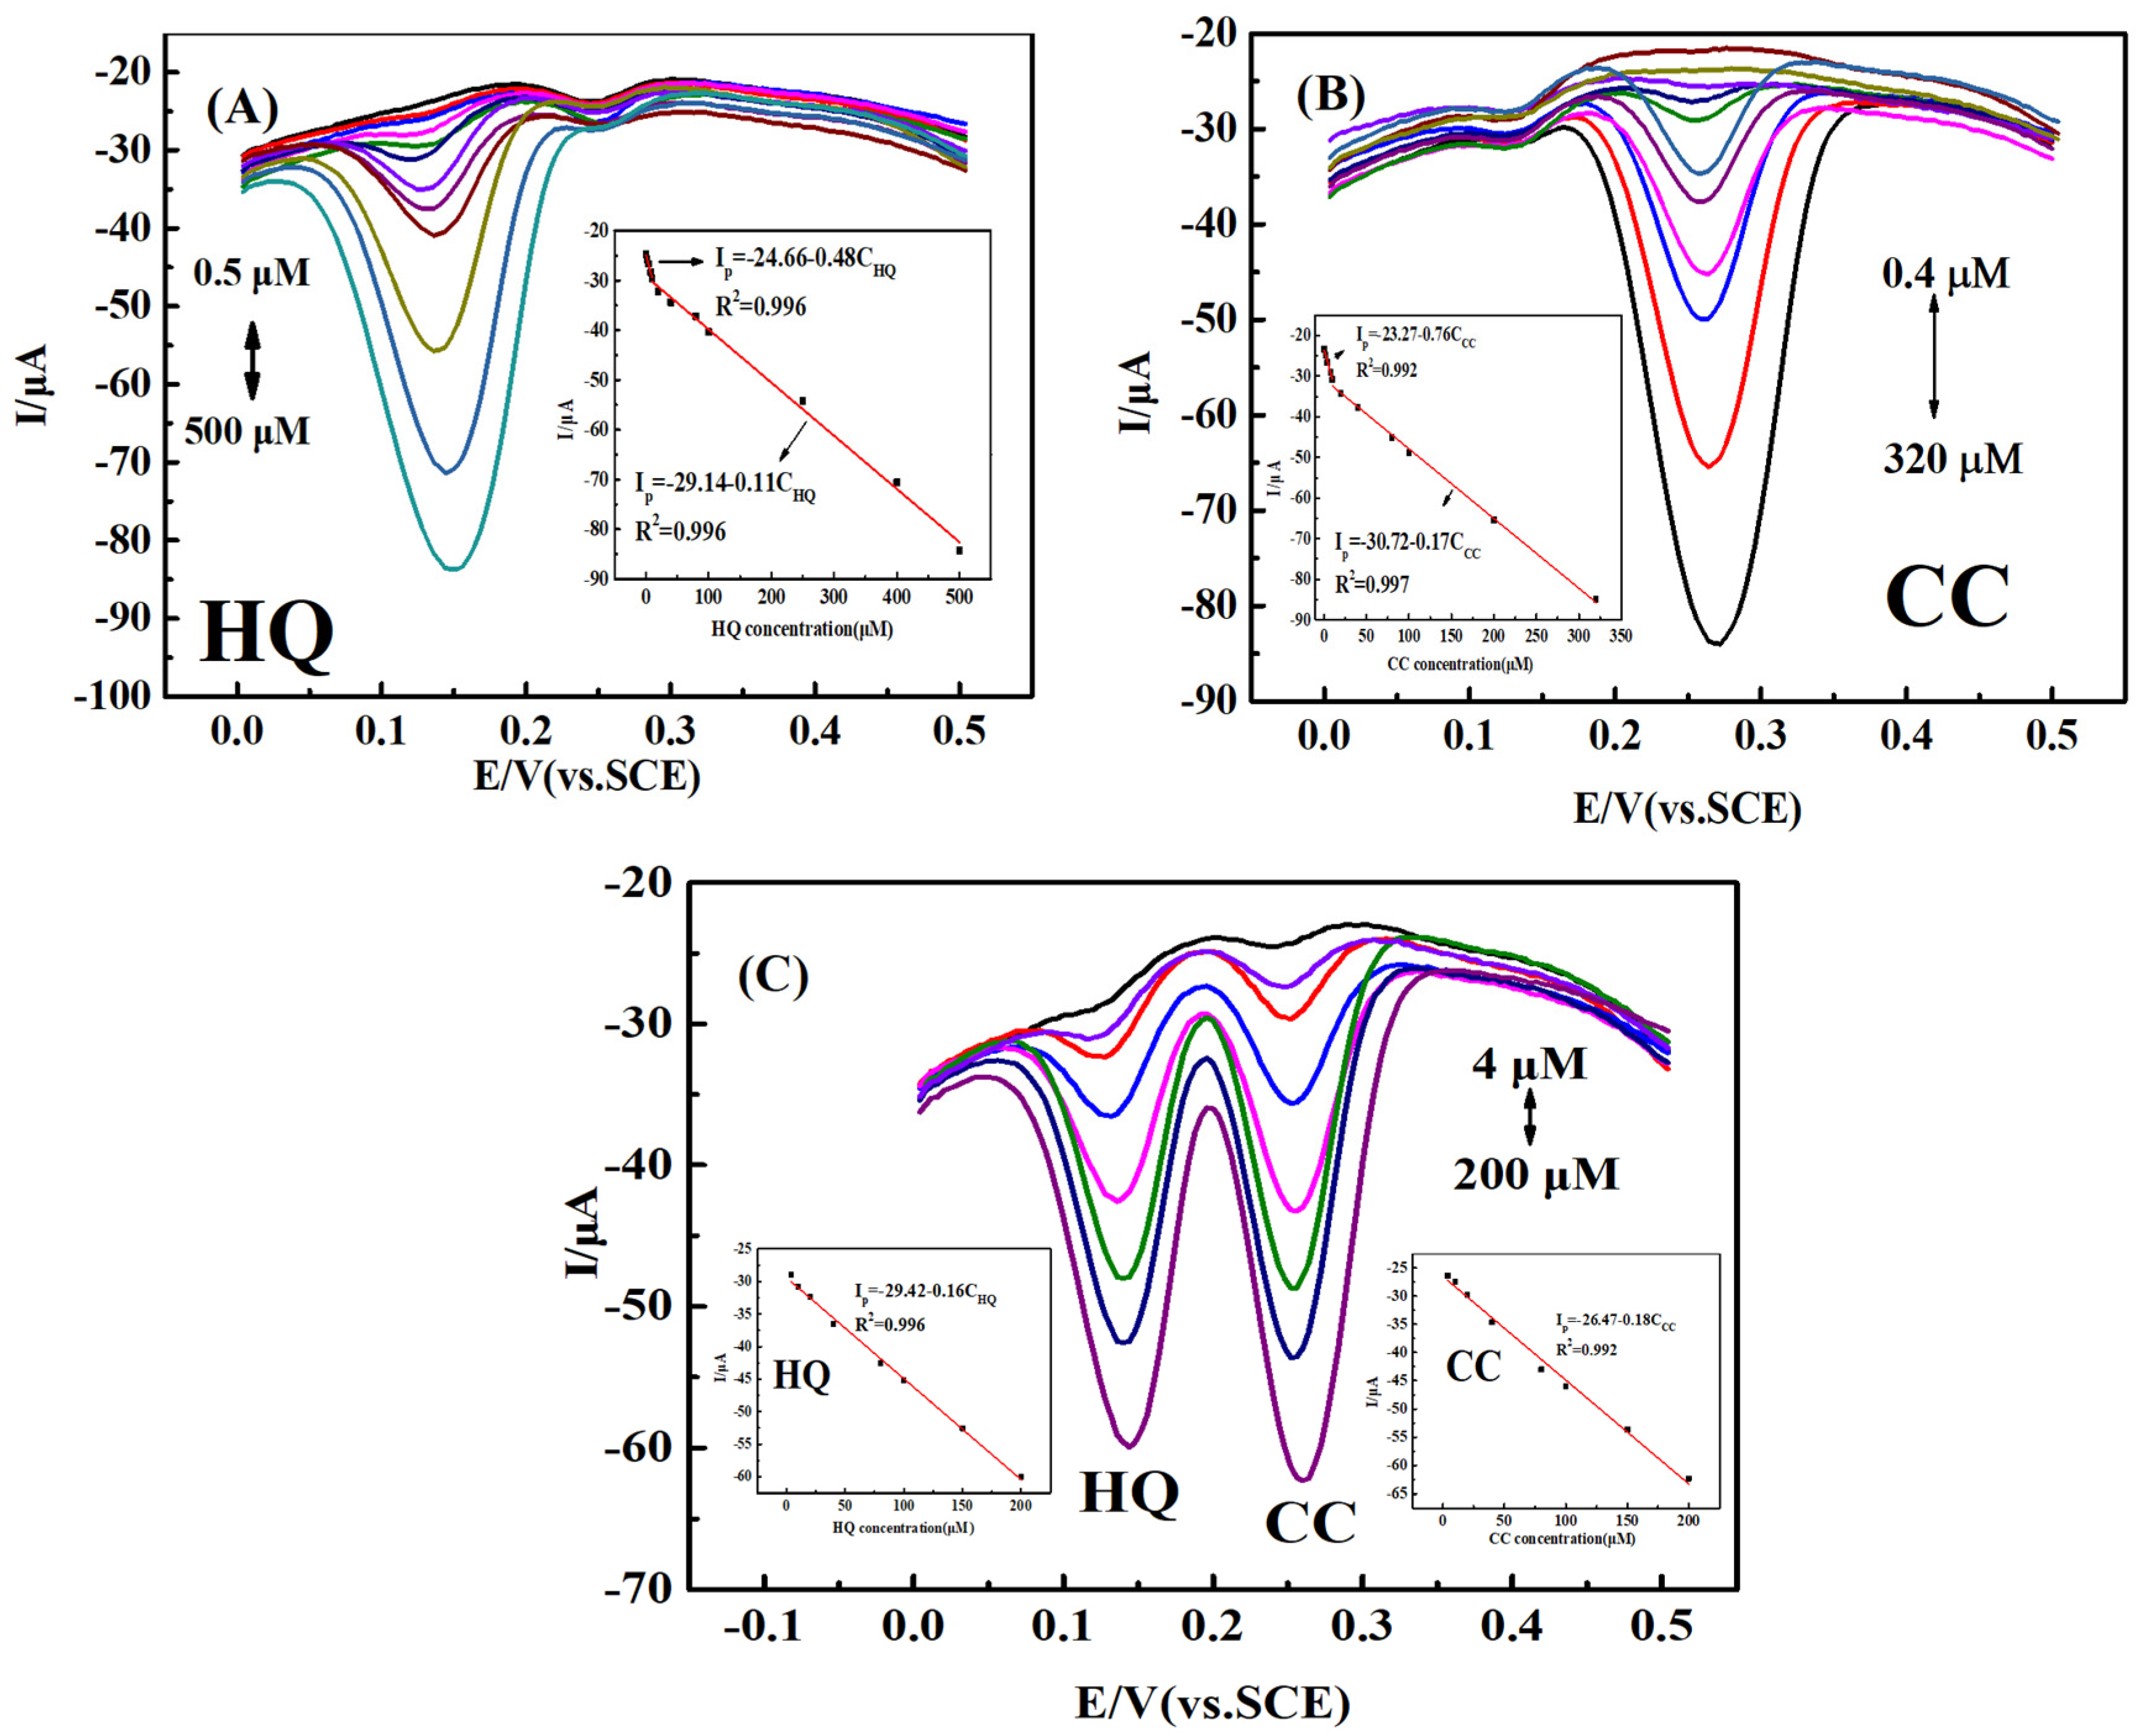
2.6. Simultaneous Determination of HQ and CC

Differential pulse voltammetry (DPV) was carried out to record the peak currents of HQ and CC on MC–CeNPs–CS/GCE. The DPV responses for HQ and CC on MC–CeNPs–CS/GCE are displayed in Figure 9A,B, the independent determination of HQ and CC was obtained, while the concentration of one species was changed and the other was held constant. As shown in Figure 9A, the peak current increased with an increasing concentration of HQ in the presence of 10 μM CC. Furthermore, the current of CC remained almost constant, which indicated that the oxidation of HQ and CC on MC–CeNPs–CS/GCE took place individually. In addition, the peak current exhibited linear relationships with the concentration of HQ (0.5–10 μM and 10–500 μM): two linear calibration curves were obtained and expressed as Ip = −24.66–0.48 CHQ (R2 = 0.996) and Ip = −29.14–0.11 CHQ (R2 = 0.996). Similarly, Figure 9B depicts the DPV results of various concentrations of CC in the presence of 10 μM HQ, and the regression equations found were Ip = −23.27–0.76 CCC (R2 = 0.992) and Ip = −30.72–0.17 CCC (R2 = 0.997) for the CCC ranges of 0.4–10 μM and 10–320 μM. The detection limits for HQ and CC were 0.24 µM and 0.13 µM (S/N = 3), respectively. A comparison between MC–CeNPs–CS/GCE and the other reported electrodes is shown in Table 1. Two linear ranges existed from low to high concentration for both HQ and CC. This could be attributed to MC–CeNPs–CS/GCE having limited active sites. During the electrochemical process, the analytes firstly reacted in highly active sites. When the highly active sites reached saturation, the analytes would be slowly enriched onto the other sites with low activity. Thus, the slope of low–concentration range was bigger than that of the high concentration range [52]. Moreover, the active sites were saturated gradually with increasing concentration, and there was no linear relationship with higher concentration.
To further investigate the performance of the MC–CeNPs–CS/GCE, the DPV responses of HQ and CC were also studied, when the concentration of these two species increased simultaneously. As shown in Figure 9C, the current increased with the concentration from 4 to 200 µM. The regression equations were Ip = −29.42–0.16 CHQ (R2 = 0.996) and Ip = −26.47–0.18 CCC (R2 = 0.992). All of these results indicate that the sensor can be successfully used for the simultaneous determination of coexisting CC and HQ, without the species interfering with each other.

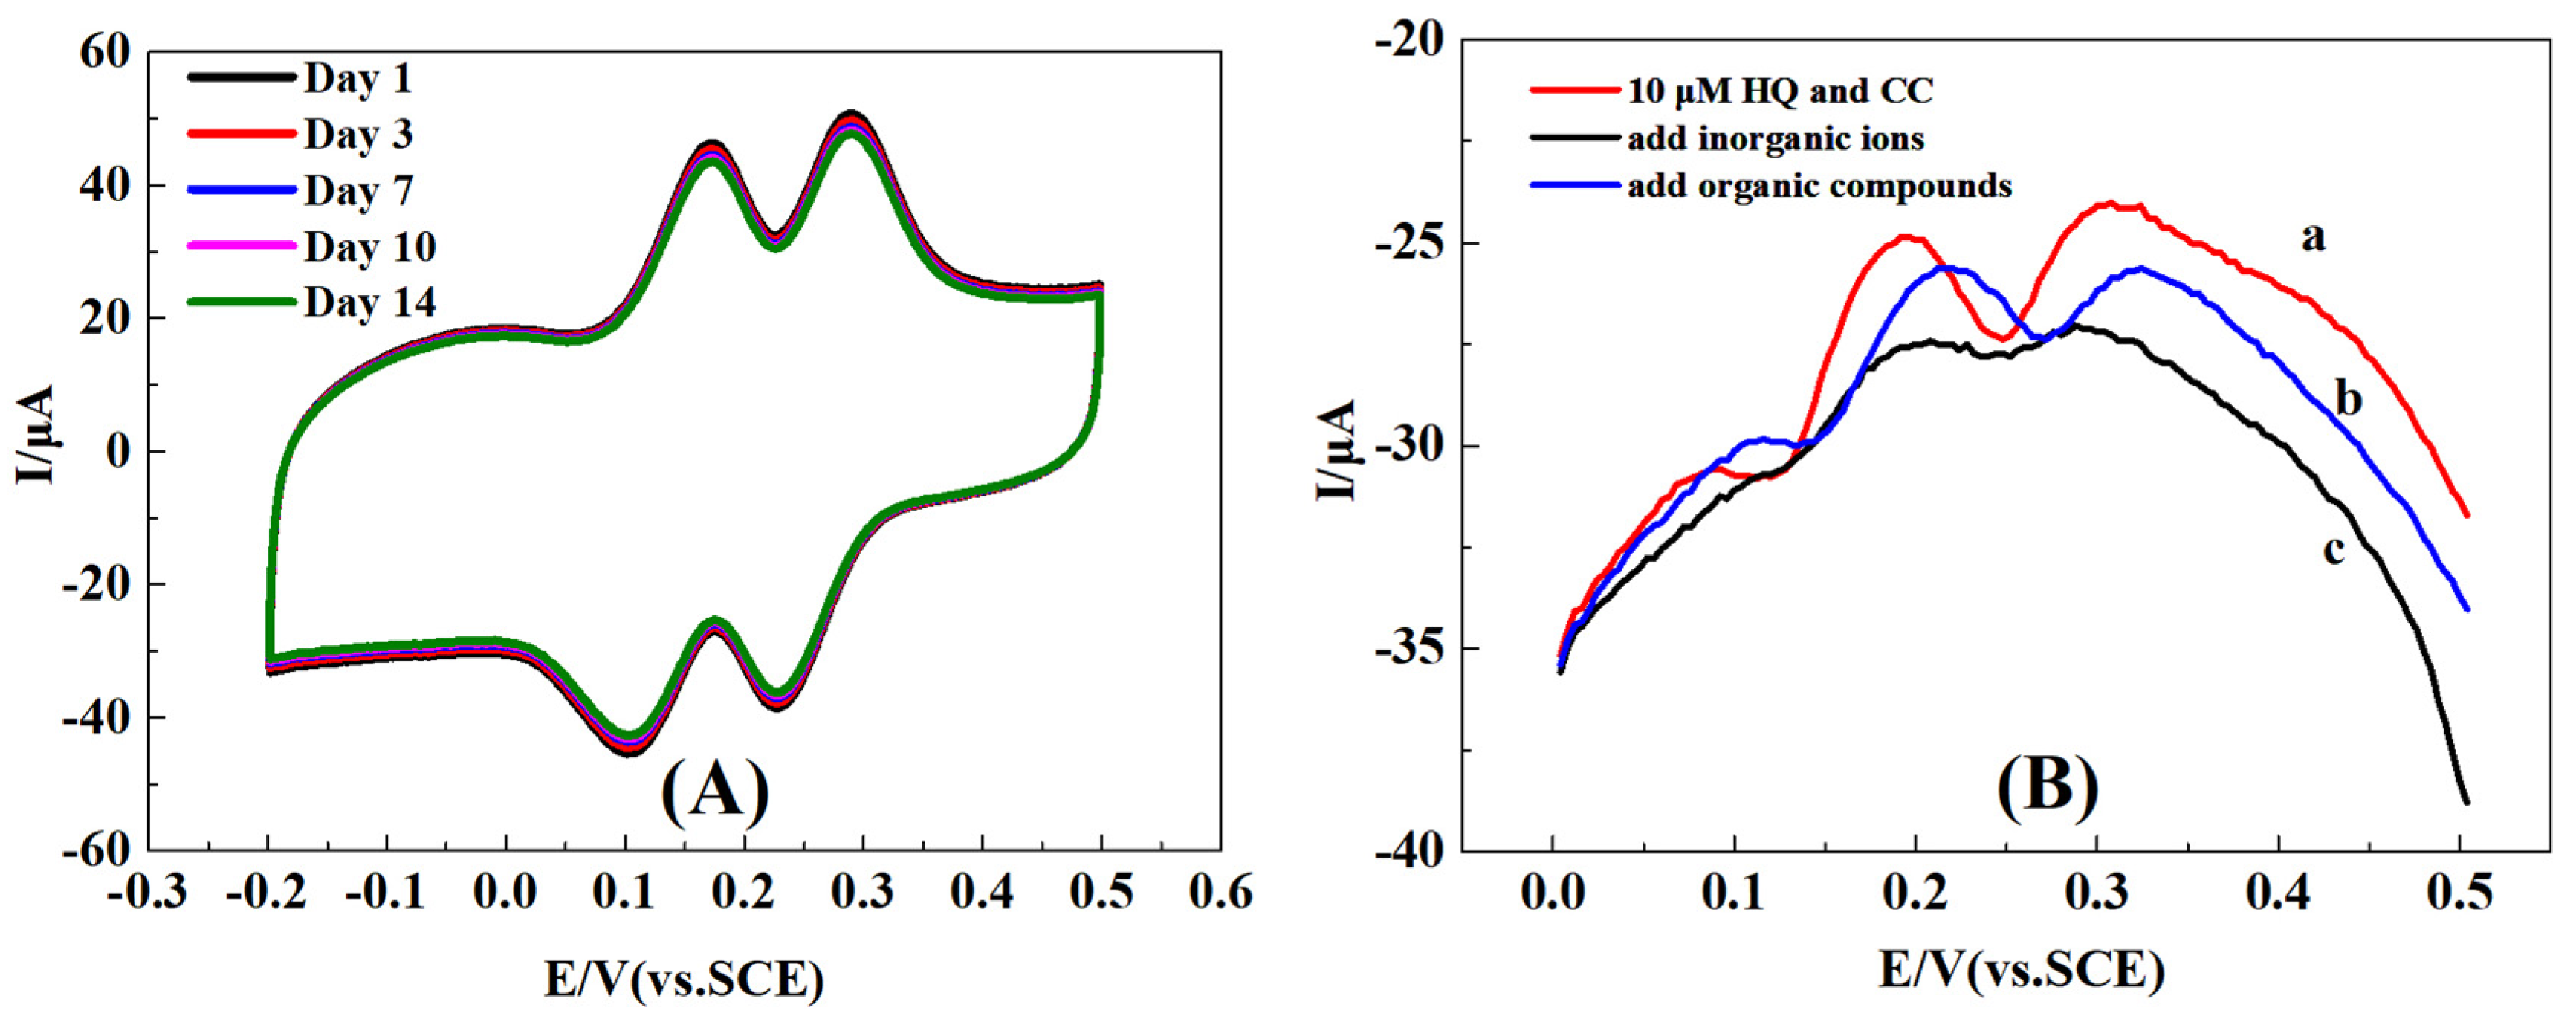
2.7. Reproducibility, Stability, and Selectively

The repeatability of the MC–CeNPs–CS/GCE was examined by monitoring the DPV response of 10 µM HQ and CC for five individual measurements. The relative standard deviations (RSDs) were 2.5% and 3.7% for HQ and CC, respectively. Moreover, the stability of MC–CeNPs–CS/GCE was also investigated by recording the change in CV plots over 14 days, in 0.1 M CBS containing 200 µM HQ and CC. As shown in Figure 10A, after 14 days, the current response remained about 96.4% of the original value. In addition, a selectivity study of the MC–CeNPs–CS/GCE was carried out by DPV in a mixed solution (10 µM HQ and CC) containing some inorganic ions and organic compounds. The result in Figure 10B shows that 100-fold Na+, K+, NH4+, Ca2+, Mg2+, Cu2+, Pb2+, Al3+, Fe3+, Cl, NO3,SO42−, Br-, and I-, and 50–fold resorcinol, nitrophenol, bisphenol A, and phenol did not interfere with the determination (signal change below 5%). In summary, all of these results indicate that the sensor has acceptable reproducibility, long-term stability, and satisfactory anti–interference ability for the determination of HQ and CC.

2.8. Real Sample Analysis

To explore the potential for practical application, tap water and lake water were selected as samples for quantitative analysis and tested by the standard addition method. Each sample was tested five times by five individually electrodes. The obtained average values and the RSDs are shown in Table 2. The recoveries were in ranges of 98.5–103.2% and 98–103.4% for HQ and CC, respectively, suggesting that this sensor has feasibility, reliability, and potential for the determination of HQ and CC in real samples.

3. Experimental

3.1. Materials and Reagents

Pluronic F127 (EO106PO70EO106, Mw = 13,000) purchased from Shanghai Macklin Biochemical Co., Ltd., Shanghai, China. HQ, CC, chitosan (CS), tetraethyl orthosilicate (TEOS), Phenol, formalin (37 wt %), cerium nitrate hexahydrate (Ce(NO3)3·6H2O), citric acid (C6H8O7·H2O), and trisodium citrate dehydrate (Na3C6H5O7·2H2O) were provided by Sinopharm Chemical Reagent Co., Ltd. (shanghai, China). All of the chemical reagents were used without further purification. All of the solutions were prepared with ultrapure water (18.2 MΩ).

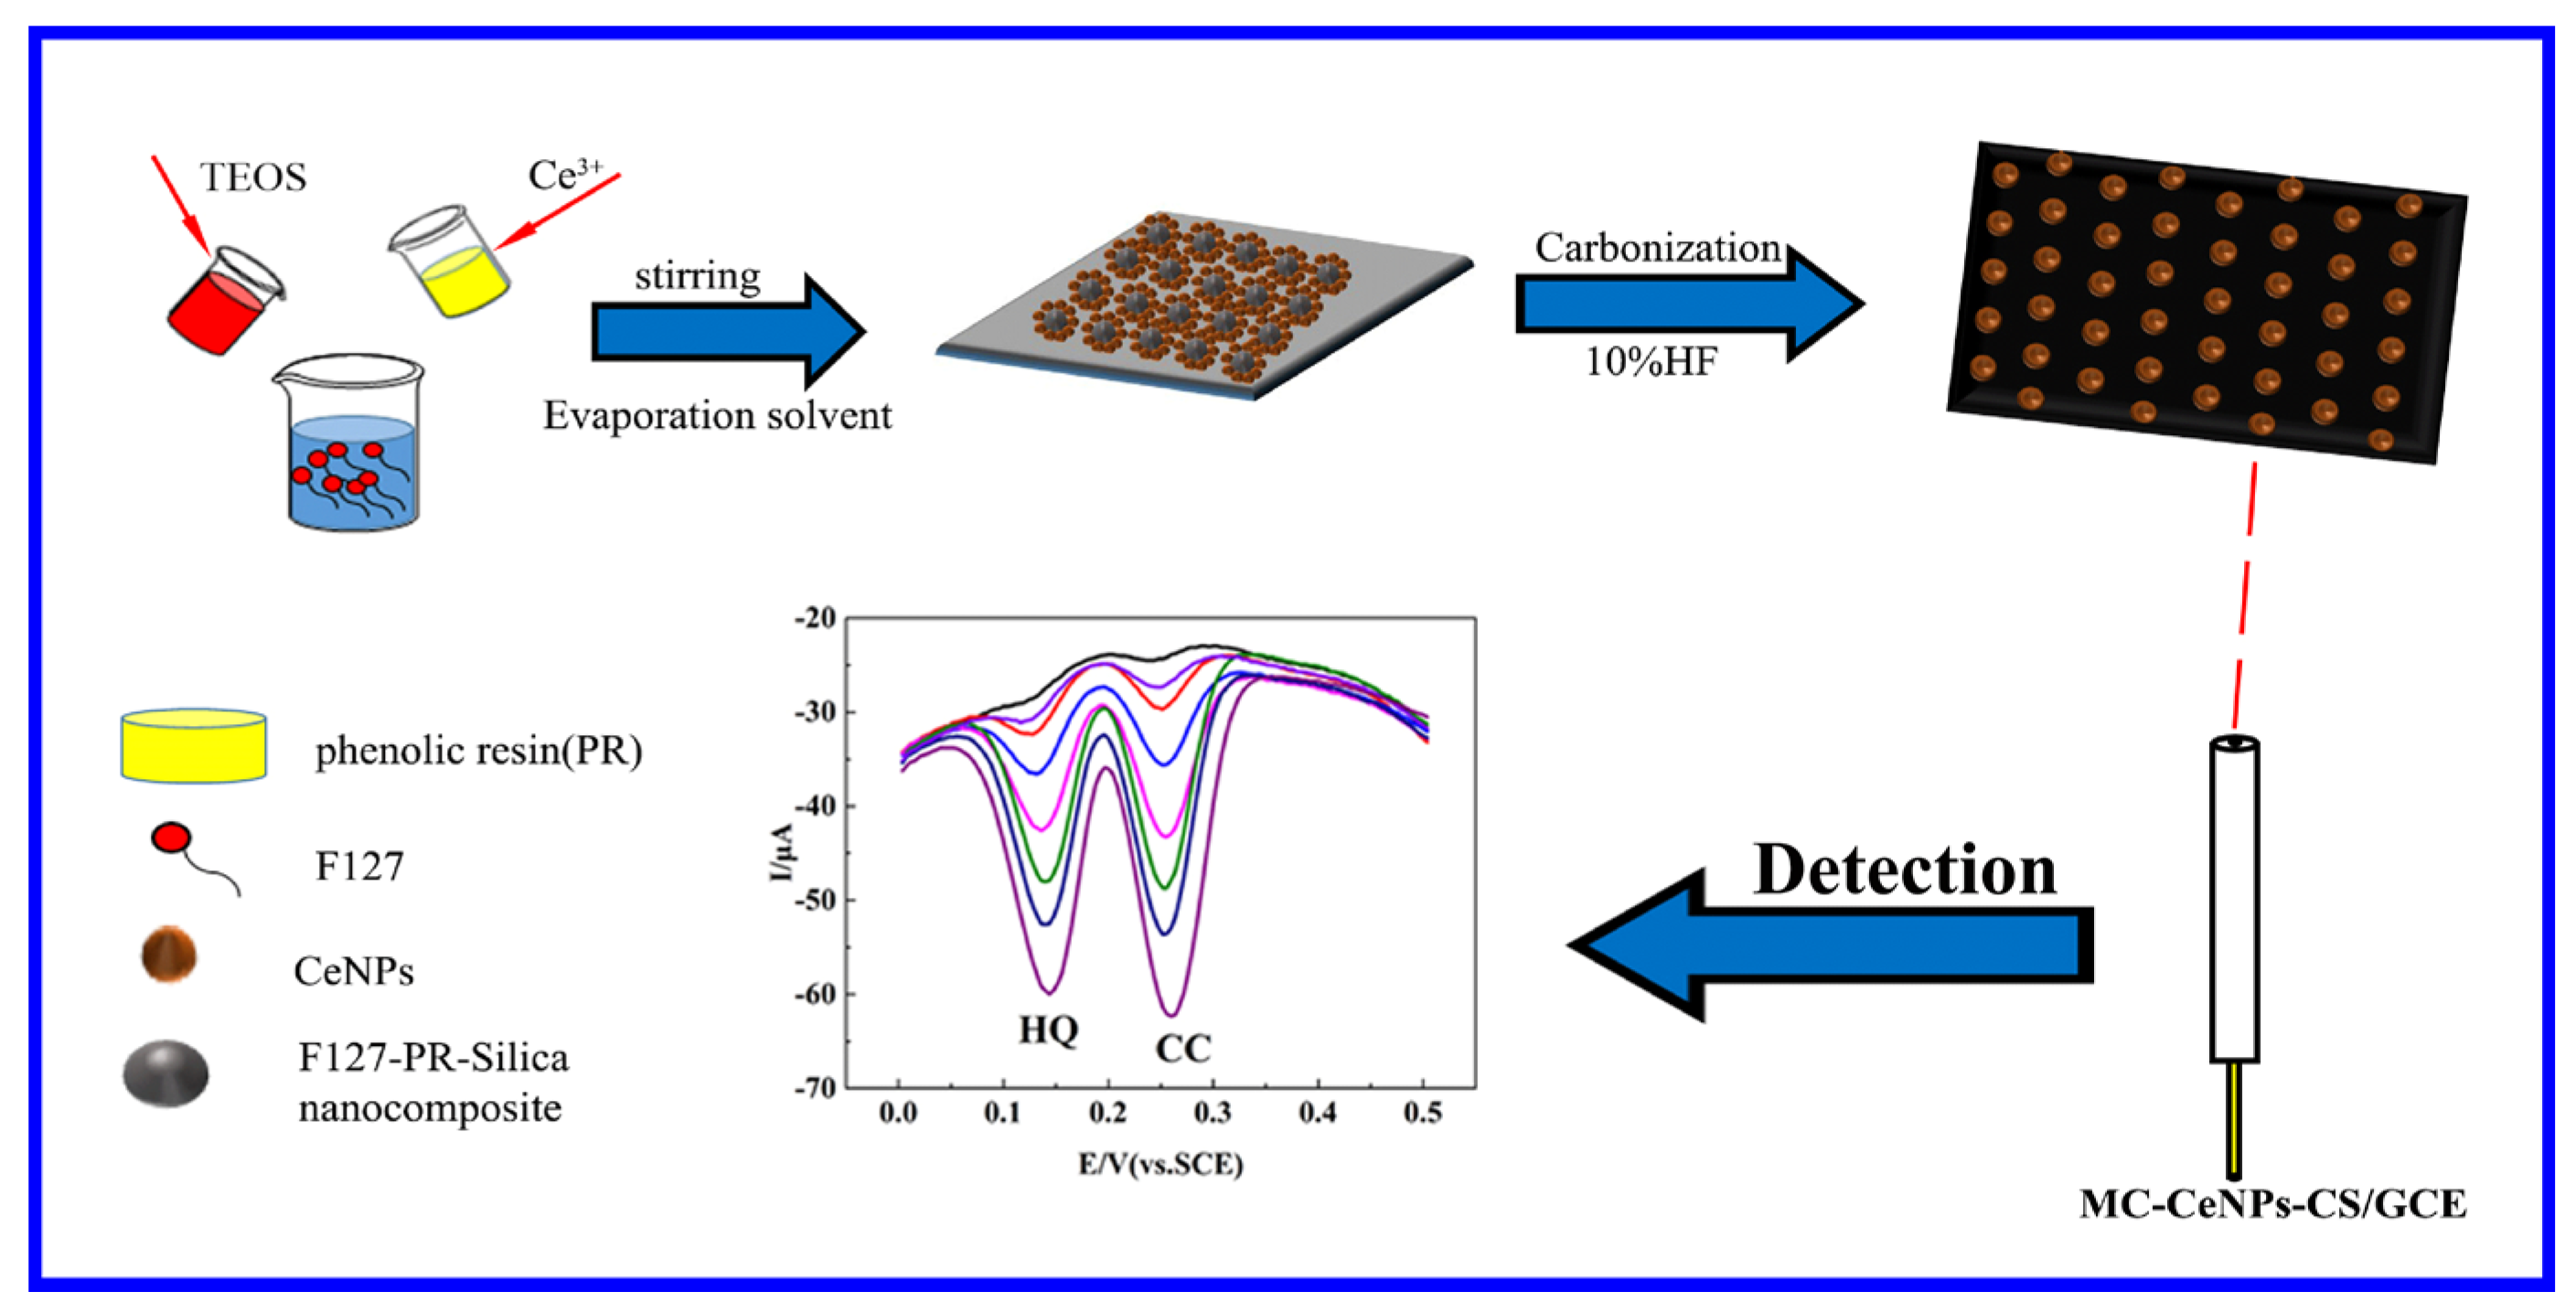
3.2. Synthesis of the MC–CeNPs Nanocomposite

The carbon source (resol phenolic resin) was prepared according to the method by Fan et al. [64]. The MC–CeNPs nanocomposite was synthesized via the EISA method. Briefly, 1.6 g F127 was added into the mix solution (8 g C2H5OH, 1 g 0.2 M HCl) at 40 °C and stirred for 0.5 h to obtain a clear solution. A quantity of 0.2 g Ce(NO3)3·6H2O was dissolved in 5 g resol phenolic resin to form a brown solution. The two solutions were mixed together, and 2.03 g TEOS was added with stirring for 2 h; this mix solution was poured into petri dishes to evaporate ethanol at room temperature, followed thermopolymerization at 100 °C. The products, brown or transparent membranes, were scraped from the dishes, then calcined at 350 °C for 3 h and 900 °C for 2 h in N2. The carbon–silica–ceria composite was immersed in HF (10 wt %) in air for 24 h to remove the silica. Finally, the MC–CeNPs nanocomposite was obtained after washing and drying. The MC was synthesized the same way but without Ce(NO3)3·6H2O.

3.3. Preparation of Modified Electrode

The glassy carbon electrode (GCE, d = 3 mm) was polished using 0.1 μM, 0.05 μM, and 0.05 μM Al2O3 to obtain a mirror-like surface, and then sonicated with acetone and ultrapure water for 5 min. To prepare the electrocatalytic suspension, 3 mg MC–CeNPs was dispersed in 1 mL CS solution (dissolved in 1 wt % acetic acid, 1 mg mL−1), and the solution was sonicated for 30 min, obtaining a black and homogeneous suspension. Subsequently, 10 µL of MC–CeNPs–CS solution was dropped onto pretreated GCE and dried using an infrared lamp. Thus, the MC–CeNPs modified electrode was prepared, denoted as MC–CeNPs–CS/GCE. The electrodes of MC–CS/GCE and CS/GCE were obtained through a similar method with the same dosage.

3.4. Characterization

Scanning electron microscope (SEM) images and energy dispersive X-ray detector (EDX) spectra were recorded on a field emission scanning electron microscope (Nova NanoSEM450, FEI Co., Hillsboro, OR, USA). Transmission electron microscopy (TEM) images and high resolution transmission electron microscopy (HRTEM) images were obtained using a JEOL 2100 transmission electron microscope (Tokyo, Japan). X-ray diffraction (XRD) patterns were recorded on a Bruker D4 X-ray diffractometer (Karlsruhe, Germany) with Ni–filtered Cu Kα radiation (40 kV, 40 mA). The Brunauer–Emmett–Teller (BET) surface area was calculated from 77 K N2 adsorption–desorption isotherms by NovaWin 1000e (Quantachrome, Boynton Beach, FL, USA) and the pore size distributions were derived using the Barrett–Joyner–Halenda (BJH) model. Raman spectra were recorded using a Raman spectrometer (Dong Woo 500i, Seoul, Korea). The X-ray photoelectron spectroscopy (XPS) measurements were performed on a Thermo ESCALAB 250 with Al Kα excitation (New York, NY, USA).

3.5. Electrochemical Measurements

Electrochemical experiments were performed using a CS350H electrochemical workstation (Wuhan Corrtest Instrument Corp., Ltd., Wuhan, China) and a conventional three-electrode cell was used. The GCE or modified GCE was employed as the working electrode, a saturated calomel electrode (SCE), and a platinum wire electrode served as the reference electrode and counter electrode, respectively. The differential pulse voltammetry (DPV) parameters were as follows: potential range, 0–0.5 V; potential increment, 0.004 V; amplitude, 0.025 s, frequency, 5 Hz. The cyclic voltammetry (CV) measurements were carried out for a fixed potential range and scan rate.
The electrolytes for the electrochemical characterization were 0.1 M KCl and 1 mM K3Fe(CN)6/K4Fe(CN)6 solutions. As for the determination of HQ and CC, the supporting electrolyte (citrate buffer solution (CBS)) was prepared using 0.1 M C6H8O7·H2O and Na3C6H5O7·2H2O; the pH was adjusted by their proportions.
All of the tests were carried out in the presence of oxygen.

4. Conclusions

In this study, a simple and sensitive electrochemical method was established for the simultaneous detection of HQ and CC. The prepared nanostructure composite possessed a large specific surface area, clear pore size distribution, excellent stability, high conductivity, and superior electrocatalytic ability, which improved the adsorption of analytes on the surface of electrode and provided faster electron transfer. Additionally, the MC–CeNPs–CS/GCE exhibited excellent performance in the simultaneous detection of HQ and CC with a low detection limit, wide linear range, and high selectivity and long-term stability. The sensing platform was applied to detection in real water sample with satisfactory results.

Author Contributions

D.L. designed experiments, F.L. performed the experiments and analyzed experimental results, D.Y., J.Y. and Y.D. optimized experiments and wrote the manuscript. All authors contributed to the results presented.

Funding

This research was funded by the Open Research Fund of the State Key Laboratory of Oil, Gas Reservoir Geology and Exploitation (No. PLN1115), the Key Project of the Chinese Ministry of Education (No. 213024A) and the China National Natural Science Foundation (Nos. 51401150, 51574182, 51178360).

Conflicts of Interest

The authors declare no conflict of interest.

References

  1. Zhou, H.; Huang, T.; Chen, D.; Li, S.; Yu, H.; Li, Y.; Song, Q. Copper nanoparticles modified nitrogen doped reduced graphene oxide 3-D superstructure for simultaneous determination of dihydroxybenzene isomers. Sens. Actuators B Chem. 2017, 249, 405–413. [Google Scholar] [CrossRef]
  2. Chen, Q.; Li, X.; Min, X.; Cheng, D.; Zhou, J.; Li, Y.; Xie, Z.; Liu, P.; Cai, W.; Zhang, C. Determination of catechol and hydroquinone with high sensitivity using MOF–graphene composites modified electrode. J. Electroanal. Chem. 2017, 789, 114–122. [Google Scholar] [CrossRef]
  3. Guo, Q.; Huang, J.; Chen, P.; Liu, Y.; Hou, H.; You, T. Simultaneous determination of catechol and hydroquinone using electrospun carbon nanofibers modified electrode. Sens. Actuators B Chem. 2012, 163, 179–185. [Google Scholar] [CrossRef]
  4. Pistonesi, M.F.; Di Nezio, M.S.; Centurion, M.E.; Palomeque, M.E.; Lista, A.G.; Fernandez Band, B.S. Determination of phenol, resorcinol and hydroquinone in air samples by synchronous fluorescence using partial least–squares (PLS). Talanta 2006, 69, 1265–1268. [Google Scholar] [CrossRef]
  5. Lavanya, N.; Sekar, C. Highly sensitive electrochemical sensor for simultaneous determination of dihydroxybenzene isomers based on Co doped SnO2 nanoparticles. RSC Adv. 2016, 6, 68211–68219. [Google Scholar] [CrossRef]
  6. Marrubini, G.; Calleri, E.; Coccini, T.; Castoldi, A.F.; Manzo, L. Direct Analysis of Phenol, Catechol and Hydroquinone in Human Urine by Coupled–Column HPLC with Fluorimetric Detection. Chromatographia 2005, 62, 25–31. [Google Scholar] [CrossRef]
  7. Peng, C.; Li, Z.; Zhang, X.; Zhou, S.; Zhang, W.; Liu, X.; Zhao, P. Simultaneous Determination of Hydroquinone, Catechol and Resorcinol with High Selectivity Based on Hollow Nitrogen–Doped Mesoporous Carbon Spheres Decorated Graphene. J. Electrochem. Soc. 2018, 165, B212–B219. [Google Scholar] [CrossRef]
  8. Mao, H.; Liu, M.; Cao, Z.; Ji, C.; Sun, Y.; Liu, D.; Wu, S.; Zhang, Y.; Song, X.-M. Poly(4-vinylphenylboronic acid) functionalized polypyrrole/graphene oxide nanosheets for simultaneous electrochemical determination of catechol and hydroquinone. Appl. Surf. Sci. 2017, 420, 594–605. [Google Scholar] [CrossRef]
  9. Liu, M.; Guan, Q.; Liu, S. Nitrogen-doped hollow carbon spheres for electrochemical detection of heavy metal ions. Ionics 2017, 24, 2783–2793. [Google Scholar] [CrossRef]
  10. Liu, Y.; Qiu, Z.; Wan, Q.; Wang, Z.; Wu, K.; Yang, N. High–Performance Hydrazine Sensor Based on Graphene Nano Platelets Supported Metal Nanoparticles. Electroanal 2016, 28, 126–132. [Google Scholar] [CrossRef]
  11. Xiong, W.; Zhou, L.; Liu, S. Development of gold-doped carbon foams as a sensitive electrochemical sensor for simultaneous determination of Pb (II) and Cu (II). Chem. Eng. J. 2016, 284, 650–656. [Google Scholar] [CrossRef]
  12. Zhou, X.; He, Z.; Lian, Q.; Li, Z.; Jiang, H.; Lu, X. Simultaneous determination of dihydroxybenzene isomers based on graphene–graphene oxide nanocomposite modified glassy carbon electrode. Sens. Actuators B Chem. 2014, 193, 198–204. [Google Scholar] [CrossRef]
  13. Wang, H.; Zhang, S.; Li, S.; Qu, J. Simultaneous determination of hydroquinone and catechol using a glassy carbon electrode modified with Au@Pd loaded on reduced graphene oxide. Anal. Methods 2018, 10, 1331–1338. [Google Scholar] [CrossRef]
  14. Tashkhourian, J.; Daneshi, M.; Nami-Ana, F.; Behbahani, M.; Bagheri, A. Simultaneous determination of hydroquinone and catechol at gold nanoparticles mesoporous silica modified carbon paste electrode. J. Hazard. Mater. 2016, 318, 117–124. [Google Scholar] [CrossRef] [PubMed]
  15. Fotouhi, L.; Dorraji, P.S.; Keshmiri, Y.S.S.; Hamtak, M. Electrochemical Sensor Based on Nanocomposite of Multi–Walled Carbon Nanotubes/TiO2 Nanoparticles in Chitosan Matrix for Simultaneous and Separate Determination of Dihydroxybenzene Isomers. J. Electrochem. Soc. 2018, 165, B202–B211. [Google Scholar] [CrossRef]
  16. Alshahrani, L.A.; Liu, L.; Sathishkumar, P.; Nan, J.; Gu, F.L. Copper oxide and carbon nano-fragments modified glassy carbon electrode as selective electrochemical sensor for simultaneous determination of catechol and hydroquinone in real-life water samples. J. Electroanal. Chem. 2018, 815, 68–75. [Google Scholar] [CrossRef]
  17. Charbgoo, F.; Ramezani, M.; Darroudi, M. Bio–sensing applications of cerium oxide nanoparticles: Advantages and disadvantages. Biosens. Bioelectron. 2017, 96, 33–43. [Google Scholar] [CrossRef] [PubMed]
  18. Pang, J.; Li, W.; Cao, Z.; Xu, J.; Li, X.; Zhang, X. Mesoporous Cu2O-CeO2 composite nanospheres with enhanced catalytic activity for 4-nitrophenol reduction. Appl. Surf. Sci. 2018, 430, 420–429. [Google Scholar] [CrossRef]
  19. Zhang, X.; Xiang, H.; Wang, Q.; Cao, H.; Xue, J. Carbon Encapsulated FeCu4 Alloy Nanoparticles Modified Glass Carbon Electrode to Promote the Degradation for P-Nitrophenol. Integr. Ferroelectr. 2013, 147, 97–102. [Google Scholar] [CrossRef]
  20. He, F.; Luo, J.; Liu, S. Novel metal loaded KIT-6 catalysts and their applications in the catalytic combustion of chlorobenzene. Chem. Eng. J. 2016, 294, 362–370. [Google Scholar] [CrossRef]
  21. Wang, J.; Zhang, Z.; Jin, S.; Shen, X. Efficient conversion of carbohydrates into 5-hydroxylmethylfurfan and 5-ethoxymethylfurfural over sufonic acid–functionalized mesoporous carbon catalyst. Fuel 2017, 192, 102–107. [Google Scholar] [CrossRef]
  22. Qin, Y.-H.; Xiong, Z.-Y.; Ma, J.; Yang, L.; Wu, Z.; Feng, W.; Wang, T.-L.; Wang, W.-G.; Wang, C.-W. Enhanced electrocatalytic activity and stability of Pd nanoparticles supported on TiO2-modified nitrogen-doped carbon for ethanol oxidation in alkaline media. Int. J. Hydrogen Energy 2017, 42, 1103–1112. [Google Scholar] [CrossRef]
  23. Xu, J.L.; Wang, S.G.; Deng, Q.R.; Liu, Y.; Zhu, J.L.; Xu, C.B.; Wang, J.H. High–performance Pt/CNTs catalysts via hydrogen plasma for methanol electrooxidation. Nano 2014, 9, 1450018. [Google Scholar] [CrossRef]
  24. Miao, L.; Zhu, D.; Liu, M.; Duan, H.; Wang, Z.; Lv, Y.; Xiong, W.; Zhu, Q.; Li, L.; Chai, X.; Gan, L. Cooking carbon with protic salt: Nitrogen and sulfur self-doped porous carbon nanosheets for supercapacitors. Chem. Eng. J. 2018, 347, 233–242. [Google Scholar] [CrossRef]
  25. Jiang, L.; Yao, M.; Liu, B.; Li, Q.; Liu, R.; Lv, H.; Lu, S.; Gong, C.; Zou, B.; Cui, T.; et al. Controlled Synthesis of CeO2/Graphene Nanocomposites with Highly Enhanced Optical and Catalytic Properties. J. Phys. Chem. C 2012, 116, 11741–11745. [Google Scholar] [CrossRef]
  26. Ansari, S.; Ansari, M.S.; Devnani, H.; Satsangee, S.P.; Jain, R. CeO2/g–C3N4 nanocomposite: A perspective for electrochemical sensing of anti–depressant drug. Sens. Actuators B Chem. 2018, 273, 1226–1236. [Google Scholar] [CrossRef]
  27. Üğe, A.; Koyuncu Zeybek, D.; Zeybek, B. An electrochemical sensor for sensitive detection of dopamine based on MWCNTs/CeO2 -PEDOT composite. J. Electroanal. Chem. 2018, 813, 134–142. [Google Scholar] [CrossRef]
  28. Xi, J.; Wang, Q.; Liu, J.; Huan, L.; He, Z.; Qiu, Y.; Zhang, J.; Tang, C.; Xiao, J.; Wang, S. N,P-dual-doped multilayer graphene as an efficient carbocatalyst for nitroarene reduction: A mechanistic study of metal-free catalysis. J. Catal. 2018, 359, 233–241. [Google Scholar] [CrossRef]
  29. Li, H.; Zhang, Y.; Wan, Q.; Li, Y.; Yang, N. Expanded graphite and carbon nanotube supported palladium nanoparticles for electrocatalytic oxidation of liquid fuels. Carbon 2018, 131, 111–119. [Google Scholar] [CrossRef]
  30. Zhou, S.; Xu, H.; Yuan, Q.; Shen, H.; Zhu, X.; Liu, Y.; Gan, W. N-Doped Ordered Mesoporous Carbon Originated from a Green Biological Dye for Electrochemical Sensing and High-Pressure CO2 Storage. ACS Appl. Mater. Interfaces 2016, 8, 918–926. [Google Scholar] [CrossRef]
  31. Zhang, J.; Cui, S.; Ding, Y.; Yang, X.; Guo, K.; Zhao, J.T. Two-dimensional mesoporous ZnCo2O4 nanosheets as a novel electrocatalyst for detection of o-nitrophenol and p-nitrophenol. Biosens. Bioelectron. 2018, 112, 177–185. [Google Scholar] [CrossRef] [PubMed]
  32. Ge, C.; Li, H.; Li, M.; Li, C.; Wu, X.; Yang, B. Synthesis of a ZnO nanorod/CVD graphene composite for simultaneous sensing of dihydroxybenzene isomers. Carbon 2015, 95, 1–9. [Google Scholar] [CrossRef]
  33. Li, J.; Tian, Q.; Jiang, S.; Zhang, Y.; Wu, Y. Electrocatalytic performances of phosphorus doped carbon supported Pd towards formic acid oxidation. Electrochim. Acta 2016, 213, 21–30. [Google Scholar] [CrossRef]
  34. Du, X.; Jiang, D.; Chen, S.; Dai, L.; Zhou, L.; Hao, N.; You, T.; Mao, H.; Wang, K. CeO2 nanocrystallines ensemble-on-nitrogen-doped graphene nanocomposites: One-pot, rapid synthesis and excellent electrocatalytic activity for enzymatic biosensing. Biosens. Bioelectron. 2015, 89, 681–688. [Google Scholar] [CrossRef] [PubMed]
  35. Xiang, Y.; Li, L.; Liu, H.; Shi, Z.; Tan, Y.; Wu, C.; Liu, Y.; Wang, J.; Zhang, S. One-step synthesis of three–dimensional interconnected porous carbon and their modified electrode for simultaneous determination of hydroquinone and catechol. Sens. Actuators B Chem. 2018, 267, 302–311. [Google Scholar] [CrossRef]
  36. Subbiah, D.K.; Kulandaisamy, A.J.; George, R.B.; Shankar, P.; Mani, G.K.; Jayanth Babu, K.; Rayappan, J.B.B. Nano ceria as xylene sensor—Role of cerium precursor. J. Alloys Compd. 2018, 753, 771–780. [Google Scholar] [CrossRef]
  37. Vilian, A.T.E.; Song, J.Y.; Lee, Y.S.; Hwang, S.K.; Kim, H.J.; Jun, Y.S.; Huh, Y.S.; Han, Y.K. Salt–templated three-dimensional porous carbon for electrochemical determination of gallic acid. Biosens. Bioelectron. 2018, 117, 597–604. [Google Scholar] [CrossRef] [PubMed]
  38. Qian, J.; Chen, Z.; Sun, H.; Chen, F.; Xu, X.; Wu, Z.; Li, P.; Ge, W. Enhanced Photocatalytic H2 Production on Three–Dimensional Porous CeO2/Carbon Nanostructure. ACS Sustain. Chem. Eng. 2018, 6, 9691–9698. [Google Scholar] [CrossRef]
  39. Shi, Q.; Zhang, R.; Lv, Y.; Deng, Y.; Elzatahrya, A.A.; Zhao, D. Nitrogen–doped ordered mesoporous carbons based on cyanamide as the dopant for supercapacitor. Carbon 2015, 84, 335–346. [Google Scholar] [CrossRef]
  40. Ali, A.; Abdiryim, T.; Huang, X.; Jamal, R.; Simayi, R. Hollow, Spherical, Poly(3,4-ethylenedioxythiophene)-Bearing Methanethiol as a Gold Stabilizer for High-Efficiency Electrochemical Sensors. J. Electrochem. Soc. 2018, 165, B335–B343. [Google Scholar] [CrossRef]
  41. Kaur, B.; Srivastava, R.; Satpati, B. Highly Efficient CeO2 Decorated Nano-ZSM-5 Catalyst for Electrochemical Oxidation of Methanol. ACS Catal. 2016, 6, 2654–2663. [Google Scholar] [CrossRef]
  42. Meng, F.; Miao, H.; Shi, J.; Hu, Z.; Li, G.; Ding, Y. The synthesis of carbon/cerium oxide composites clusters with the assistance of the glucaminium-based surfactant and their electrochemical performance in the glucose monitoring. J. Alloys Compd. 2017, 713, 125–131. [Google Scholar] [CrossRef]
  43. Zhang, H.; Huang, Y.; Hu, S.; Huang, Q.; Wei, C.; Zhang, W.; Yang, W.; Dong, P.; Hao, A. Self-assembly of graphitic carbon nitride nanosheets-carbon nanotube composite for electrochemical simultaneous determination of catechol and hydroquinone. Electrochim. Acta 2015, 176, 28–35. [Google Scholar] [CrossRef]
  44. Lu, Z.; Dai, W.; Lin, X.; Liu, B.; Zhang, J.; Ye, J.; Ye, J. Facile one-step fabrication of a novel 3D honeycomb-like bismuth nanoparticles decorated N-doped carbon nanosheet frameworks: Ultrasensitive electrochemical sensing of heavy metal ions. Electrochim. Acta 2018, 266, 94–102. [Google Scholar] [CrossRef]
  45. Palanisamy, S.; Thangavelu, K.; Chen, S.M.; Velusamy, V.; Chen, T.W.; Kannan, R.S. Preparation and characterization of a novel hybrid hydrogel composite of chitin stabilized graphite: Application for selective and simultaneous electrochemical detection of dihydroxybenzene isomers in water. J. Electroanal. Chem. 2017, 785, 40–47. [Google Scholar] [CrossRef]
  46. Xu, R.; Xiao, L.; Luo, L.; Yuan, Q.; Qin, D.; Hu, G.; Gan, W. Nitrogen, Sulfur Dual–Doped Mesoporous Carbon Modified Glassy Carbon Electrode for Simultaneous Determination of Hydroquinone and Catechol. J. Electrochem. Soc. 2016, 163, B617–B623. [Google Scholar] [CrossRef]
  47. Deng, M.; Lin, S.; Bo, X.; Guo, L. Simultaneous and sensitive electrochemical detection of dihydroxybenzene isomers with UiO-66 metal-organic framework/mesoporous carbon. Talanta 2017, 174, 527–538. [Google Scholar] [CrossRef]
  48. Li, J.; Xia, J.; Zhang, F.; Wang, Z.; Liu, Q. An electrochemical sensor based on copper-based metal-organic frameworks-graphene composites for determination of dihydroxybenzene isomers in water. Talanta 2018, 181, 80–86. [Google Scholar] [CrossRef]
  49. Li, Z.; Yue, Y.; Hao, Y.; Feng, S.; Zhou, X. A glassy carbon electrode modified with cerium phosphate nanotubes for the simultaneous determination of hydroquinone, catechol and resorcinol. Mikrochim. Acta 2018, 185, 215. [Google Scholar] [CrossRef]
  50. Hu, S.; Zhang, W.; Zheng, J.; Shi, J.; Lin, Z.; Zhong, L.; Cai, G.; Wei, C.; Zhang, H.; Hao, A. One step synthesis cadmium sulphide/reduced graphene oxide sandwiched film modified electrode for simultaneous electrochemical determination of hydroquinone, catechol and resorcinol. RSC Adv. 2015, 5, 18615–18621. [Google Scholar] [CrossRef]
  51. Yin, H.; Zhang, Q.; Zhou, Y.; Ma, Q.; Liu, T.; Zhu, L.; Ai, S. Electrochemical behavior of catechol, resorcinol and hydroquinone at graphene–chitosan composite film modified glassy carbon electrode and their simultaneous determination in water samples. Electrochim. Acta 2011, 56, 2748–2753. [Google Scholar] [CrossRef]
  52. Gao, J.; Fang, J.; Ju, X.; Zhu, W.; Lin, X.; Zhang, S.; Ma, C.; Song, H. Hierarchical Self-Assembly of Cyclodextrin and Dimethylamino-Substituted Arylene-Ethynylene on N-doped Graphene for Synergistically Enhanced Electrochemical Sensing of Dihydroxybenzene Isomers. ACS Appl. Mater. Interfaces 2017, 9, 38802–38813. [Google Scholar] [CrossRef] [PubMed]
  53. Shen, Y.; Rao, D.; Sheng, Q.; Zheng, J. Simultaneous voltammetric determination of hydroquinone and catechol by using a glassy carbon electrode modified with carboxy-functionalized carbon nanotubes in a chitosan matrix and decorated with gold nanoparticles. Microchim. Acta 2017, 184, 3591–3601. [Google Scholar] [CrossRef]
  54. Zhou, J.; Li, X.; Yang, L.; Yan, S.; Wang, M.; Cheng, D.; Chen, Q.; Dong, Y.; Liu, P.; Cai, W.; et al. The Cu-MOF-199/single-walled carbon nanotubes modified electrode for simultaneous determination of hydroquinone and catechol with extended linear ranges and lower detection limits. Anal. Chim. Acta 2015, 899, 57–65. [Google Scholar] [CrossRef] [PubMed]
  55. Rajkumar, C.; Thirumalraj, B.; Chen, S.M.; Veerakumar, P.; Lin, K.C. Voltammetric determination of catechol and hydroquinone using nitrogen-doped multiwalled carbon nanotubes modified with nickel nanoparticles. Mikrochim. Acta 2018, 185, 395. [Google Scholar] [CrossRef] [PubMed]
  56. Wang, Y.; Xiong, Y.; Qu, J.; Qu, J.; Li, S. Selective sensing of hydroquinone and catechol based on multiwalled carbon nanotubes/polydopamine/gold nanoparticles composites. Sens. Actuators B Chem. 2016, 223, 501–508. [Google Scholar] [CrossRef]
  57. Yang, Y.; Wang, Q.; Qiu, W.; Guo, H.; Gao, F. Covalent Immobilization of Cu3(btc)2 at Chitosan-Electroreduced Graphene Oxide Hybrid Film and Its Application for Simultaneous Detection of Dihydroxybenzene Isomers. J. Phys. Chem. C 2016, 120, 9794–9803. [Google Scholar] [CrossRef]
  58. Kokulnathan, T.; Raja, N.; Chen, S.-M.; Sukanya, R.; Thirumalraj, B. Chitosan Stabilized Multi–Walled Carbon Nanotubes for Electrochemical Determination of Dihydroxybenzene Isomers. J. Electrochem. Soc. 2017, 164, H958–H966. [Google Scholar] [CrossRef]
  59. Zhao, L.; Yu, J.; Yue, S.; Zhang, L.; Wang, Z.; Guo, P.; Liu, Q. Nickel oxide/carbon nanotube nanocomposites prepared by atomic layer deposition for electrochemical sensing of hydroquinone and catechol. J. Electroanal. Chem. 2018, 808, 245–251. [Google Scholar] [CrossRef]
  60. Huang, J.; Zhang, X.; Zhou, L.; You, T. Simultaneous electrochemical determination of dihydroxybenzene isomers using electrospun nitrogen-doped carbon nanofiber film electrode. Sens. Actuators B Chem. 2016, 224, 568–576. [Google Scholar] [CrossRef]
  61. Huang, Y.H.; Chen, J.H.; Sun, X.; Su, Z.B.; Xing, H.T.; Hu, S.R.; Weng, W.; Guo, H.X.; Wu, W.B.; He, Y.S. One-pot hydrothermal synthesis carbon nanocages-reduced graphene oxide composites for simultaneous electrochemical detection of catechol and hydroquinone. Sens. Actuators B Chem. 2015, 212, 165–173. [Google Scholar] [CrossRef]
  62. Zhang, Y.; Sun, R.; Luo, B.; Wang, L. Boron-doped graphene as high-performance electrocatalyst for the simultaneously electrochemical determination of hydroquinone and catechol. Electrochim. Acta 2015, 156, 228–234. [Google Scholar] [CrossRef]
  63. Zhang, H.; Bo, X.; Guo, L. Electrochemical preparation of porous graphene and its electrochemical application in the simultaneous determination of hydroquinone, catechol, and resorcinol. Sens. Actuators B Chem. 2015, 220, 919–926. [Google Scholar] [CrossRef]
  64. Fan, J.; Ran, X.; Ren, Y.; Wang, C.; Yang, J.; Teng, W.; Zou, L.; Sun, Y.; Lu, B.; Deng, Y.; et al. Ordered Mesoporous Carbonaceous Materials with Tunable Surface Property for Enrichment of Hexachlorobenzene. Langmuir 2016, 32, 9922–9929. [Google Scholar] [CrossRef] [PubMed]
Scheme 1. Fabrication of the mesoporous carbon and ceria nanoparticles composite (MC–CeNPs) modified electrode and the simultaneous detection of hydroquinone (HQ) and catechol (CC).
Nanomaterials 09 00054 sch001
Figure 1. Scanning electron microscope (SEM) images of mesoporous carbon (MC) (a) and MC–CeNPs (b); energy dispersive X-ray detector (EDX) image of MC–CeNPs (c).
Nanomaterials 09 00054 g001
Figure 2. TEM images of MC (a) and MC–CeNPs (b), high resolution transmission electron microscopy (HRTEM) images of MC (c), and MC–CeNPs (d).
Nanomaterials 09 00054 g002
Figure 3. (A) XRD pattern of MC (a), MC–CeNPs (b); (B) Raman spectra of MC (a), MC–CeNPs (b); and, (C) N2 adsorption–desorption isotherm and pore size distribution (inset) of MC–CeNPs.
Nanomaterials 09 00054 g003
Figure 4. X-ray photoelectron spectroscopy (XPS) spectra of MC–CeNPs: (A) the survey spectrum; (B) C1s peak; (C) O1s peak; and, (D) Ce 3d peak.
Nanomaterials 09 00054 g004
Figure 5. Cyclic voltammetry (CV) (A) and electron impedance spectroscopy (EIS) results (B) for glassy carbon electrode (GCE) (a), CS/GCE (b), MC–CS/GCE (c), MC–CeNPs–CS/GCE (d) in 1 mM K3Fe(CN)6/K4Fe(CN)6 containing 0.1 M KCl. Scan rate: 100 mV·s−1, Frequencies swept: 105 to 0.01 Hz.
Nanomaterials 09 00054 g005
Figure 6. CV results of 0.2 mM HQ (A), 0.2 mM CC (B), and 0.2 mM HQ and CC (C) for the different modified electrodes in pH 5.0 CBS at a scan rate of 0.1 V s−1. (D) MC–CeNPs–CS/GCE in the absence of HQ and CC.
Nanomaterials 09 00054 g006
Figure 7. (A) CV results of MC–CeNPs–CS/GCE with 0.2 mM HQ and CC in CBS at different pH values (scan rate 0.1 V s−1). (B,C) The relationship of Ep (the black line region) and Ip (the red line region) with pH for HQ. (D,E) The relationship of Ep (the black line region) and Ip (the red line region) with pH for CC.
Nanomaterials 09 00054 g007aNanomaterials 09 00054 g007b
Figure 8. (A) CV results of 0.2 mM HQ and CC on MC–CeNPs–CS/GCE in 0.1 M CBS (pH 5.0) with different scan rates (0.02–0.16 V s−1). (B,C) Plots of Ip (the red line region) vs. ν and Ep (the black line region) vs. log ν for HQ. (D,E) Plots of Ip (the red line region) vs. ν and Ep (the black line region) vs. log ν for CC.
Nanomaterials 09 00054 g008aNanomaterials 09 00054 g008b
Figure 9. (A) Differential pulse voltammetry (DPV) results for different concentrations of HQ (0.5–500 µM) in the presence of 10 µM CC (B) DPV results for different concentrations of CC (0.4–320 µM) in the presence of 10 µM HQ. (C) DPV results for the simultaneous determination of CC and HQ of different concentrations (4–200 µM).
Nanomaterials 09 00054 g009
Figure 10. (A) CV results of 0.1 M CBS containing 200 µM HQ and CC recorded for 14 days. (B) DPV results of 0.1 M citrate buffer solution (CBS) containing 10 µM HQ and CC, (a) without any interfere, (b) adding inorganic ions, and (c) adding organic compounds.
Nanomaterials 09 00054 g010
Table 1. Comparison of the simultaneous determination of HQ and CC by different electrodes.
ElectrodeLinear Range (µM)Detection Limit (µM)Ref.
HQCCHQCC
c–MWCNTs a/CTS b/Au/GCE0.5–15005–9000.170.89[53]
Cu–MOF199 c/SWCNTs d/GCE0.1–14530.1–11500.080.1[54]
Ni/N–MWCNT e0.1–3010.1–3010.010.01[55]
CS/MWCNTs/PDA f/AuNPs g/GCE0.1–100.1–100.0350.047[56]
Cu3(btc)2 h/CS–ERGO i5.0–4002.0–2000.0170.069[57]
CS/f–MWCNT j0.09–171.40.09–155.40.0270.029[58]
NiO/CNT/GCE10–50010–4002.52.5[59]
NCNF k–GCE1–4001–4000.30.4[60]
CNCs l–RGO/GCE1–4001–3000.870.40[61]
BG m5–1001–750.30.2[62]
P–rGO n5–905–1200.080.18[63]
MC–CeNPs–CS/GCE0.5–10,0.4–10,0.240.13This work
10–50010–320
Abbreviations: a carboxy–functionalized multi–walled carbon nanotubes; b chitosan; c metal–organic frameworks; d single–walled carbon nanotubes; e nitrogen–doped multiwalled carbon nanotubes; f polydopamine; g glod nanoparticles; h benzene–1,3,5–tricarboxylic acid; i electrochemically reduced graphene oxide; j (CS)–stabilized multi–walled carbon nanotube; k nitrogen–doped carbon nanofiber; l carbon nanocages; m Boron–doped grapheme; n porous reduced graphene oxide.
Table 2. Determination of CC and HQ in tap water and lake water samples using MC–CeNPs–CS/GCE by DPV.
SampleAdded( μM)Found( μM)Recovery (%)RSD (%)
HQCCHQCCHQCCHQCC
Tap water0000
10109.99.599.098.62.31.2
505051.651.7103.2103.43.62.7
100100102.7100.7102.7100.72.83.4
0000
Lake water101010.19.8101.098.01.43.6
505049.850.699.6101.23.12.9
10010098.599.298.599.21.92.6

