Article

Facile Electrochemical Sensor for Nanomolar Rutin Detection Based on Magnetite Nanoparticles and Reduced Graphene Oxide Decorated Electrode

1
School of Life Sciences and Chemistry, Hunan University of Technology, Zhuzhou 412007, China
2
Hunan Provincial Key Laboratory of Functional Metal-Organic Compounds; Key Laboratory of functional Organometallic Materials of Hunan Provincial Universities; Department of Chemistry and Material Science, Hengyang Normal University, Hengyang 421008, China
3
School of Materials Science and Energy Engineering, Foshan University, Foshan 528000, China
*
Authors to whom correspondence should be addressed.
These authors contributed equally to this work.
Nanomaterials 2019, 9(1), 115; https://doi.org/10.3390/nano9010115
Submission received: 24 December 2018 / Revised: 10 January 2019 / Accepted: 14 January 2019 / Published: 18 January 2019

Abstract

:
A new electrochemical sensor for nanomolar rutin detection based on amine-functionalized Fe3O4 nanoparticles and electrochemically reduced graphene oxide nanocomposite modified glassy carbon electrode (NH2-Fe3O4 NPs-ErGO/GCE) was fabricated through a simple method, and the X-ray diffraction (XRD), Fourier transform infrared spectroscopy (FTIR), scanning electron microscope (SEM), transmission electron microscope (TEM), vibrating sample magnetometer (VSM) and electrochemical technique were used to characterize the modified electrode. The electrochemical behavior of rutin on the Fe3O4 NPs-ErGO/GCE was studied in detail. The electrochemical response of rutin at this modified electrode was remarkably higher than that of the bare GCE or other modified GCE (GO/GCE, Fe3O4 NPs-GO/GCE, and ErGO/GCE). Under the optimum determination conditions, Fe3O4 NPs-ErGO/GCE provided rutin with a broader detection range of 6.0 nM–0.1 µM; 0.1–8.0 µM and 8.0–80 µM, a minimum detectable concentration of 4.0 nM was obtained after 210 s accumulation. This novel method was applied in determination of rutin in pharmaceutical tablets and urine samples with satisfactory results.

1. Introduction

Flavonoids are a kind of natural product widely existing in plants. They have antioxidant and anti-free radical effects and can be used in the treatment of cardiovascular and cerebrovascular diseases, tumors, inflammation and so on. Rutin (3’,4’,5,7-tetrahydroxyflavone-3-d-rutinoside), also known as vitamin P, is a common flavonoid glycoside widely present in many plants, especially in buckwheat plants [1]. Modern pharmacological studies have found that rutin not only regulates the permeability and fragility of the capillary wall, prevents vascular rupture and hemostasis, but also has the effects of anti-bacterial, anti-inflammatory, analgesic, anti-radiation, anti-oxidation, anti-myocardial hypoxia, reducing serum cholesterol, diuresis, spasmolysis and inhibiting platelet aggregation [2,3]. Therefore, it is of great significance to develop simple, reliable and sensitive methods for rutin analysis.
So far, numerous analysis methods, such as high performance liquid chromatography [4,5], chemiluminescence [6,7], capillary electrophoresis [8], spectrophotometry [9], flow injection analysis [10] and electrochemistry [11] have been reported for the determination of rutin. Among these methods, some involve expensive equipment, a time-consuming process, the use of toxic organic reagents or poor sensitivity. Electrochemical methods have the virtues of low-cost apparatus, high sensitivity, wide linear range and simplicity. Due to the electroactivity of rutin, various electrodes have been modified and explored for the detection of rutin [12,13,14,15,16,17,18,19,20], and their typical analytical figures of merit for rutin analysis are compared and summarized in Table 1. In order to amplify the response signal fundamentally and improve the detection sensitivity practically, it is still important and necessary to develop new electrochemical sensors for rutin detection at the nanomolar level.
Since graphene (GR) was first reported in 2004, this two-dimensional carbon nanomaterial has attracted tremendous attention due to its excellent properties such as high surface area, fast electron transportation, excellent mechanical strength, high thermal conductivity and high mobility of charge carriers [21]. In recent years, great progress has been made in GR based nanocomposites by utilizing the synergistic effect of the components used. GR has been combined with different material entities such as metal, metal oxide, biomolecules and polymers, and the nanocomposites can provide their individual advantages of each component and demonstrate an improved performance [22,23,24,25,26,27,28,29,30]. Fe3O4 nanoparticles (Fe3O4 NPs) are widely used in the biomedical field because of their good biocompatibility, low cost, easy preparation, large surface area and distinct catalytic activity [31,32,33]. However, Fe3O4 NPs exhibit poor performance on electrical conductivity and are inclined to agglomerate, which hampers their application in electrochemical sensors [34]. The fabrication and application of GR and Fe3O4 NPs composite has been explored recently. For example, Zhang et al. fabricated a Nafion covered core-shell structured Fe3O4@graphene nanospheres modified glassy carbon electrode (GCE) and used it for selective detection of dopamine [35]. Yin et al. prepared a nanosized graphene, chitosan and Fe3O4 composite as electrode material which exhibited an excellent electrocatalytic and adsorptive activity towards the oxidation of guanosine [36]. Teymourian et al. synthesized GR/Fe3O4 nanohybrids via a facile one-step chemical reaction strategy, where the reduction of graphene oxide (GO) and the in-situ generation of Fe3O4 nanoparticles occurred simultaneously, which showed good electrochemical behaviors toward the oxidation of NADH [37]. Sun et al. prepared various shapes (sphere, rod and band) Fe3O4 decorated reduced graphene oxide (rGO) via one-step co-precipitation route in solution. It was proved that the shapes of Fe3O4 had a great effect on sensing performance. The reason may be that their morphology had an important impact on the surface area, active site and ion kinetics of materials, which could effectively influence its electrochemical performance. The experimental data showed that the band-shaped Fe3O4/rGO modified electrode exhibited high sensitivity for Pb(II) detection [38]. However, up to now, the preparation of electrochemical sensors which combine the outstanding merits of Fe3O4 NPs and GR for rutin determination is still scarcely reported.
In this paper, an inexpensive, rapid and efficient synthetic route is adopted for the preparation of the Fe3O4 NPs-GR nanocomposite. Amine-functionalized Fe3O4 (NH2-Fe3O4 NPs) was synthesized, which could bind with GO via hydrogen bonding between the amino-groups attached to NH2-Fe3O4 and the oxygen-containing groups such as hydroxyl, epoxy and carboxyl groups residing on the surface of GO, and the resulting nanocomposites had good dispensability and stability. Then, the potentiostatic reduction of GO sheets was electrochemically employed to generate reduced graphene oxide (ErGO) on the surface of GCE. Based on this, cyclic voltammetry (CV) and second derivative linear sweep voltammetry (SDLSV) were both adopted to investigate as-fabricated NH2-Fe3O4 NPs-ErGO/GCE and its sensing performances towards the rutin oxidation. The electrochemical results showed that the voltammetric response of rutin was enhanced greatly on NH2-Fe3O4 NPs-ErGO/GCE. Therefore, a novel sensitive voltammetric approach for rutin determination at nanomolar level was symmetrically explored.

2. Experimental

2.1. Materials and Reagents

Rutin (C27H20O16·3H2O), sodium nitrate, concentrated sulfuric acid, ferric trichloride hexahydrate (FeCl3·6H2O), potassium permanganate, hydrogen peroxide, graphite powder, 1,2-ethylenediamine and ethylene glycol were purchased from Sinopharm Chemical Reagent Co. Ltd. (Shanghai, China). A stock solution of rutin (1.0 mM) was prepared in 50% (v/v) ethanol and kept at 4 °C when not in use. More dilute solutions were prepared accordingly when needed. For all electrochemical measurements, 0.2 M H2SO4 was used as the electrolyte. All other reagents were of analytical grade and used as received. Doubly distilled water was used throughout the study.

2.2. Characterization Apparatus

Cyclic Voltammetry (CV) was measured on a CHI 660E electrochemical workstation (Chenhua Instrument, Shanghai, China). Second derivative linear sweep voltammetry (SDLSV) was conducted on a JP-303E polarographic analyzer (Chengdu Instrument Factory, Chengdu, China). A conventional three-electrode system was used throughout the electrochemical experiments, which consisted of a working electrode (NH2-Fe3O4 NPs-ErGO/GCE), a counter electrode (platinum electrode), and a reference electrode (saturated calomel electrode, SCE), respectively. The pH measurements were performed on a pH-3c exact digital pH meter (Shanghai Leichi Instrument Factory, Shanghai, China). Fourier transform infrared spectroscopy (FTIR) was recorded on Varian Excalibur 3100 spectrometer (Palo Alto, CA, USA). Scanning electron microscope (SEM) images were collected from a Hitachi S-3000N scanning electron microscope (Hitachi, Tokyo, Japan) at an acceleration potential of 30 kV. Transmission electron microscope (TEM) images were recorded from JEOL JEM-2010 (HT, Tokyo, Japan) operated at 200 kV. X-ray diffraction (XRD) patterns were operated with an X-ray diffractometer (PAN Alytical, Amsterdam, Holland). Magnetic hysteresis loop of NH2-Fe3O4 NPs was detected by a vibrating sample magnetometer (VSM, Instrument Factory of Nanjing University, Nanjing, China). The ultraviolet (UV) absorption spectra were obtained on a UV-2501PC spectrophotometer (Shimadzu Co., Tokyo, Japan) in the wavelength range 200–450 nm with 1 cm matched quartz cells.

2.3. Preparation of NH2-Fe3O4 NPs and GO Composites

Graphene oxide (GO) was synthesized using a modified Hummers method as reported in our previous publication [39]. Briefly, 23 mL concentrated sulfuric acid was cooled to 0 °C, and 0.5 g graphite powder, 0.5 g sodium nitrate and 3.0 g potassium permanganate were added under mechanical stirring below 5 °C. Then, the mixture was stirred for 2 h at 35 °C to form a mash. Subsequently, 40 mL water was added slowly into the solution below 50 °C, then the temperature was increased to 95 °C and the mixture was stirred for 0.5 h. After adding 100 mL of water, the above solution was poured in 20 mL of 30% H2O2. The suspension was treated by suction filtration, and the precipitate was washed with 1.0 M hydrochloric acid and water, respectively. The graphite oxide was obtained by drying under 50 °C vacuum overnight. Finally, 100 mg graphite oxide were dispersed in 100 mL water and exfoliated to GO by ultrasonication for 2 h, and the golden-yellow solution was obtained after centrifugation.
NH2-Fe3O4 NPs were prepared via hydrothermal method according to [40]. In brief, 1.0 g FeCl3·6H2O was dissolved in 20 mL ethylene glycol to form a clear solution, followed by the addition of 3.0 g sodium acetate, 0.4 g sodium hydroxide, and 10 mL 1,2-ethylenediamine. The mixture was stirred vigorously for 30 min and then sealed in a Teflon lined stainless-steel autoclave. The autoclave was heated to and maintained at 200 °C for 8 h, and allowed to cool to room temperature. The obtained black magnetite particles were washed with water for several times and then dried in vacuum. After that, 1.0 mg of NH2-Fe3O4 NPs was introduced into 20 mL of GO solution (1 mg/mL) in an ultrasound bath for 2 h and the NH2-Fe3O4 NPs and GO nanocomposites dispersed solution were produced.

2.4. Fabrication of the Decorated Electrodes

In order to acquire a smooth surface, the bare GCE was polished with 0.05 µm α-Al2O3 suspension, and then it was cleaned in ethyl alcohol and doubly distilled water by sonication, each for 2 min. A total of 5 µL of NH2-Fe3O4 NPs and GO nanocomposites dispersion was dropwise added onto the GCE surface and dried under an infrared lamp. The electrode denoted as NH2-Fe3O4 NPs-GO/GCE was achieved. Then, NH2-Fe3O4 NPs-ErGO/GCE was fabricated by electrochemical reduction of GO in phosphate buffer solution (PBS, pH 6.5) at −1.2 V for 150 s. For comparison and further investigation, NH2-Fe3O4 NPs/GCE, GO/GCE, ErGO/GCE were similarly fabricated as above-mentioned procedure.

2.5. Analytical Procedure

A total of 1.0 mL of 0.1 mM rutin, 1.0 mL of 1.0 M hydrochloric acid and 8.0 mL of water were transferred into a 10 mL electrochemical cell, and then the three-electrode system was set up. The electrochemical behavior of rutin on NH2-Fe3O4 NPs-ErGO/GCE was measured by CV method, and SDLSV was used for rutin quantitative analysis because of its sensitivity and high resolution. CVs potential data were collected and recorded in the range from 0.0 to 1.0 V at a scan rate of 0.1 V/s. While SDLSVs potential data were collected and recorded from −0.3 to 1.1 V at a scan rate of 0.1 V/s similarly. All measurements were carried out at room temperature.

3. Results and Discussion

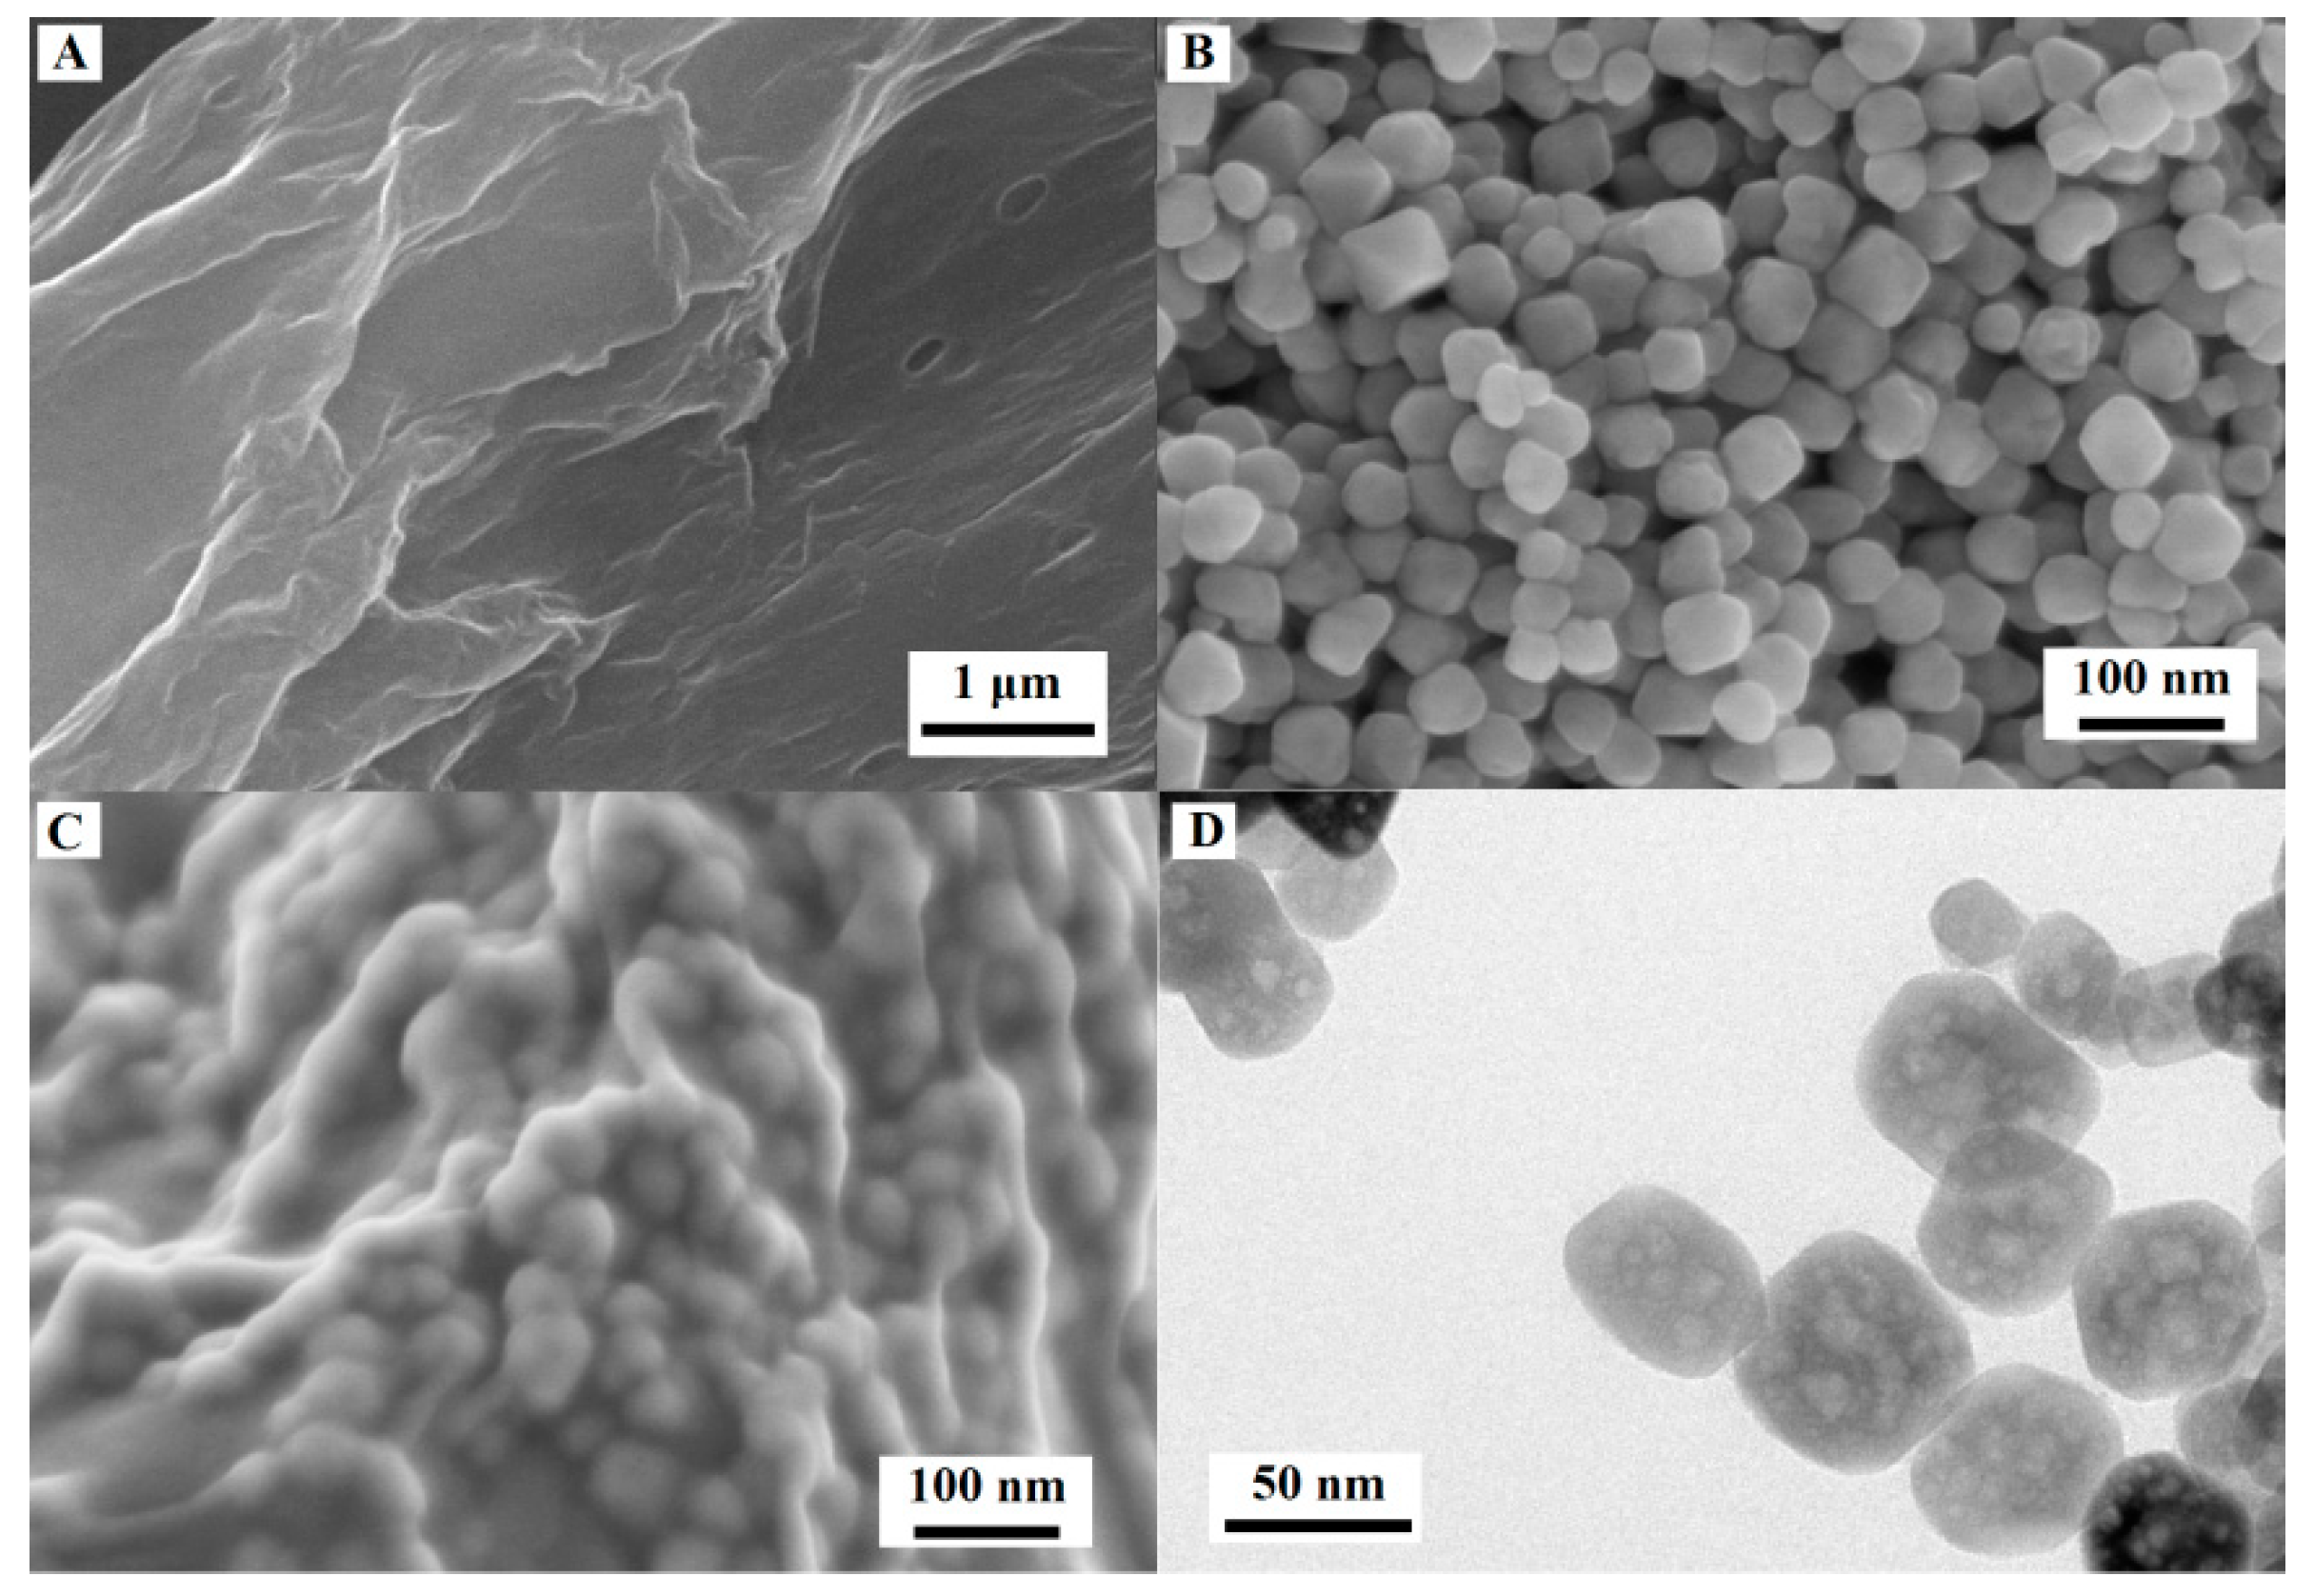
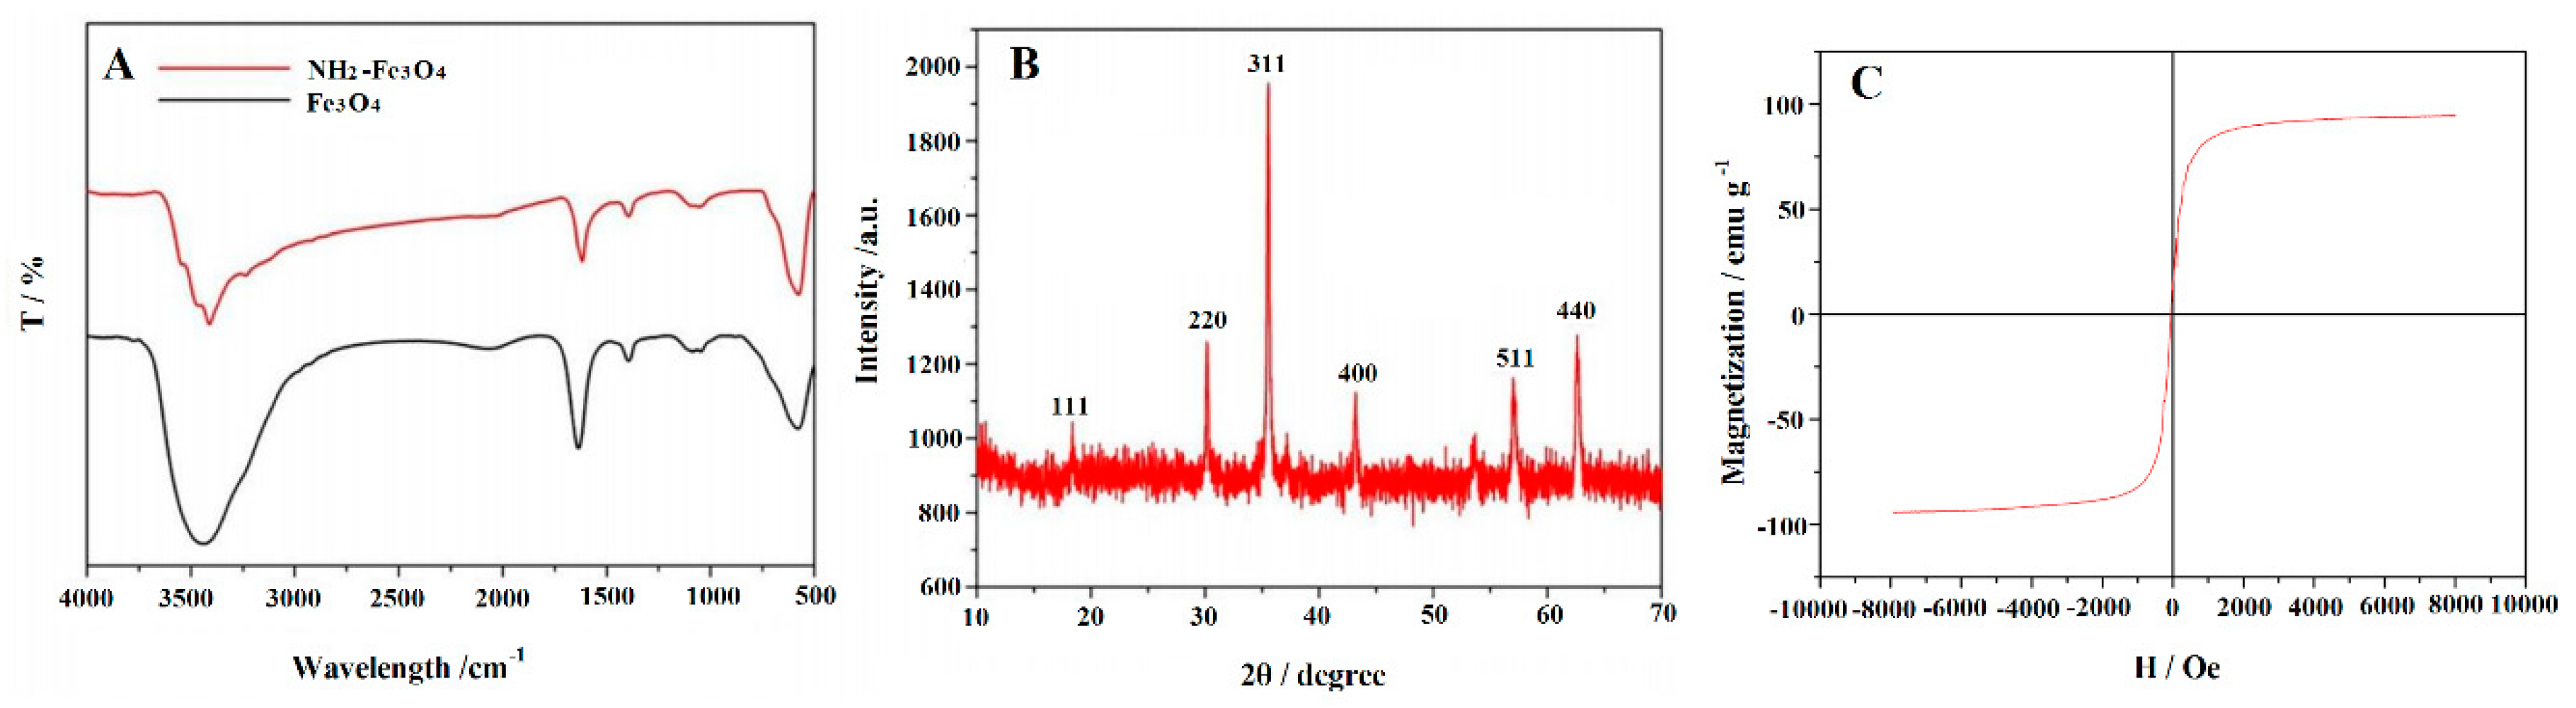
3.1. Characterization of Morphology and Structure of the Synthetic Materials

The morphologies of the synthesized materials were primarily characterized by SEM, and the images of GO (A), NH2-Fe3O4 NPs (B) and NH2-Fe3O4-ErGO nanocomposites (C) were obtained. As shown in Figure 1A, GO exhibited thin, wrinkled nanosheets. The typical morphology of NH2-Fe3O4 NPs was clearly presented in Figure 1B, in which NH2-Fe3O4 NPs exhibit a narrow size-distribution with an estimated average particle diameter of about 50 nm. The SEM image of NH2-Fe3O4 NPs-ErGO in Figure 1C shows that ErGO sheets decorated with NH2-Fe3O4 are stacked randomly, indicating that NH2-Fe3O4 NP and ErGO are well combined. In addition, the surface morphology of NH2-Fe3O4 NPs was studied by TEM. Most interestingly, these NH2-Fe3O4 NPs with smooth surfaces demonstrate a mesoporous structure inside, and the porous size is around 10 nm. It is assumed that the assembling similar-surfactant structures formed via static attraction between sodium acetate (excess) and 1, 2-ethylenediamine ETH (excess) probably acted as the soft template for obtaining the novel mesoporous structure [41]. The NH2-Fe3O4 NPs shows good dispersity and no obvious agglomeration is observed, plus the significantly small size and abundant pores, the specific surface area of NH2-Fe3O4 NPs increases dramatically. It is well known that large specific surface areas can provide more active sites and can absorb more analytes. Moreover, these pores also allow the electrons to transit inside their interior pore channels, which would improve electrocatalytic activity.
NH2-Fe3O4 NPs were further characterized by FTIR, XRD and VSM separately. Figure 2A shows the FTIR spectra comparison of Fe3O4 NPs (curve a) and NH2-Fe3O4 NPs (curve b). From curve b, it could be seen that the broad band in the range of 3300–3600 cm−1 was attributed to stretching vibrations of hydroxyl (-OH groups) absorbed by Fe3O4 NPs, and the absorption band near 3211 cm−1 was attributed to the -NH groups also existing in particles. The strong absorption peak at 577 cm−1 was caused by the stretching vibrations of the Fe-O bond in NH2-Fe3O4 NPs. After amine-modification, the peak strength was weakened as compared with that of parent Fe3O4 NPs, which indicated that the modification of Fe3O4 NPs with -NH2 was successful. It was evident that the XRD patterns of NH2-Fe3O4 NPs (Figure 2B) displayed six diffraction peaks located at 2θ of 19.7°, 30.4°, 35.7°, 43.2°, 57.3° and 62.8°, respectively corresponding to the facets of (111), (220), (311), (400), (511) and (440) exactly the same as magnetite crystal structure (JSPDS01-1111, α = 8.393Å). No other impurity diffraction peaks were observed in the XRD pattern, indicating that the prepared NH2-Fe3O4 NPs were crystally pure. The magnetization curves of the NH2-Fe3O4 NPs are shown in Figure 2C, and their magnetic saturation Ms values are around 80 emu·g−1, quite similar to crystal magnetite NPs, demonstrating a very good soft magnetism [32].

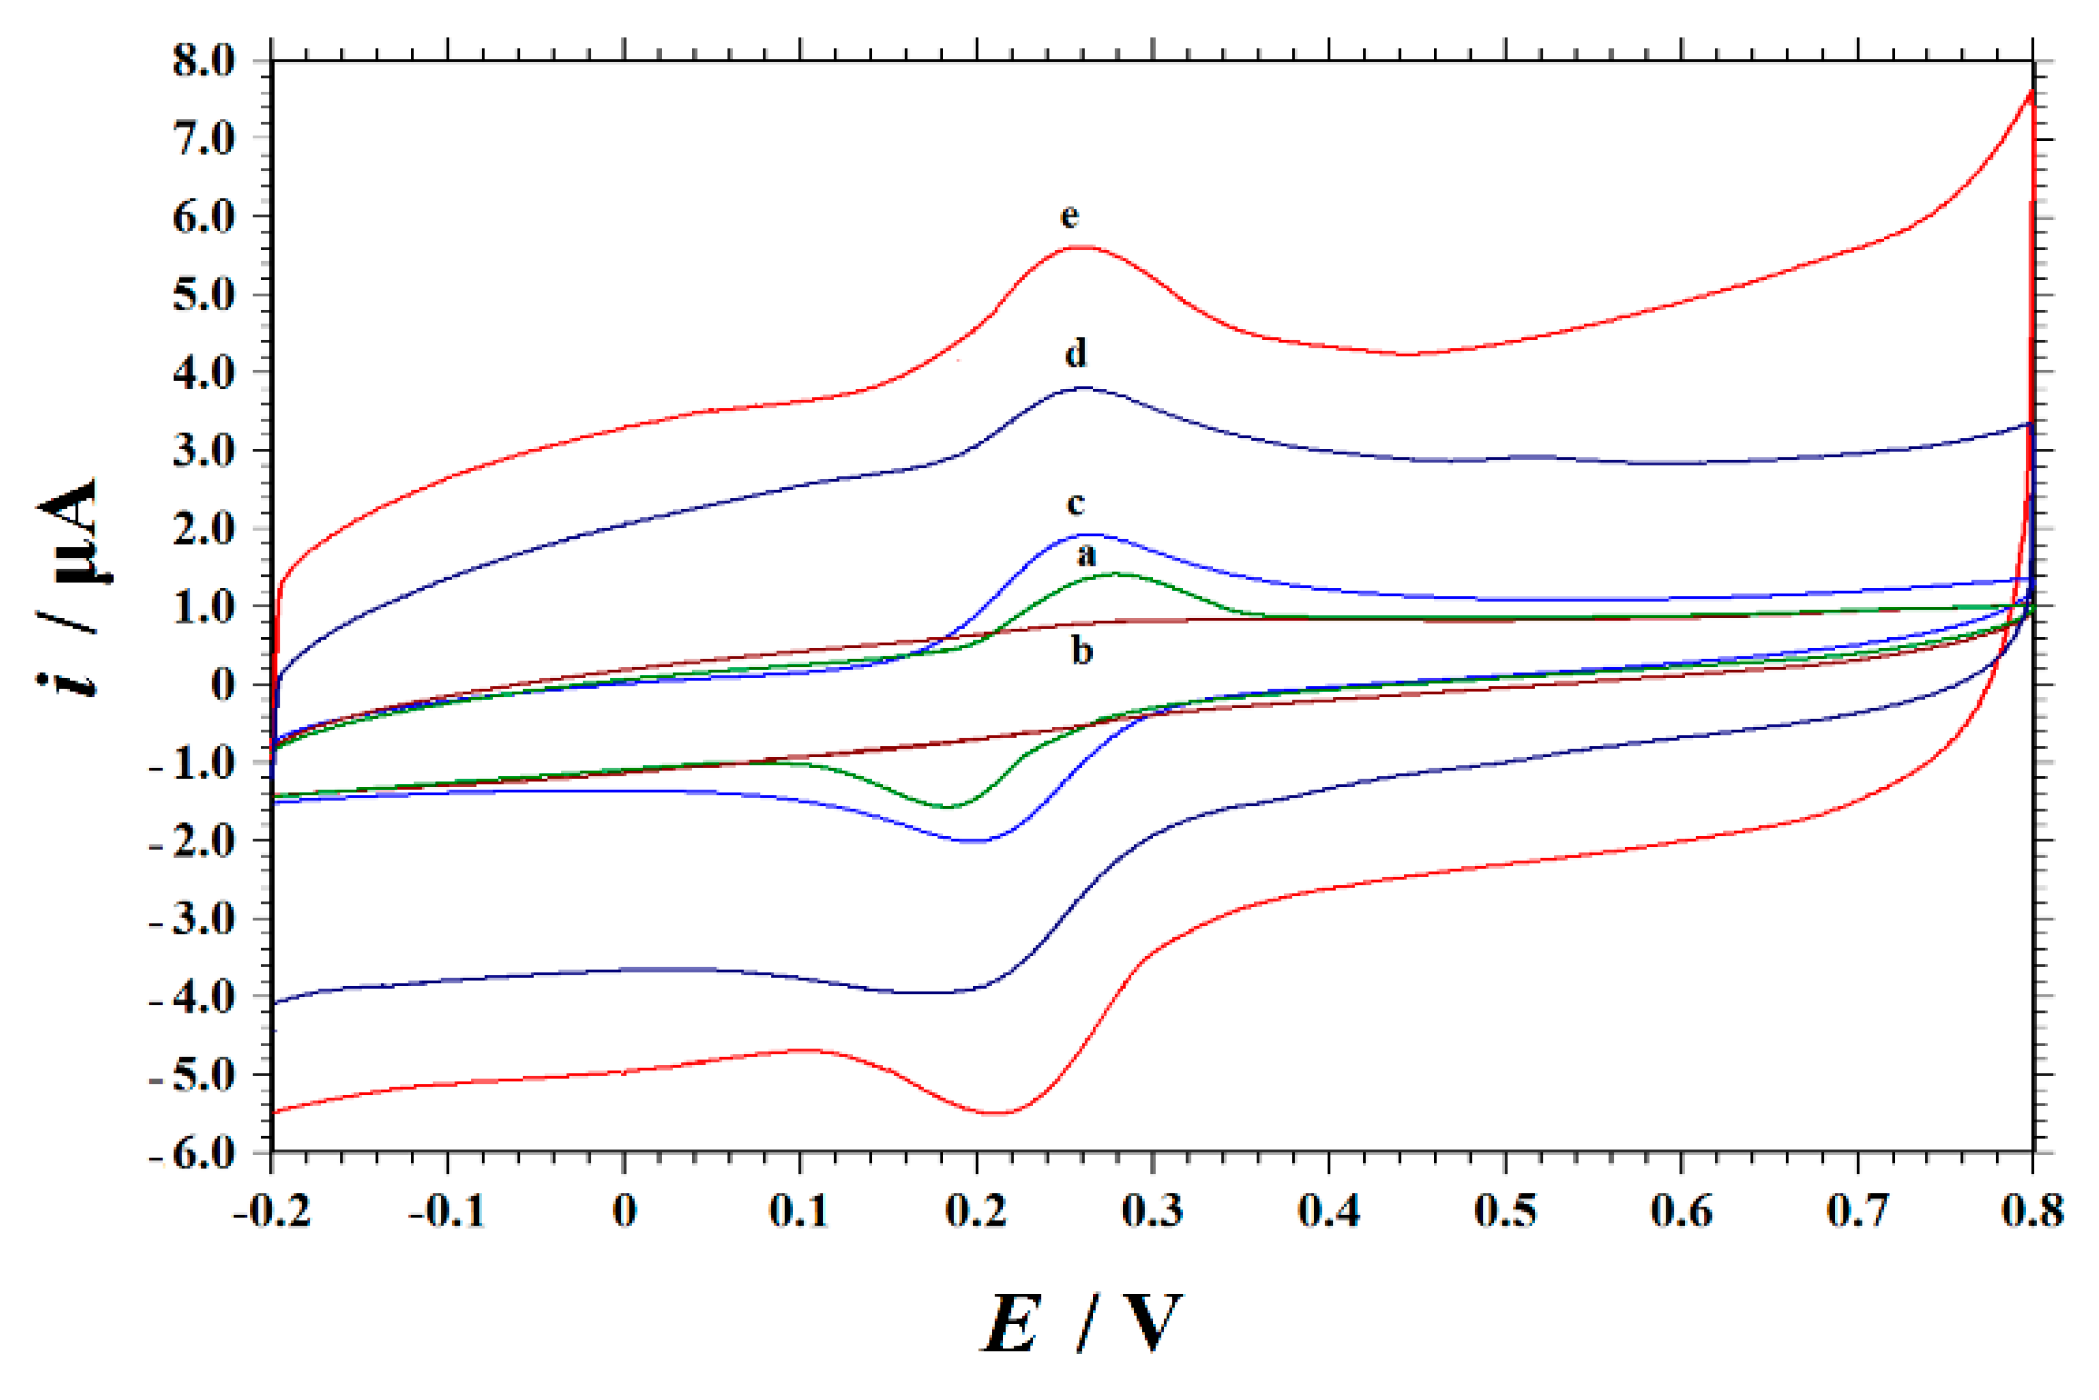
3.2. Electrochemical Properties of Modified Electrodes

The cyclic voltammetric responses on different electrodes were compared and recorded in a mixed solution of 1.0 mM K3[Fe(CN)6] and 0.5 M KCl concentrations, as shown in Figure 3. On GCE the peak-to-peak potential separation (ΔEp) was 79 mV and the redox peak current is the smallest (curve a), implying the quasi-reversible electron transfer process involved. However, after GO modification, there was a significant decrease of the redox peak current of [Fe(CN)6]3−/4−, which may be caused by the weak conductivity of GO and negative charge repulsion force between the ionized groups such as COO- in GO and [Fe(CN)6]3−/4− (curve b). While on NH2-Fe3O4 NPs-GO/GCE (curve c) and ErGO/GCE (curve d) the redox peak currents increased gradually, which may result from the presence of NH2-Fe3O4 NPs and ErGO on GCE surface. Moreover, the current value on ErGO/GCE was larger than that of NH2-Fe3O4 NPs/GCE, indicating a better conductivity of ErGO nanosheets than that of NH2-Fe3O4 NPs. On NH2-Fe3O4 NPs-ErGO/GCE (curve e), the highest redox peak current appeared with the ΔEp value decreased to 42 mV, implying a more reversible electron transfer process occurred for [Fe(CN)6]3−/4− probe. Therefore, the coexistence of ErGO and NH2-Fe3O4 NPs on the surface of GCE can complementarily improve the electron transfer rate and optimize a suitable electrochemical interface for the further application.

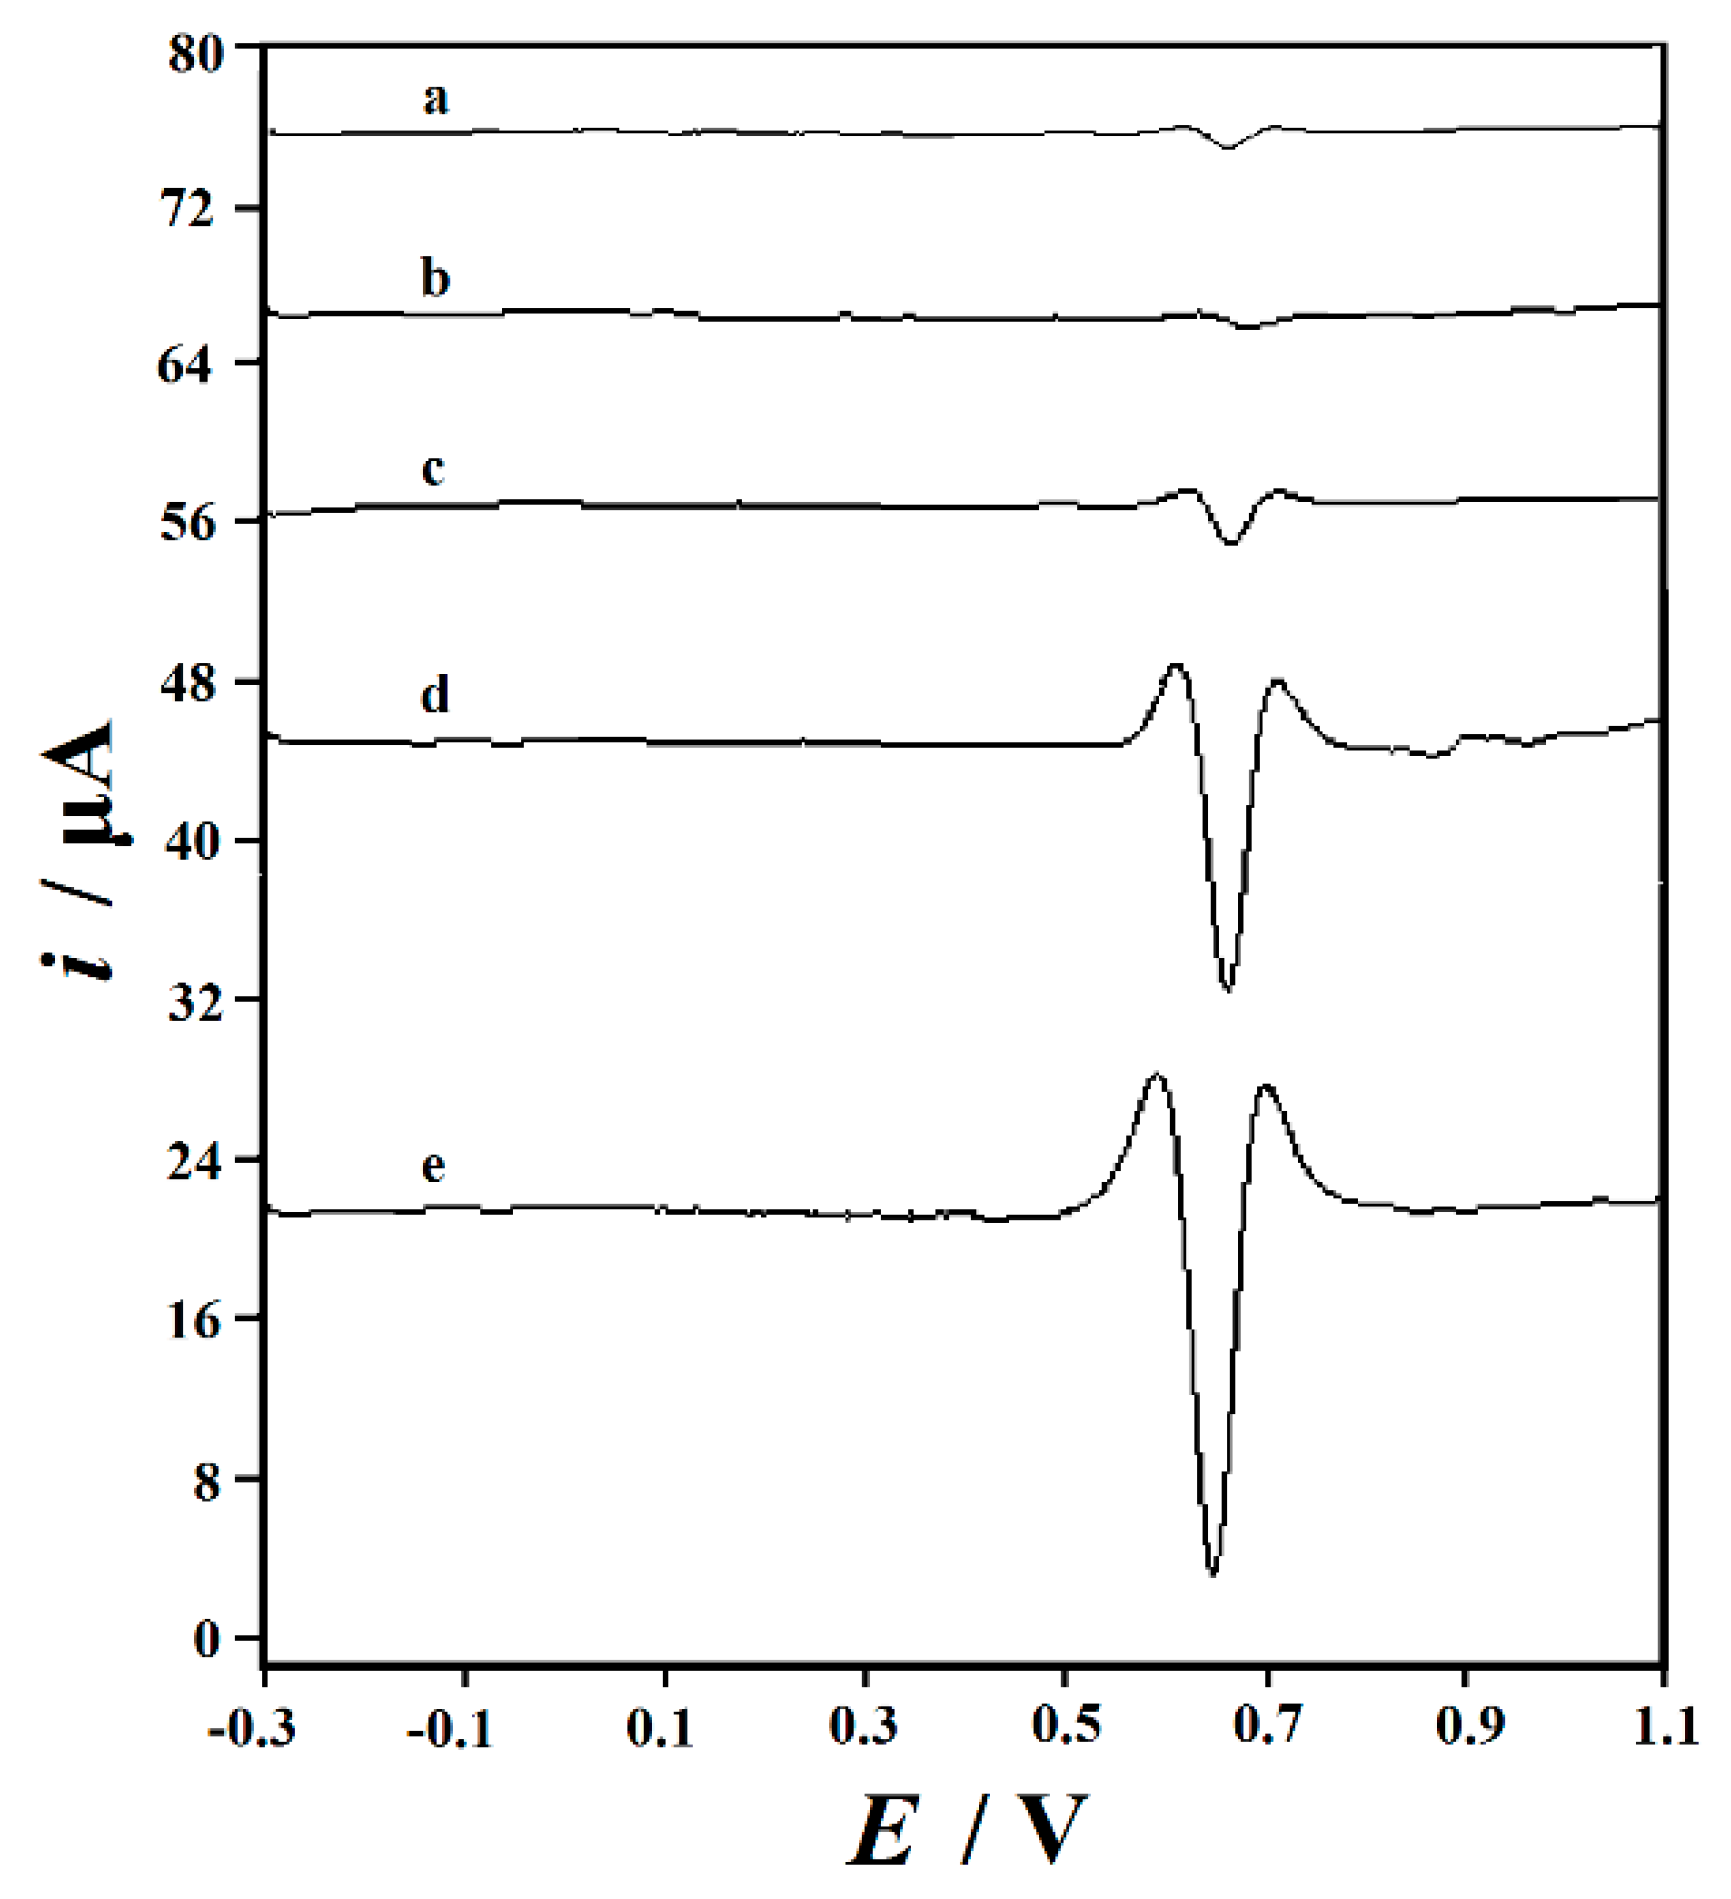
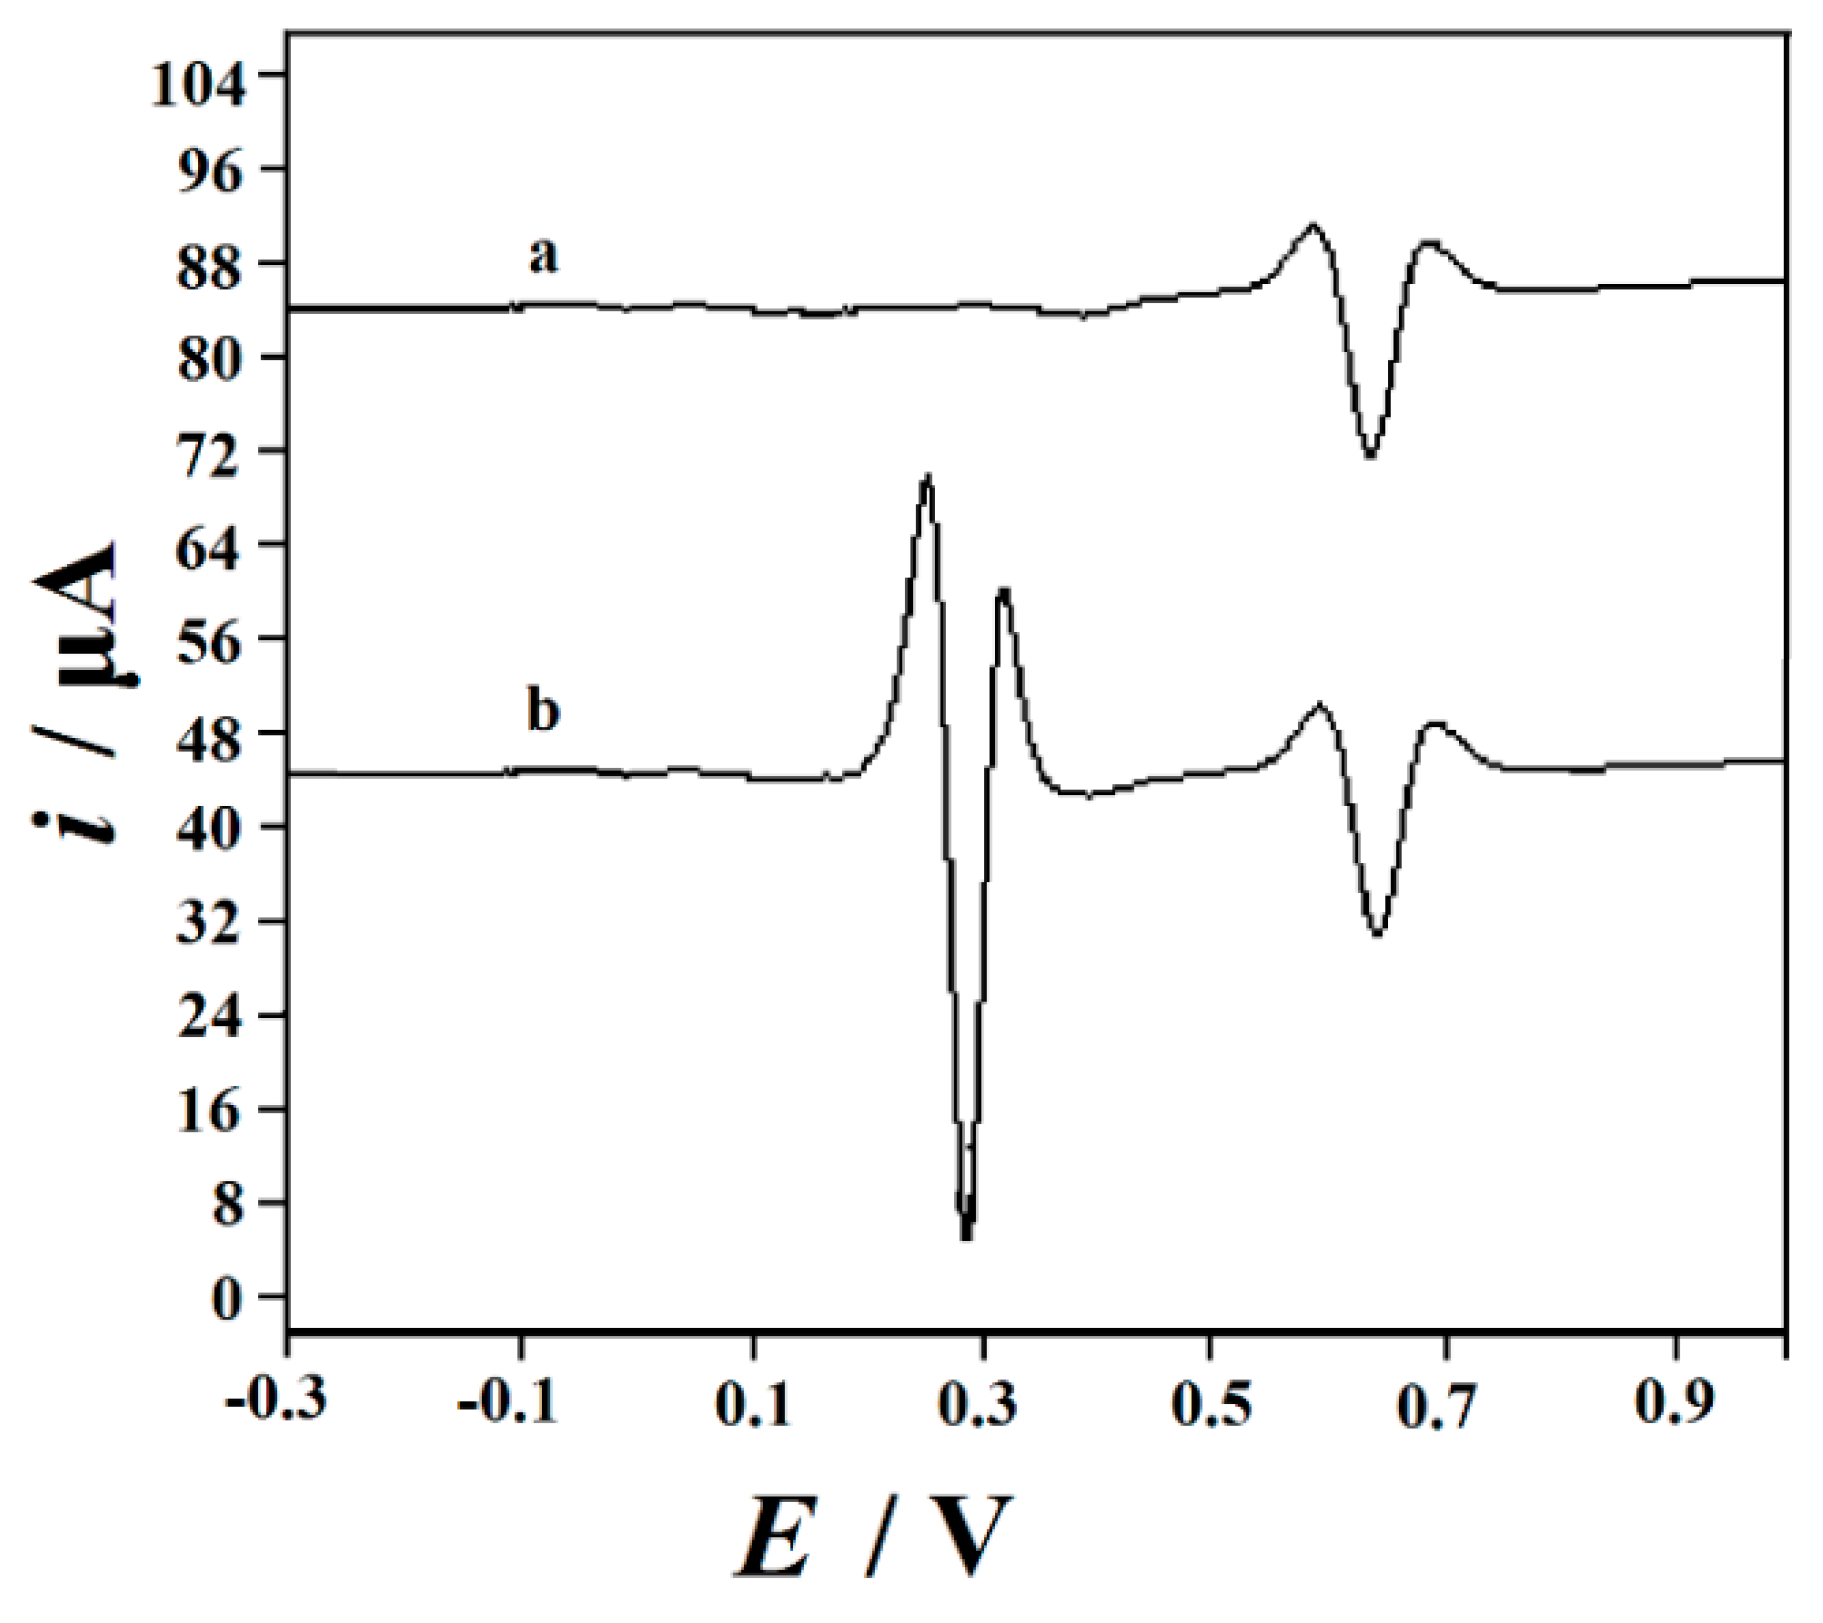
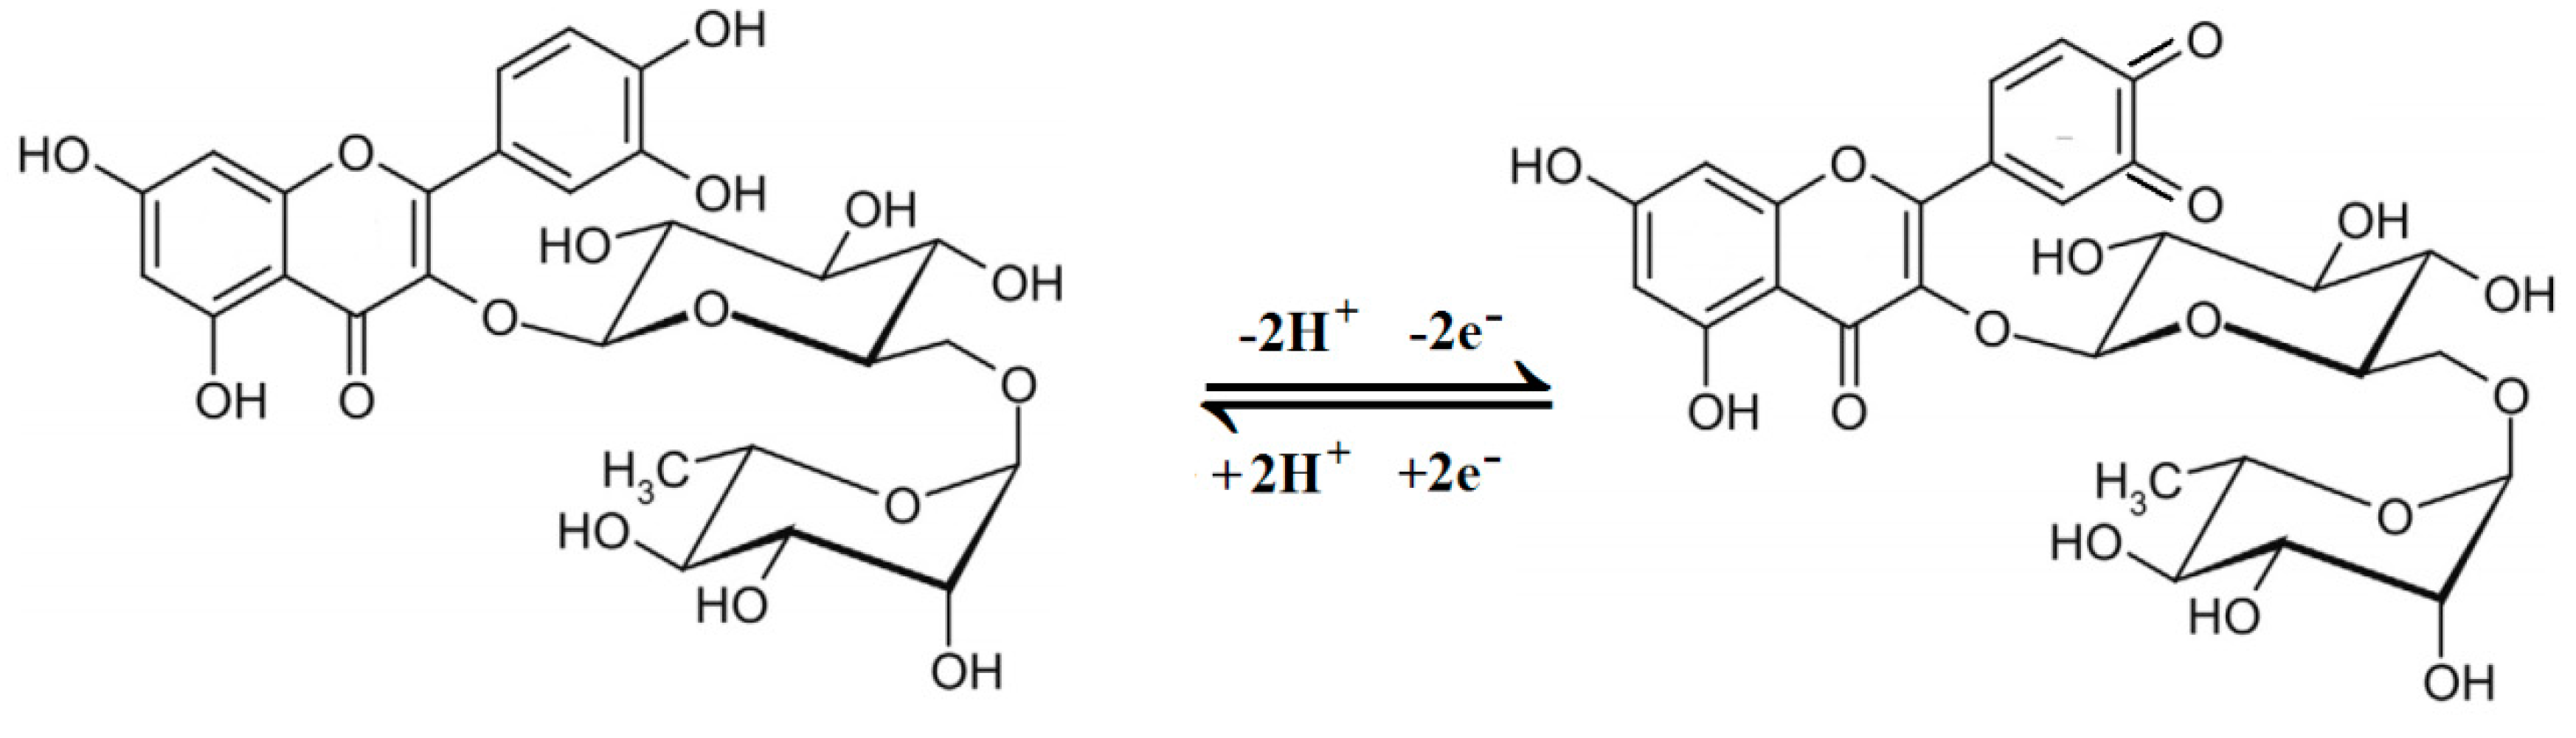
3.3. Rutin Cyclic Voltammograms on the Decorated Electrodes

The electrochemical behavior of rutin was firstly investigated by means of cyclic voltammetry (CV). Figure 4 shows the cyclic voltammograms of 10.0 µM rutin at different electrodes in 0.2 M H2SO4 at a scan rate of 0.1 V s−1. A pair of redox peaks was observed at each electrode from 0.0 to 1.0 V, indicating that rutin underwent a reversible redox process. Table 1 summarized the rutin electrochemical data at various decorated electrodes. It can be seen that on GO/GCE, the redox peak currents were smaller than that of GCE (curve b), which may be due to the low conductivity of GO, resulting in delayed electron transfer. The electrochemical data showed that the redox currents of rutin on NH2-Fe3O4 NPs-GO/GCE (curve c) and ErGO/GCE (curve d) were larger than that of bare GCE (curve a), which indicated the superiority of NH2-Fe3O4 NPs-GO/GCE and ErGO/GCE such as large surface area, inherent electrocatalytic ability, and good conductivity towards rutin detection. While on NH2-Fe3O4 NPs-ErGO/GCE the maximum redox peak currents appeared, indicating the synergistic effects of ErGO and NH2-Fe3O4 NPs were present on the electrode surface. ErGO has the advantages of large specific surface area, good catalytic activity and high conductivity. While the NH2-Fe3O4 NPs used in this experiment have excellent electrocatalytic activity and can be used as an electronic mediator to promote the transfer of electrons between the modified electrode and rutin solution. Due to the excellent properties of ErGO and NH2-Fe3O4 NPs combination, the sensing performance of the sensor towards rutin detection was greatly improved.
The electrochemical behavior of rutin on various electrodes was also investigated by the method of second derivative linear sweep voltammetry (SDLSV) in order to improve the sensitivity. Figure 5 shows the corresponding voltammograms of the NH2-Fe3O4 NPs-ErGO/GCE immersed in 10.0 µM rutin (0.2 M H2SO4). As it can be noticed, the oxidation peaks appear to have the same potentials as in the case of the CV. As compared to those of the CV results, the peaks obtained via SDLSV are better defined, the background current is lower, and the currents are higher. Therefore, SDLSV is the most suitable technique for rutin quantitative analysis. As shown in Figure 5, the current responses of rutin on different electrodes increased in the order of ip (GO/GCE) (0.6250 μA) < ip (GCE) (1.863 μA) < ip (NH2-Fe3O4 NPs-GO/GCE) (2.650 μA) < ip (ErGO/GCE) (15.99 μA) < ip (NH2-Fe3O4 NPs-ErGO/GCE) (24.95 μA). As compared with that of GCE, the oxidation peak potential of rutin on NH2-Fe3O4 NPs-ErGO/GCE shifted negatively by 11 mV and the oxidation peak current increased by nearly 13 times, as a result of the synergistic enhancement effect of ErGO and NH2-Fe3O4 NPs on the electrochemical reaction of rutin.

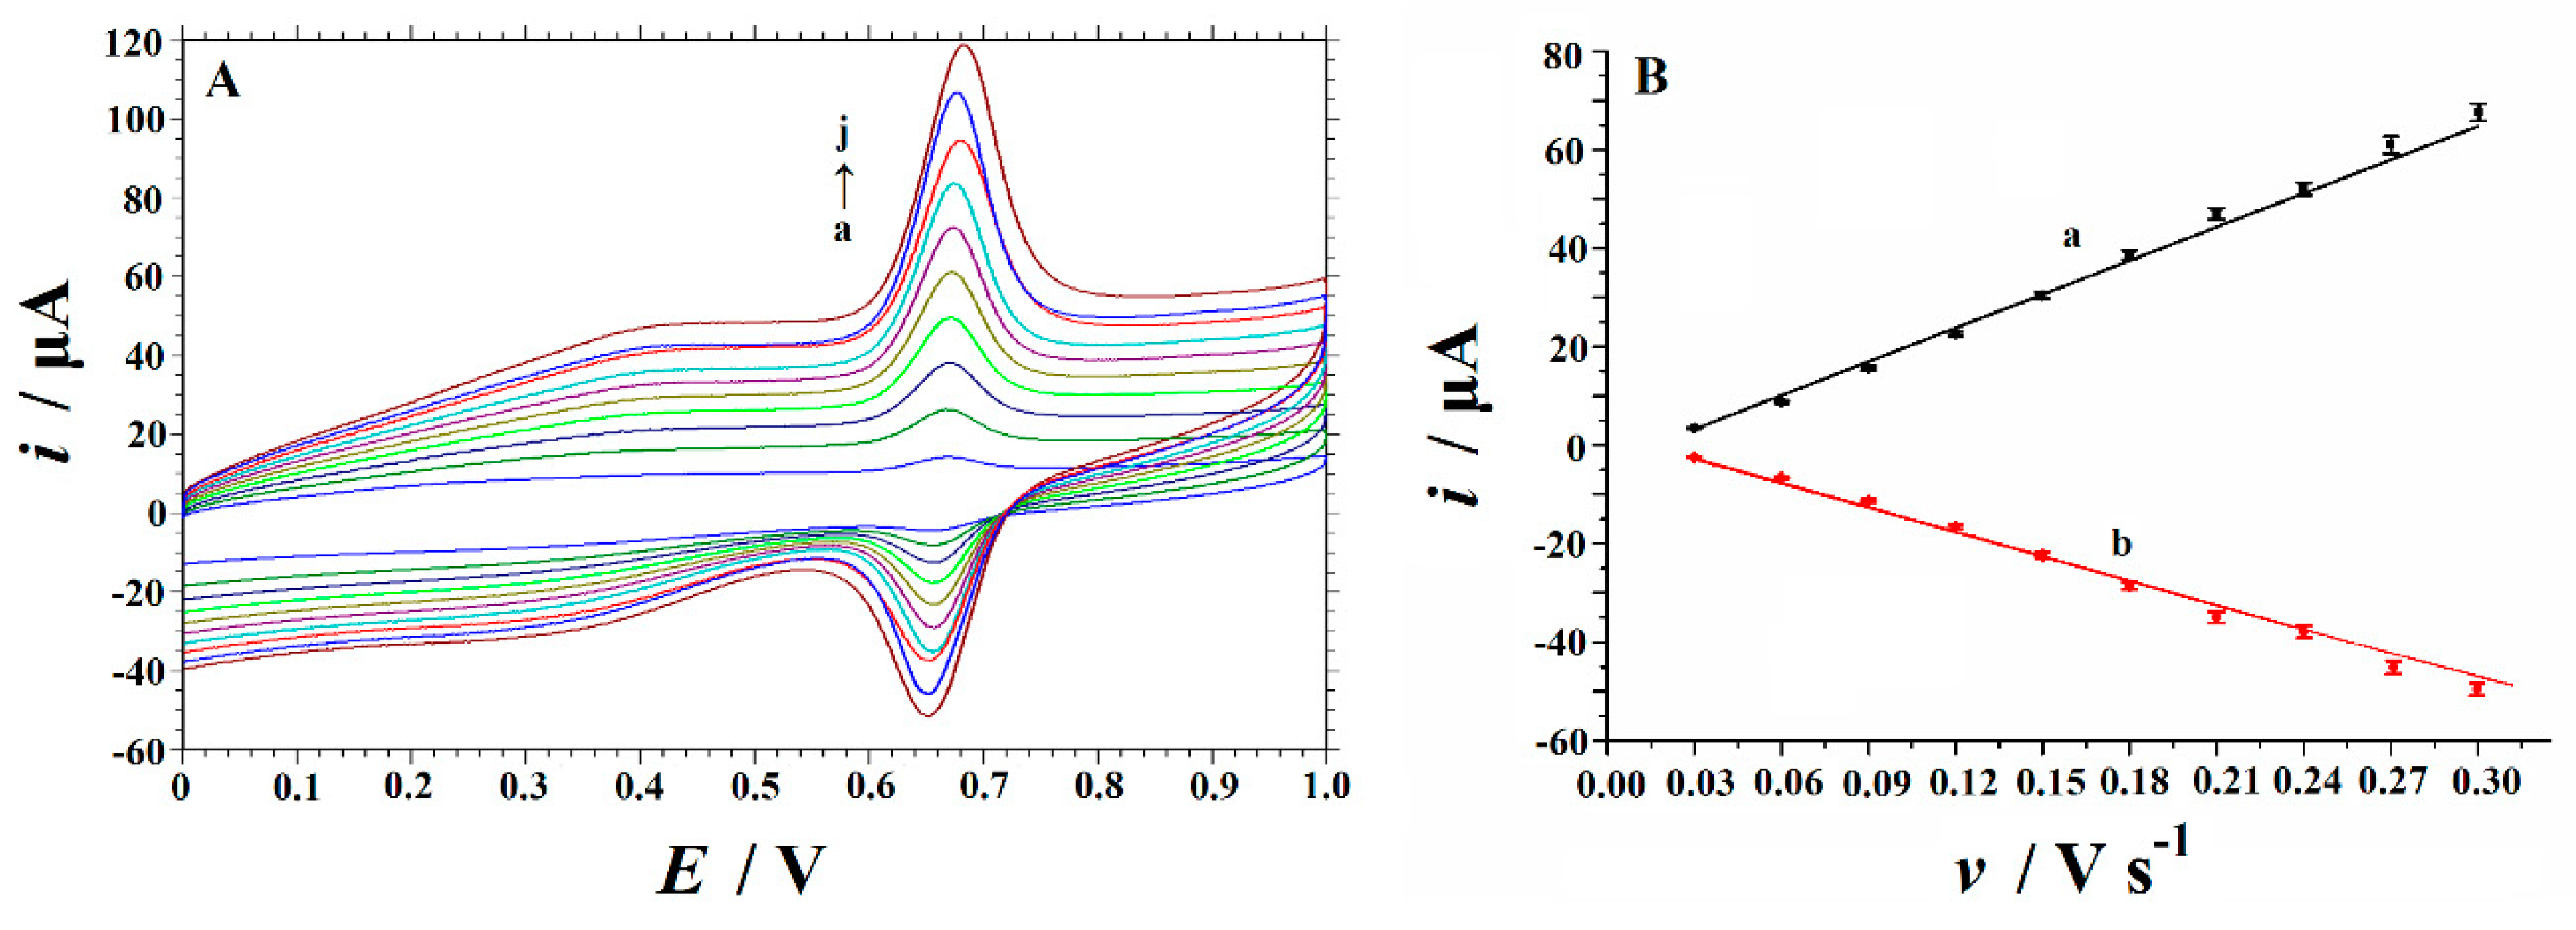
3.4. Effect of Scan Rate

Figure 6 shows the cyclic voltammograms of 10.0 µM rutin at NH2-Fe3O4 NPs-ErGO/GCEABPE with different scan rates (0.03–0.3V/s). As exhibited in Figure 6A, a pair of roughly symmetric anodic and cathodic peaks appeared, the rutin peak currents increased as the scan rate (v) increased and a significant linear relationship is observed between the peak currents and scan rates (Figure 6B). The regression equation is ipa (µA) = 253.01 v (V/s) −6.4469 (R2 = 0.9958) and ipc (µA) = −187.86v (V/s) + 4.9146 (R2 = 0.9931), indicating that the electrode process of rutin on NH2-Fe3O4 NPs-ErGO/GCE is controlled by adsorption. However, there was no significant change in the peak potentials with increasing the scan rate, which confirmed that the electrochemical reaction of rutin is reversible on the surface of NH2-Fe3O4 NPs-ErGO/GCE.

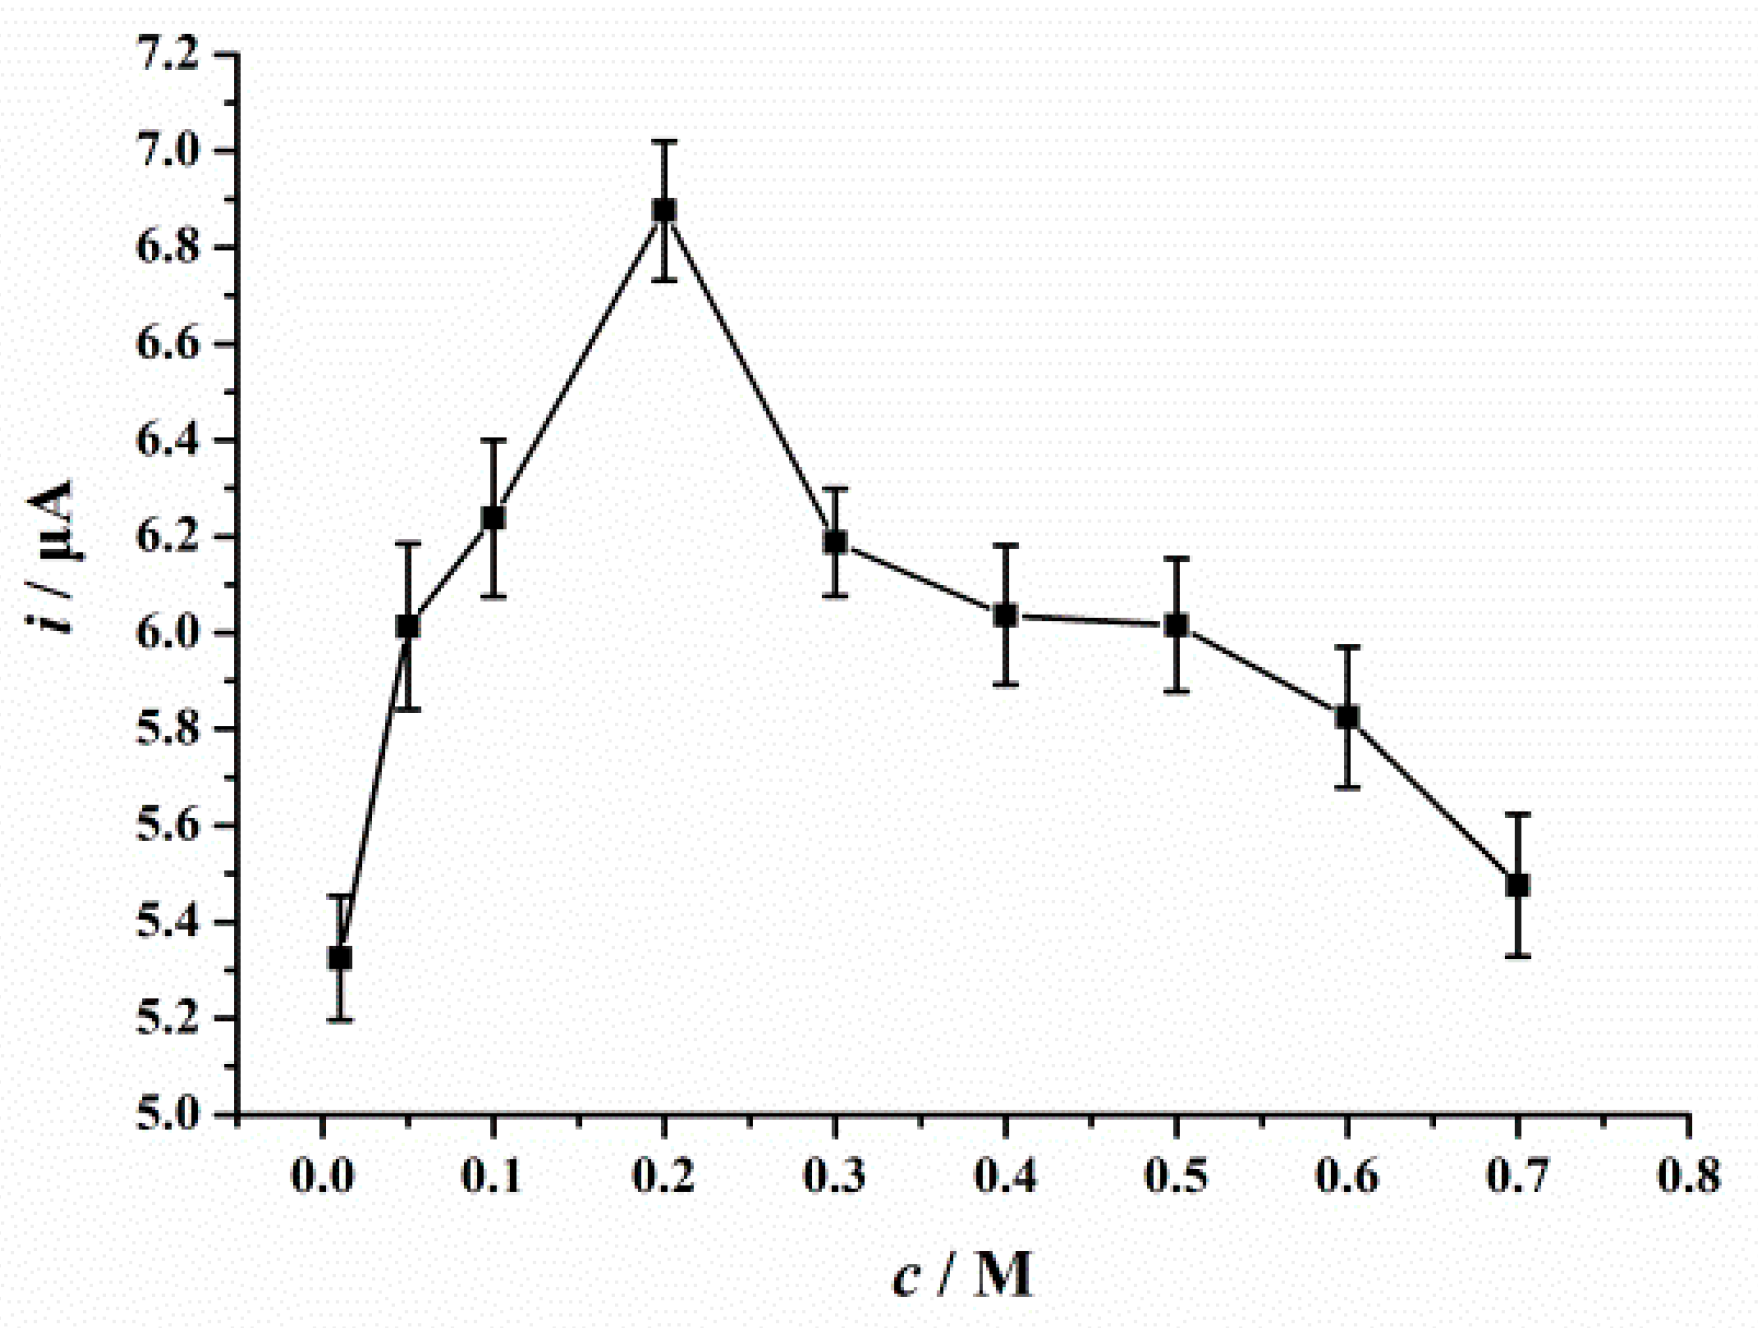
3.5. Effects of Supporting Electrolyte and Solution pH Variation

In general, supporting electrolyte and the pH of buffer solution play a dominant role for the voltammetric response of electrochemically active substances. To understand the effect of supporting electrolyte, SDLSVs were recorded and compared in many buffer solutions including HAc–NaAc buffer (pH 4.0), HAc-NH4Ac buffer (pH 4.0), phosphate buffer (pH 6.0), (CH2)6N4-HCl buffer (pH 5.0), NH3-NH4Cl (pH 9.0), H2SO4, HNO3, HCl and NaOH, each 0.1 M), respectively. The experimental data in Table 2 proved that the electro-oxidation of rutin is better performed in acidic media, while in neutral or alkaline media, the peak current decreased considerably. These phenomena might be explained by the fact that the hydroxyl groups in the rutin structure lost their protons in the basic solution, so the electrochemical reaction of rutin was more difficult to achieve [14,42]. The highest peak current and the best peak shape were observed in H2SO4 solution, thus it was selected as the working media.
From Figure 7, it can be seen that the oxidation peak current of rutin increased with the increase of H2SO4 concentration from 0.01 to 0.2 M, and then decreased with further increasing the concentration from 0.2 to 0.7 M. The maximum peak current appeared at 0.2 M concentration of H2SO4. The influence of pH on the peak potential of rutin was also studied. By changing the concentrations of H2SO4, different pH values media were obtained. As the value of the pH rises, a linear movement towards the lower peak potential values can be observed, and corresponding regression equation is Epa (V) = −0.0556 pH + 0.6528 (R2 = 0.9862). The slope between the peak potential and the pH is −55.6 mV/pH units, indicating that an equal number of electrons and protons are involved in the redox process as same as reported previously [43]. According to [13,14,42], the mechanism of electrooxidation of rutin could be explained as that the catechol structure of rutin is oxidized to 3’,4’ -diquinone, and the reduction reaction could take place on the decorated electrode surface. The electrode reaction equation was illustrated as the following Scheme 1.

3.6. Optimization of Parameters

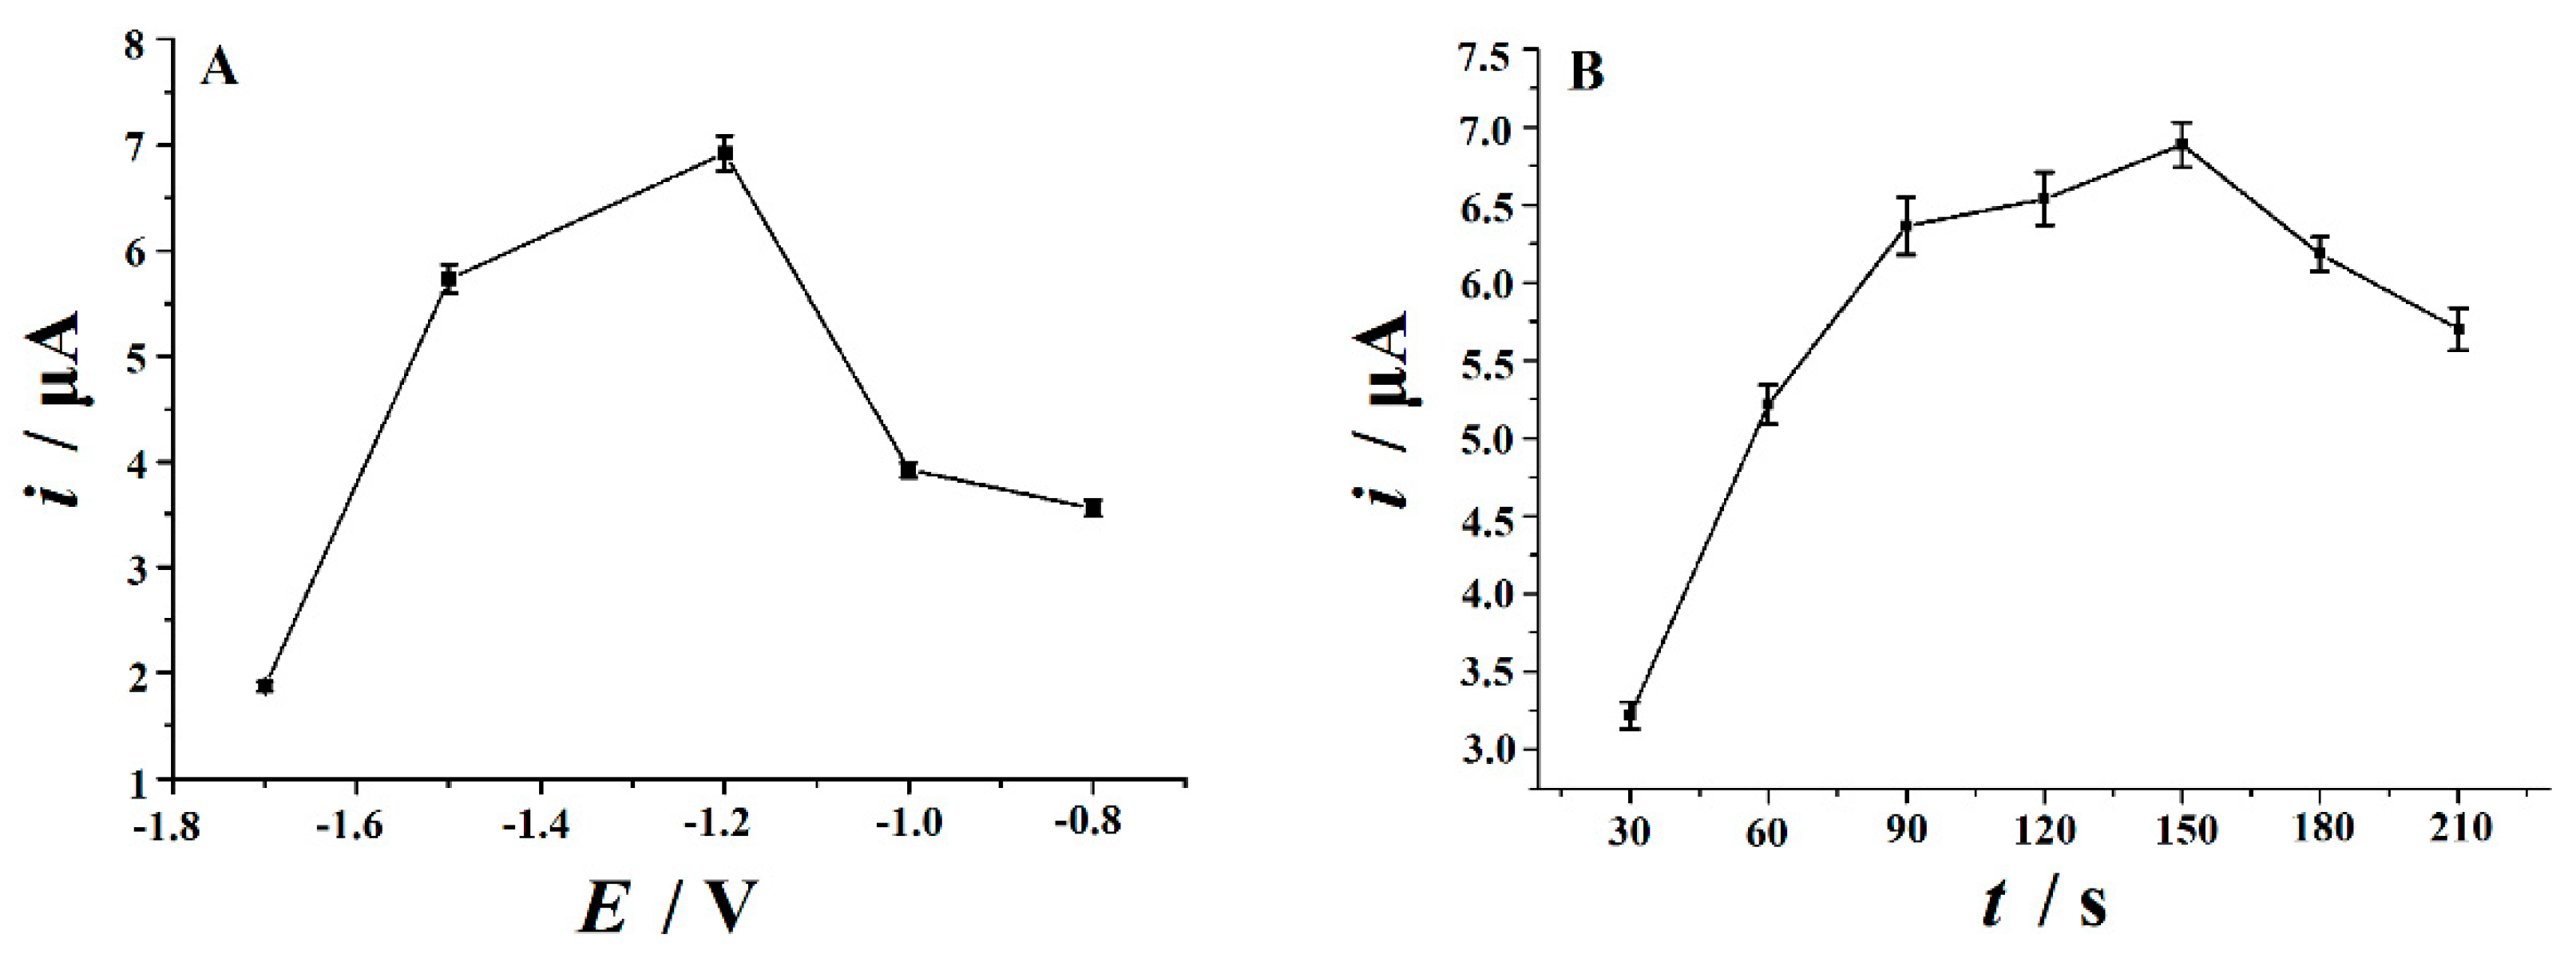
3.6.1. Electrochemical Reduction Conditions

It is well known that pure GR sometimes fails to demonstrate perfect performance because oxygen-contaminated functional groups (OxFG) often play a leading role of catalytic active centers in electrochemical reactions as reported [44,45]. The potentiostatic reduction method is easy to control. By changing the potential and time of reduction, a certain number of OxFG can remain [44]. In this work, GO was reduced by potentiostatic method. The NH2-Fe3O4 NPs-ErGO/GCE was immersed and reduced in phosphate buffer (pH 6.5) under adjusting potentials (−0.8, −1.0, −1.2, −1.5, and −1.7 V, respectively) for 120 s. After that, the oxidation peak currents of 10 µM rutin were measured and compared. The results showed that the peak current of rutin increased with the decrease of reduction potential, from −0.8 to −1.2 V. However, the peak current decreased when the reduction potential shifted to more negative direction (Figure 8A). The effect of reduction time was also investigated at a constant reduction potential of −1.2 V (Figure 8B). The peak current increased greatly within the first 150 s and then declined gradually. Consequently, −1.2 V and 150 s were used for the electrochemical optimum conditions for GO reduction.

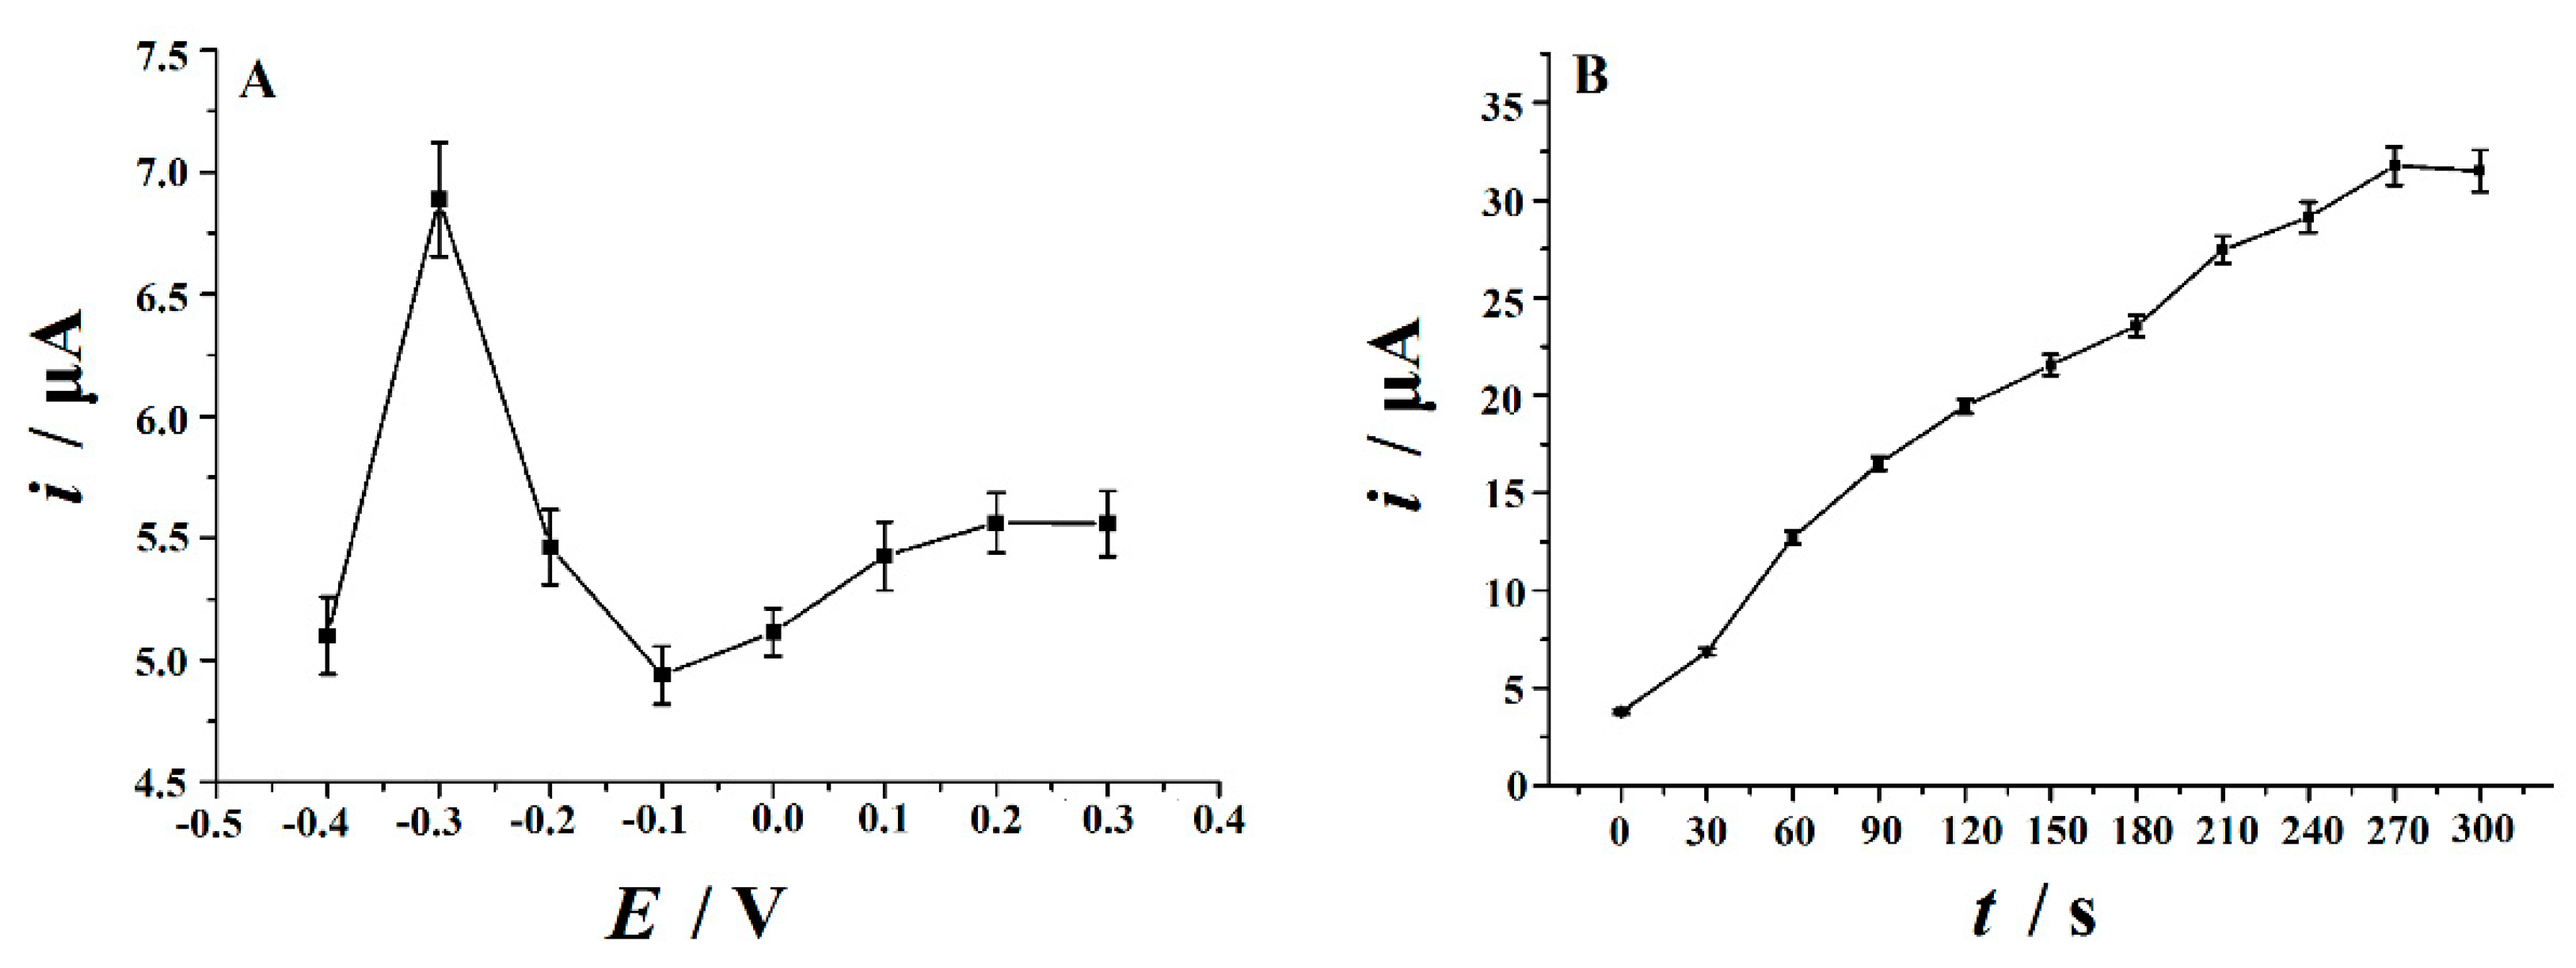
3.6.2. Accumulation Conditions

To enrich rutin concentration onto the NH2-Fe3O4 NPs-ErGO/GCE surface, accumulation was carried out before its detection. The effect of accumulation potential and time on the oxidation peak current (ipa) were examined. After 30 s accumulation time, the ipa was recorded at varying accumulation potentials in the range from −0.4 to 0.3 V. As shown in Figure 9A, the highest ipa appeared at the accumulation potential of −0.3 V. What is more, the effect of accumulation time was studied and compared at a fixed accumulation potential of −0.3 V (Figure 9B). In the first 270 s, with the increase of accumulation time, the ipa increased significantly, and then with the further increase of accumulation time, the ipa remained basically unchanged, indicating that the adsorption reached saturation. However, it is inconvenient using a long accumulation time. Therefore, the accumulation time of 210 s was used as a compromise between analysis speed and sensitivity.

3.7. Figures of Merit

3.7.1. The Study of Interferences

In order to facilitate the application, the effects of some foreign substances, especially those that commonly co-exist in biological samples and the pharmaceutical formulations, on the rutin detection were investigated by SDLSV. The interference study was performed by immersing the NH2-Fe3O4 NPs-ErGO/GCE into a fixed concentration of 1.0 μM rutin solution mixed with added foreign species. The results demonstrated that the relative error (RE) after adding interfering substances was less than ±5.0%, which indicated that NH2-Fe3O4 NPs-ErGO/GCE has good anti-interference ability for rutin determination (Table 3).
In addition, ascorbic acid (AA) is a chemically electroactive substance which often coexists with rutin in plants, crude drugs, pharmaceutical preparations (especially compound rutin tablets) and other biological samples. What is worse, the oxidation peak potential of AA is very close to that of rutin, indicating a poor selectivity and serious interfering effect for the rutin detection in real samples [19,20]. Therefore, the electrochemical responses of rutin in the presence of AA on the NH2-Fe3O4 NPs-ErGO/GCE were studied. The typical SDLSVs of 10.0 µM rutin in the absence and presence of AA on NH2-Fe3O4 NPs-ErGO/GCE is shown in Figure 10. A well defined oxidation peak at 0.665 V was found for rutin (curve a). Curve b is the voltammogram of 10.0 µM rutin in the presence of 1.0 mM AA under the same conditions. Two oxidation peaks of AA and rutin correspond to those at 0.296 and 0.665 V respectively. Thus, the oxidation peak potential separation was calculated as 0.369 V. The results show that a 100-fold excess of AA had no substantial interfering effect on the rutin determination (RE = −2.94%).

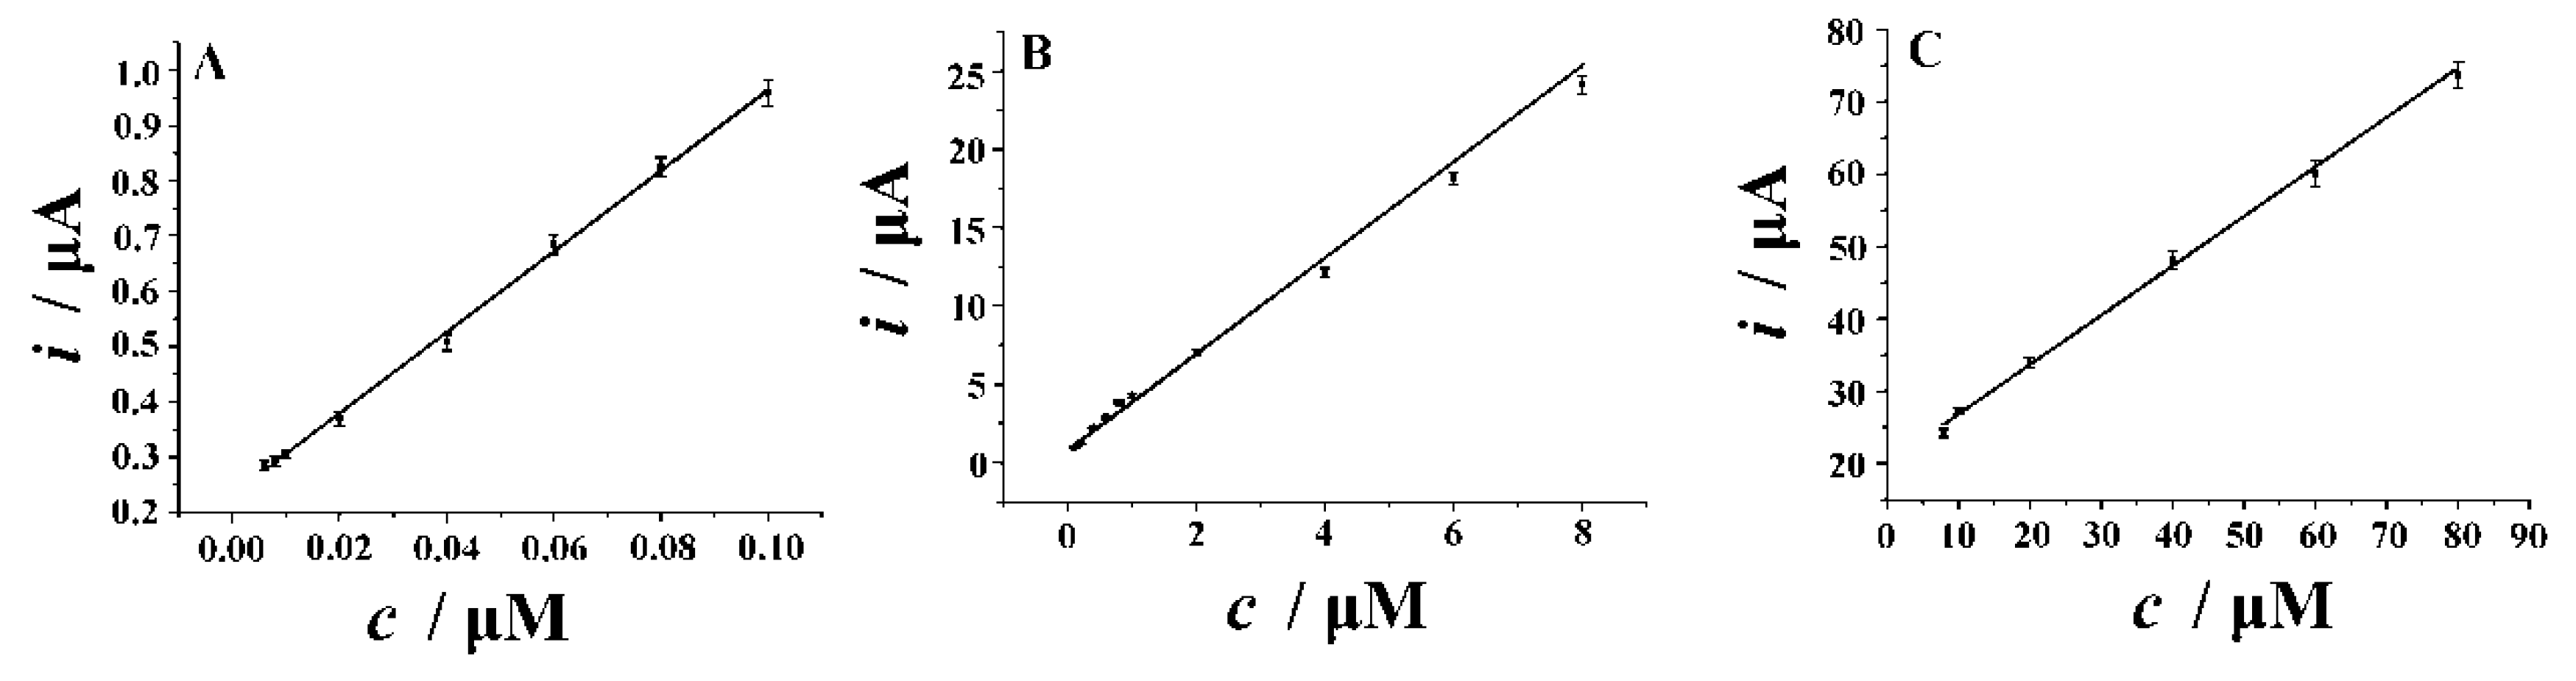
3.7.2. Calibration and Detection Limit

Under the optimized conditions and parameters, the calibration curve of rutin detection was established by SDLSV technique due to its better sensitivity and well-separated peak shape. The ipa value of rutin increased gradually with the increment of rutin concentration. As plotted in Figure 11, the linear relationships were established in three sections from the range of 6.0 nM–0.1 µM; 0.1–8.0 µM and 8.0–80 µM, the linear regression equations were ip (µA) = 7.3324c (µM) + 0.2308 (R2= 0.9986), ip (µA) = 2.8677c (µM) + 1.0583 (R2= 0.9984), and ip (µA) = 0.6752c (µM) + 20.021 (R2= 0.9982), respectively. A low detection limit of 4.0 nM was achieved. It is found that the calibration dependences exhibit intersection of calibration lines and the slopes are decreasing with increasing concentration of rutin. This phenomenon is caused by the fact that the peak current of rutin increases rapidly at low concentrations, and then increases slowly at higher concentrations. This may be explained with the saturated adsorption of rutin on the electrode surface and the rising of diffusion current at higher concentrations.
The method reported hereby and some previous procedures for rutin analysis are compared and summarized in Table 4 in terms of analytical figures and merits. As listed in Table 4, the proposed method can provide a linear range and detection limit comparable to (even superior to) other methods. In addition, this novel method has made remarkable progress in electrode fabrication simplification, time-saving and cost-reduction.

3.7.3. Repeatability and Stability of the Decorated Electrode

The repeatability of the NH2-Fe3O4 NPs-ErGO/GCE was evaluated by detecting 10 μM rutin. The relative standard deviation (RSD) of peak current measured for seven consecutive times was 2.7%. Six different electrodes were fabricated under the same procedure and the reproducibility was also tested. The RSD was 6.2% for the peak current of 10 μM rutin. The stability of the modified electrode was also examined. The electrode was stored at 4 °C in a refrigerator when not in use, and the current response of 10 μM rutin on the electrode remained 92.1% (RSD = 2.7%, n = 3) of its initial value after a week. These results indicated that the modified electrode had good regeneration performance and stability.

3.8. Analytical Application

Compound rutin tablets (20 mg per tablet, Shanxi Yunpeng Pharmaceutical Co. Ltd., China; Shanxi Linfen Qilin Pharmaceutical Co. Ltd., Linfen, China) and urine samples from volunteers were detected in order to evaluate the reliability in practical application of the developed method. Five pieces of rutin tablets were ground into powder in an agate mortar, and then the accurate weight of one tablet was weighed, dissolved with absolute alcohol and diluted to 10.0 mL to obtain the stock solution. Subsequently, an appropriate amount of the stock solutions and urine samples were diluted with 0.1 M HCl by different factors as the testing solution. Electrochemical test was performed under the optimal experimental conditions by SDLSV and the recoveries were obtained by the standard addition method. As summarized in Table 5, the results were satisfactory with the recoveries in the range of 98.8–103.7% for tablet samples and 101.4–103.0% for urine samples, respectively. UV-vis spectrophotometry was selected as a reference method to assess the accuracy of the proposed method. The t-test implied that there is no significant difference when the results are at a 99% confidence level, which proved that the voltammetric method for rutin detection is precisely accurate for real sample analysis.

4. Conclusions

Herein, a feasible and reliable electrochemical sensor for the detection of rutin was developed using a nanocomposite of amine-functionalized Fe3O4 nanoparticles and electrochemically reduced graphene (NH2-Fe3O4 NPs-ErGO) as the sensing material. Compared with bare GCE, ErGO/GCE and NH2-Fe3O4 NPs-GO/GCE, the oxidation signals of rutin are significantly enhanced on the nanocomposites modified GCE (NH2-Fe3O4 NPs-ErGO/GCE). Moreover, this modified electrode has been employed successfully to eliminate the interferences of ascorbic acid. The linear range for the detection of rutin using NH2-Fe3O4 NPs-ErGO/GCE were 6.0 nM–0.1 µM; 0.1–8.0 µM and 8.0–80 µM. The detection limit was 4.0 nM (S/N = 3). The developed method is sensitive and selective for the determination of rutin in pharmaceutical tablets and urine samples. Moreover, this novel method has some obvious advantages such as quick response, simplicity, high sensitivity and low cost.

Author Contributions

Q.H., P.D. and D.C. conceived and designed the experiments; Y.W., Y.T., J.L. and P.D. performed the experiments; P.D. and G.L. analyzed the data; Q.H. and D.C. contributed reagents/materials/analysis tools; Q.H. and P.D. wrote the paper.

Funding

This work was supported by the NSFC (61703152), Hunan Provincial Natural Science Foundation (2016JJ4010, 2018JJ3134), Postgraduates Innovation Fund of School of Life Science and Chemistry in HUT, Doctoral Program Construction of Hunan University of Technology, Project of Science and Technology Department of Hunan Province (Quanguo He), Project of Science and Technology Plan in Zhuzhou (201706-201806) and Opening Project of Key Discipline of Materials Science in Guangdong (ESI Project GS06021, CNXY2017001, CNXY2017002 and CNXY2017003), The key Project of Department of Education of Guangdong Province (2016GCZX008) and The Project of Engineering Research Center of Foshan (20172010018).

Conflicts of Interest

The authors declare no conflict of interest.

References

  1. Tian, Q.; Li, D.; Patil, B.S. Identification and determination of flavonoids in buckwheat (Fagopyrum esculentum Moench, Polygonaceae) by high-performance liquid chromatography with electrospray ionisation mass spectrometry and photodiode array ultraviolet detection. Phytochem. Anal. 2002, 13, 251–256. [Google Scholar] [CrossRef] [PubMed]
  2. Koval’skii, I.V.; Krasnyuk, I.I.; Nikulina, O.I.; Belyatskaya, A.V.; Kharitonov, Y.Y.; Feldman, N.B.; Lutsenko, S.V. Mechanisms of rutin pharmacological action (review). Pharm. Chem. J. 2014, 48, 73–76. [Google Scholar] [CrossRef]
  3. Sharma, S.; Ali, A.; Ali, J.; Sahni, J.K.; Baboota, S. Rutin: Therapeutic potential and recent advances in drug delivery. Expert Opin. Investig. Drugs 2013, 22, 1063–1079. [Google Scholar] [CrossRef] [PubMed]
  4. Wu, H.; Chen, M.; Fan, Y.; Elsebaei, F.; Zhu, Y. Determination of rutin and quercetin in Chinese herbal medicine by ionic liquid-based pressurized liquid extraction-liquid chromatography-chemiluminescence detection. Talanta 2012, 88, 222–229. [Google Scholar] [CrossRef] [PubMed]
  5. Yıldırım, S.; Kadıoğlu, A.; Sağlam, A.; Yaşar, A. Determination of phenolic acids and rutin in Heliotropium thermophilum by high-performance liquid chromatography with photodiode array detection. Instrum. Sci. Technol. 2017, 45, 35–48. [Google Scholar] [CrossRef]
  6. Song, Z.; Hou, S. Sensitive determination of sub-nanogram amounts of rutin by its inhibition on chemiluminescence with immobilized reagents. Talanta 2002, 57, 59–67. [Google Scholar] [CrossRef]
  7. Du, J.; Li, Y.; Lu, J. Flow injection chemiluminescence determination of rutin based on its enhancing effect on the luminol-ferricyanide/ferrocyanide system. Anal. Lett. 2001, 34, 1741–1748. [Google Scholar] [CrossRef]
  8. Memon, A.F.; Solangi, A.R.; Memon, S.Q.; Mallah, A.; Memon, N.; Memon, A.A. Simultaneous determination of quercetin, rutin, naringin, and naringenin in different fruits by capillary zone electrophoresis. Food Anal. Methods 2017, 10, 83–91. [Google Scholar] [CrossRef]
  9. Xu, H.; Li, Y.; Tang, H.W.; Liu, C.M.; Wu, Q.S. Determination of rutin with UV-vis spectrophotometric and laser-induced fluorimetric detections using a non-scanning spectrometer. Anal. Lett. 2010, 43, 893–904. [Google Scholar] [CrossRef]
  10. Lu, Y.; Gao, B.; Chen, P.; Charles, D.; Yu, L. Characterisation of organic and conventional sweet basil leaves using chromatographic and flow-injection mass spectrometric (FIMS) fingerprints combined with principal component analysis. Food Chem. 2014, 154, 262–268. [Google Scholar] [CrossRef] [Green Version]
  11. Duan, L.; Yang, L.; Xiong, H.; Zhang, X.; Wang, S. Studies on the electrochemistry of rutin and its interaction with bovine serum albumin using a glassy carbon electrode modified with carbon-coated nickel nanoparticles. Microchim. Acta 2013, 180, 355–361. [Google Scholar] [CrossRef]
  12. Apetrei, I.M.; Apetrei, C. A modified nanostructured graphene-gold nanoparticle carbon screenprinted electrode for the sensitive voltammetric detection of rutin. Measurement 2018, 114, 37–43. [Google Scholar] [CrossRef]
  13. Gao, F.; Qi, X.; Cai, X.; Wang, Q.; Gao, F.; Sun, W. Electrochemically reduced graphene modified carbon ionic liquid electrode for the sensitive sensing of rutin. Thin Solid Films 2012, 520, 5064–5069. [Google Scholar] [CrossRef]
  14. Gholivand, M.B.; Mohammadi-Behzad, L.; Hosseinkhani, H. Application of a Cu–chitosan/multiwalled carbon nanotube film-modified electrode for the sensitive determination of rutin. Anal. Biochem. 2016, 493, 35–43. [Google Scholar] [CrossRef] [PubMed]
  15. Niu, X.; Weng, W.; Yin, C.; Niu, Y.; Li, G.; Dong, R.; Men, Y.; Sun, W. Black phosphorene modified glassy carbon electrode for the sensitive voltammetric detection of rutin. J. Electroanal. Chem. 2018, 811, 78–83. [Google Scholar] [CrossRef]
  16. Sun, W.; Wang, X.; Zhu, H.; Sun, X.; Shi, F.; Li, G.; Sun, Z. Graphene-MnO2 nanocomposite modified carbon ionic liquid electrode for the sensitive electrochemical detection of rutin. Sens. Actuators B 2013, 178, 443–449. [Google Scholar] [CrossRef]
  17. Yang, S.; Li, G.; Zhao, J.; Zhu, H.; Qu, L. Electrochemical preparation of Ag nanoparticles/poly(methylene blue) functionalized graphene nanocomposite film modified electrode for sensitive determination of rutin. J. Electroanal. Chem. 2014, 717–718, 225–230. [Google Scholar] [CrossRef]
  18. Zhang, Y.; Zheng, J. Sensitive voltammetric determination of rutin at an ionic liquid modified carbon paste electrode. Talanta 2008, 77, 325–330. [Google Scholar] [CrossRef]
  19. Deng, P.; Xu, Z.; Li, J. Simultaneous determination of ascorbic acid and rutin in pharmaceutical preparations with electrochemical method based on multi-walled carbon nanotubes-chitosan composite film modified electrode. J. Pharm. Biomed. Anal. 2013, 76, 234–242. [Google Scholar] [CrossRef]
  20. Deng, P.; Xu, Z.; Feng, Y. Highly sensitive and simultaneous determination of ascorbic acid and rutin at an acetylene black paste electrode coated with cetyltrimethyl ammonium bromide film. J. Electroanal. Chem. 2012, 683, 47–54. [Google Scholar] [CrossRef]
  21. Park, S.; Ruoff, R.S. Chemical methods for the production of graphenes. Nat. Nanotechnol. 2009, 4, 217–224. [Google Scholar] [CrossRef]
  22. He, Q.; Liu, J.; Liu, X.; Li, G.; Deng, P.; Liang, J. Manganese dioxide Nanorods/electrochemically reduced graphene oxide nanocomposites modified electrodes for cost-effective and ultrasensitive detection of Amaranth. Colloids Surf. B Biointerfaces 2018, 172, 565–572. [Google Scholar] [CrossRef] [PubMed]
  23. He, Q.; Liu, J.; Liu, X.; Li, G.; Chen, D.; Deng, P.; Liang, J. A promising sensing platform toward dopamine using MnO2 nanowires/electro-reduced graphene oxide composites. Electrochim. Acta 2019, 296, 683–692. [Google Scholar] [CrossRef]
  24. He, Q.; Liu, J.; Liang, J.; Liu, X.; Li, W.; Liu, Z.; Ding, Z.; Tuo, D. Towards Improvements for Penetrating the Blood–Brain Barrier—Recent Progress from a Material and Pharmaceutical Perspective. Cells 2018, 7, 24. [Google Scholar] [CrossRef] [PubMed]
  25. He, Q.; Liu, J.; Liu, X.; Li, G.; Deng, P.; Liang, J.; Chen, D. Sensitive and Selective Detection of Tartrazine Based on TiO2-Electrochemically Reduced Graphene Oxide Composite-Modified Electrodes. Sensors 2018, 18, 1911. [Google Scholar] [CrossRef] [PubMed]
  26. He, Q.; Liu, J.; Liu, X.; Xia, Y.; Li, G.; Deng, P.; Chen, D. Novel Electrochemical Sensors Based on Cuprous Oxide-Electrochemically Reduced Graphene Oxide Nanocomposites Modified Electrode toward Sensitive Detection of Sunset Yellow. Molecules 2018, 23, 2130. [Google Scholar] [CrossRef] [PubMed]
  27. He, Q.; Liu, J.; Liu, X.; Li, G.; Chen, D.; Deng, P.; Liang, J. Fabrication of Amine-Modified Magnetite-Electrochemically Reduced Graphene Oxide Nanocomposite Modified Glassy Carbon Electrode for Sensitive Dopamine Determination. Nanomaterials 2018, 8, 194. [Google Scholar] [CrossRef] [PubMed]
  28. Ning, J.; He, Q.; Luo, X.; Wang, M.; Liu, D.; Wang, J.; Li, G.; Liu, J. Determination of Uric Acid in Co-Presence of Dopamine and Ascorbic Acid Using Cuprous Oxide Nanoparticle-Functionalized Graphene Decorated Glassy Carbon Electrode. Catalysts 2018, 8, 407. [Google Scholar] [CrossRef]
  29. Ning, J.; He, Q.; Luo, X.; Wang, M.; Liu, D.; Wang, J.; Liu, J.; Li, G. Rapid and Sensitive Determination of Vanillin Based on a Glassy Carbon Electrode Modified with Cu2O-Electrochemically Reduced Graphene Oxide Nanocomposite Film. Sensors 2018, 18, 2762. [Google Scholar] [CrossRef]
  30. He, Q.; Liu, J.; Liu, X.; Li, G.; Deng, P.; Liang, J. Preparation of Cu2O-reduced graphene nanocomposite modified electrodes towards ultrasensitive dopamine detection. Sensors 2018, 18, 199. [Google Scholar] [CrossRef]
  31. He, Q.; Liu, J.; Liang, J.; Liu, X.; Tuo, D.; Li, W. Chemically surface tunable solubility parameter for controllable drug delivery-an example and perspective from hollow PAA-coated magnetite nanoparticles with R6G model drug. Materials 2018, 11, 247. [Google Scholar] [CrossRef]
  32. He, Q.; Liu, J.; Liang, J.; Liu, X.; Ding, Z.; Tuo, D.; Li, W. Sodium acetate orientated hollow/mesoporous magnetite nanoparticles: Facile synthesis, characterization and formation mechanism. Appl. Sci. 2018, 8, 292. [Google Scholar] [CrossRef]
  33. Liu, J.; Huang, C.; He, Q. Pharmaceutical application of magnetic iron oxide nanoparticles. Sci. Adv. Mater. 2015, 7, 672–685. [Google Scholar] [CrossRef]
  34. Ye, Y.; Kong, T.; Yu, X.; Wu, Y.; Zhang, K.; Wang, X. Enhanced nonenzymatic hydrogen peroxide sensing with reduced graphene oxide/ferroferric oxide nanocomposites. Talanta 2012, 89, 417–421. [Google Scholar] [CrossRef] [PubMed]
  35. Zhang, W.; Zheng, J.; Shi, J.; Lin, Z.; Huang, Q.; Zhang, H.; Wei, C.; Chen, J.; Hu, S.; Hao, A. Nafion covered core–shell structured Fe3O4@graphene nanospheres modified electrode for highly selective detection of dopamine. Anal. Chim. Acta 2015, 853, 285–290. [Google Scholar] [CrossRef]
  36. Yin, H.; Zhou, Y.; Ma, Q.; Ai, S.; Chen, Q.; Zhu, L. Electrocatalytic oxidation behavior of guanosine at graphene, chitosan and Fe3O4 nanoparticles modified glassy carbon electrode and its determination. Talanta 2010, 82, 1193–1199. [Google Scholar] [CrossRef]
  37. Teymourian, H.; Salimi, A.; Khezrian, S. Fe3O4 magnetic nanoparticles/reduced graphene oxide nanosheets as a novel electrochemical and bioeletrochemical sensing platform. Biosens. Bioelectron. 2013, 49, 1–8. [Google Scholar] [CrossRef]
  38. Sun, Y.; Zhang, W.; Yu, H.; Hou, C.; Li, D.; Zhang, Y.; Liu, Y. Controlled synthesis various shapes Fe3O4 decorated reduced graphene oxide applied in the electrochemical detection. J. Alloy Compd. 2015, 638, 182–187. [Google Scholar] [CrossRef]
  39. He, Q.; Lang, J.; Li, G.; Deng, P.; Liu, J.; Liu, X. Electrochemical Detection of Dopamine Based on MnO2 Nanowires/Reduced Graphene Oxide Composites Modified Glassy Carbon Electrode. Chin. J. Anal. Chem. 2018, 46, 438–445. [Google Scholar]
  40. Wu, D.; Li, Y.; Zhang, Y.; Wang, P.; Wei, Q.; Du, B. Sensitive electrochemical sensor for simultaneous determination of dopamine, ascorbic Acid, and uric acid enhanced by amino-group functionalized mesoporous Fe3O4@graphene sheets. Electrochim. Acta 2014, 116, 244–249. [Google Scholar] [CrossRef]
  41. Guo, S.; Li, D.; Zhang, L.; Li, J.; Wang, E. Monodisperse mesoporous superparamagnetic single-crystal magnetite nanoparticles for drug delivery. Biomaterials 2009, 30, 1881–1889. [Google Scholar] [CrossRef] [PubMed]
  42. Yang, S.; Wang, G.; Li, G.; Du, J.; Qu, L. Decoration of graphene modified carbon paste electrode with flower-globular terbium hexacyanoferrate for nanomolar detection of rutin. Electrochim. Acta 2014, 144, 268–274. [Google Scholar] [CrossRef]
  43. Bard, A.J.; Faulkner, L.R. Electrochemical Methods: Fundamentals Applications, 2nd ed.; Wiley: New York, NY, USA, 2001. [Google Scholar]
  44. Guo, H.L.; Wang, X.F.; Qian, Q.Y.; Wang, F.B.; Xia, X.H. A green approach to the synthesis of graphene nanosheets. ACS Nano 2009, 3, 2653–2659. [Google Scholar] [CrossRef] [PubMed]
  45. Xiong, H.; Jin, B. The electrochemical behavior of AA and DA on graphene oxide modified electrodes containing various content of oxygen functional groups. J. Electroanal. Chem. 2011, 661, 77–83. [Google Scholar] [CrossRef]
Figure 1. Scanning electron microscope (SEM) images of graphene oxide (GO) (A), Amine-functionalized Fe3O4 nanoparticles (NH2-Fe3O4 NPs) (B) and NH2-Fe3O4-electrochemically reduced graphene oxide (ErGO) nanocomposites (C) and the Transmission electron microscope (TEM) image of NH2-Fe3O4 NPs (D).
Nanomaterials 09 00115 g001
Figure 2. Fourier transform infrared spectroscopy (FTIR) spectra of Fe3O4 NPs and NH2-Fe3O4 NPs (A), the X-ray diffraction (XRD) pattern of NH2-Fe3O4 NPs (B) and the vibrating sample magnetometer (VSM) of NH2-Fe3O4 NPs (C).
Nanomaterials 09 00115 g002
Figure 3. Cyclic voltammograms of glassy carbon electrode (GCE) (a), graphene oxide modified glassy carbon electrode (GO/GCE) (b), NH2-Fe3O4 NPs-GO/GCE (c), ErGO/GCE (d), and NH2-Fe3O4 NPs-ErGO/GCE (e) in 1.0 mmol/L K3[Fe(CN)6] and 0.5 mol/L KCl with the scan rate of 0.1 V/s.
Nanomaterials 09 00115 g003
Figure 4. Cyclic voltammograms of 10.0 µM rutin on the different electrodes in 0.2 M H2SO4: GCE (a), GO/GCE (b), NH2-Fe3O4 NPs-GO/GCE (c), ErGO/GCE (d), and NH2-Fe3O4 NPs-ErGO/GCE (e). The scan rate of 0.1 V/s.
Nanomaterials 09 00115 g004
Figure 5. Second-order derivative linear scan voltammograms of 10.0 µM rutin on the different electrodes in 0.2 M H2SO4 after accumulation at −0.3 V for 210 s: GCE (a), GO/GCE (b), NH2-Fe3O4 NPs-GO/GCE (c), ErGO/GCE (d), and NH2-Fe3O4 NPs-ErGO/GCE (e). The scan rate of 0.1 V/s.
Nanomaterials 09 00115 g005
Figure 6. (A) Cyclic voltammograms of 10 µM rutin in 0.1 mol L−1 HCl solution on NH2-Fe3O4 NPs-ErGO/GCE at various scan rates (Form a to j: 0.03, 0.06, 0.09, 0.12, 0.15, 0.18, 0.21, 0.24, 0.27, 0.3 V s−1, respectively); (B) Plot of oxidation peak currents (a) and reduction peak currents (b) versus scan rates.
Nanomaterials 09 00115 g006
Scheme 1. Electrochemical reaction mechanism of rutin.
Nanomaterials 09 00115 sch001
Figure 7. The dependence relationship of the peak current of 10 µM rutin and H2SO4 concentration by SDLSV, error bars represent SD, n = 3. Accumulation potential: −0.3 V, accumulation time: 30 s, scan rate of 0.1 V/s.
Nanomaterials 09 00115 g007
Figure 8. (A) Effect of reduction potential and (B) reduction time on the peak current of 10 µM rutin in 0.2 M H2SO4 at NH2-Fe3O4 NPs-ErGO/GCE by second derivative linear sweep voltammetry (SDLSV). Other conditions are the same as in Figure 7.
Nanomaterials 09 00115 g008
Figure 9. (A) Accumulation potential effects and (B) accumulation time effects on the peak current of 10 µM rutin in 0.2 M H2SO4 at NH2-Fe3O4 NPs-ErGO/GCE by SDLSV.
Nanomaterials 09 00115 g009
Figure 10. Second-order derivative linear scan voltammograms of 10 µM rutin in the absence of ascorbic acid (AA) (a) and in the presence of 1.0 mM AA (b) on NH2-Fe3O4 NPs-ErGO/GCE in 0.1 M HCl after a 120 s accumulation at −0.3V. Scan rate is 0.1 V s−1.
Nanomaterials 09 00115 g010
Figure 11. Plot of the peak current versus the concentration of rutin in the range from 6.0nM–0.1 µM (A); 0.1–8.0 µM (B) and 8.0–80 µM (C). Accumulation potential: −0.3 V, accumulation time: 210 s, scan rate of 0.1 V/s.
Nanomaterials 09 00115 g011
Table 1. Electrochemical response data of rutin (10 µM) at different decorated electrodes.
Working Electrodesipa/µAipc/µAEpa/VEpc/Vipa/ipcΔEp
a GCE1.4311.0930.6740.6531.3090.021
b GO/GCE0.58430.3090.6760.6511.8900.025
c NH2-Fe3O4 NPs-GO/GCE2.3961.9290.6780.6571.2420.021
d ErGO/GCE14.3513.580.6780.6611.0570.017
e NH2-Fe3O4 NPs-ErGO/GCE21.1617.000.6630.6481.2450.015
a glassy carbon electrode; b graphene oxide modified glassy carbon electrode; c amine-functionalized Fe3O4 nanoparticles modified glassy carbon electrode; d electrochemically reduced graphene oxide modified glassy carbon electrode; e amine-functionalized Fe3O4 nanoparticles decorated electrochemically reduced graphene oxide modified glassy carbon electrode.
Table 2. Effect of different supporting electrolytes (0.1 M) on the current and potential response of 10 μM rutin at NH2-Fe3O4 NPs-ErGO/GCE. Accumulation time: 30s, other conditions are the same as in Figure 5.
ElectrolytePeak Current (μA)Peak Potential (V)
HAc-NaAc buffer (pH 4.0)4.2750.540
HAc-NH4Ac (pH 4.0)4.6450.564
(CH2)6N4-HCl (pH 5.0)3.6880.528
phosphate buffer (pH 6.0)3.9510.480
NH3-NH4Cl (pH 9.0)1.2640.432
HCl6.2000.648
HNO36.4180.660
H2SO46.8630.664
NaOH0.6450.328
Table 3. Influence of co-existing substances on the determination of 1.0 µM rutin (n = 3).
Coexisting SubstanceConcentration/mMChange of Peak Current/µARE/%Coexisting SubstanceConcentration/mMChange of Peak Current/µARE/%
glucose10.05461.28uric acid0.10.17614.13
citric acid10.06741.58Mn2+1−0.0942−2.21
glutamate10.10062.36Zn2+10.15303.59
arginine10.13513.17Ca2+1−0.1343−3.15
tryptophan0.10.18424.32Mg2+1−0.0840−1.97
tyrosine0.10.15433.62Pb2+10.11002.58
glycine10.05031.18Cu2+10.17784.17
lactose10.06781.59Al3+1−0.0972−2.28
lactic acid10.10062.36K+1−0.04951.16
starch1−0.1215−2.85Na+10.06221.46
sucrose10.11772.76PO43−10.09252.17
dopamine10.20634.84NO310.06741.58
ascorbic acid1−0.1253−2.94Cl1−0.0657−1.54
Table 4. Comparisons among various electrochemical methods for rutin detection.
Electrochemical SensorsTechniqueSupporting ElectrolyteLinear Range/µMCorrelation CoefficientDetection Limit/µMReferences
a GR–AuNPs/CSPEj SWVHAc-NaAc buffer
(pH 5.0)
0.1–150.99880.011[12]
b GR/CILEk DPVPBS buffer
(pH 2.5)
0.07–10; 10–1000.997, 0.9910.024[13]
c Cu–CS/MWCNT/GCEDPVB-R buffer
(pH 3)
0.05–1000.99940.01[14]
d BP–PEDOT:PSS/GCEDPVPBS buffer
(pH 2.5)
0.02–15.0; 15.0–80.00.998, 0.9960.007[15]
e GR-MnO2/CILEDPVPBS buffer
(pH 2.5)
0.01–500.00.9920.00273[16]
f AgNPs/PMB–GR/Au electrodeDPVPBS buffer
(pH 3.0)
0.01–0.1; 0.1–2.0; 2.0–10.00.9947, 0.9959, 0.99580.01[17]
g IL/CPESWVB-R buffer
(pH 3.29)
0.04–100.99840.01[18]
h MWCNTs–CHIT/ABPESDLSV0.1 M HCl0.02–100.99940.01[19]
i CTAB/ABPESDLSV0.1 M HCl0.006–0.2; 0.2–100.9985, 0.99920.004[20]
NH2-Fe3O4 NPs-ErGO/GCESDLSV0.2 M H2SO40.006–0.1;
0.1–8.0; 8.0–80
0.004This work
a graphene-gold nanoparticle carbon screen printed electrode; b graphene modified carbon ionic liquid electrode; c chemically cross-linked copper-complexed chitosan/multi-walled carbon nanotubes modified glassy carbon electrode; d black phosphorene- poly(3,4–ethylenedioxythiophene)–poly(styrenesulfonate) modified glassy carbon electrode; e graphene-MnO2 nanocomposite modified carbon ionic liquid electrode; f Ag nanoparticles/poly(methylene blue) functionalized graphene composite film modified Au electrode; g ionic liquid modified carbon paste electrode; h multi-walled carbon nanotubes–chitosan composite film modified acetylene black paste electrode; i cetyltrimethyl ammonium bromide film modified acetylene black paste electrode; j square-wave voltammetry; k differential pulse voltammetry.
Table 5. Rutin detection results from compound rutin tablets and urine samples (n = 4).
SampleLabelled/µMd Detected by UV Method/µMd Detected by this method/µMAdded/µMd Total Found by this Method/µMRecovery/%
a Tablet 132.7632.95 ± 0.9431.48 ± 0.8630.0061.13 ± 2.1498.8
b Tablet 23.283.08 ± 0.113.37 ± 0.153.006.48 ± 0.20103.7
Urine 1 c-e NDND5.005.07 ± 0.18101.4
Urine 2 c-NDND1.001.03 ± 0.03103.0
a Dilution factor: 1/100; b Dilution factor: 1/1000; c Dilution factor: 1/10; d Average ± confidence interval, the confidence level is 95%; e Not detected.

