1. Introduction
Multimodal high-density polyethylene (HDPE) is an engineered thermoplastic semi-crystalline polymer, which is widely used in films, pressure pipes, bottles, tubes and cables jacketing [
1,
2,
3,
4,
5]. It is a hybrid of at least two distinct polyethylene components, wherein each constituent has different density and different molecular weight fractions [
3,
4]. This allows flexibility in engineering its microstructure to meet the desired balance of properties for concrete practical applications. Nevertheless, multimodal HDPE can be further improved, for example, with the addition of fillers or reinforcements, in order to overcome deficiencies in their mechanical or thermal properties [
6,
7,
8,
9,
10,
11,
12,
13,
14,
15,
16,
17,
18]. However, the crystallisation kinetics of the final product can be influenced, for example, not only by the nature of the added fillers but also by changing the molar mass (M), the breadth of molecular weight distribution (MWD), and/or the mode of MWD [
1,
2,
5,
6,
11,
13,
15,
19,
20,
21,
22,
23,
24]. The spherulitic growth rate is found to increase as molar mass reduces, while polymers with broader and/or bimodal MWD lead to an increased peak crystallisation temperature and overall crystallisation rate [
1,
2,
5,
6,
11,
15,
19,
20,
21,
22,
23].
Graphene has recently emerged as a very promising breakthrough material in the field of polymer nanocomposites and has attracted considerable scientific interest [
7]. A large number of studies have reported numerous property enhancements attained from the use of graphene in polymer nanocomposites, such as superior mechanical, thermal, gas barrier, electrical and flame retardant properties [
7,
8]. Carbon black is also widely used as a speciality additive in multimodal high-density polyethylene (HDPE) for enhancing properties such as wear resistance and jetness [
9,
10,
12]. It is very well-known and widely used with multimodal-HDPE for pressure pipes and power cable jacketing applications [
12]. The incorporation of such fillers or reinforcements may significantly affect the crystallisation behaviour of the multimodal-HDPE, as the matrix is a semi-crystalline polymer with both crystalline and amorphous regions [
11]. A number of studies have reported on the effect of nanofillers, such as carbon nanotubes, diamond, graphite, talc, CaCO
3, SiO
2, TiO
2, BaSO
4, on the crystallisation kinetics of HDPE [
11,
13,
24,
25,
26,
27,
28,
29,
30,
31,
32,
33]. As an example, J-W. Huang et al. reported a decrease in the spherulite size and degree of crystallinity and an increase in peak crystallisation temperature and overall crystallisation rate with the addition of inorganic fillers [
26]. J. Kim et al. observed that the introduction of the multiwalled carbon nanotubes to the HDPE hindered the chain ordering, thus increasing the time required to reach 50% of relative crystallinity, despite the increase in the onset and peak crystallisation temperatures [
13]. The mechanism of the primary and secondary crystallisation processes has a profound impact on the arrangement, size and morphology of the crystallites, as well as the degree of crystallinity, thus affecting the mechanical and physical properties of the semi-crystalline polymers [
1,
5,
11,
26,
34,
35,
36]. Therefore, a change in the crystallisation kinetics can alter properties such as modulus, barrier properties, post extrusion shrinkage, post-mould shrinkage and/or warpage, transparency or clarity, sagging, processing cycle times and heat resistance in HDPE [
11]. Also, a knowledge of the conditions affecting the crystallisation kinetics is crucial for optimising the processing parameters. For example, inappropriate selection of the processing variables leads to many defects in injection-moulded artefacts such as warpage, dimensional instability, shrinkage and so forth. [
30]. Moreover, a non-uniform wall thickness, shape distortion, ovality, and waviness are a result of cross-sectional and axial thermal-gradient variations in pipe extrusion [
37].
Polymer crystallisation is a process that essentially involves two consecutive steps, namely the nucleation and growth of the crystal nucleus [
6,
19,
34,
35,
36]. A fundamental kinetic model of the polymer crystallisation process, during both isothermal and non-isothermal conditions, provides the necessary framework for a better understanding of the influence of the nanofillers on the crystallisation behaviour and crystal morphology of the multimodal-HDPE. In general, crystallisation is often considered to take place under idealised isothermal conditions, which greatly simplifies the mathematical and thermodynamic analysis. However, it fails to account for the effect that the varying cooling rates and crystallisation temperatures have on the final properties of the polymer in real-world applications [
2,
11,
13,
24,
26,
28,
29,
34,
35,
36]. Therefore, it is of great practical significance to simulate industrial processes in order to study the crystallisation kinetics, as industrial processes often occur under non-isothermal conditions. In our previous study, we reported a novel method for the preparation of a high-performance polymer-graphene nanocomposite using a co-rotating intermeshing twin-screw extruder [
8]. The project was conducted on one metric ton of a commercial polymer and more than one kilogram of graphene, on a semi-industrial scale extrusion system that can be scaled up to full industrial scale production. Accordingly, this article aims to study the effect of exfoliated microwave-induced plasma graphene on the crystallisation kinetics of the high molecular weight multimodal-HDPE, the polymer which undergoes crystallisation from the melt state during industrial processing and structural development, under non-isothermal conditions. A commercial carbon black/multimodal HDPE nanocomposite product is considered as a bench mark in this study, for the sake of comparison with new multimodal-HDPE, based on graphene. The incorporation of 0.1–5 wt.% carbon black or graphene nanofillers led the crystallisation kinetics of the multimodal-HDPE to behave differently in non-isothermal conditions. It is therefore important to understand the difference between the effect of these two nanomaterials on the crystallisation behaviour of the multimodal HDPE, as replacing the nanofiller, for example carbon black by graphene, requires a consequent optimisation of the processing parameters. The crystallisation kinetics were further explored, in an attempt to better understand the different roles, which the latter nanofillers play in the crystallisation processes of multimodal-HDPE. In this regard, a model proposed by T. Liu et al. on the basis of H. E. Kissinger, Avrami, and Ozawa equations were incorporated for better understanding of the crystallisation behaviours [
11,
13,
24,
25,
29,
38,
39]. The H. E. Kissinger equation allows for the interpretation of the heterogeneous nucleation mechanism by estimating the activation energy barrier for nucleation, while T. Liu et al. model is utilised to fit the experimental results to allow better descriptions of non-isothermal kinetics by providing a relationship between the cooling rates and crystallisation temperature [
38,
39]. This study is of fundamental importance to the optimisation of processing variables, aiming to provide
supplementary information about the non-isothermal crystallisation kinetics of carbon black and graphene-based multimodal-HDPE prepared by melt intercalation method. The results of this research provide greater insight into different processing factors, affecting the multimodal HDPE-graphene nanocomposite crystallisation performance and criterion for effectively producing the next generation of black multimodal-polyethylene compounds for use in high-pressure pipes, automotive and energy cable applications. This would, therefore, contribute to a better understanding of the relationship among processing-structure-property of the multimodal-HDPE and its nanocomposites. To the best of our knowledge, little research, if any, has studied and compared the crystallisation kinetics of multimodal-HDPE induced by a bottom-up graphene with a commercial multimodal-HDPE induced by a carbon black with an average primary particle size of 20 nm.
3. Results and Discussion
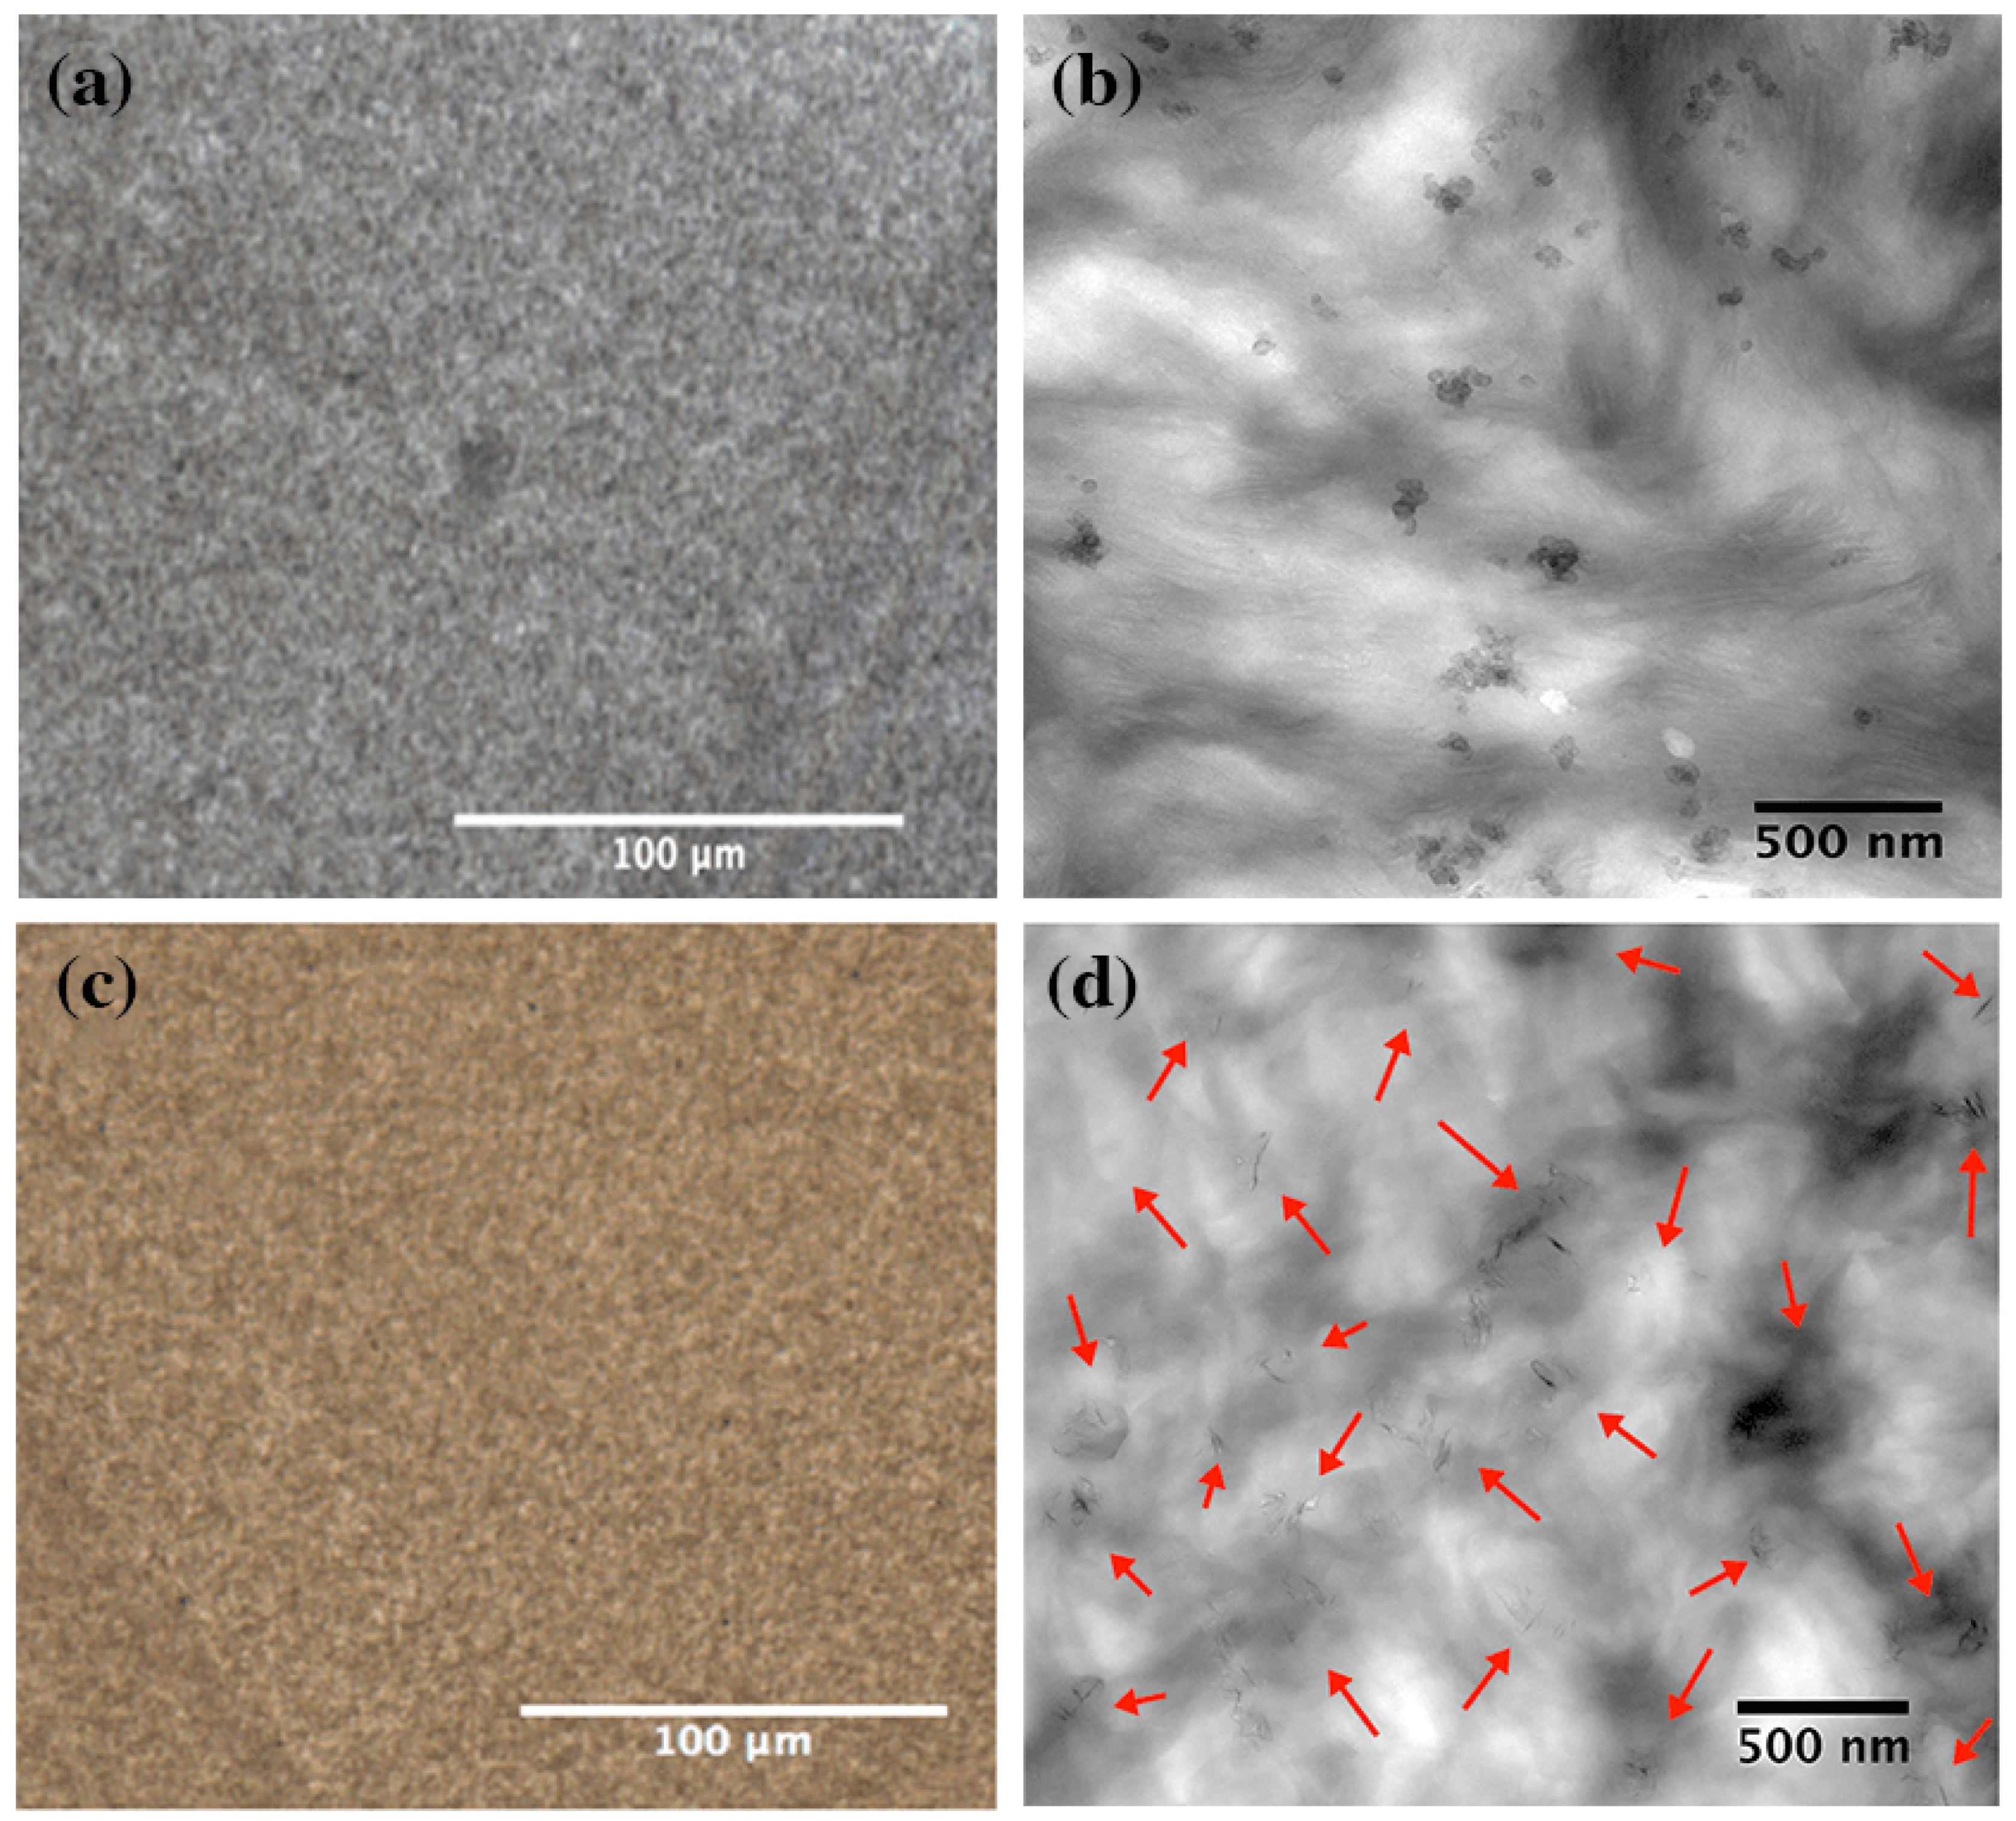
The dispersion and distribution of graphene and carbon black were assessed by TEM and light microscopy, as shown in
Figure 1. More information about the details of our experimental protocol can be found in the literature [
8]. Graphene monolayers are transparent under an optical microscope, opacity of 2.3 ± 0.1%, and the optical loss become greater in the wrinkled and overlapped samples [
42,
43]. L. J. Cote et al. found that the average light scattering from the wrinkled region is about 3.7 times that of the overlapped areas [
43]. On the other hand, carbon black is composed of primary particles that are permanently fused together, through the covalent bonds, into an aggregate structure (see
Figure S2) [
44]. Each primary particle is made up of imperfect crystallites of turbostratic graphite structure, which are twisted into each other throughout the aggregates [
44,
45]. They are welded in the aggregate and are neither discrete nor do they have physical boundaries between them. Due to the production and storage conditions, the aggregates join together into agglomerates by van der Waal’s interactions [
45]. The mean particle size of the carbon black agglomerates and the %area fraction (200 × 200 µm
2) were around 0.9 µm
2 and 0.4 respectively, as shown in
Figure 1 and
supplementary Figure S1. However, the mean particle size of the detected graphene agglomerates was 0.95 µm
2 and the %area fraction was less than 0.006. The %area fraction and mean particle size were calculated based on TEM and light microscopy analysis and graphene particles of less than 0.05 µm
2 or 500 nm were excluded from the calculations. A decrease in the %area fraction means a better distribution and fewer agglomerates. The figure was higher with carbon black as the fused aggregate sizes are commonly bigger than graphene monolayers. As shown from the TEM images in
Figure 1, graphene platelets were thoroughly dispersed and distributed within the polymer matrix. However, carbon black images showed good distribution with different agglomerate sizes, though containing small sizes, which is normal in carbon black-based polymer nanocomposites [
12,
44,
45]. Note that PE-CBs were used as a benchmark in this study in the interest of comparison.
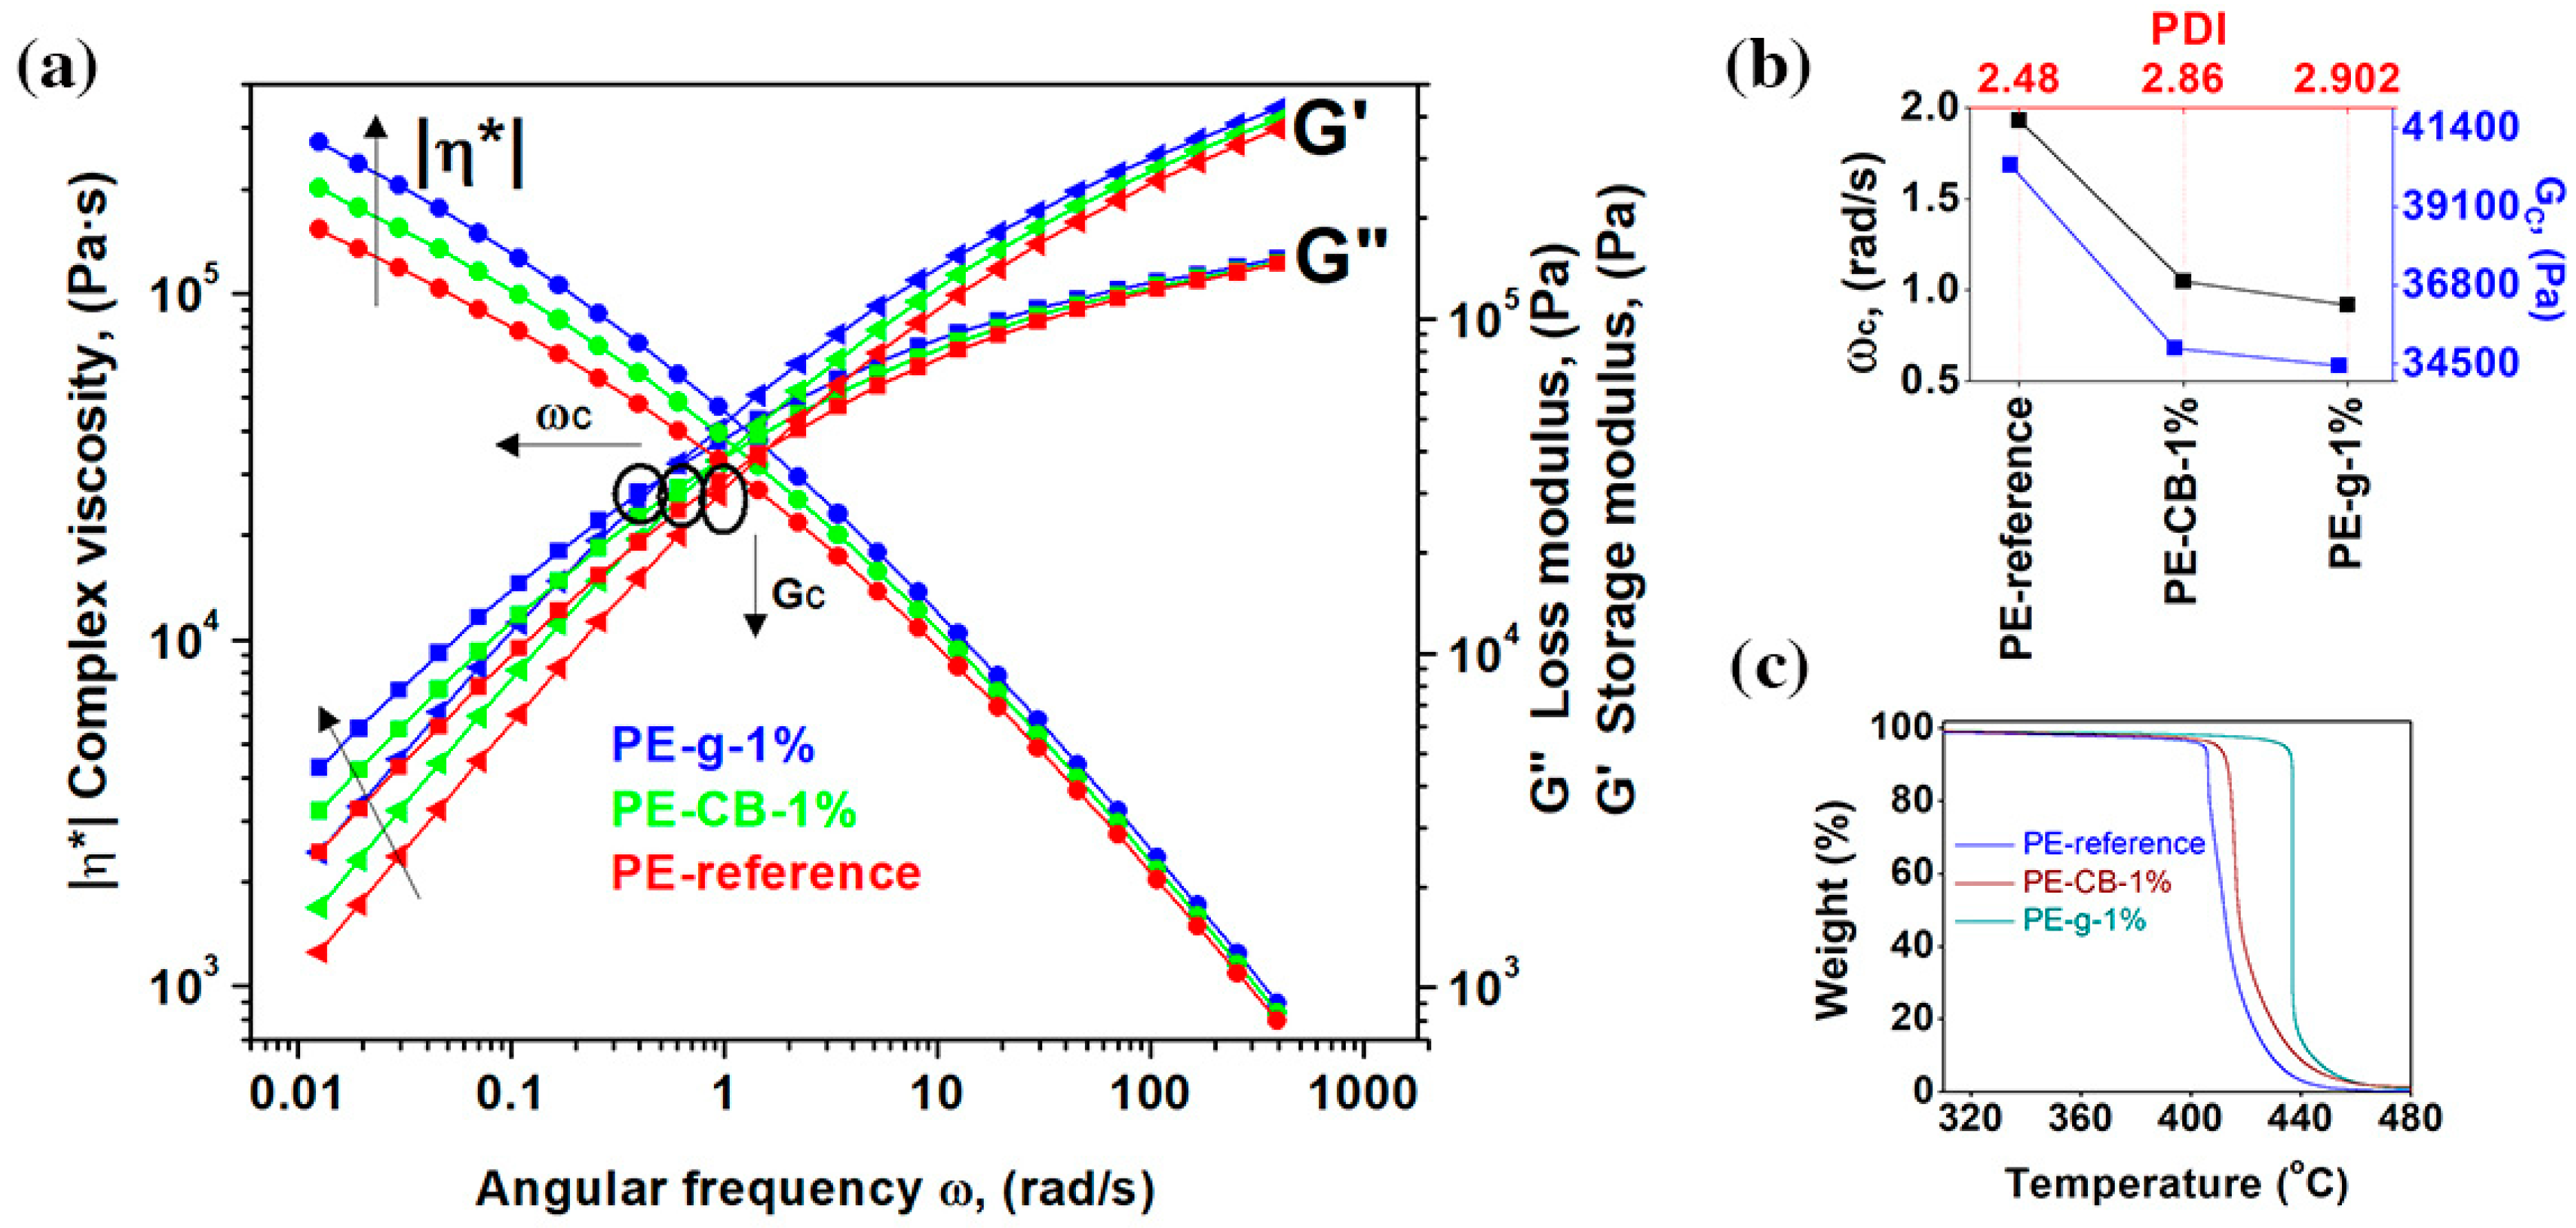
The dispersion and distribution of the nanofillers within the polymer matrix were further investigated by the rheological measurements [
40,
46,
47,
48]. The influence of the nanofillers on the viscoelastic response of the polymer is revealed from the change in the absolute values of the storage (
G′) and loss (
G′′) moduli, as well as their frequency dependence [
40,
46,
47,
48]. The pseudoplastic, non-Newtonian behaviour of the viscoelastic polymer is presented in
Figure 2a. At a high shear rate, all the polymers exhibited shear thinning behaviour, which resulted in a decrease of extensional viscosity. The melt viscosity of the neat multimodal-HDPE increased with the addition of the both nanofillers, though the relative increase gradually lessened at a high shear rate.
The presence of the nanofillers considerably increased the pseudoplasticity at a low shear rate. At the angular frequency of 0.0154 rad/s, the complex viscosity of the neat multimodal-HDPE increased from 0.19 MPa·s, to 0.34 MPa·s and 0.25 MPa·s at 1 wt.% loading of graphene and carbon black, respectively. Similarly, the loss and storage moduli of the neat polymer increased by a value of ~36% and ~32% with 1 wt.% loading of carbon black and by a value of ~99% and ~78% at 1 wt.% loading of graphene, respectively. The greater amount of storage and loss moduli of the reinforced polymer is attributed to the formation of a strong interfacial bonding between the polymer matrix and the high-modulus nanofillers, which has accordingly reduced the loss tangent, therefore the polymer became more elastic [
8,
13,
28,
29,
30]. The thorough dispersion and distribution of the nanofillers, as well as the strong interfacial bonding, led to a decrease in the degree of the chain mobility of the polymers, thus suppressing the shear flow of the polyethylene macromolecular chains [
6].
As shown in
Figure 2b, the crossover modulus point (
GC) and crossover angular frequency point (
ωC) of the reinforced polymers have shifted to a lower range. The addition of 1 wt.% of graphene decreased the
GC and
ωC of multimodal-HDPE by a value of 15% and 53%, respectively, while it decreased by a value of 13% and 46% with the 1 wt.% loading of the carbon black. These differences can be attributed to the specific surface area which each nanofiller can offer the polymer matrix through its specific dimensions [
6,
25]. The shift of the
ωC to the lower region indicates that the reinforced polymers exhibited higher average molar mass and/or branched (entanglement) molecules [
8,
40]. The later shift observed in PE-g can be attributed to formation of the jammed network structure, arising from the thorough dispersion and distribution of graphene platelets within the polymer matrix, which probably constrained the movement of the polymer chains [
8,
14,
48,
49]. Nevertheless, the shift of the
GC to the lower region upon the addition of nanofillers possibly arose also from exposing the neat polymer to a high temperature, under a combination of high shear and elongation forces, for a prolonged period of time. The weight average molar mass (Mw) and z-average molar mass (Mz) of the neat multimodal-HDPE powder decreased from 280 kg/mol and 2099 kg/mol, to 207 kg/mol and 1131 kg/mol, respectively, after being extruded in the conditions described in the experimental section (see the
supplementary Table S2). Thus, the nanofiller-polymer likely induced an antioxidant synergistic effect, protecting the polymer from degradation [
9,
10,
12,
16] This is evident from the increase in the polydispersity index (PDI) of the reinforced polymers, compared with the neat multimodal-HDPE, for example, the larger is the PDI, the broader the molecular weight distribution. The advantages of synergistic effect of nanofillers are further confirmed via thermogravimetric analyses, represented in
Figure 2c.
As shown from the TGA thermograms in
Figure 2c and
Table 1, the onset degradation temperature of the polymer reinforced with 1 wt.% loading of graphene increased significantly, by more than 32 °C, while a temperature increase of only 6 °C was achieved with 1 wt.% loading of carbon black. The onset degradation temperature at 5% mass loss (T5%) of the neat polymer, increased from 405 °C to 410 °C with 1 wt.% loading of carbon black but to ~435 °C with 1 wt.% loading of graphene. This indicates that the nanofillers acted as a thermal barrier and improved the thermal stability of the polymers. The large aspect ratio of graphene, with platelet structure, likely offered a larger interfacial surface with the polymer matrix, which in turn slowed the diffusion of the decomposition products from a jammed network structure created in the nanocomposite [
8,
18,
19,
50,
51]. Therefore, the homogenous dispersion and distribution of the graphene platelets, as well as strong interfacial bonding, are likely capable of forming a continuous network-structured protective layer, which notably reduces the heat release rate during the pyrolysis process [
8,
17,
18,
50,
52]. However, the dimensional structure of the carbon black may have rendered it unable to form a continuous interconnected network structure in the polymer matrix.
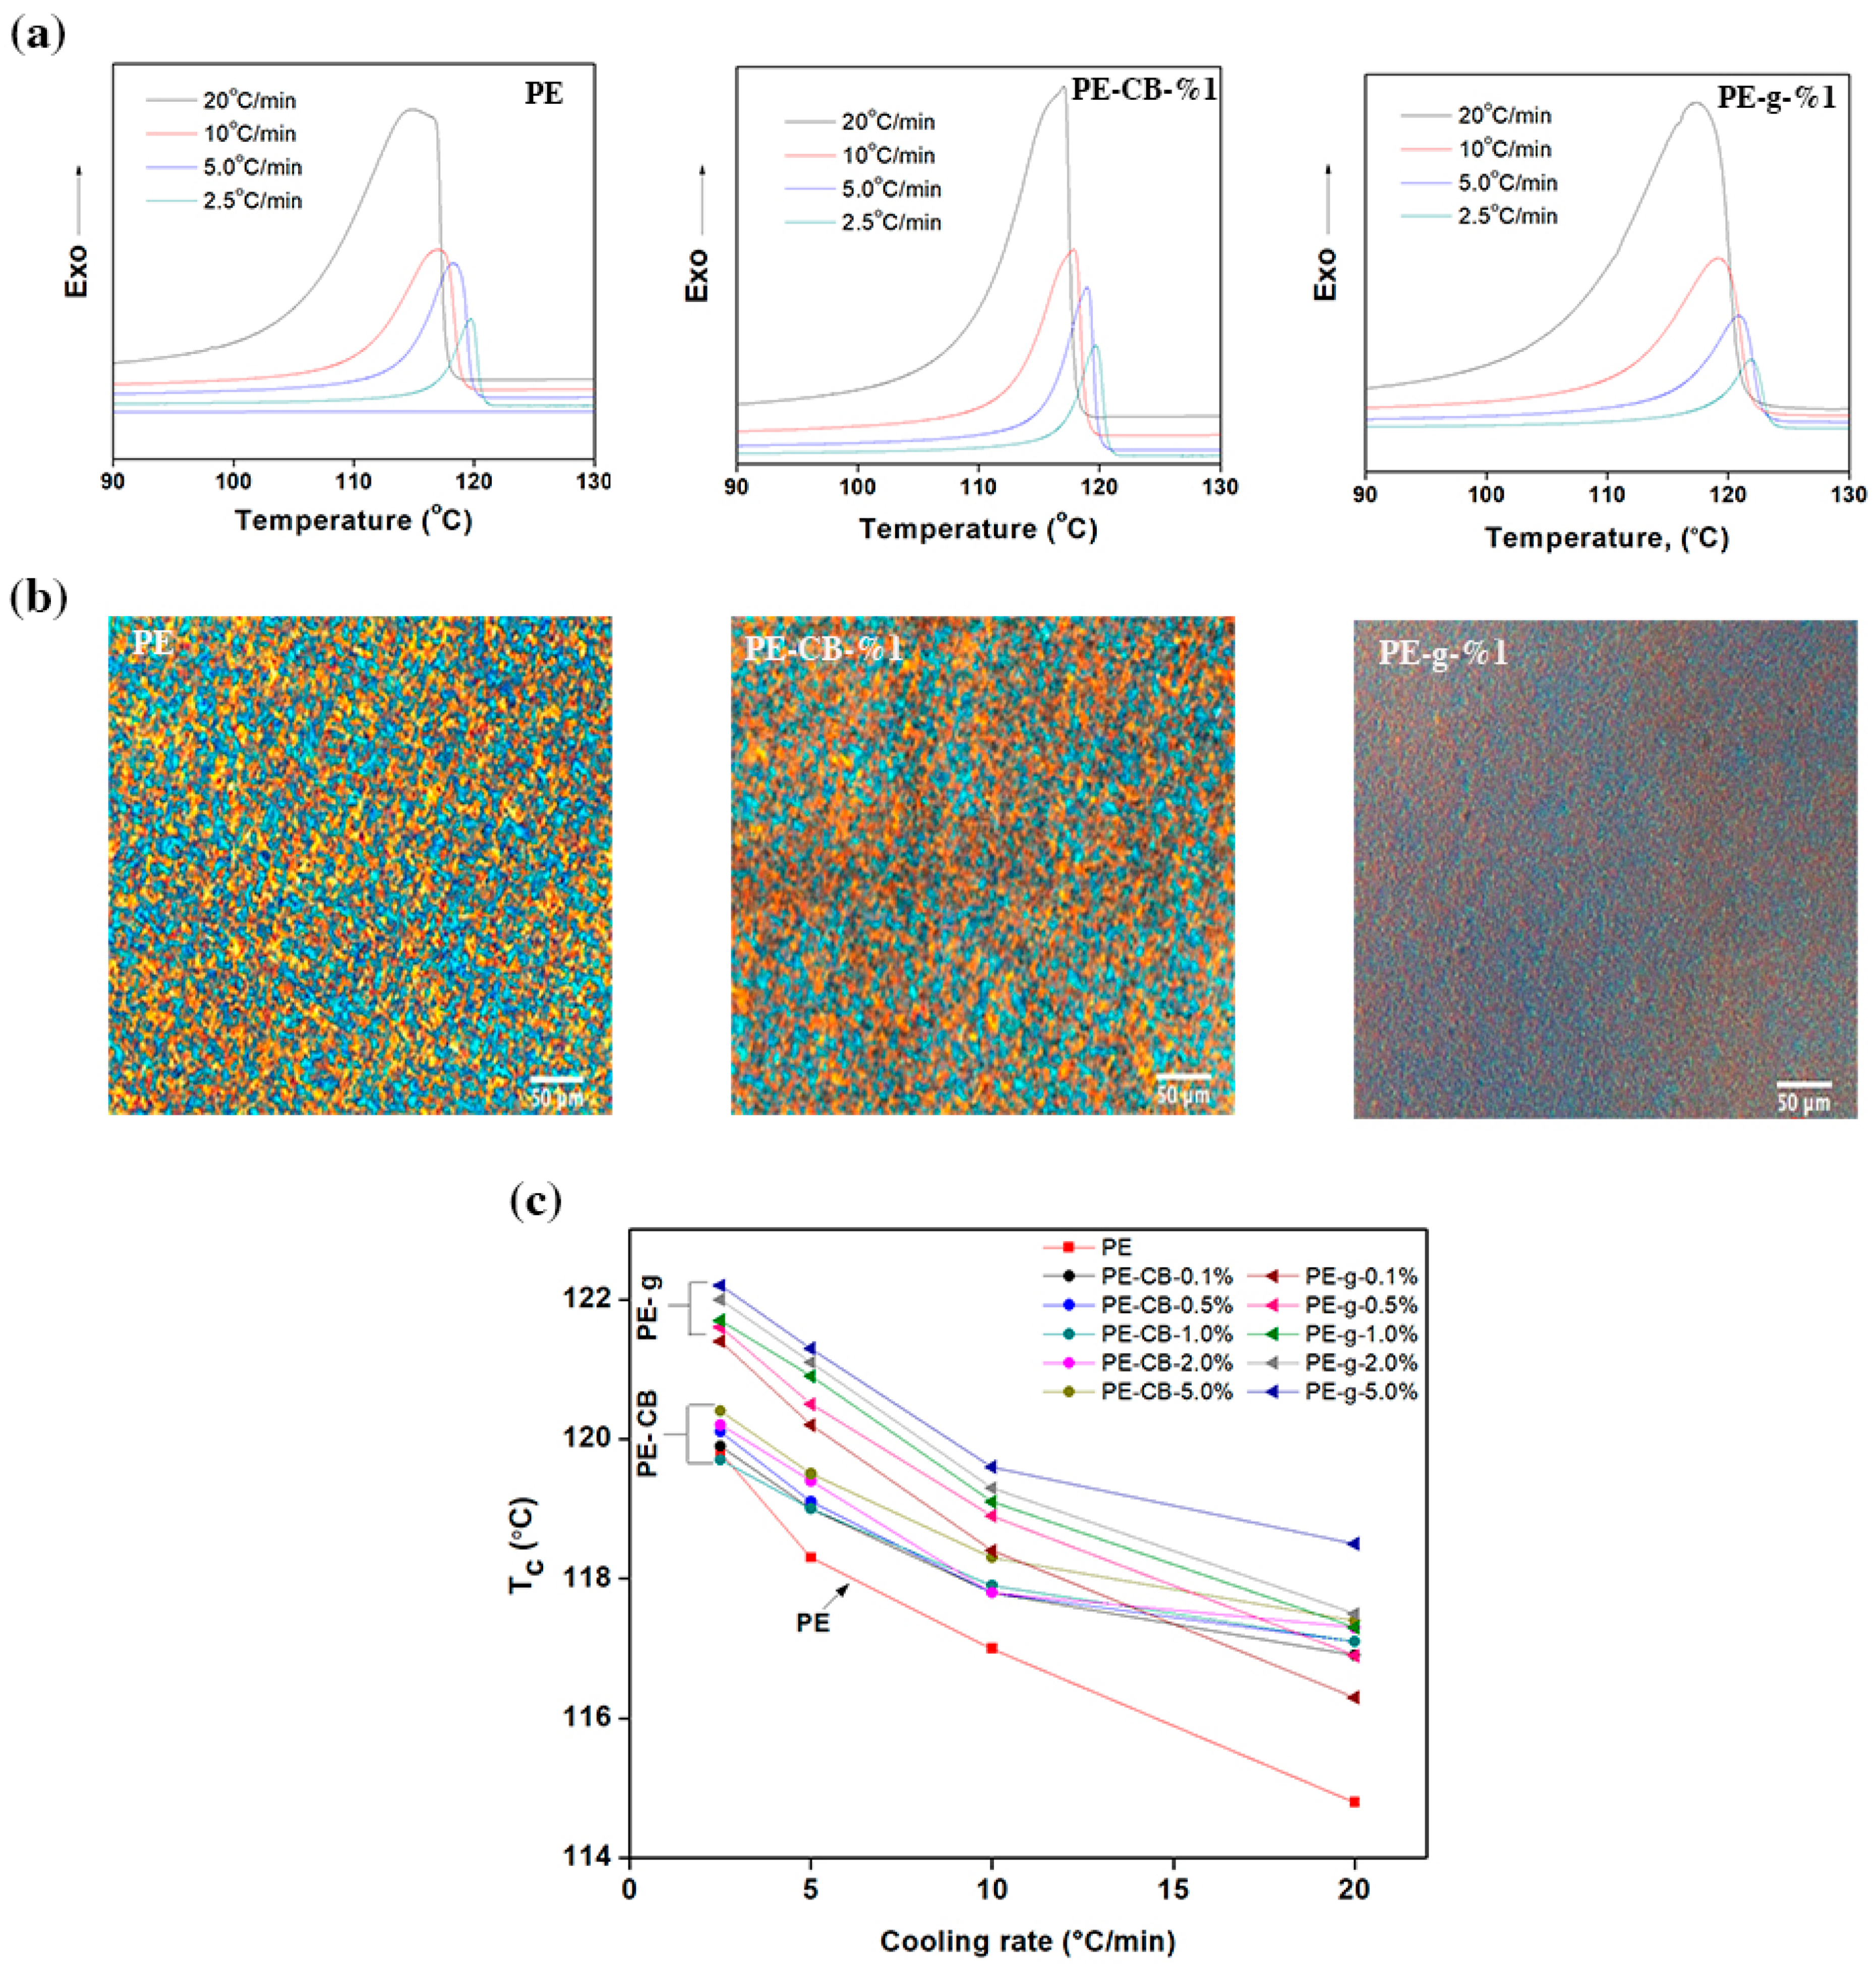
Figure 3a and the
supplementary Figure S3, show the differential scanning calorimetry (DSC) scans recorded at different cooling rates for the neat multimodal-HDPE and its nanocomposites. The exothermic crystallisation events were quenched from the molten state at constant rates of 2.5, 5, 10, 20 °C/min and the magnitude of parameters is summarised in
Table 2 and the
supplementary Table S1. As evident from the DSC thermograms, with an increasing cooling rate, the peak crystallisation temperature (
Tc) exhibited broader shape and shifted gradually to a lower temperature. The value of
Tc increased from 114.8 °C to 119.8 °C for pristine multimodal-HDPE, when decreasing the cooling rate from 20 to 2.5 °C/min. In general, nucleation at a lower degree of undercooling tends to be sporadic and only a relatively small number of nuclei are obtained during the melt crystallisation [
36]. At higher cooling rates, the time interval becomes sufficiently shorter in order that the random tangled molecules in the melt to align, form nuclei throughout the melt and then grow by the addition of further molecular chains [
2,
6,
11,
36,
51].
A rapid decrease in temperature is accompanied by an increase in the viscosity, thereby the transport of material to the growth point becomes more difficult and eventually reduces the growth rate [
6]. Hence, a higher degree of supercooling was required to initiate the crystallisation process, in such a way that the exothermic peaks became broader. In addition, the associated enthalpy of crystallisation (Δ
Hc) decreased where the cooling rate was elevated, as indicated in
Table 2 and
supplementary Table S1. The recorded enthalpy change by DSC is normally quoted as the amount of energy associated with the exotherm or endotherm per unit mass of the material analysed [
6,
36]. Likewise, thermal conductivity and annealing effects vary upon cooling rates [
53,
54,
55,
56,
57]. The gradual decrease of the enthalpy upon the addition of nanofiller can be attributed to the proportional diminution (dilution effect) of the polyethylene concentration in the nanocomposite, as a result of the linear relationship between the latent heat and mass percentage [
53,
54,
55,
56,
57]. Furthermore, the reduction of the polymer macromolecules’ freedom in the vicinity of the nanofillers, could result in less entropy and thereby decreases the enthalpy change. This can be due to either interfacial interaction or chain confinement induced by the continuous network-structure formed between the closely packed nanoparticles.
At a relatively high temperature, just below the melting temperature, the sufficient thermal energy available allows the necessary motion to take place and release the residual stresses. Therefore, the lamella crystals become thicker when held at high temperature for a longer time (annealing effects) [
6,
36,
53,
54,
55,
56,
57]. Accordingly, the gradual decrease in Δ
Hc at higher cooling rates, can also be attributed to thermal conductivity limitations, as well as lowered annealing effects. At a given cooling rate,
Tc of multimodal-HDPE filled with graphene shifted to higher temperatures, as shown in
Table 2 and
supplementary Table S1. As shown in
Figure 3b, the relative shift of
Tc was clearly evident at the lowest graphene content. Afterward, the shift continued to gradually ascend as the concentration of graphene was increased, accompanied by a broadening of the peak (see
Figure 3a and the
supplementary Figure S3). For example, the value of
Tc increased from 114.8 °C to 116.3 °C and 117.3 °C for pristine HDPE filled with 0.1 and 1.0 wt.% of graphene respectively, at the cooling rate of 20 °C/min. These changes in crystallisation behaviour can be attributed to the nucleation that took place heterogeneously on the distributed nanofillers bodies throughout the polymer matrix [
6,
11,
36]. The foreign surfaces introduced by nanofillers reduced the barrier activation energy required to create a new surface and so lowered the degree of undercooling. This latter subject will be discussed further later in this study. On the other hand, the relative shift of
Tc increased marginally at the lowest content of carbon black, except for the cooling rate of 2.5 °C/min, where no change was observed. Nonetheless, at higher concentrations the value of
Tc remained somewhat unchanged.
A polarised light microscope was used to examine the spherulitic morphology of the polymers, as shown in
Figure 3b. The spherulites in the polymer filled with 1 wt.% of graphene became smaller, denser and homogenously distributed throughout the polymer matrix. On the other hand, the size of spherulites after incorporating 1 wt.% of carbon black became relatively larger and distributed within the polymer matrix almost uniformly. This implies that the nanofillers were homogenously dispersed and distributed throughout the polymer matrix. The spherulite radius
r is related to the time (
t) and spherulite growth rate (
v) through an equation in the form of
r =
vt, which is valid until the spherulites touch each other [
6,
36,
58,
59]. The decrease in spherulite sizes indicates that graphene fillers lowered the growth rate of the polymer, while the situation is apparently reversed where the carbon black is presence. A uniform distribution of the spherulite sizes can generally lead, for example, to a reduction in the post extrusion shrinkage, post-mould shrinkage and/or warpage, as well as a greater transparency by reducing the size of the scattering centres [
11].
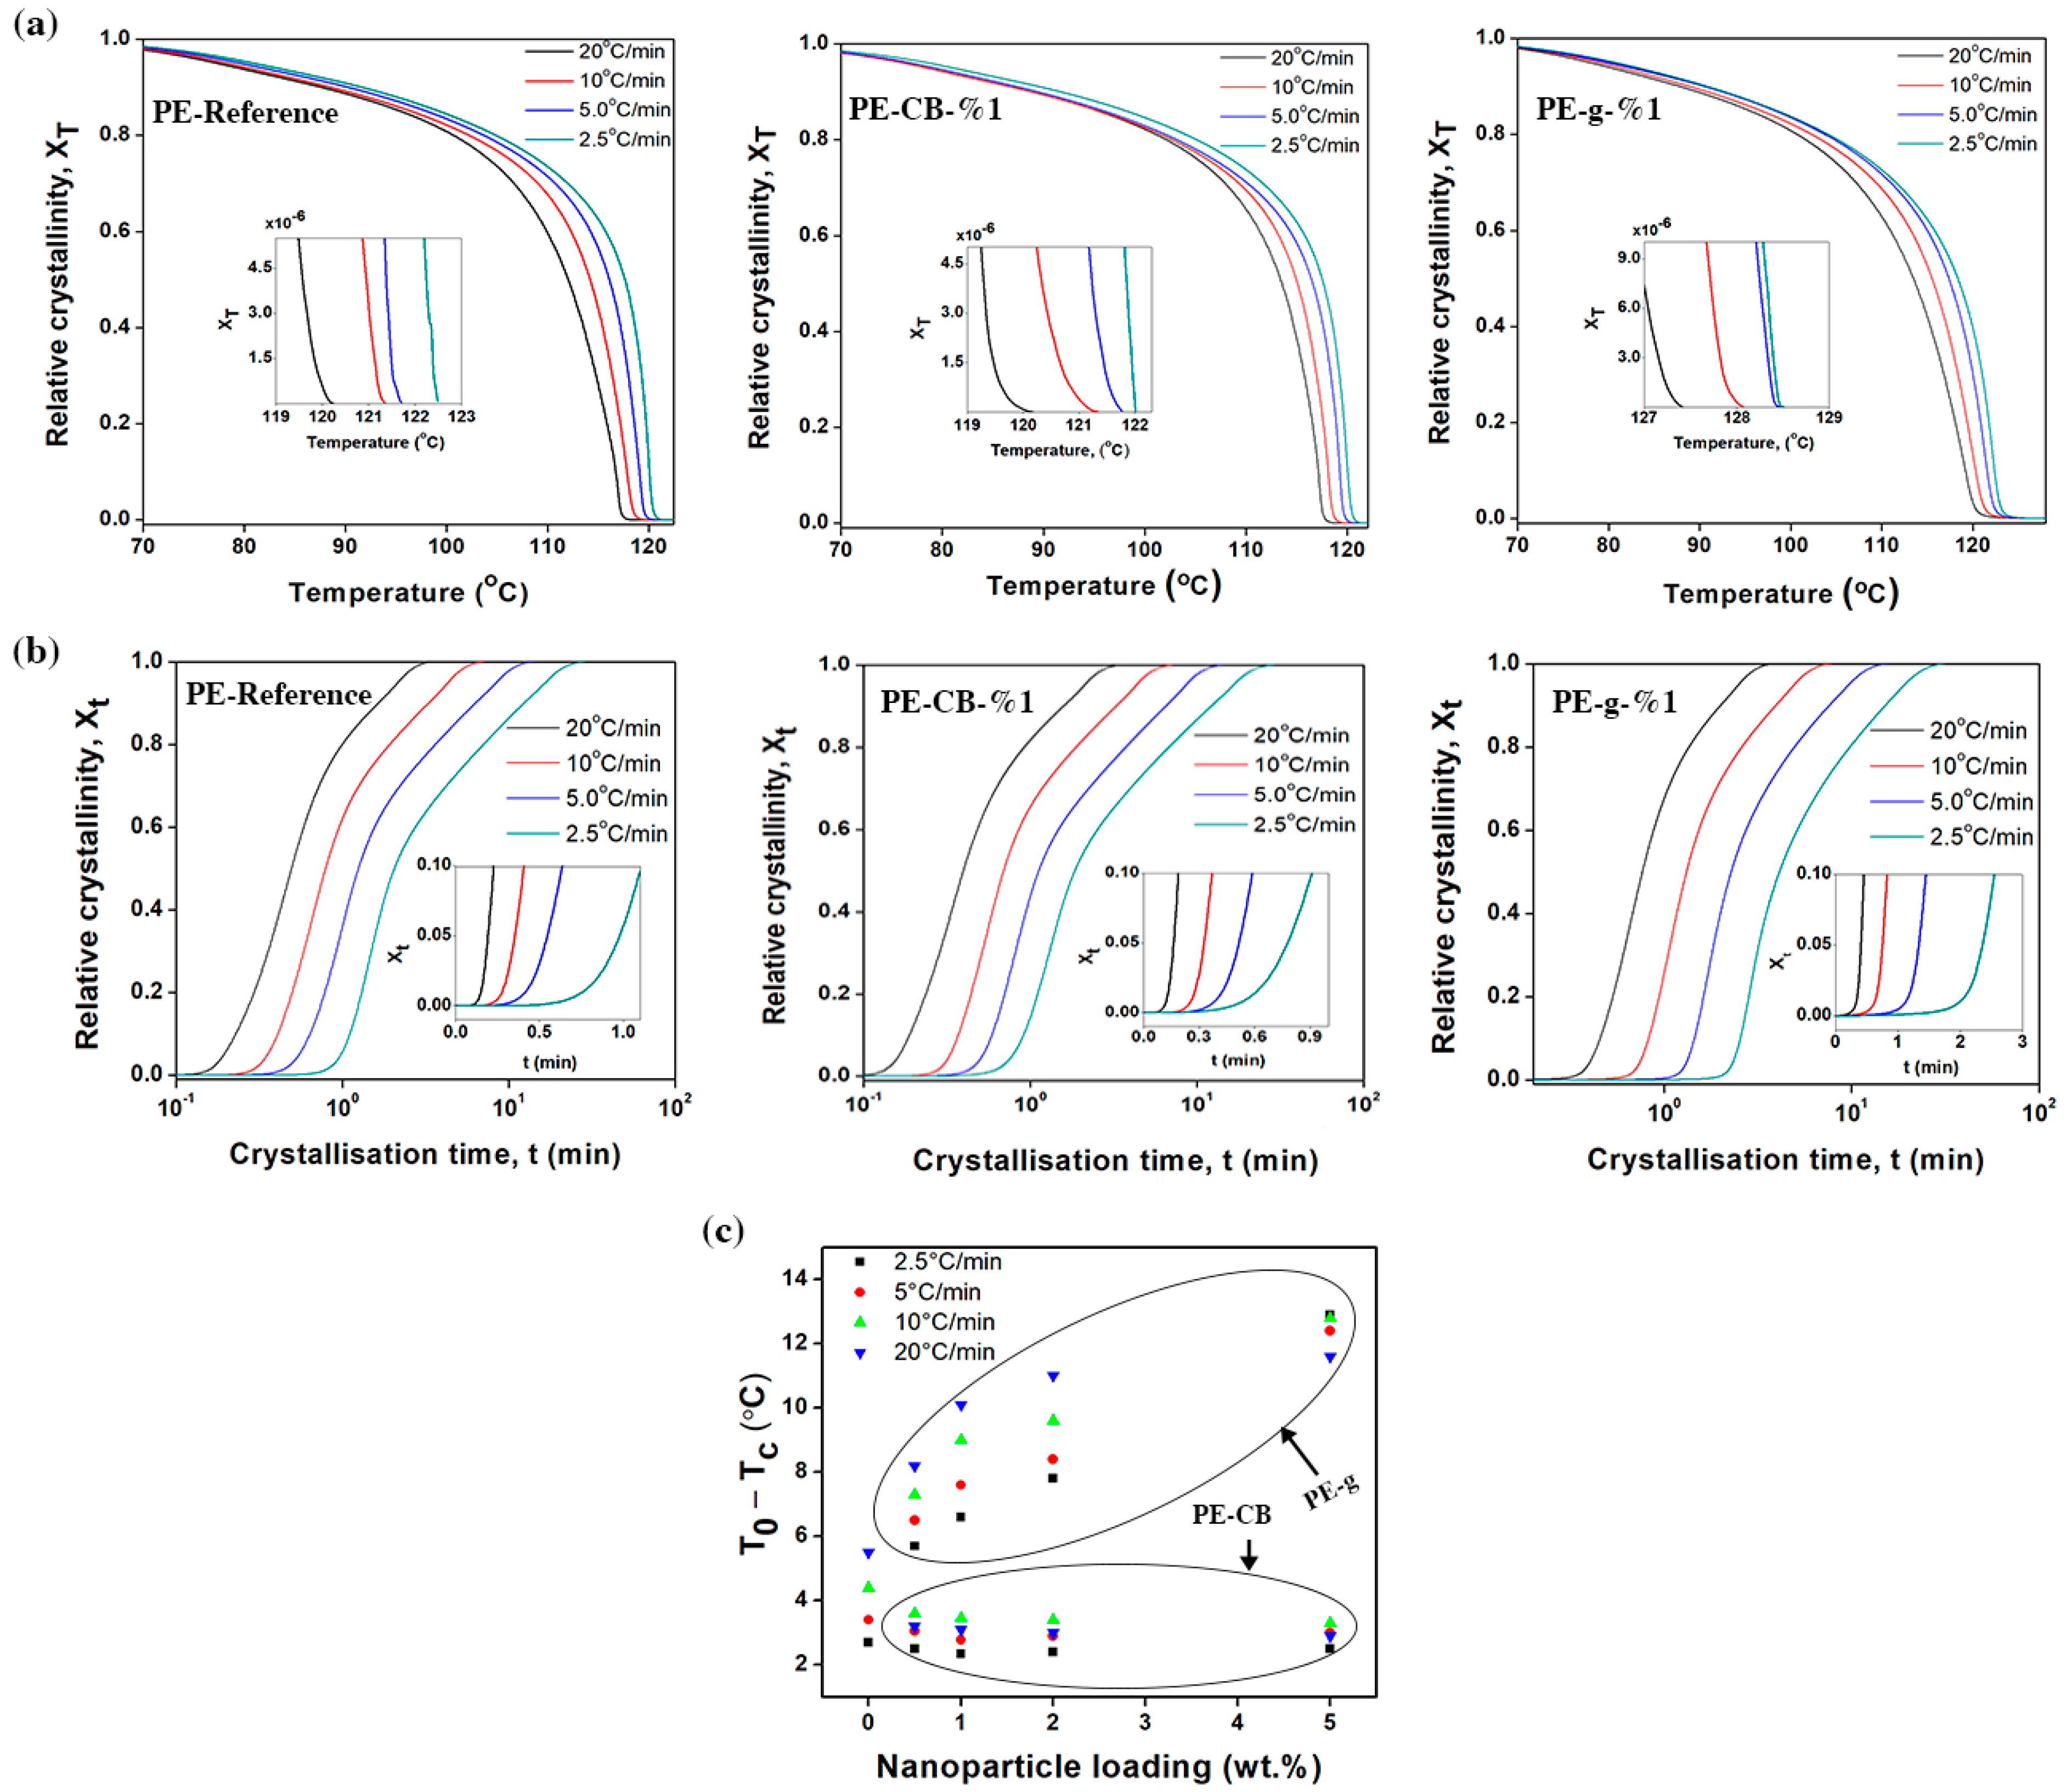
The relative degree of crystallinity (X
T) as a function of crystallisation temperature can be calculated using the following equation
where
dH/
dT is the enthalpy of crystallisation evolved within an infinitesimal temperature range,
T0 is the onset crystallisation temperature,
T denotes the arbitrary crystallisation temperature and
Tf refers to the end temperature of crystallisation [
24,
34,
35,
36,
54]. The calculated relative crystallinity values of the cooling exotherms at different cooling rates are shown in
Figure 4a and the
supplementary Figure S4. Evidently, the crystallisation process exhibited reversed sigmoidal kinetic curves in all samples, which is common in most semicrystalline polymers as reported elsewhere [
11,
36]. The sigmoidal function features an induction period followed by an accelerated growth and final prominent saturation (plateau region). The lag phase and rapid growth shown in
Figure 4a and the
supplementary Figure S4, are often referred to as nucleation and crystal growth processes respectively [
11,
28], whereas the following slow crystallisation phase is attributed to the presence of secondary crystallisation [
60]. Crystallisation occurred at a lower temperature when the cooling rate was increased. At a given cooling rate,
T0 of the multimodal-HDPE filled with graphene shifted significantly to higher temperatures, as shown in
Table 2 and
supplementary Table S1. The relative shift of
T0 was clearly evident even at the lowest graphene content (0.1 wt.%) and continued to increase gradually as the concentration of graphene grew. For example, the value of
T0, increased from 120.3 °C to 123.6 °C for PE-CB-1% and to 127.4 °C for PE-g-0.1%, at the cooling rate of 20 °C/min. However, the relative value of T
0 remained almost the same for the PE-CB, regardless of the concentration of carbon black.
The difference between the onset and the peak crystallisation temperatures (
T0 −
Tc) is widely used as an indicator of spherulitic growth rate; the larger the difference, the lower the rate of growth in the spherulites [
60,
61,
62]. The values of (
T0 −
Tc) are listed in
Table 2 and in the
supplementary Table S1. As shown in
Figure 4c, addition of graphene caused the value of (
T0 −
Tc) to increase. With a 1wt.% loading, it was increased by 144%, 121%, 105% and 84% at the cooling rate of 2.5, 5, 10, and 20 °C/min, respectively. The value of (
T0 −
Tc) gradually became larger with increasing graphene content. On the other hand, the relative value of (
T0 −
Tc) decreased at the lowest content of carbon black, especially at the cooling rate ≥ 10 °C/min and thereafter remained invariable at higher concentrations. These results are in concurrence with the PLM images, that is, the bigger the spherulite radius, the greater the rate of spherulitic growth (
r =
vt). In non-isothermal crystallisation, the arbitrary crystallisation temperature
T is associated with the crystallisation time t through the following equation of the form
where
is the cooling rate [
11]. The relative degree of crystallinity can accordingly be transformed as a function of time (
) by converting the temperature on the x-axis to time scale, as shown in
Figure 4b and
supplementary Figure S5.
The magnitude of parameters obtained from
Figure 4b and
Figure S5 are listed in
Table 2 and in the
supplementary Table S1. At a given cooling rate, the time taken to complete the crystallisation
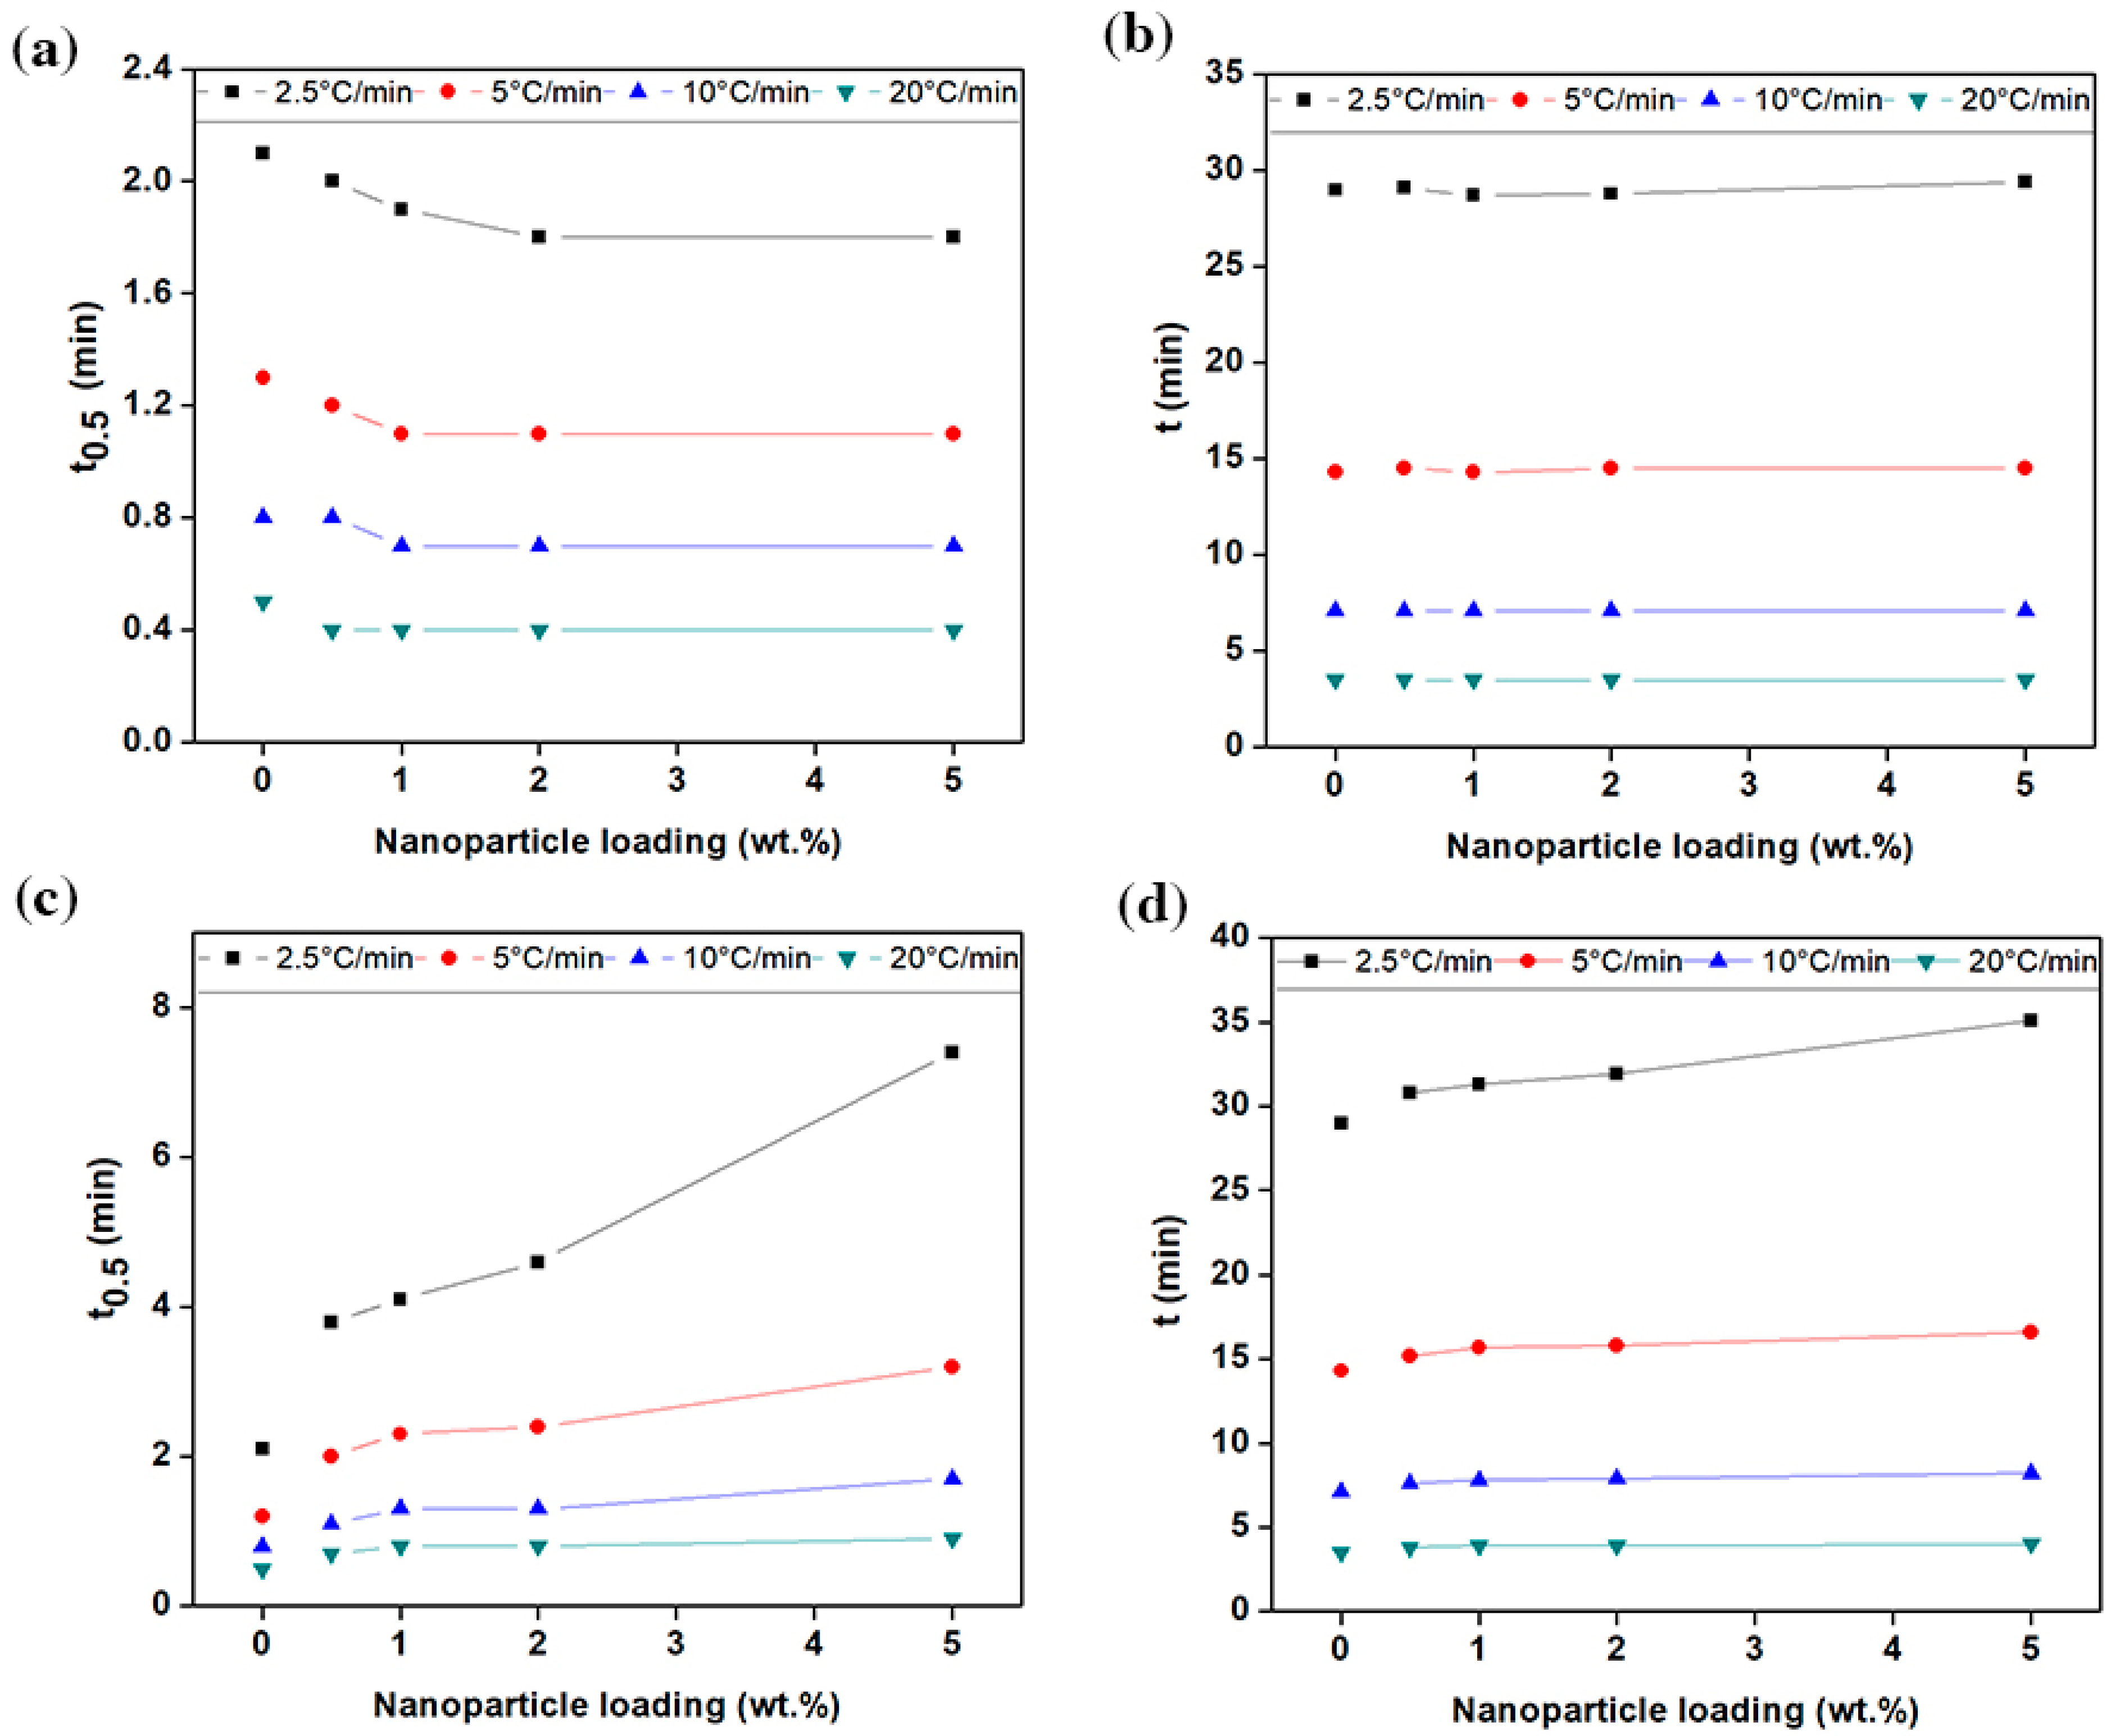
t, relatively increased for the polymers filled with graphene, especially when decreasing the cooling rate. The value of
t grew linearly, in concurrence with the increase in the concentration of graphene (see
Figure 5c,d). With a 1 wt.% loading, for example, it was increased from 3.5, 7.1, 14.3 and 29 min to 3.9, 7.8, 15.7 and 31.3 min, at the cooling rate of 2.5, 5, 10, 20 °C/min, respectively. Interestingly, the time required to reach 50% of relative crystallinity (
t0.5) extended significantly with the addition of graphene, especially at the cooling rate of ≤10 °C/min. As a further example, in PE-g-1%, the value of
t0.5 increased from 0.5, 0.8, 1.2 and 2.1 to 0.8, 1.3, 2.3 and 4.1 min, at the cooling rate of 2.5, 5, 10, 20 °C/min, respectively. The marginal increase in the value of (
t −
t0.5), indicates that the time-lag occurring as a result of a longer incubation period. On the other hand, a slight decrease in
t0.5 and
t was generally observed with the addition of carbon black, as shown in
Figure 5a,b. The value of
t0.5 remained almost saturated when the carbon black content reached 1 wt.% and higher. These results are in agreement with the PLM images, that is, the spherulite radius is directly proportional to the rate of spherulitic growth (
r =
vt). This means that the crystallisation kinetics of PE-CB and PE-g were dominated by the nucleation process. As graphene has a huge surface area, it has introduced a large number of nucleation sites through which the crystallisation initiated and occurred at higher temperatures. The effect of graphene is consistent with most of the results reported in the literature on the effect of nucleating agents upon the behaviour of crystallisation in HDPE, with the exception of the declining rate of the crystallisation [
11]. Nonetheless, a decrease in the crystallisation rate was observed with nanofillers that behave like graphene and produce a jammed-network structure in polymers [
13,
17,
24,
26,
34,
47,
63]. The three-dimensional networks (entanglements) induced by the graphene platelets possibly presented an obstacle to crystallisation and led the polymer molecules to adjust their configuration over a longer period of time. This suggests why the induction time was longer, especially as the nucleation tends to be sporadic at reduced degree of undercooling [
6,
27]. Furthermore, the increase of the melt viscosity caused by graphene platelets, through the three-dimensional network structure and/or synergetic effect advantages, made the transport of the materials to the growth point more difficult, resulting in a decreased growth rate [
59,
64]. F. C. Chiu et al., found that the density of nuclei was higher for the polyethylene with higher molar mass, so this could be another reason for the increase in
T0 [
12,
64]. Contrastingly, carbon black was shown to have little effect on the crystallisation kinetics of multimodal-HDPE, conceivably because of its surface properties.
Carbon black acting as a nucleating agent in polyethylene has never yet been reported according to the author’s knowledge. Many studies, such as those by S. Song et al. [
1], A. Krumme et al. [
2], T. Wu et al. [
5], L. Balzano et al. [
20], Y. An et al. [
21], I. Dukovski and M. Muthukumar [
23] and M. Gahleitner et al. [
65], reported on the effect of the MWD breadth, MWD mode and the long chain molecules on the crystallisation behaviour of the polymers. Provides studies have shown that the presence of the high molar mass chains in a polyethylene with a bimodal or broad MWD can lead the crystallisation to occur at a higher temperature through an action of fluid shear. It is well-established that the specific volume of the polymer decreases upon cooling and thus a certain degree of shear flow is expected to be induced in the system. A pre-existing shear flow may also have been introduced in the compounding extruder and/or in the compression moulding during samples preparation for analysis. As a consequence, the relative change in the crystallisation kinetics of PE-CB is suggested to be mainly due to the synergistic advantage induced by carbon black. The incorporation of carbon black protected the MWD and/or the long chain molecules from becoming narrower or shorter, respectively. This is consistent with the results published by J. Wang et al. on a synergistic advantage obtained from the addition of carbon nanotubes on the crystallisation kinetics of isotactic polypropylene [
15].
Using an appropriate model to account for the varying temperatures and cooling rates allows better understanding of the crystallisation kinetics under typical non-isothermal conditions. Various scientists, such as Ziabicki, K. Nakamura et al., Jeziorny, Ozawa, R. M. Patel et al., Dietz, T. Liu et al., have proposed numerous models to describe the non-isothermal crystallisation kinetics of semicrystalline polymers [
11,
22,
23,
38]. Among these models, a model proposed by T. Liu et al. was the most acclaimed and most successful approach in explaining the non-isothermal crystallisation kinetics of polyethylene and nanofillers-based polyethylene nanocomposites, such as carbon nanotubes, carbon black, graphene, diamond, graphite, CaCO
3, SiO
2, TiO
2 [
11,
24,
25,
26,
27,
28,
29,
38]. The study derived a new kinetic equation by combining the Avrami equation (
) with the Ozawa equation
)), where
is the overall crystallisation rate constant as a function of time, exponent
n is a kinetic constant,
is a cooling function related to the rate of overall crystallisation and changes as a function of temperature and
is the Ozawa exponent based on the dimensions of the crystal growth [
38]. Rearranging and combining the Ozawa and Avrami equations leads to a kinetic equation that provides a relationship between the cooling rate
and arbitrary crystallisation temperature T, namely
and can further be rewritten as
where the parameter
=
1/m refers to the cooling or heating rate required to achieve a certain relative degree of crystallinity at a unit crystallisation time and a is the ratio of Avrami exponent
n to Ozawa exponent
m, that is,
a =
n/
m.
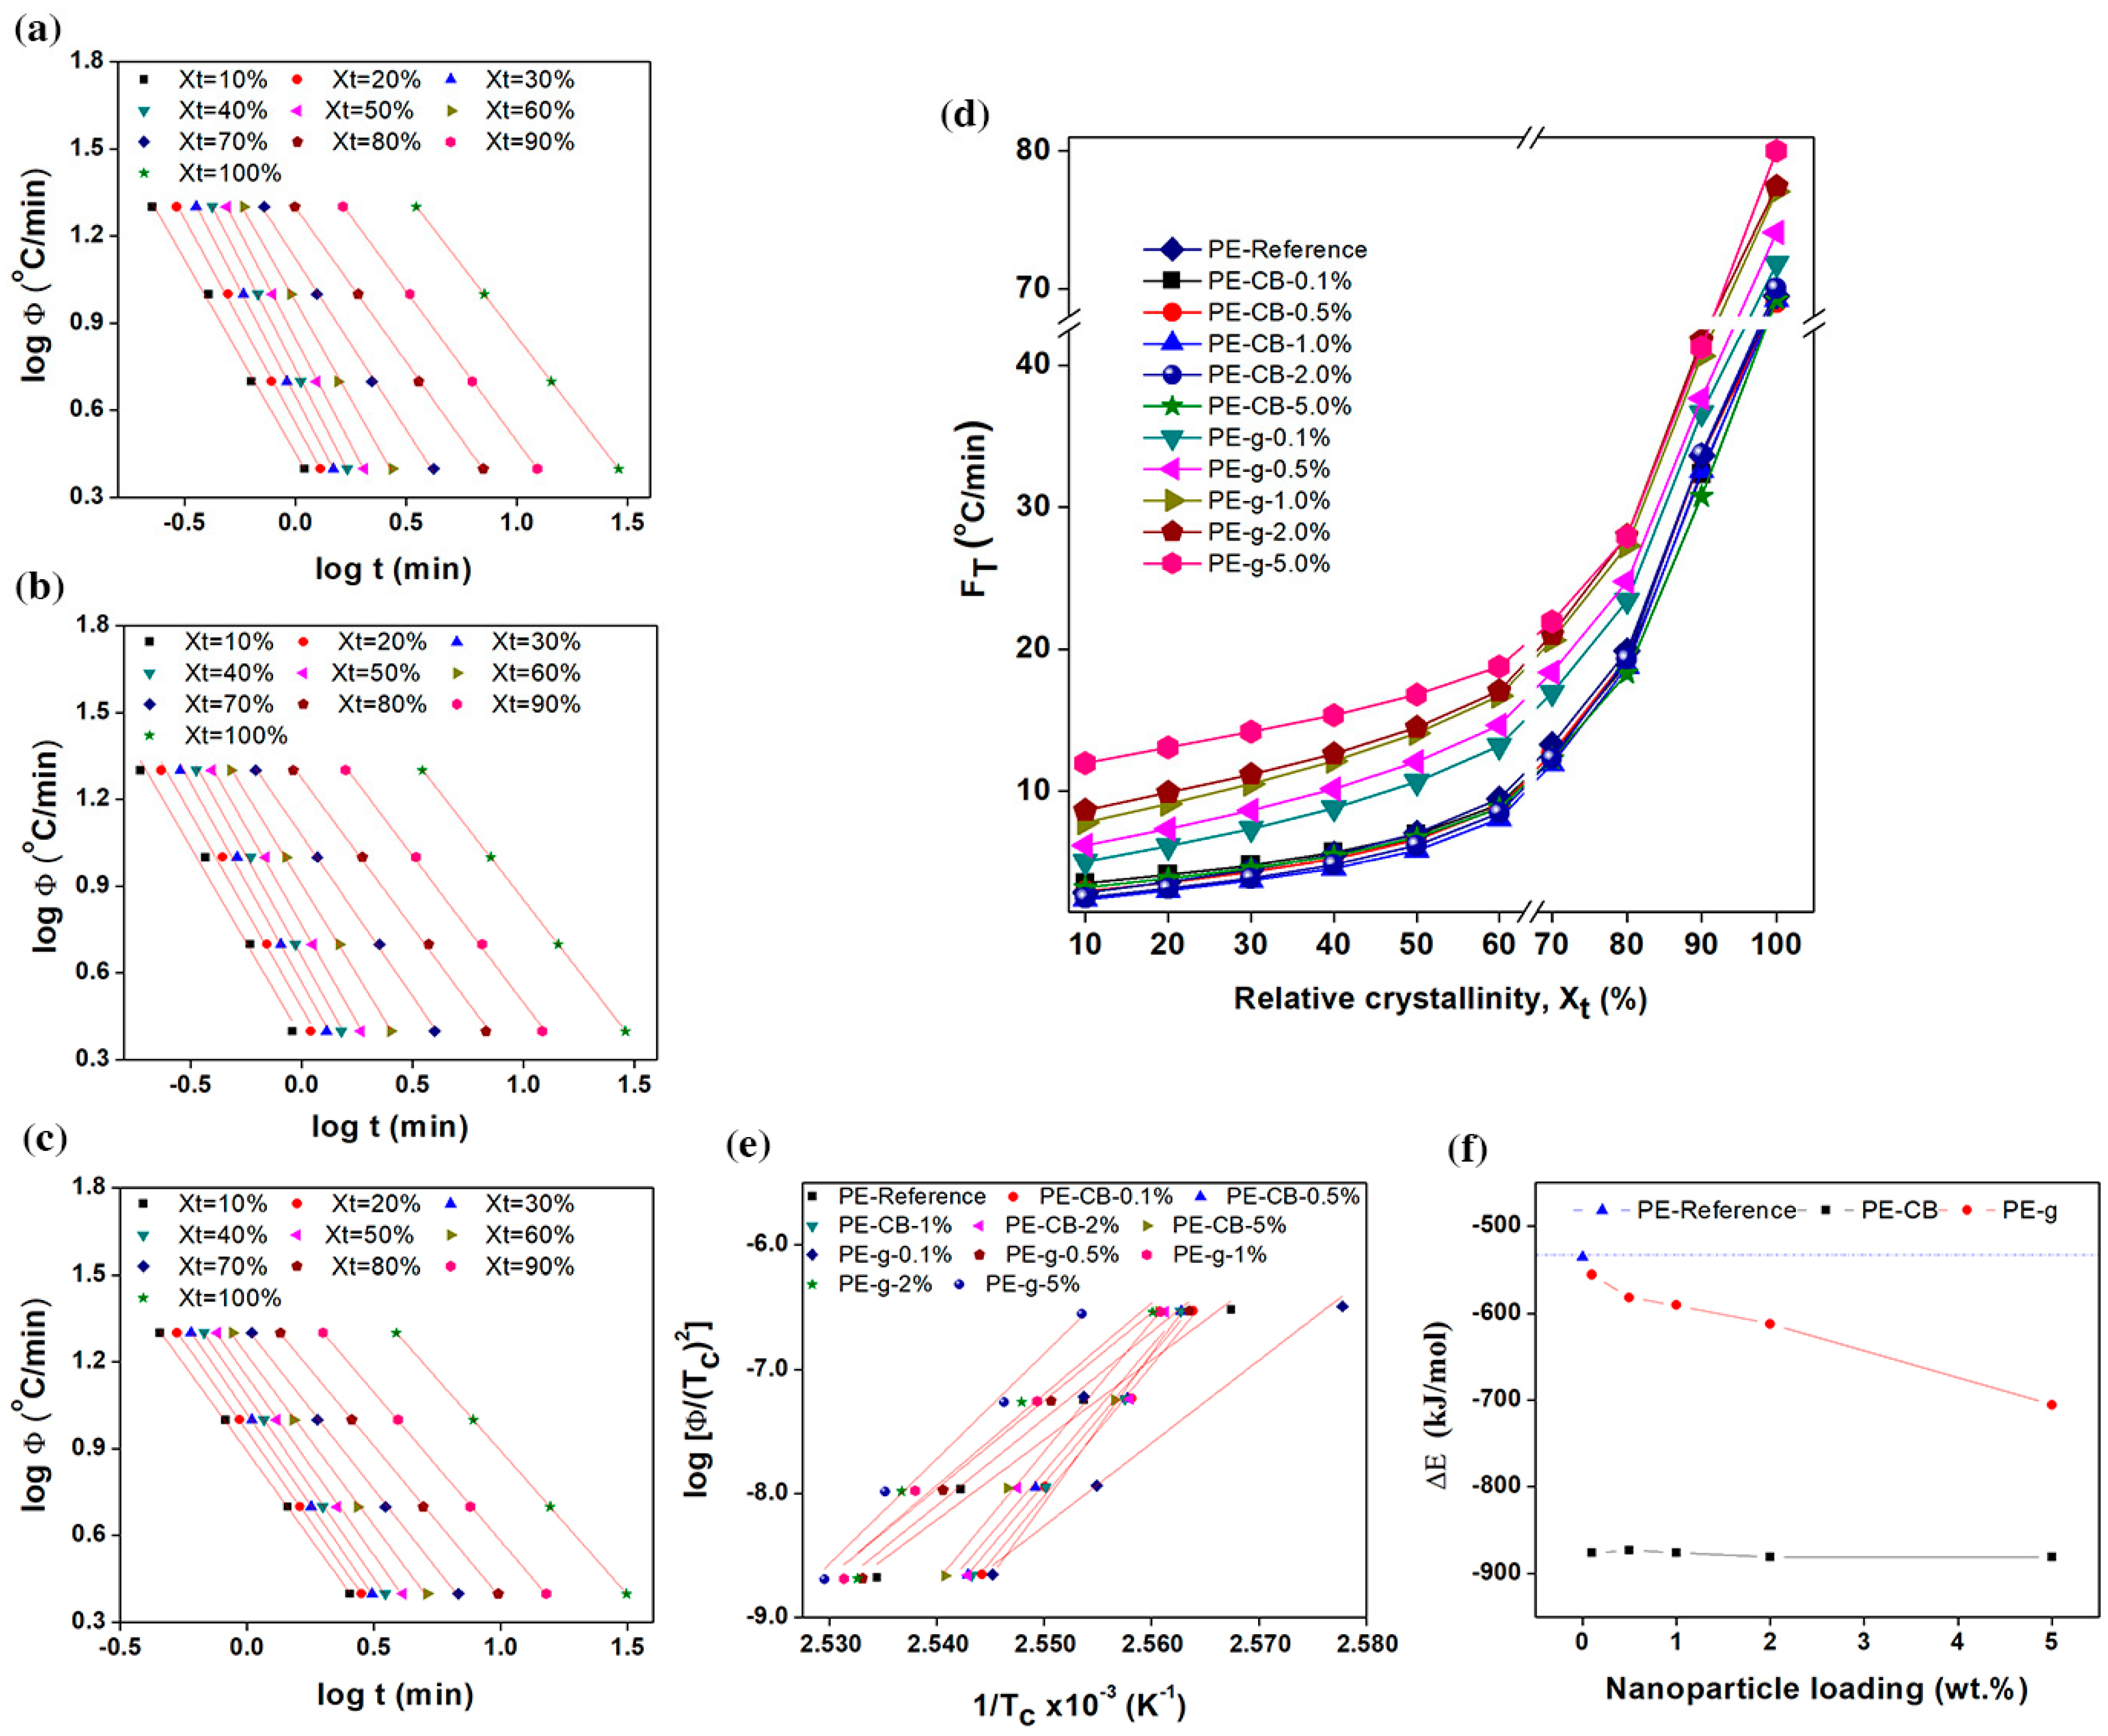
Parameters
and −
a can be determined from the intercept and slope of the log φ versus log
t plot respectively, as shown in
Figure 6a–c and
supplementary Figure S6. According to Equation (6), the series of linear relationships with coefficient of determination r
2 ≥ 0.998, was observed at a given relative degree of crystallinity, indicating that the T. Liu et al. model could aptly describe the non-isothermal crystallisation kinetics of the multimodal-HDPE, PE-g and PE-CB. The kinetic parameter
FT as a function of relative degree of crystallinity and the nanofiller content, is shown in
Figure 6d, for the multimodal-HDPE, PE-CB and PE-g, representing the cooling rate required for every sample to achieve a certain degree of relative crystallinity at a unit crystallisation time. It was directly proportional to the relative degree of crystallinity, while values of
a were almost the same. The marginal changes in the values of
a, ranged from 1 to 1.3, which also indicates that the combined Avrami-Ozawa equations suitably describes the non-isothermal crystallisation kinetics of the multimodal-HDPE, PE-g and PE-CB, as reported elsewhere [
11,
24,
25,
26,
27,
28,
29,
30,
33,
34,
35,
36]. As shown and discussed earlier in the present study,
became larger, at a unit crystallisation time, by increasing the cooling rate and the crystallisation roll-off occurred at around a 70% degree of crystallinity, which is characteristic of slow or secondary crystallisation. In general,
FT values of the neat HDPE and PE-CB were almost the same and increased in a similar pattern across the entire degree of relative crystallinity. A slight decrease in
FT was observed when the polyethylene was loaded with ≥1 wt.% carbon black content, which is consistent with the results observed earlier in this study.
The
FT parameter of PE-CB-1% decreased from 2.8, 7 and 69.5 °C/min to 2.4, 5.8 and 69.2 °C/min at
Xt of 10%, 50% and 100%, respectively. This is a confirmation that carbon black did not form a continuous network structure, most probably because of its dimensionality. However, the relative increase in
FT was clearly evident even at the lowest graphene content and continued to gradually rise as the concentration of graphene became larger, especially at
Xt < 70%. The
FT value of the multimodal-HDPE filled with 1 wt.% graphene, increased from 2.8, 7 and 69.5 °C/min to 7.8, 14.1 and 77.1 °C/min at
Xt of 10%, 50% and 100%, respectively. This is indicative of a slower crystallisation process compared with the neat HDPE and/or HDPE filled with CB and it is related to the difficulty of crystallisation process to progress further due to the entangled-network structure induced by graphene platelets. These results are consistent with what was observed and discussed earlier in this study. Accordingly, knowledge of the conditions affecting the crystallisation kinetics is crucial for optimising the processing parameters, as this can affect the final properties of the product which includes warpage/shrinkage control, mechanical and optical clarity or an alteration of the cycle time in moulding or extrusion [
11]. In pipe manufacturing, for example, the thermal gradient across the pipe wall generates residual stress within the pipe, as the crystallisation in the core region is slower than the inner and outer surfaces that are cooled down by a water spray [
1,
3]. A replacement of the nanofiller, such as carbon black by graphene, requires a consequent optimisation of the processing parameters.
At a given cooling rate, the relative degree of crystallinity at the peak crystallisation temperature ranges between 11% and 30% for all the polymers. The mean activation energy barrier (Δ
E) required for the molecular chains to transport from the melt state to the growing crystal surface, in non-isothermal systems, was calculated in this study, using the following H. E. Kissinger equation [
19,
34,
35,
36,
38,
39]
where
R is the universal gas constant. The higher the value of Δ
E, the more difficult the transportation of macromolecular chains to the growing surface. These can generally result either from higher viscosity or restriction in the polymer chains as previously discussed in the present study. The activation energies obtained from the slope of the straight-lines in a
versus
plot in
Figure 6e, are plotted as a function of nanoparticle content in
Figure 6f. The dashed line represents the Δ
E of the neat multimodal-HDPE, which was −535 kJ/mol. The value of Δ
E decreased gradually to −556, −582, −591, −612 and −705 kJ/mol when increasing the concentration of graphene to 0.1, 0.5, 1, 2, 5 wt.%, respectively. However, the relative value of Δ
E decreased significantly to −876 kJ/mol at the lowest carbon black content of 0.1 wt.% and remained almost saturated at higher concentration. In general, the decrease in the activation energy barrier is attributable to the role of the nanoparticles as a nucleating agent. The results indicate that graphene is likely to perform two functions in the multimodal-HDPE matrix. The platelets acted as nucleating agents and accelerated the primary nucleation, which was manifested by the gradual decrease in Δ
E and the increase in
T0 and
Tc. However, the presence of the jammed network structure slowed the diffusion of the polymer chains into the crystalline lattice, thus lowering the overall crystallisation rate, as confirmed by the increase in
FT,
t0.5 and
t. On the other hand, the change in crystallisation kinetics of the multimodal-HDPE, associated with the addition of carbon black, is suggested to be a result of the synergistic effects. This occurs where the longer macromolecular chains and broader MWD accelerated the crystallisation of PE-CB as confirmed from the values of Δ
E,
t0.5,
Tc,
FT, as well as rheological results.


