Article

Fabrication and Characterization of a Highly-Sensitive Surface-Enhanced Raman Scattering Nanosensor for Detecting Glucose in Urine

1
College of Chemistry and Materials Science, Fujian Key Laboratory of Polymer Materials, Fuzhou, Fujian 350007, China
2
Center of Engineering Technology Research for Microalgae Germplasm Improvement of Fujian, Southern Institute of Oceanography, Fujian Normal University, Fuzhou, Fujian 350117, China
3
Fujian Key Laboratory of Innate Immune Biology, Biomedical Research Center of South China, College of Life Science, Fujian Normal University, Fuzhou, Fujian 350117, China
4
Key Laboratory of Optoelectronic Science and Technology for Medicine of Ministry of Education, Fujian Provincial Key Laboratory of Photonics Technology, Fujian Normal University, Fuzhou, Fujian 350117, China
*
Author to whom correspondence should be addressed.
Nanomaterials 2018, 8(8), 629; https://doi.org/10.3390/nano8080629
Submission received: 11 July 2018 / Revised: 7 August 2018 / Accepted: 16 August 2018 / Published: 20 August 2018

Abstract

:
Herein we utilized coordination interactions to prepare a novel core-shell plasmonic nanosensor for the detection of glucose. Specifically, Au nanoparticles (NPs) were strongly linked with Ag+ ions to form a sacrificial Ag shell by using 4-aminothiophenol (4-PATP) as a mediator, which served as an internal standard to decrease the influence of the surrounding on the detection. The resultant Au-PATP-Ag core-shell systems were characterized by UV-vis spectroscopy, transmission electron microscopy, and surface-enhanced Raman scattering (SERS) techniques. Experiments performed with R6G (rhodamine 6G) and CV (crystal violet) as Raman reporters demonstrated that the Au@Ag nanostructure amplified SERS signals obviously. Subsequently, the Au@Ag NPs were decorated with 4-mercaptophenylboronic acid (4-MPBA) to specifically recognize glucose by esterification, and a detection limit as low as 10−4 M was achieved. Notably, an enhanced linearity for the quantitative detection of glucose (R2 = 0.995) was obtained after the normalization of the spectral peaks using 4-PATP as the internal standard. Finally, the practical applicability of the developed sensing platform was demonstrated by the detection of glucose in urine with acceptable specificity.

1. Introduction

The past decade has witnessed a global spread of diabetes, a serious health problem demanding urgent attention. According to the World Health Organization, diabetes affects over 347 million people worldwide and causes over 3.8 million deaths annually [1,2,3,4,5]. Diabetes results from insulin deficiency, which can increase the levels of glucose in blood [6], those who are affected by this disease have fasting blood glucose concentrations exceeding the physiological values of 3.9–6.2 mM or postprandial blood glucose levels of 3.9–7.8 mM [7], which signifies the importance of blood glucose detection for diagnostics. Among the numerous methods (e.g., fluorescence [8,9], colorimetric [4], near-infrared [10], and electrochemical [2,11,12,13,14]) developed for measuring blood glucose concentrations, electrochemical sensing is viewed as one of the most successful techniques, which relies on the use of glucose oxidase or glucose oxidase/glucose dehydrogenase to generate hydrogen peroxide [15,16]. However, enzymes are generally unstable and highly environmentally sensitive, additionally featuring the drawbacks of easy biological activity loss and high cost [17]. Furthermore, the pain associated with finger piercing during frequent monitoring increases patient discomfort levels. The concentration of glucose in urine is also an important indicator for many diseases, which makes the development of noninvasive or minimally invasive methods of frequent glucose monitoring in urine [18,19,20]
In recent years, surface-enhanced Raman scattering (SERS) has attracted growing attention due to its highly sensitive and selective detection of biomolecules even on a single-molecule level [21,22,23]. In particular, the pioneering work of label-free SERS-based detection of glucose is demonstrated by employing a 1-decanethiol monolayer adhered on the silver surface to absorb and directly detect glucose [24,25]. However, the above method suffers from low sensitivity and selectivity, because the enrichment of glucose by 1-decanethiol lacks specificity, and glucose exhibits relatively weak Raman activity [26]. It is noted that detection based on the use of Raman reporters affords much stronger signals and is widely used in glucose assays [27,28,29]. For example, phenylboronic acid has been widely used for the detection of saccharides and other diols based on the formation of cyclic boric anhydrides [30,31]. Meanwhile, it has also been demonstrated to utilize the derivatives of mercaptophenylboronic acid (MPBA) for glucose detection, relying on the observation of characteristic Raman peaks in the biologically silent region of 1800–2200 cm−1. In addition, the detection of glucose has recently been executed by using a triosmium carbonyl cluster–boronic acid conjugate [32] and an alkyne-functionalized boronic acid [33] as the mid-IR (Infrared ray) probes.
Bimetallic nanoparticles (NPs) have received considerable attention in view of their unique optical, magnetic, and other properties that make them potentially well suited for a range of diverse applications. Among these nanostructures, Au@Ag NPs, with strong surface plasmon resonance characteristics, are particularly attractive [34,35,36,37]. Herein, we used 4-aminothiophenol (4-PATP) to connect Au NPs and Ag NPs to form Au@Ag core-shell nanostructures, which are subsequently modified with 4-MPBA to specifically recognize glucose (Figure 1). The use of the small molecules (e.g., 4-PATP) [38] as templates to fabricate intra-gap core-shell structures results in the generation of “hot spots” that can enhance the Raman signal intensity of these molecules [39,40]. Moreover, since 4-PATP molecules presented inside the shell are not subject to the adverse effects of the external environment or desorption, they can also act as the internal standards.

2. Materials and Methods

2.1. Materials

Silver nitrate (AgNO3), chloroauric acid (HAuCl4), and ascorbic acid (C6H8O6) were purchased from Shenbo Chemical Co., Ltd. (Shanghai, China). Trisodium citrate (C6H5Na3O7), 4-aminothiophenol (4-PATP, C6H7NS), 4-mercaptophenylboronic acid (4-MPBA, C6H7O2BS), rhodamine 6G (R6G), and crystal violet (CV) were supplied by Macklin Biochemical Co., Ltd. (Shanghai, China), and D-glucose was purchased from Xilong Scientific Co., Ltd. (Guangdong, China). Human urine samples were provided by Fujian Cancer Hospital. Aluminum sheet (0.1 × 100 mm, 99.0%) were purchased from Sinopharm Chemical Reagent Co., Ltd. All solutions were prepared using distilled water unless otherwise mentioned. All chemicals were used as received without further purification.

2.2. Synthesis of Au NPs

Colloidal Au NPs were prepared by the reduction of HAuCl4 with sodium citrate. Briefly, a refluxing HAuCl4 solution (2.4 × 10⁻³ M, 100 mL) was mixed with trisodium citrate (1 wt%, 1 mL) under magnetic stirring for 15 min. The produced Au NPs were purified by centrifugation-induced precipitation–resuspension (9000 rpm, 20 min, two times) in water.

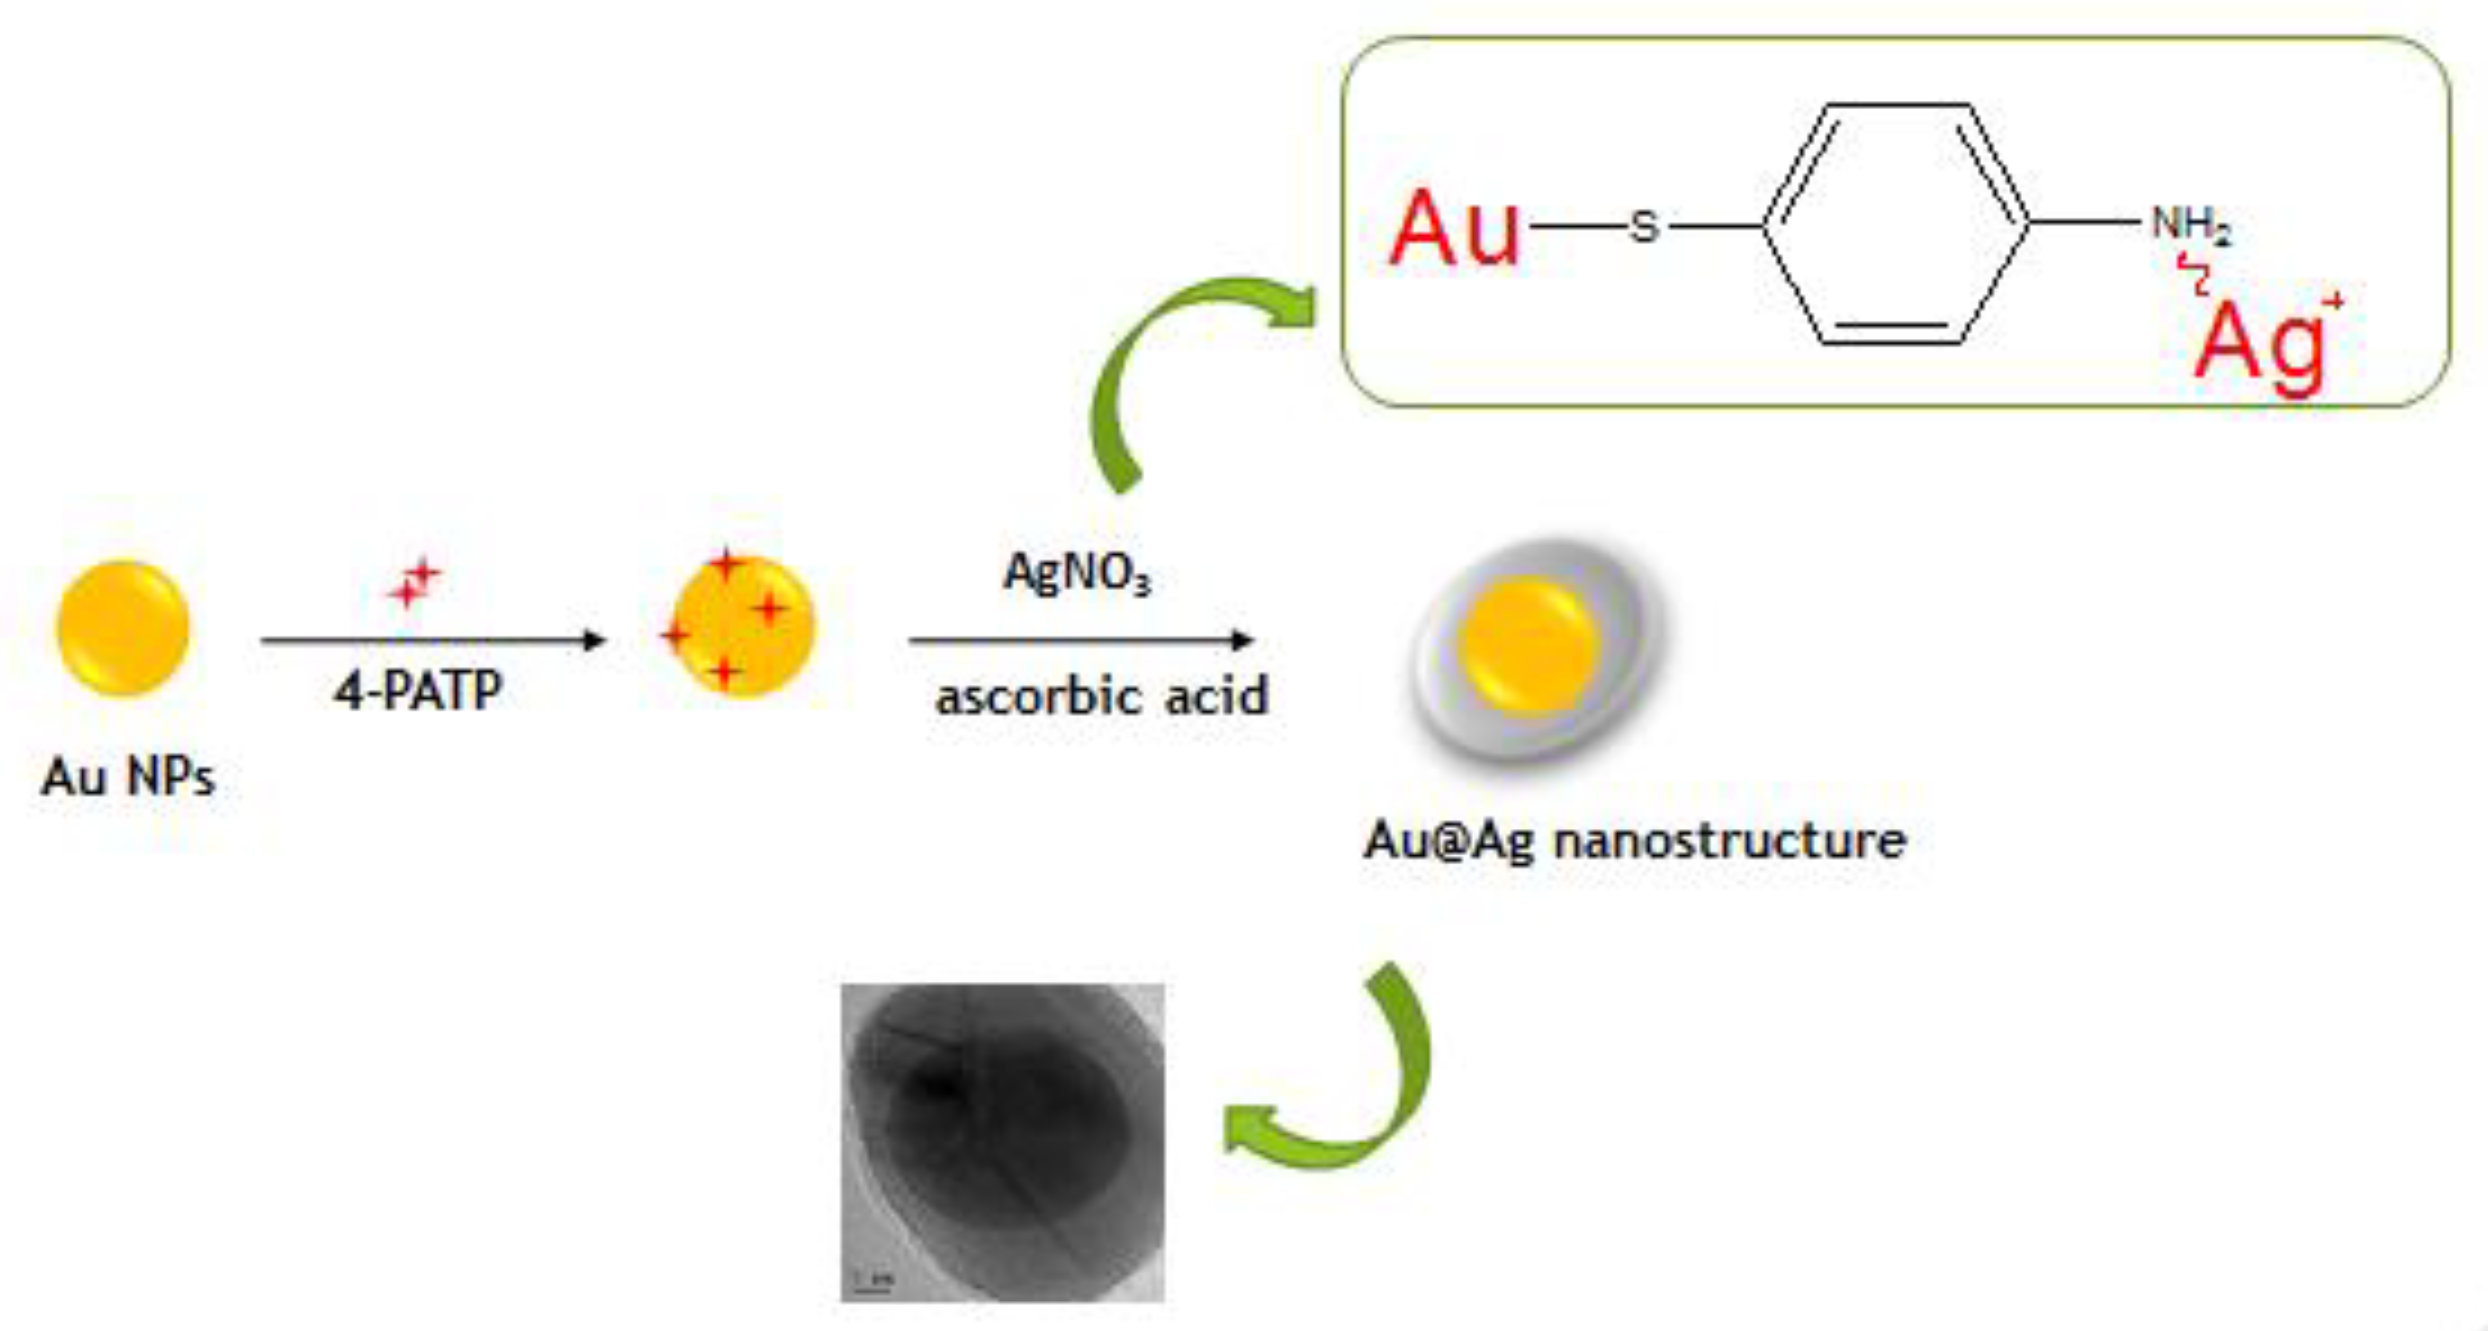
2.3. Synthesis of Core-Shell NPs

Three groups of as-prepared Au NPs (2.4 × 10⁻⁴ M, 20 mL) were mixed with aqueous 4-PATP solutions of three different concentrations (5 × 10⁻³, 5 × 10⁻⁴, and 5 × 10⁻⁵ M), respectively, and the resulting mixtures were stirred overnight. Subsequently, non-bonded 4-PATP was removed by two-fold precipitation-resuspension (9000 rpm, 6 min), and the resulting NP suspension was treated with AgNO3 (1 mM, 500 µL), L-ascorbic acid (0.1 M, 209 µL), and NaOH (100 mM, 518 µL), and incubated at 60 °C for 2 h. The obtained core-shell NPs were precipitated by centrifugation (9000 rpm, 6 min) and washed twice with water.

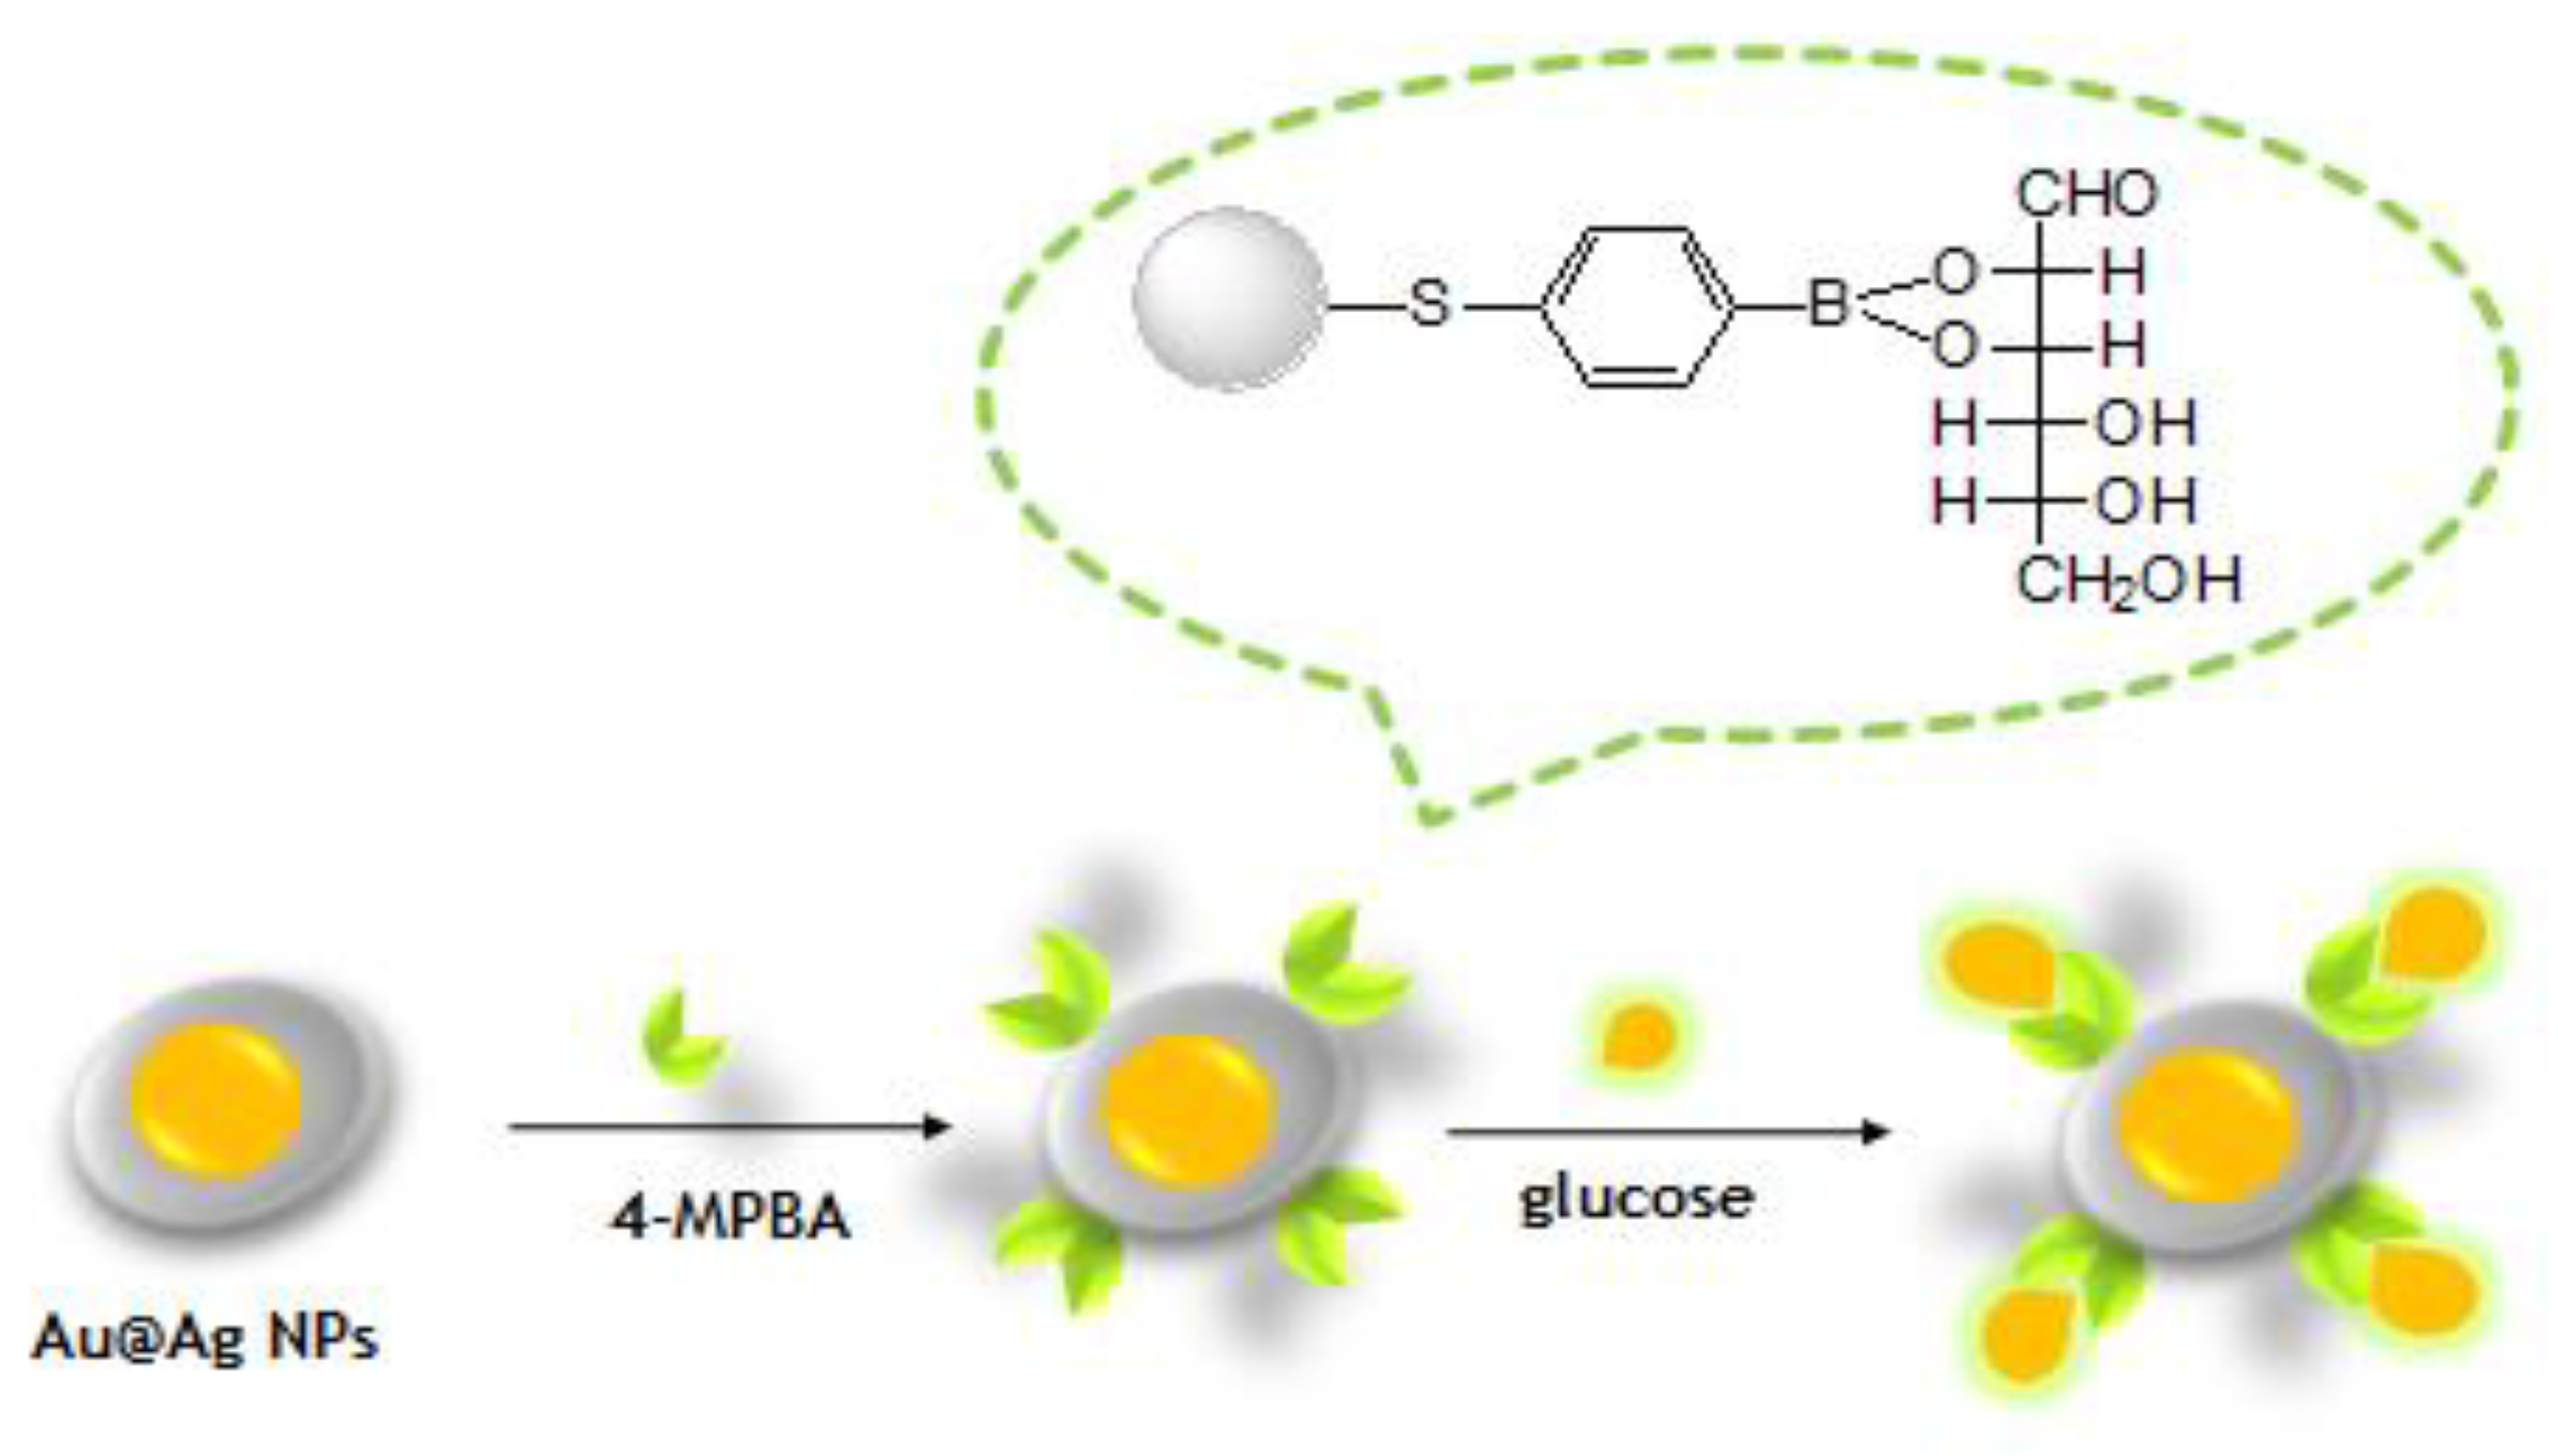
2.4. Functionalization of NPs by 4-MPBA

A suspension of as-prepared core-shell NPs (20 mL) was added to an ethanolic solution containing 4-MPBA (1 mM, 20 µL), and the obtained mixture was stirred for 4 h. Non-bound 4-MPBA was removed by centrifugation-induced precipitation-resuspension, and the resulting suspension of functionalized core-shell NPs was stored for future use.

2.5. NPs Characterization

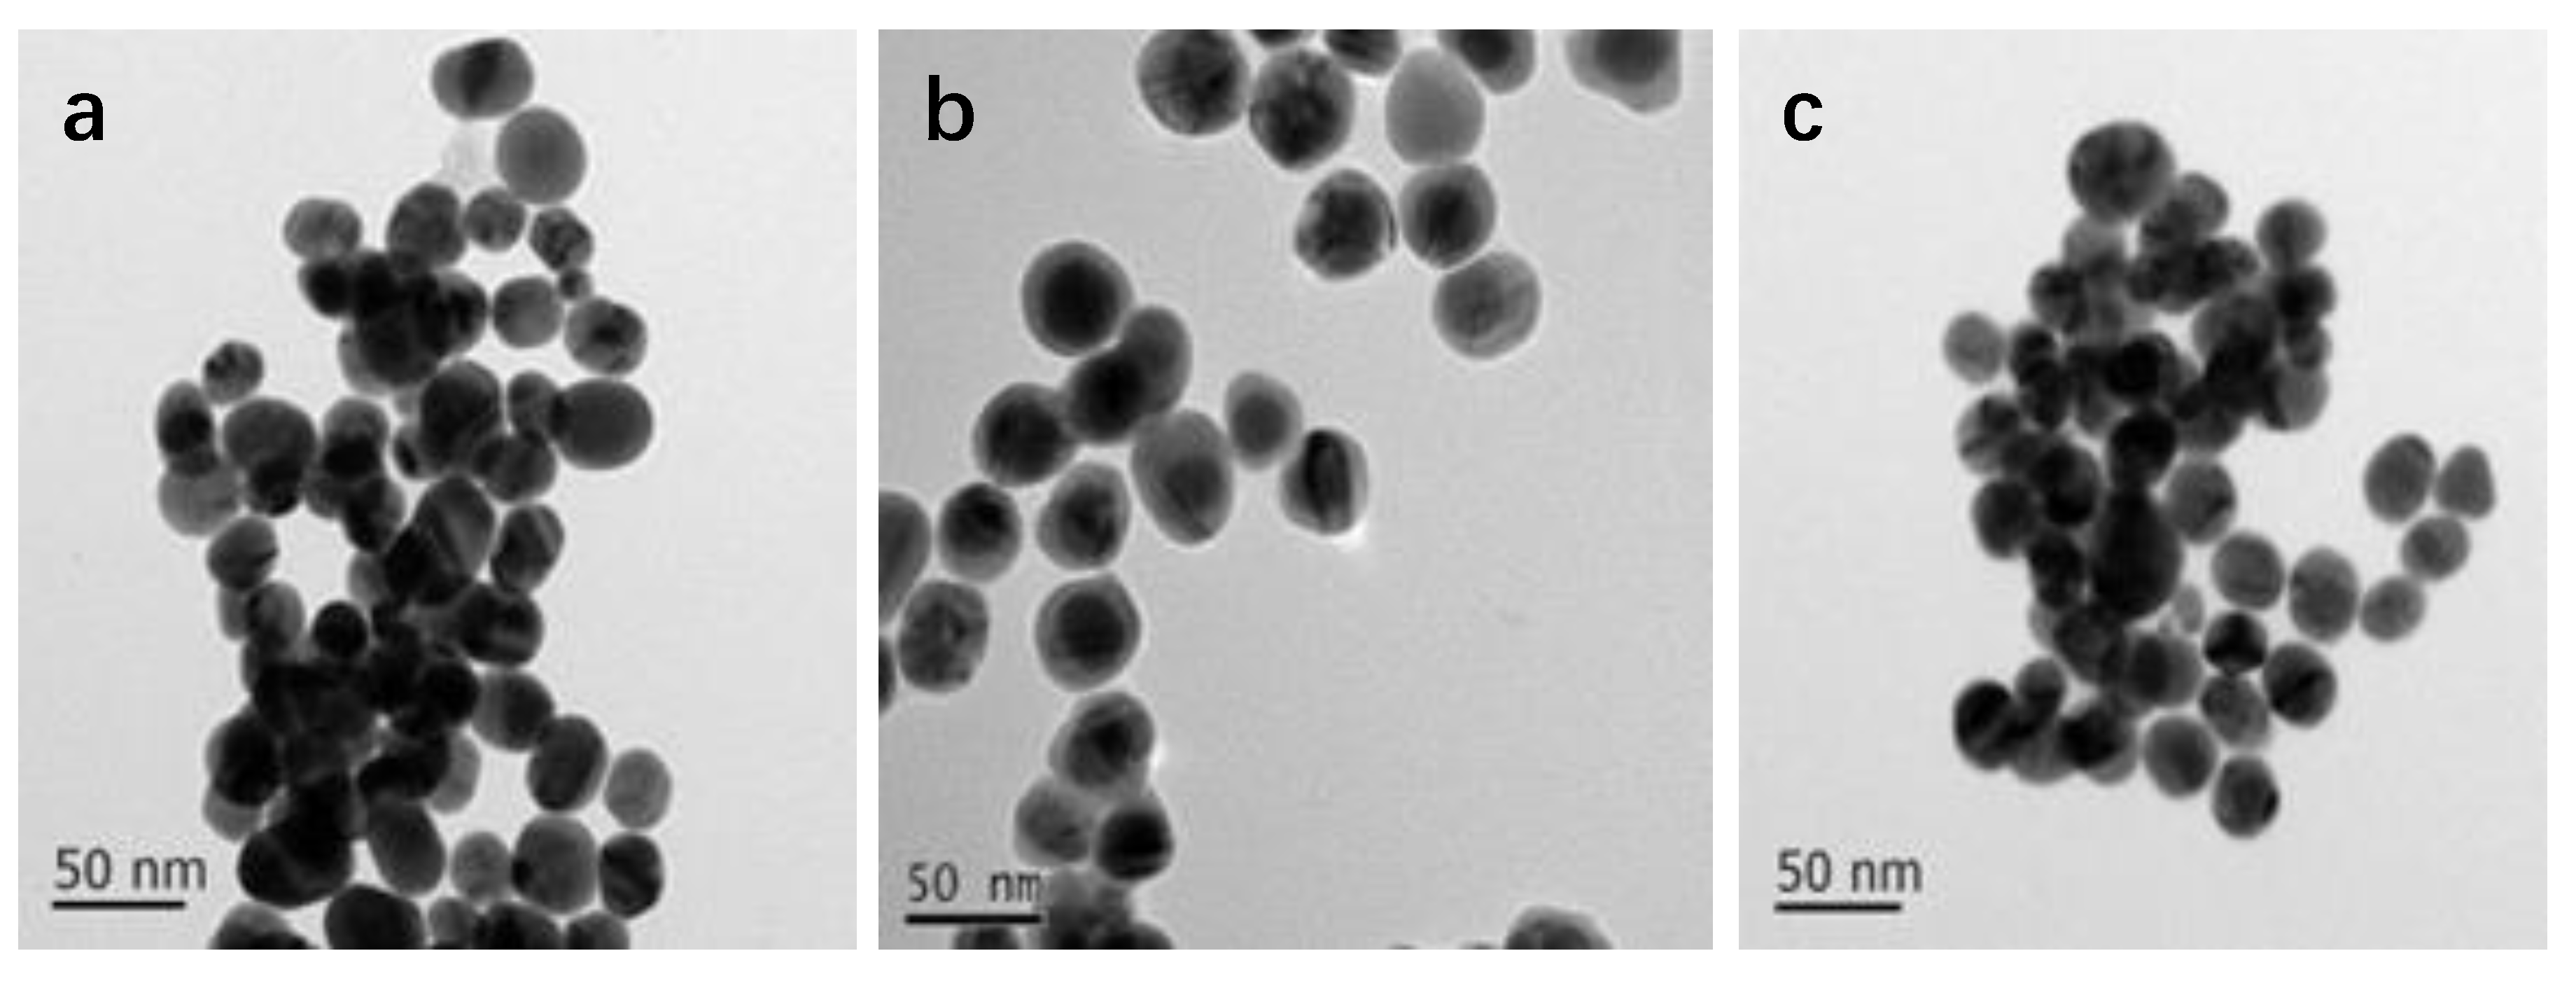
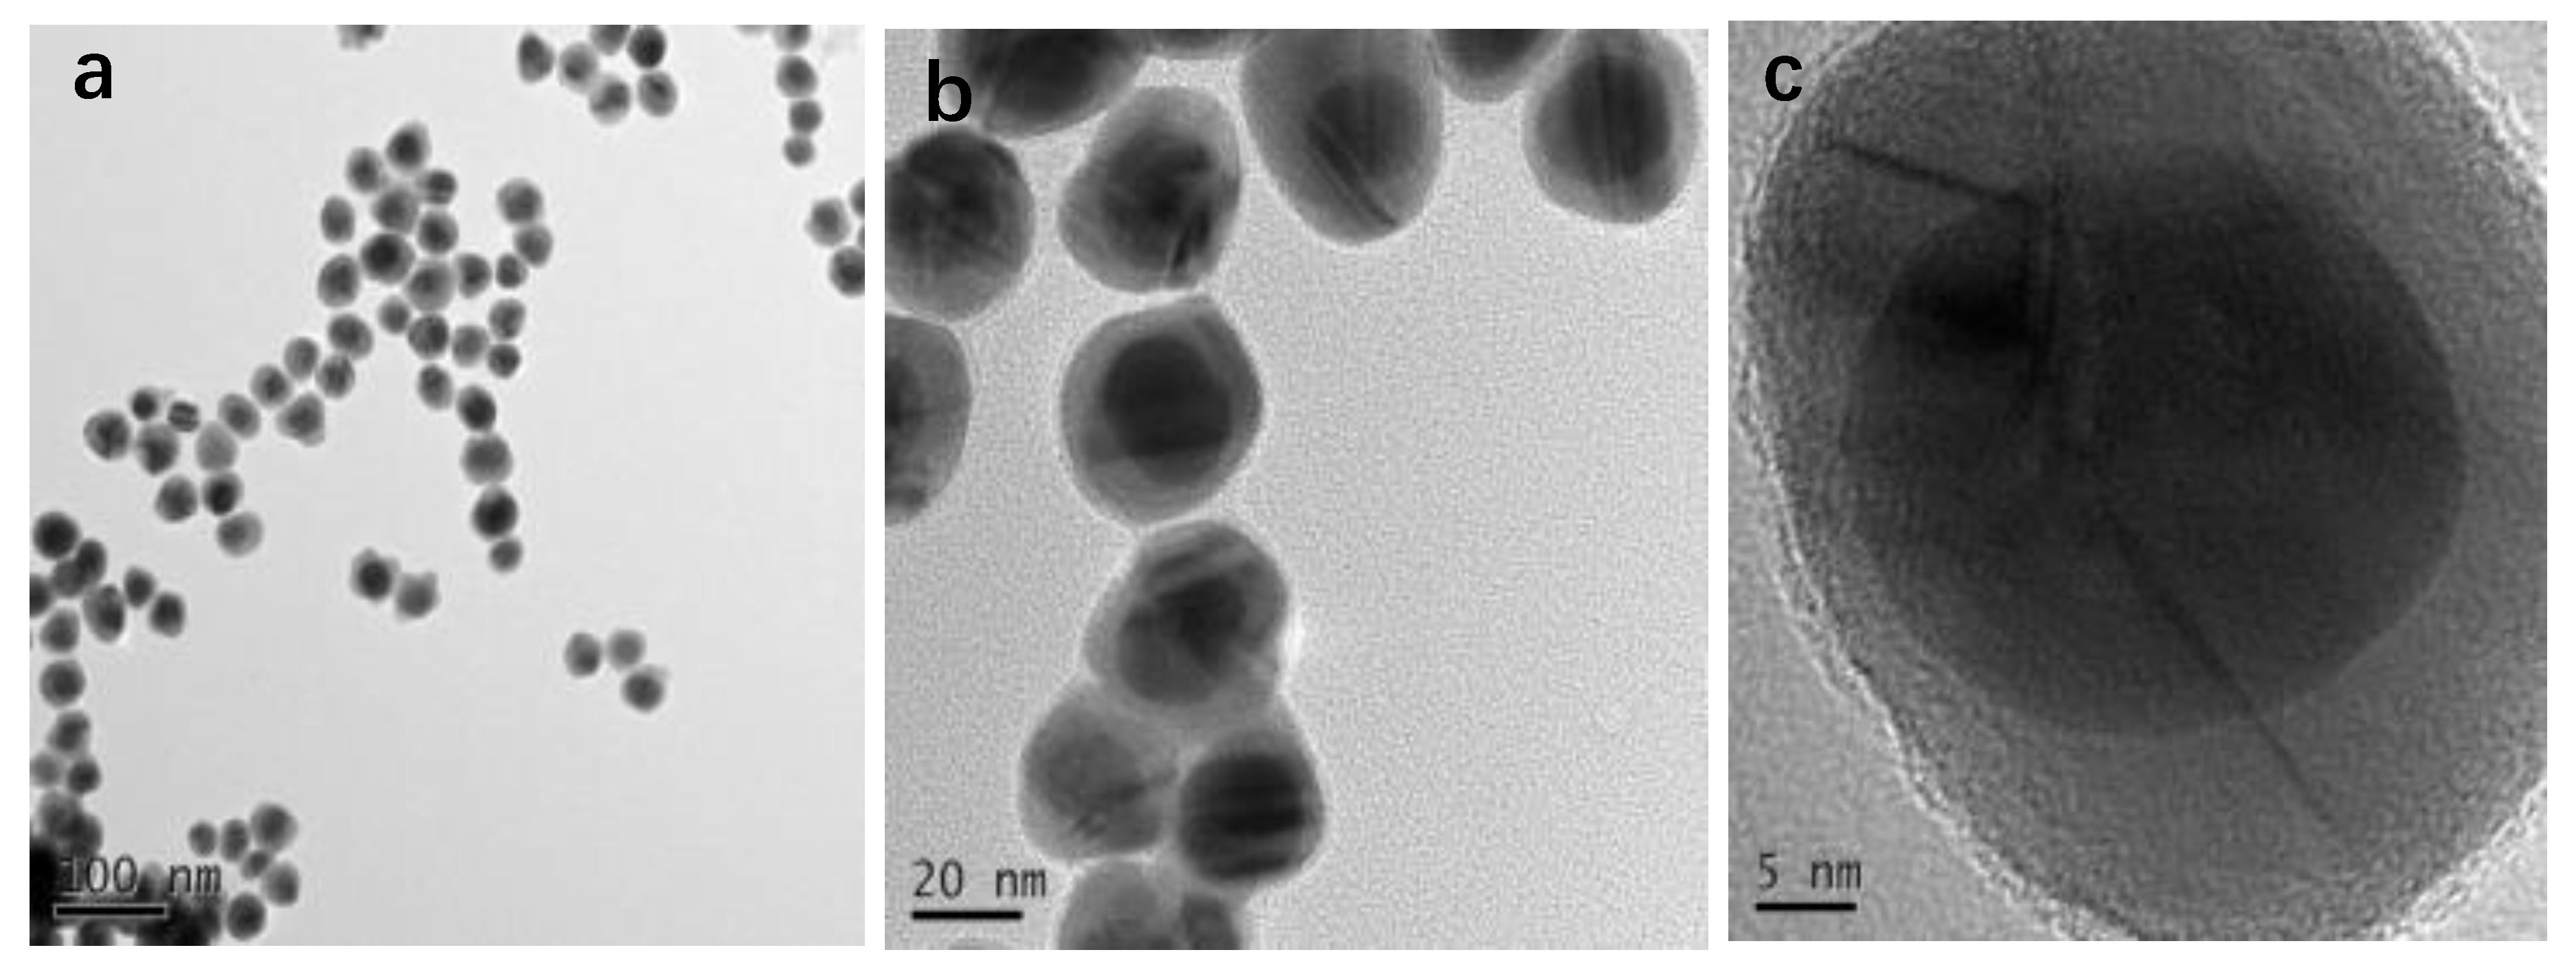
2.5.1. Transmission Electron Microscopy (TEM)

A drop of suspension containing NPs was deposited on a carbon-coated copper grid (Electron Microscopy Sciences, Hatfield, PA, USA) and allowed to dry at room temperature. Transmission electron microscopy was performed by using the low-/high-resolution transmission electron microscopy (TEM; JEM-2100, Tokyo, Japan; FEI F20, Columbus, OH, USA) at an accelerating voltage of 200 kV.

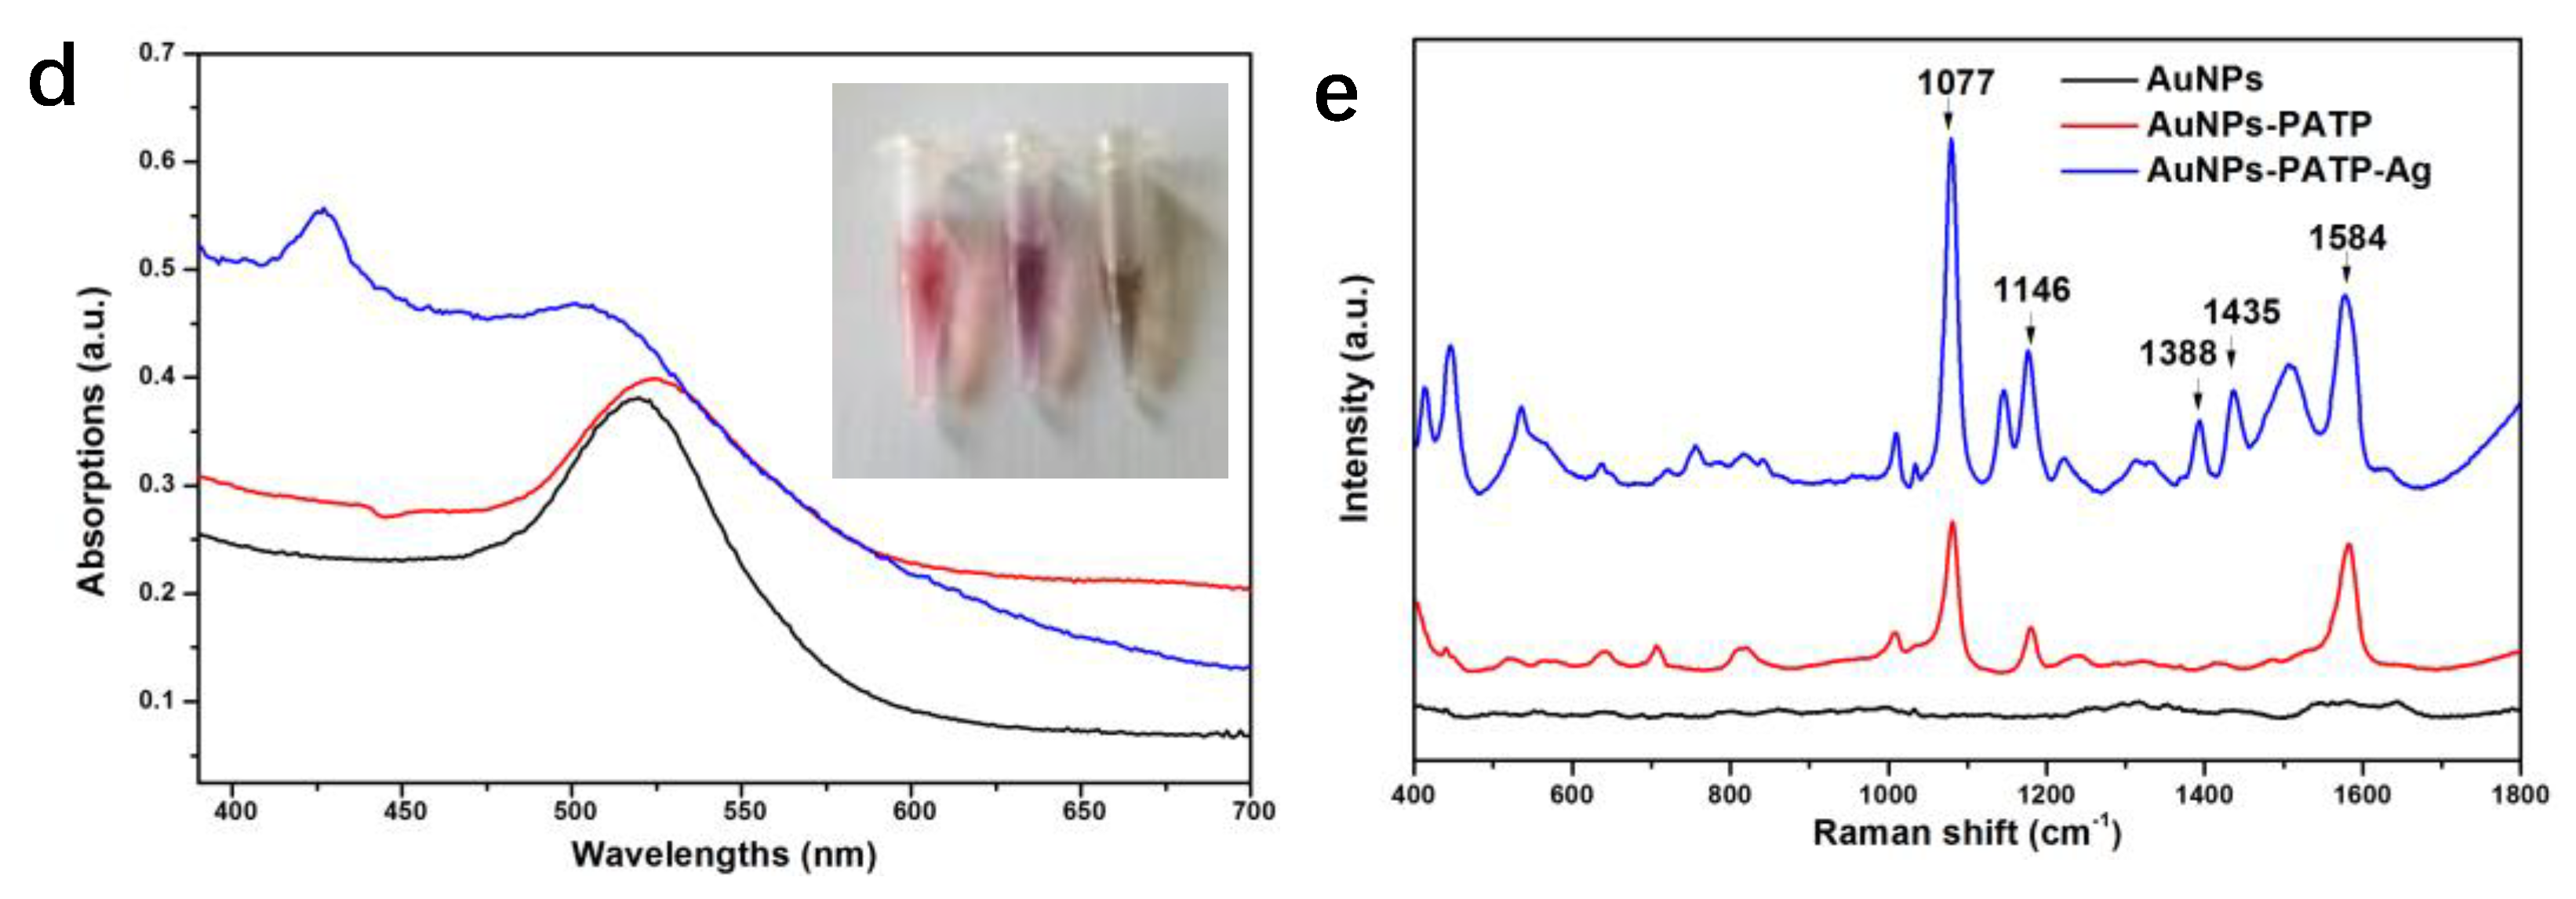
2.5.2. UV-Vis Spectrometer

Ultra Violet-vis adsorption spectra were recorded on a UV1902 UV-vis spectrometer (Lengguang Tech., Shanghai, China) at room temperature using a 600 μL black body quartz cuvette with an optical path length of 1 cm.

2.5.3. Raman Measurement
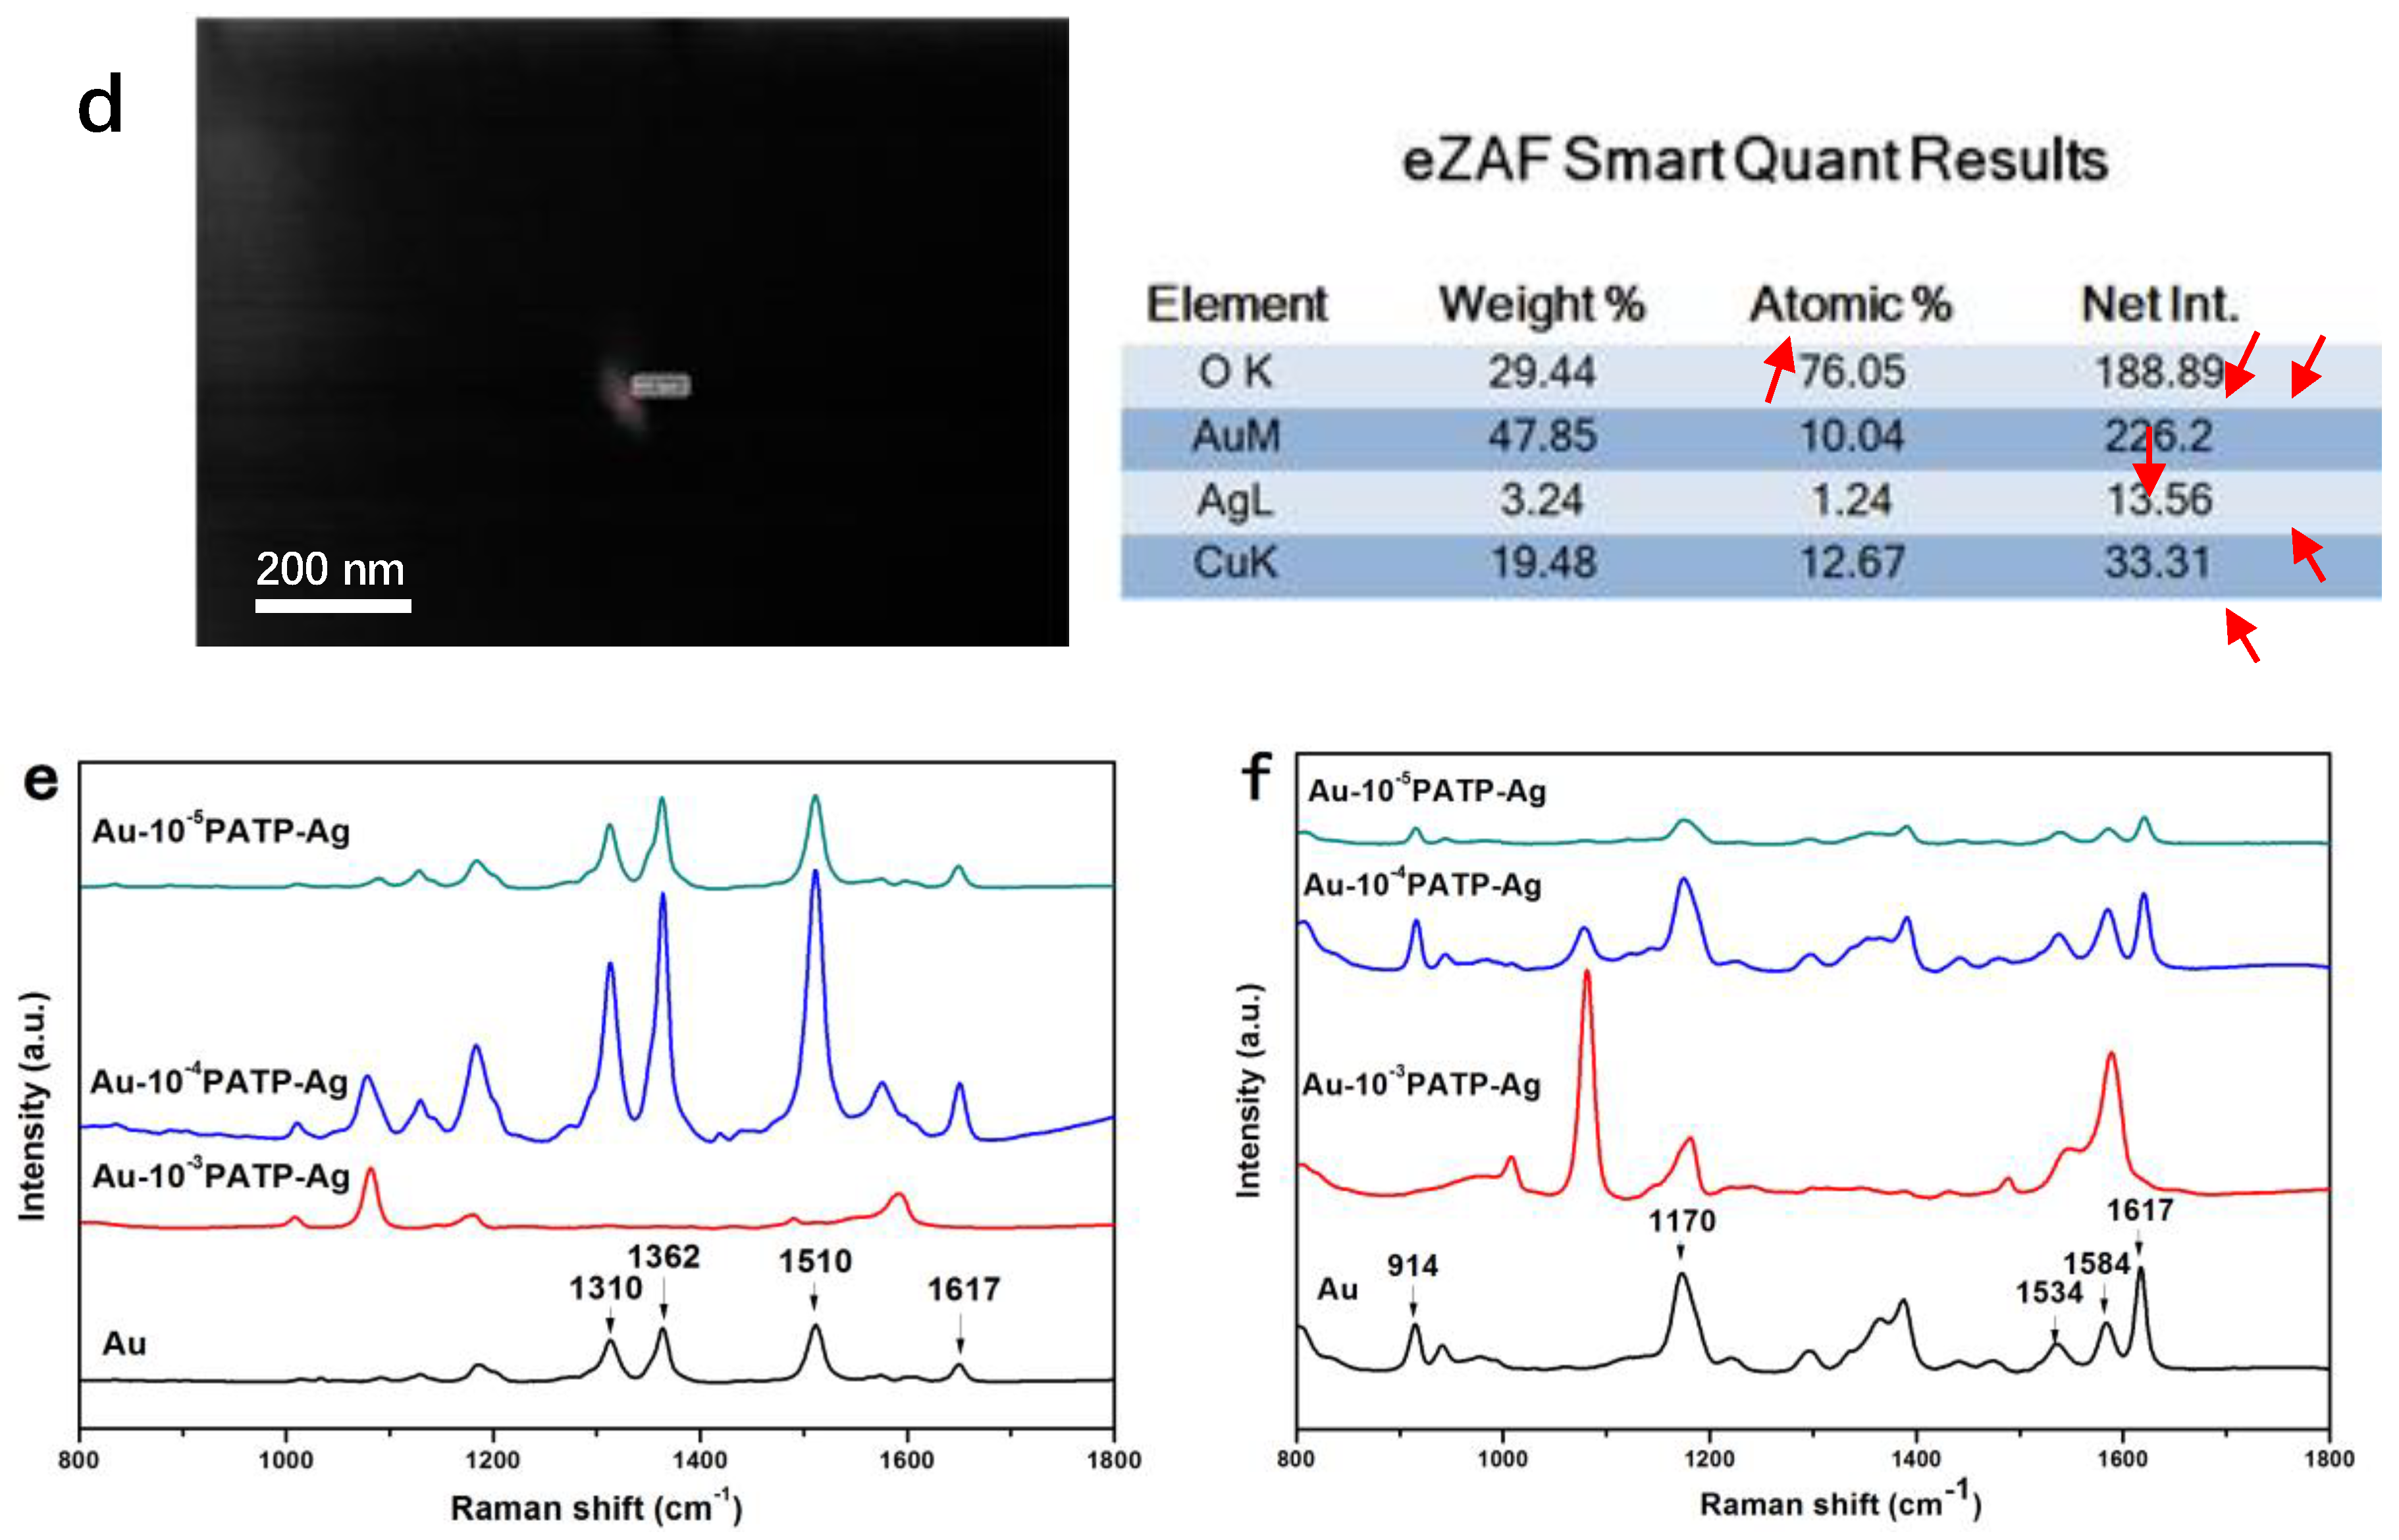
A drop of the reporter-embedded Au@Ag NPs was dispersed thoroughly in distilled water by sonication. A drop of the dispersion was transferred on the aluminum sheet and allowed to dry at room temperature. The aluminum was placed on the stage of a Renishaw in a Via Raman microscope (Renishaw, England) for Raman measurement. Laser intensity at the samples was ~0.34 mW from the 785 nm line of a diode laser for all measurements. The magnification was 20 times. Exposure time for all measurements was 10 s. Each spectrum was the average of 5 scans. Between different Raman sessions, the 520.7 cm−1 peak of a silicon wafer was used to calibrate the spectrograph.

2.5.4. EDX Analysis

The element analysis was conducted by EDAX APOLLO (EDAX Inc., Mahwah, NJ, USA). A 2 μL core-shell solution was added to a carbon-coated copper grid (Electron Microscopy Sciences, Hatfield, PA, USA) and allowed to dry at room temperature.

3. Results and Discussion

3.1. NPs Characterization

As shown in Figure 1, Au NPs prepared by the reduction of HAuCl4 with sodium citrate were treated with aqueous 4-PATP (5 × 10⁻⁴M). The subsequent introduction of AgNO3 (1 mM, 500µL) resulted in the formation of the Au-PATP-Ag+ intermediate. After the reduction of Ag+ ions by ascorbic acid, a layer of metallic Ag was produced, forming the Au@Ag core-shell NPs [41]. Figure 2 displays the morphology of as-prepared Au@Ag core-shell NPs. It demonstrates that these particles mostly featured a “poached egg” shape with a dark core (Au) and a light outer shell (Ag). As shown in Figure 2a–c, the obtained NPs had a uniform structure with a 25 nm-thick Au core and a 10 nm-thick Ag shell. The formation of core-shell NPs was accompanied by marked color changes. The treatment of Au NPs with 4-PATP resulted in an immediate color change from red to purple. Subsequently, the solution turned brown green upon the formation of the Ag shell (the inset in Figure 2d). Ultra Violet-vis spectroscopy analysis (Figure 2d) indicated that the plasmon resonance peak of the original Au-NPs at 520 nm shifted to longer wavelengths after the introduction of 4-PATP, which was ascribed to electron transfer between Au NPs and 4-PATP. Upon the formation of the Ag shell, the absorption peak shifted to wavelengths below 520 nm, and a new absorption peak of Ag concomitantly appeared at ~414 nm [35,42]. The structural changes were also monitored by SERS analysis. As shown in Figure 2e, the Au-PATP-Ag core-shell NPs featured enhanced Raman signals of the internal standard, 4-PATP, at 1584, 1435, 1388, 1146 and 1077 cm−1 (i.e., all these results indicated that “hot spots” were formed inside the Au@Ag nanostructure) [39,40].

3.2. SERS Analysis of NPs Modified with Different Concentrations of 4-PATP

The morphology of NPs was tuned by varying the concentration of 4-PATP (5 × 10⁻⁵, 5 × 10⁻⁴, and 5 × 10⁻³ M) while keeping the amount of AgNO3 constant (1 mM, 500 µL; Figure 3a–c, respectively). Notably, uniform nanostructures were produced only at a 4-PATP concentration of 5 × 10⁻⁴ M. Results of element analysis revealed that the molar ratio of Au:Ag is 8.10 (Figure 3d), close to the theoretical value of 9.6 (Au: 4.8 μmol; Ag+: 0.5 μmol). The quality of as-prepared Au@Ag NPs was probed by employing them to detect R6G (1 × 10⁻⁴ M) and CV (1 × 10⁻⁴ M) via SERS (Figure 3e,f). All the spectra, except for the one modified with 5 × 10⁻³ M PATP, clearly exhibit characteristic peaks of R6G molecules at 1310 cm−1, 1362 cm−1, 1510 cm−1, and 1650 cm−1, respectively [43]. This rule is also observed in the detection of CV. Except for the red line in Figure 3e, other spectra can well detect the characteristic peaks of CV molecules at 914 cm−1, 1170 cm−1, 1386 cm−1, 1534 cm−1, 1584 cm−1, and 1617 cm−1, respectively [44]. In the case of the metal NPs modified with 5 × 10⁻³ M of PATP, the dense layer of PATP led to the aggregation of Au NPs, thus the hot-spots were formed only for the PATP (sandwiched by Au NPs), this could prevent the acquisition of SERS signals from analyte (i.e., the red line shown in Figure 3e,f are only the signals corresponding to the base). Conversely, a concentration of 5 × 10⁻⁵ M was too low to enhance the SERS signals of R6G and CV, possibly because PATP-Ag complexation failed to afford a uniform Ag layer on the Au surface [45,46,47]. At the lowest concentration, PAPT was not sufficient to capture the Ag ions to form the core-shell structures, and then the Ag NPs were formed separately (marked by arrows in Figure 3c). Thus, the optimal 4-PATP concentration of 5 × 10⁻⁴ M was used for the detection of glucose.

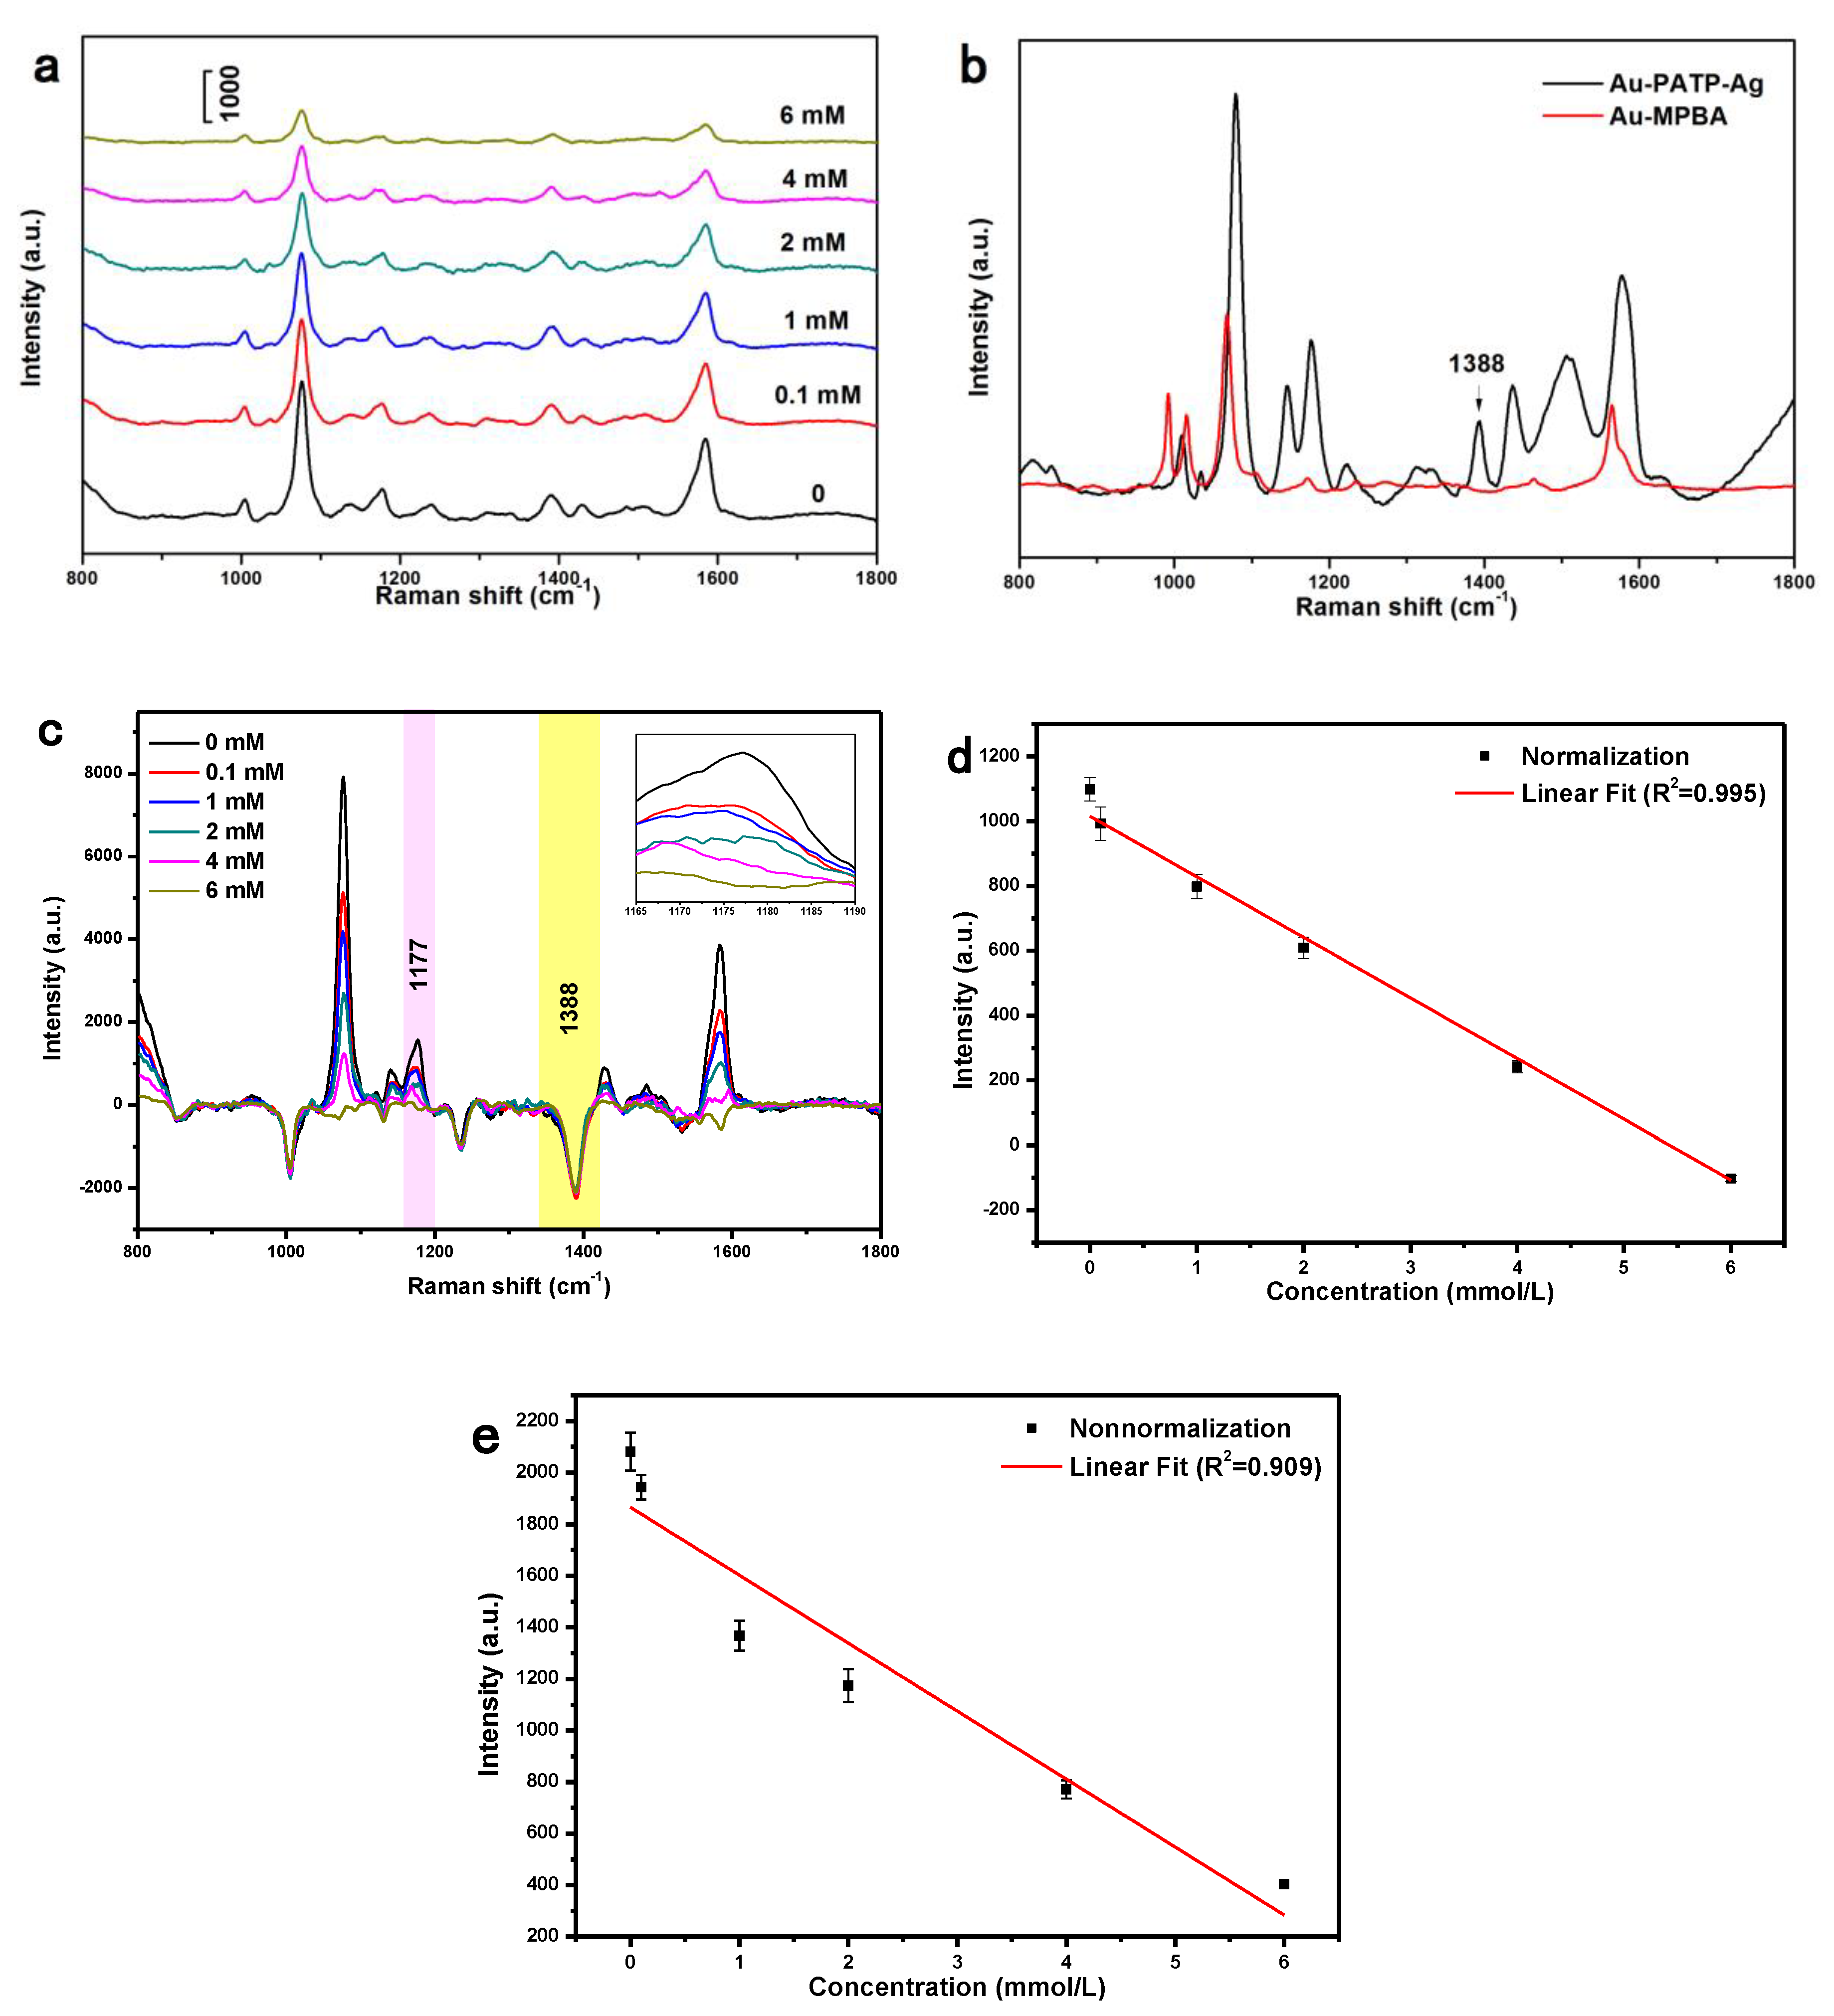
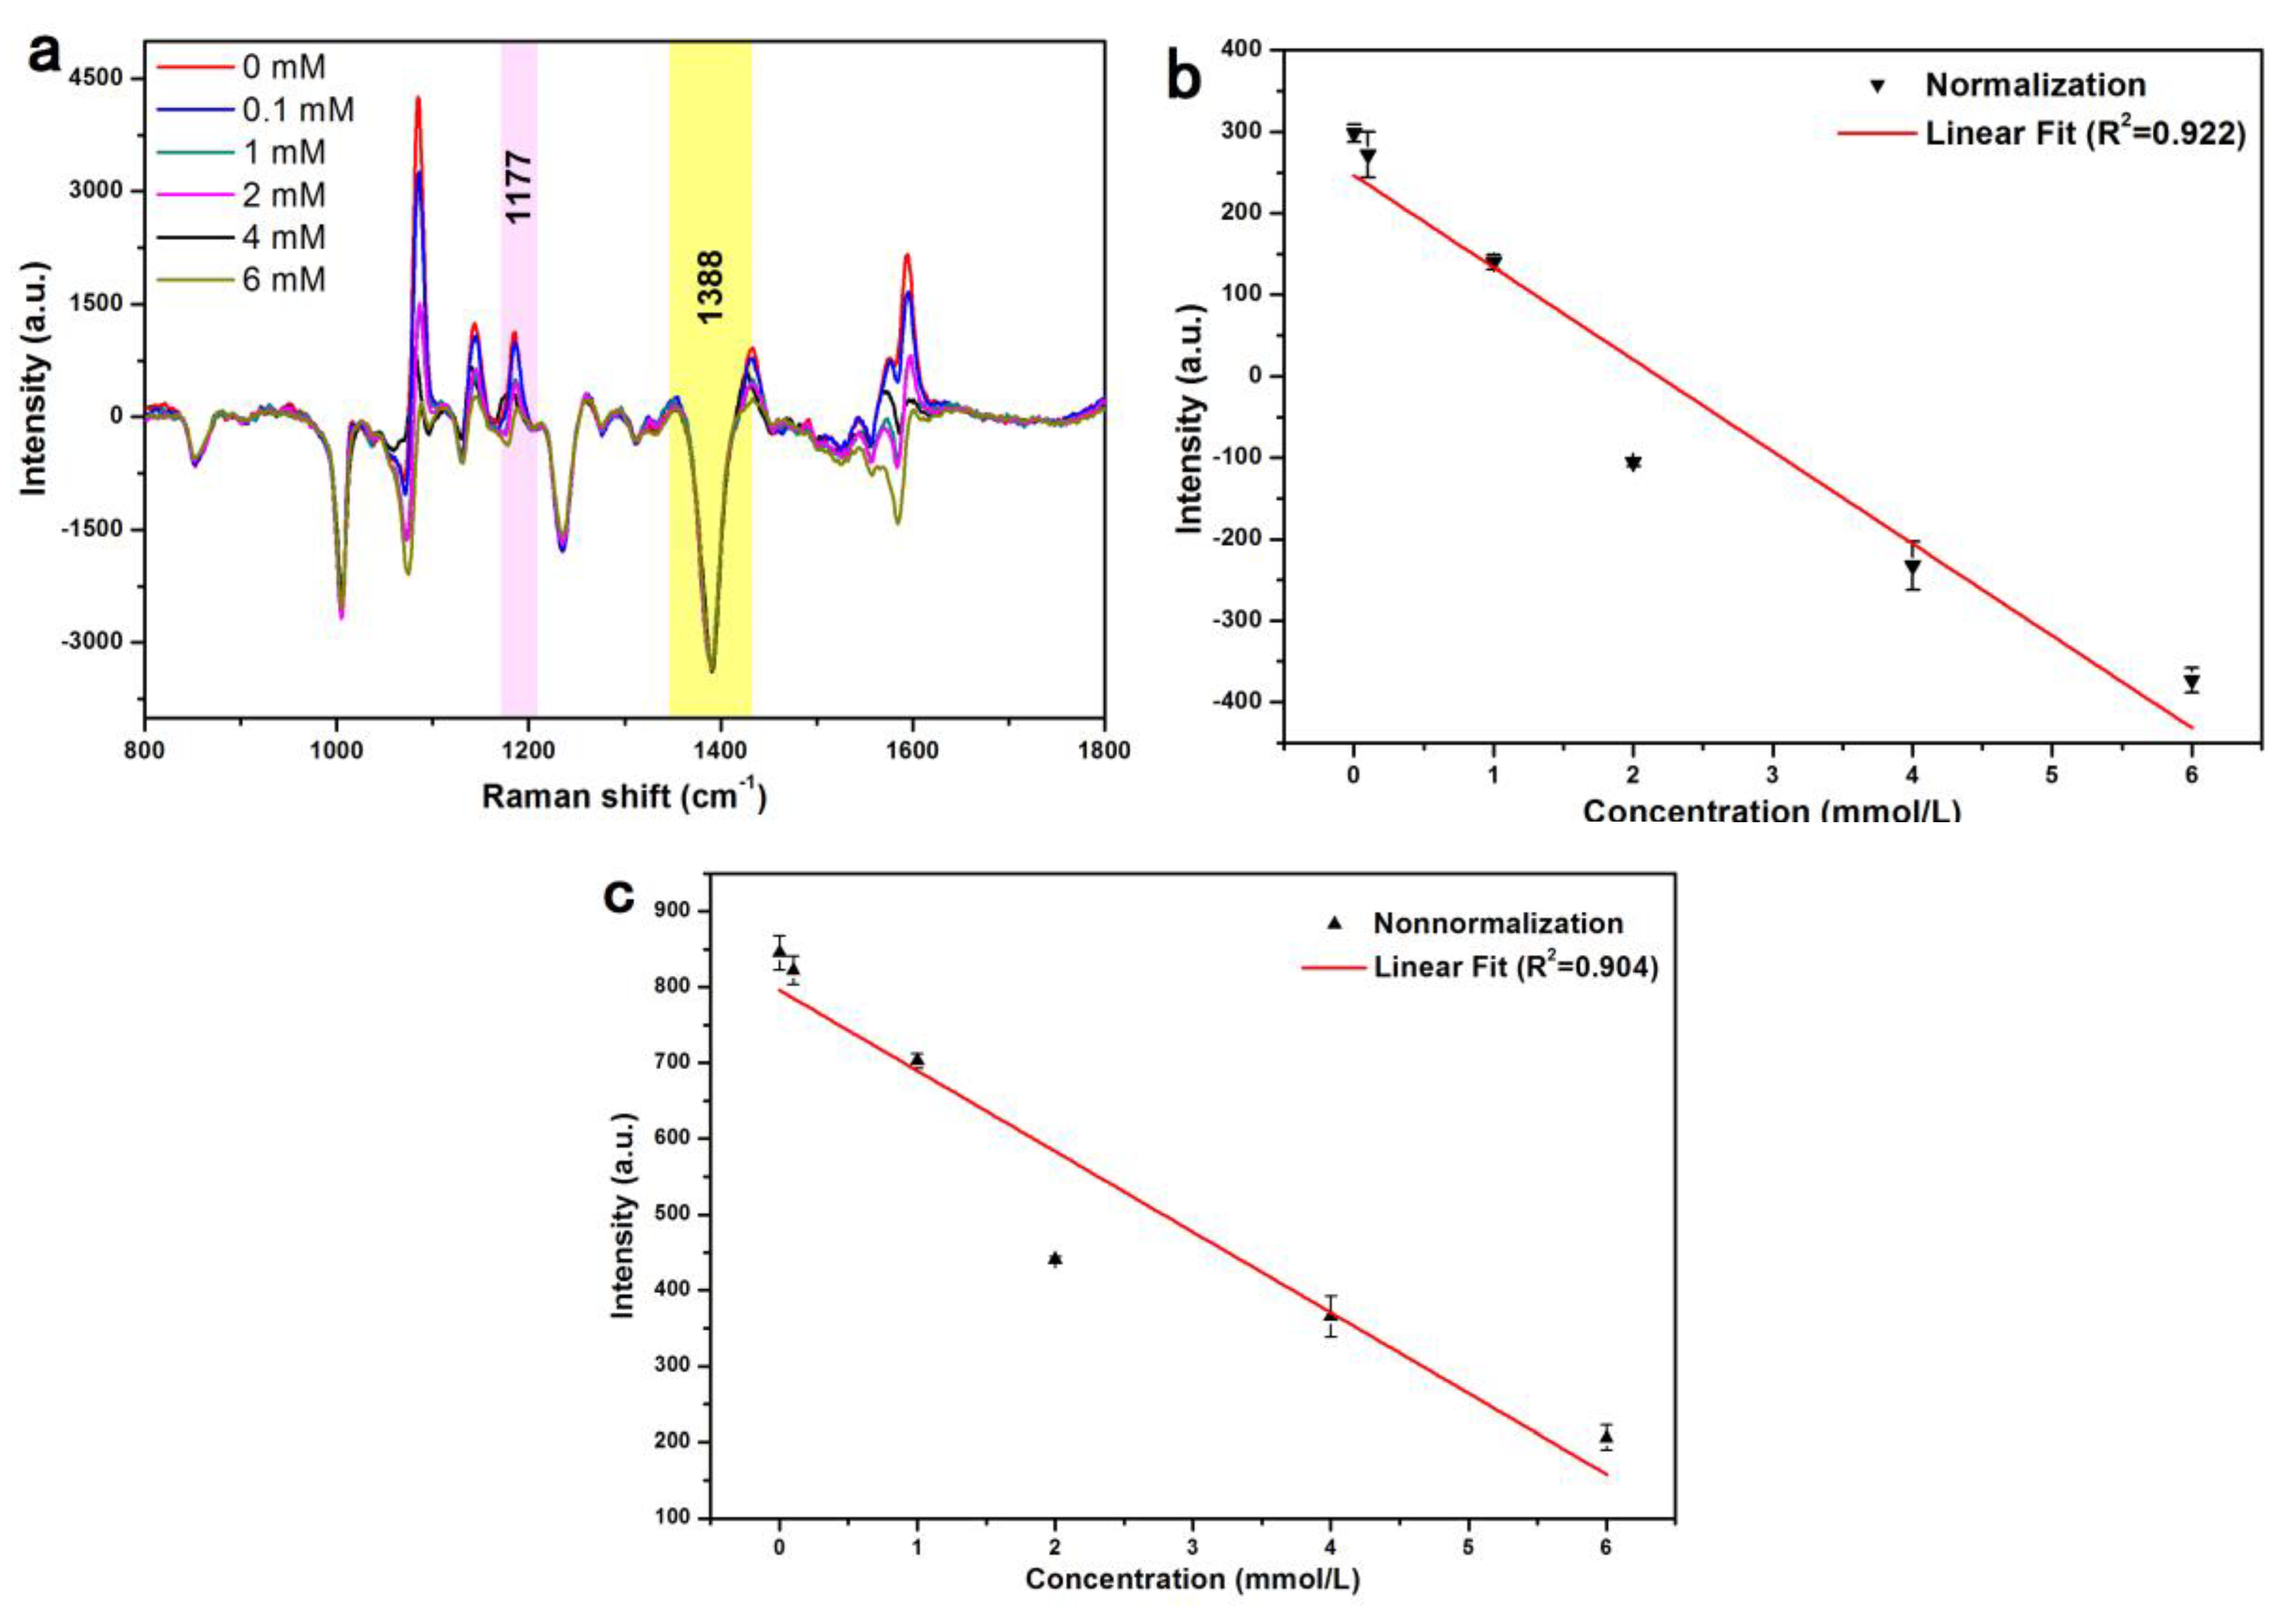
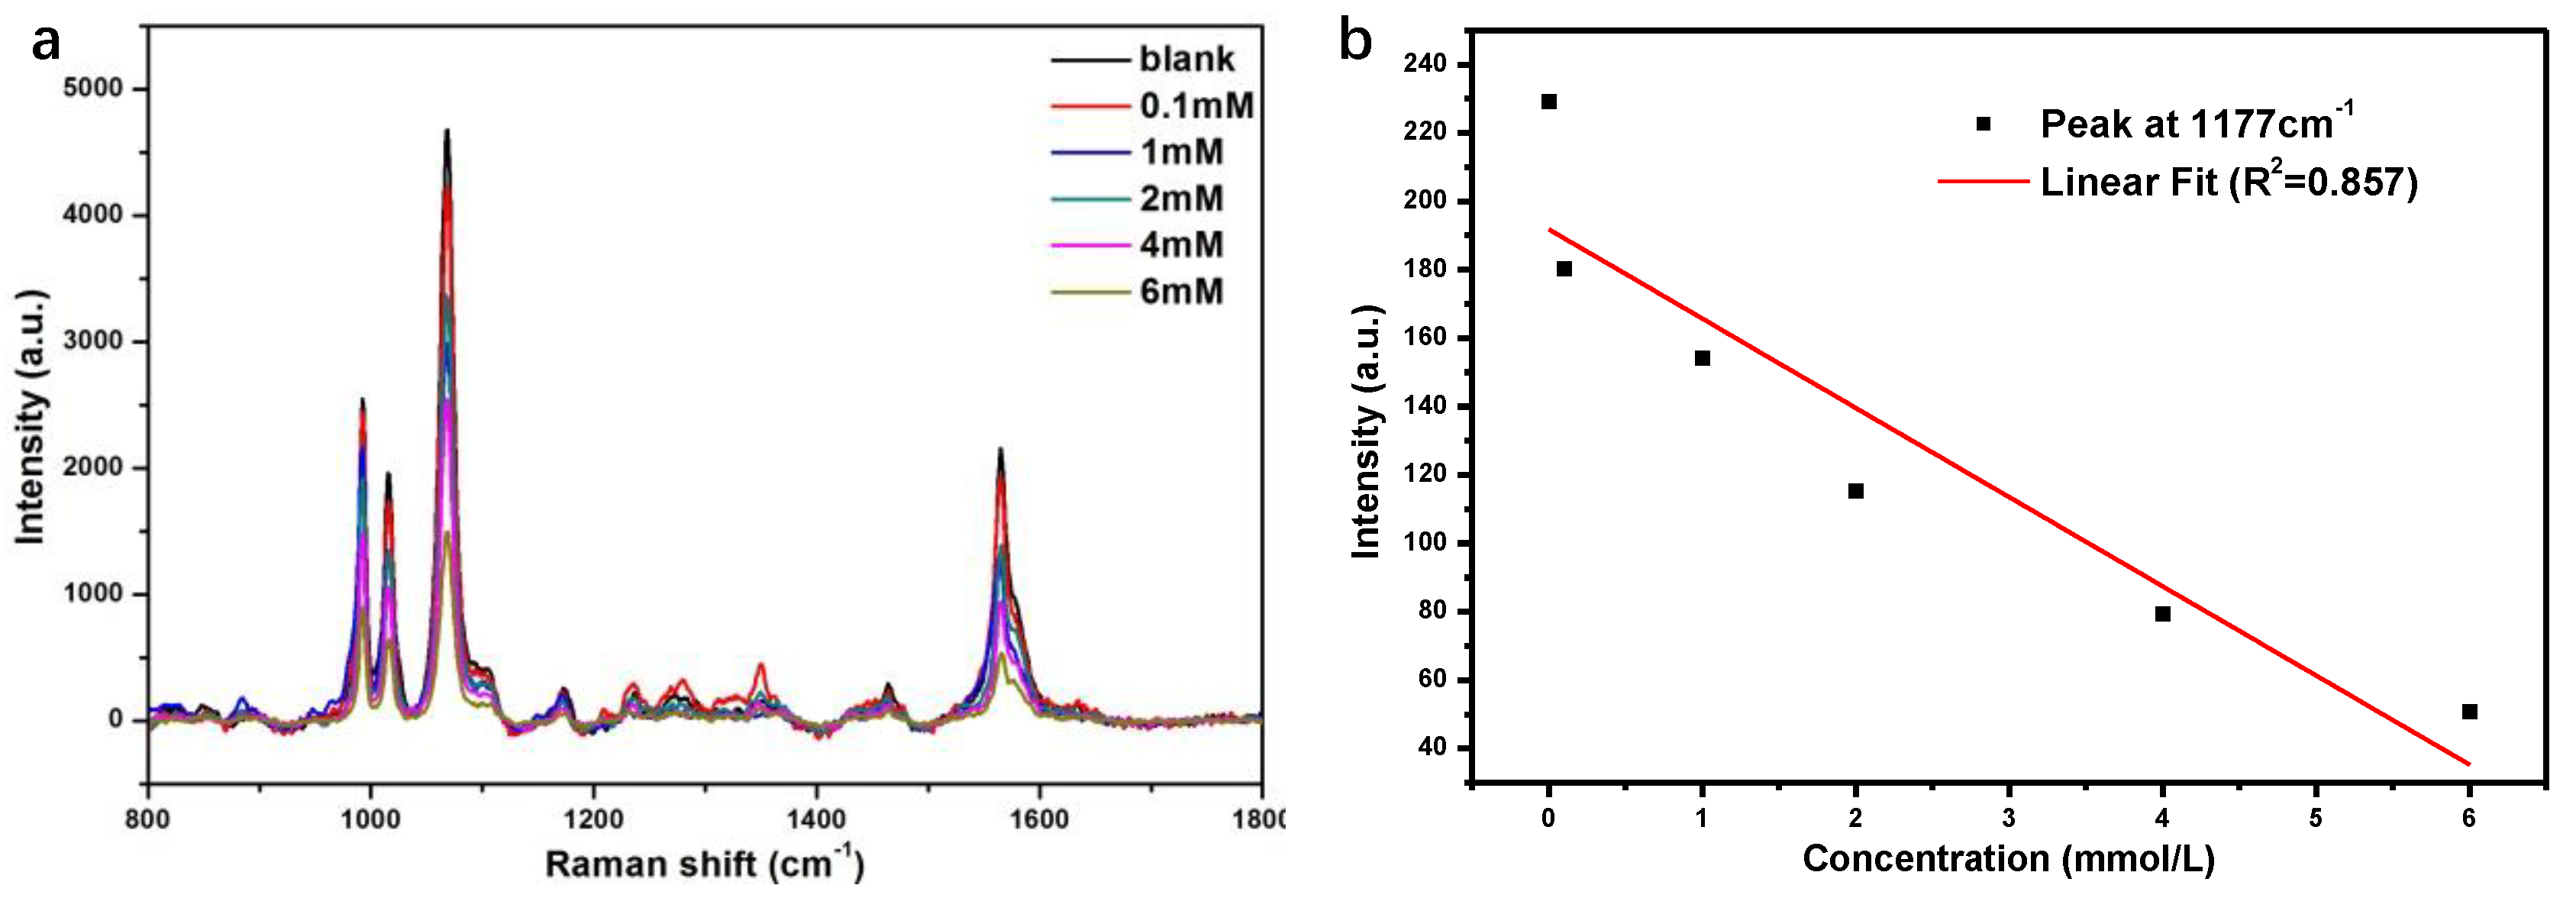
3.3. Detection of Glucose by SERS

The Au@Ag NPs were then functionalized with 4-MPBA, which enabled the specific recognition of glucose via esterification of the –B(OH)2 moiety (Figure 4). Glucose sensing was performed by adding glucose solutions of different concentrations (0.1, 1, 2, 4, and 6 mM) to the colloidal suspensions of as-prepared Au@Ag-MPBA NPs, and the SERS signals of glucose-modified 4-MPBA residues on NPs were recorded after incubation and purification. As shown in Figure 5a, the acquired spectra were dominated by bands at 1077 and 1584 cm−1, assigning to in-plane mode–geared βCCC + γCS and γCC modes, respectively., which are often used to identify the adsorption of 4-MPBA on Ag in the deprotonated form to generate Ag–S bonds. Additionally, the intensities of 4-MPBA SERS peaks at 1004, 1077, 1177, and 1584 cm−1 decreased with increasing glucose concentration [6,48]. The B–OH stretch at 1177 cm−1 was chosen to monitor the binding of glucose with 4-MPBA [49]. Importantly, since the intensity of SERS peaks is influenced by the choice of test points and the surroundings, 4-PATP, commonly regarded as a reporter or aggregator [50,51,52], was herein employed as an internal standard. The band at 1388 cm−1 was chosen as the standard peak of 4-PATP, because this peak was observed only for 4-PATP, but not for 4-MPBA [47,49] (Figure 5b). Subsequently, SERS spectra recorded in the presence of different concentrations of glucose were normalized using the above peak as a benchmark (Figure 5c). After normalization, the intensity of the chosen band (Figure 5d) decreased with the increase in concentration of glucose, and better linearity (Figure 5d, R2 = 0.995) was observed compared to the case when original SERS (Figure 5e, R2 =0.909) was performed. These observations may be attributed to the fact that the core-shell nanostructures can enhance the SERS signals of the internal standard molecules, and the outer silver shell can protect the internal standard material to be influenced or interfered by the environment.

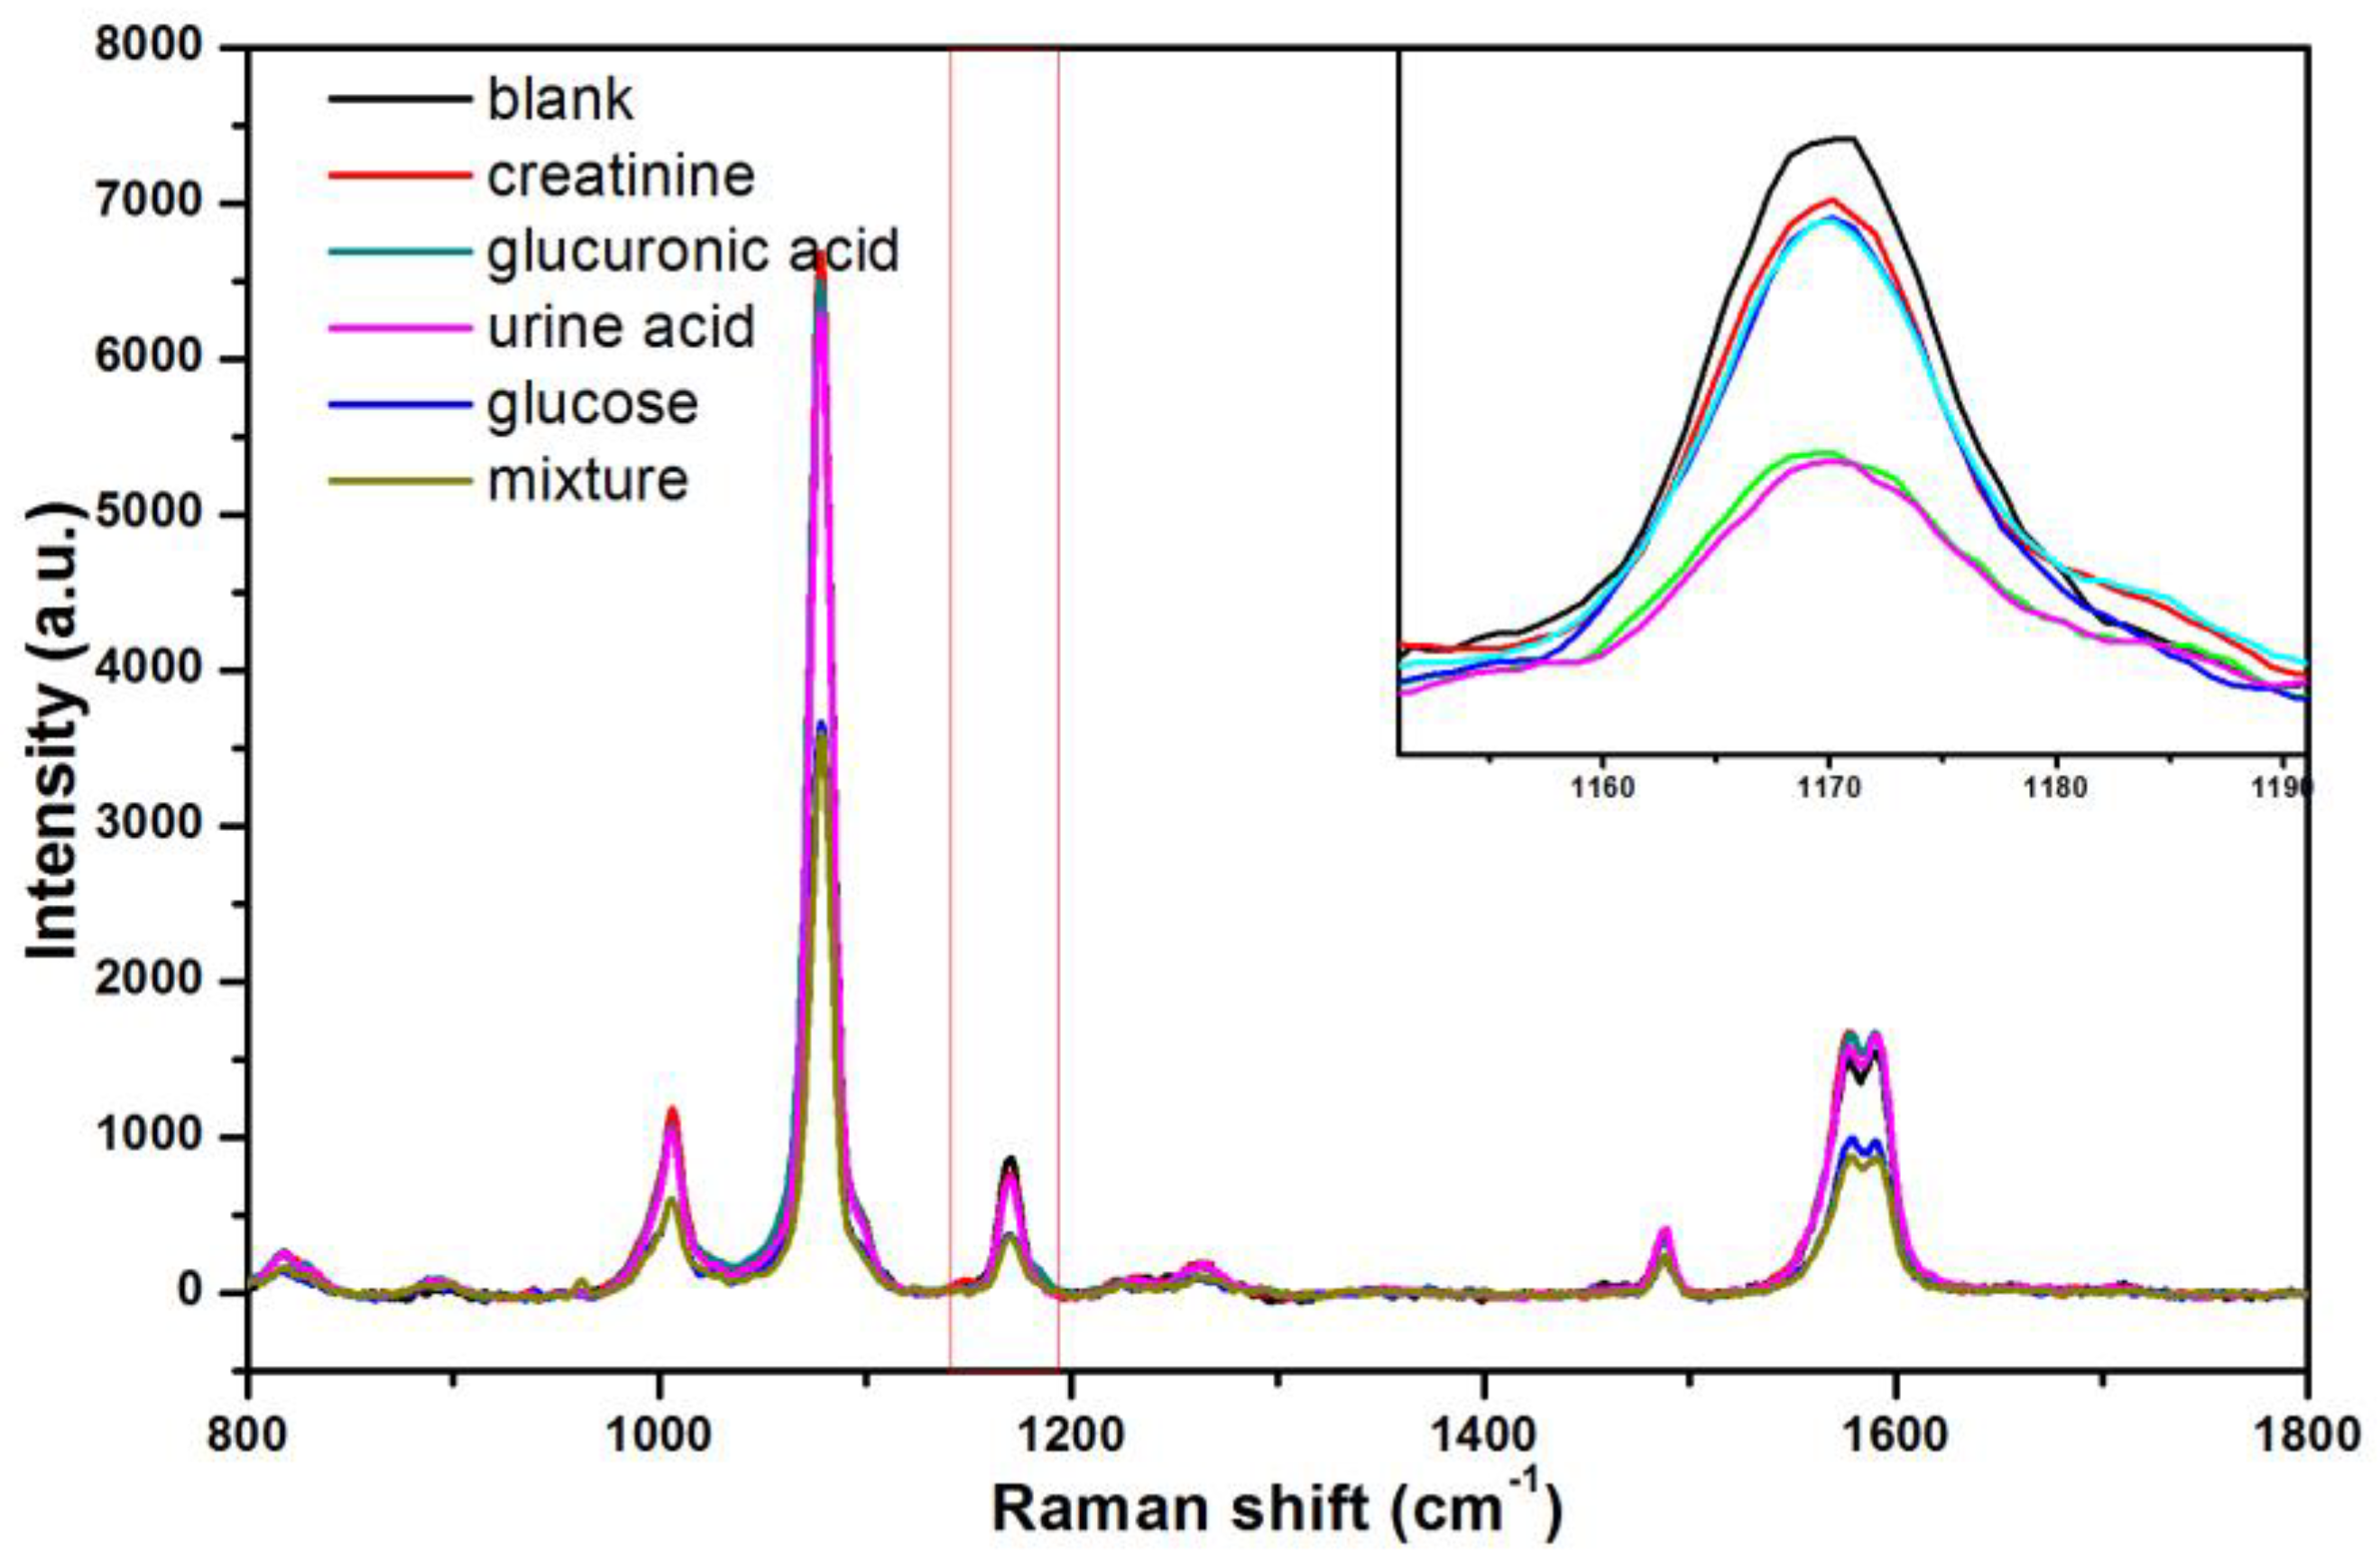
3.4. Detection of Glucose in Urine

To demonstrate the practical applicability, the developed sensor was employed to trace glucose in undiluted urine samples using the standard addition method (Figure 6a). As in the abovementioned case, the quantitative detection was based on the intensity at a specific wavenumber. The band at 1388 cm−1 was chosen as the normalization benchmark, and the response intensity of the 1177 cm−1 peak was shown to exhibit better linearity (R2 = 0.922, Figure 6b) than original spectra (R2 = 0.904, Figure 6c) despite the presence of potential interferences. In order to strengthen the advantage of Au-Ag core-shell structure, we used the pure Ag modified 4-MPBA to do the same test for comparison. As shown in Figure 7, Ag nanoparticles shows the linearity for the Raman intensity at 1177 cm−1-glucose concentration with R2 = 0.857, this is worse than that of Au-PATP-Ag nanoparticles (R2 = 0.922, Figure 6b). The enhanced linear correlation could be ascribed to the particular structure of Au-PATP-Ag. The PATP in the particles behaves not only a linker for the formation of Au@Ag nanostructure, but also as the internal substance, which can significantly impair interference from the environment, resulting in the improvement of the veracity in the quantitative test. The linearity in the range of 0.1–6 mM is relatively good, but the linearity is not satisfactory for the concentration below 0.1 mM, so the limit of detection (LOD) in this study is around 0.1mM. The achieved LOD was comparable to those of reported works as listed in Table 1 [4,10,14,18,19,20,32]. Although our LOD do not reach the state of the art, this method is much simpler and cheaper. Thus, these findings of the effective and accurate determination of glucose in urine samples strongly suggested that the developed glucose nanosensor may be suitable for clinical diagnosis applications.
To check the selectivity of our method, glucose, uric acid, creatinine, D-glucuronic acid solutions and their mixture with same concentration were prepared for SERS measurement in urine. As shown in Figure 8, the urine samples added with glucuronic acid, uric acid, and creatinine exhibit the SERS signals basically similar to the base signal at characteristic peak of 1177 cm−1. However, the glucose can be detected in the urine, and the SERS signal detected in the mixture of four substances is similar to that of the sample with glucose added only. Such observations mean that the method can specifically identify glucose molecules in urine.

4. Conclusions

We developed a new method for synthesizing Au@Ag core-shell NPs with internal standards to achieve enhanced, stable, and reproducible SERS signals by employing 4-PATP residing inside the Au@Ag structure as a coordination-prone Raman reporter. The concentration of 4-PATP influenced the structure of as-prepared NPs, and the optimized concentration was determined of 5 × 10⁻⁴ M. As-prepared Au@Ag NPs were then modified with 4-MPBA and used for quantitative SERS analysis of glucose, with its rapid detection in urine at the concentration as low as 0.1 mM in the presence of other interferents. The strong and specific peaks of the employed internal standard could be used as a benchmark. Moreover, the presence of a shell around 4-PATP reduced the influence of the environment. The described method can potentially be used as a well-defined and easy-to-employ technique for engineering multifunctional SERS-active materials with a wide range of applications for ultrasensitive and quantitative analyte detection.

Author Contributions

Data curation, T.Z., R.Y., Y.W.; Formal analysis, T.Z.; Funding acquisition, L.H. and J.S.; Resources, S.F.; Writing – original draft, Y.L.; Writing – review & editing, Y.L.

Funding

National Natural Science Foundation of China (NO. 61575043), Natural Science Foundation of Fujian Province of China (NO. 2016J01292); (NO. 2018J01720); Production, Learning and Research Project of Fujian Provincial Science and Technology Department (NO. 2017N5007).

Acknowledgments

This work was supported by The Public Service Platform for Industrialization Development Technology of Marine Biological Medicine and Product of State Oceanic Administration, Fujian Normal University, Fuzhou, China, 350117.

Conflicts of Interest

The authors declare that there are no conflicts of interest

References

  1. Danaei, G.; Finucane, M.M.; Lu, Y.; Singh, G.M.; Cowan, M.J.; Paciorek, C.J.; Lin, J.K.; Farzadfar, F.; Khang, Yo.; Stevens, G.A.; et al. National, Regional, and Global Trends in Fasting Plasma Glucose and Diabetes Prevalence since 1980: Systematic Analysis of Health Examination Surveys and Epidemiological Studies with 370 Country-Years and 2·7 Million Participants. Lancet 2011, 378, 31–40. [Google Scholar] [CrossRef]
  2. Bandodkar, A.J.; Jia, W.; Yardımcı, C.; Wang, X.; Ramirez, J.; Wang, J. Tattoo-Based Noninvasive Glucose Monitoring: A Proof-of-Concept Study. Anal. Chem. 2015, 87, 394–398. [Google Scholar] [CrossRef] [PubMed]
  3. Liakat, S.; Bors, K.A.; Xu, L.; Woods, C.M.; Doyle, J.; Gmachl, C.F. Noninvasive in vivo Glucose Sensing on Human Subjects Using Mid-Infrared Light. Biomed. Opt. Express 2014, 5, 2397–2404. [Google Scholar] [CrossRef] [PubMed]
  4. Radhakumary, C.; Sreenivasan, K. Naked Eye Detection of Glucose in Urine Using Glucose Oxidase Immobilized Gold Nanoparticles. Anal. Chem. 2011, 83, 2829–2833. [Google Scholar] [CrossRef] [PubMed]
  5. Bi, X.; Du, X.; Jiang, J.; Huang, X. Facile and Sensitive Glucose Sandwich Assay Using In Situ-Generated Raman Reporters. Anal. Chem. 2015, 87, 2016–2021. [Google Scholar] [CrossRef] [PubMed]
  6. Wallace, G.Q.; Tabatabaei, M.; Zuin, M.S.; Workentin, M.S.; Lagugné-Labarthet, F. A Nanoaggregate-on-Mirror Platform for Molecular and Biomolecular Detection by Surface-Enhanced Raman Spectroscopy. Anal. Bioanal. Chem. 2016, 408, 609–618. [Google Scholar] [CrossRef] [PubMed]
  7. Chen, C.; Xie, Q.; Yang, D.; Xiao, H.; Fu, Y.; Tan, Y.; Yao, S. Recent Advances in Electrochemical Glucose Biosensors: A Review. RSC Adv. 2013, 3, 4473–4491. [Google Scholar] [CrossRef]
  8. Yi, Y.; Deng, J.; Zhang, Y.; Li, H.; Yao, S. Label-Free Si Quantum Dots as Photoluminescence Probes for Glucose Detection. Chem. Commun. 2013, 49, 612–614. [Google Scholar] [CrossRef] [PubMed]
  9. Hu, A.L.; Liu, Y.-H.; Deng, H.-H.; Hong, G.-L.; Liu, A.-L.; Lin, X.-H.; Xia, X.-H.; Chen, W. Fluorescent Hydrogen Peroxide Sensor Based on Cupric Oxide Nanoparticles and Its Application for Glucose and L-Lactate Detection. Biosens. Bioelectron. 2014, 61, 374–378. [Google Scholar] [CrossRef] [PubMed]
  10. Nacht, B.; Larndorfer, C.; Sax, S.; Borisov, S.M.; Hajnsek, M.; Sinner, F.; List-Kratochvil, E.J.W.; Klimant, I. Integrated catheter system for continuous glucose measurement and simultaneous insulin infusion. Biosens. Bioelectron. 2015, 64, 102–110. [Google Scholar] [CrossRef] [PubMed]
  11. He, H.; Xu, X.; Wu, H.; Jin, Y. Enzymatic Plasmonic Engineering of Ag/Au Bimetallic Nanoshells and Their Use for Sensitive Optical Glucose Sensing. Adv. Mater. 2012, 24, 1736–1740. [Google Scholar] [CrossRef] [PubMed]
  12. Lee, S.; Ringstrand, B.S.; Stone, D.A.; Firestone, M.A. Electrochemical Activity of Glucose Oxidase on a Poly(ionic liquid)–Au Nanoparticle Composite. ACS Appl. Mater. Interfaces 2012, 4, 2311–2317. [Google Scholar] [CrossRef] [PubMed]
  13. Boonyasit, Y.; Laiwattanapaisal, W.; Chailapakul, O.; Emnéus, J.; Heiskanen, A.R. Boronate-Modified Interdigitated Electrode Array for Selective Impedance-Based Sensing of Glycated Hemoglobin. Anal. Chem. 2016, 88, 9582–9589. [Google Scholar] [CrossRef] [PubMed]
  14. Jeon, W.-Y.; Choi, Y.-B.; Kim, H.-H. Disposable Non-Enzymatic Glucose Sensors Using Screen-Printed Nickel/Carbon Composites on Indium Tin Oxide Electrodes. Sensors 2015, 15, 31083–31091. [Google Scholar] [CrossRef] [PubMed] [Green Version]
  15. Wang, J. Electrochemical Glucose Biosensors. Chem. Rev. 2008, 108, 814–825. [Google Scholar] [CrossRef] [PubMed]
  16. Heller, A.; Feldman, B. Electrochemical Glucose Sensors and Their Applications in Diabetes Management. Chem. Rev. 2008, 108, 2482–2505. [Google Scholar] [CrossRef] [PubMed] [Green Version]
  17. Baghayeri, M.; Amiri, A.; Farhadi, S. Development of Non-Enzymatic Glucose Sensor Based on Efficient Loading Ag Nanoparticles on Functionalized Carbon Nanotubes. Sens. Actuators B 2016, 225, 354–362. [Google Scholar] [CrossRef]
  18. Karim, M.N.; Anderson, S.R.; Singh, S.; Ramanathan, R.; Bansal, V. Nanostructured silver fabric as a free-standing NanoZyme for colorimetric detection of glucose in urine. Biosens. Bioelectron. 2018, 110, 8–15. [Google Scholar] [CrossRef] [PubMed]
  19. Sun, D.; Qi, G.; Xu, S.; Xu, W. Construction of highly sensitive surface-enhanced Raman scattering (SERS) nanosensor aimed for the testing of glucose in urine. RSC Adv. 2016, 6, 53800–53803. [Google Scholar] [CrossRef]
  20. Chen, Q.; Fu, Y.; Zhang, W.; Ye, S.; Zhang, H.; Xie, F.; Gong, L.; Wei, Z.; Jin, H.; Chen, J. Highly sensitive detection of glucose: A quantitative approach employing nanorods assembled plasmonic substrate. Talanta 2017, 165, 516–521. [Google Scholar] [CrossRef] [PubMed]
  21. Nie, S.; Emory, S.R. Probing Single Molecules and Single Nanoparticles by Surface-Enhanced Raman Scattering. Science 1997, 275, 1102–1106. [Google Scholar] [CrossRef] [PubMed]
  22. Li, J.-F.; Panneerselvam, R.; Tian, Z.-Q. Shell-Isolated Nanoparticle-Enhanced Raman Spectroscopy. Nature 2010, 464, 392–395. [Google Scholar] [CrossRef] [PubMed]
  23. Haynes, C.L.; McFarland, A.D.; van Duyne, R.P. Surface-Enhanced Raman Spectroscopy. Anal. Chem. 2005, 77, 338A–346A. [Google Scholar] [CrossRef]
  24. Shafer-Peltier, K.E.; Haynes, C.L.; Glucksberg, M.R.; van Duyne, R.P. Toward a Glucose Biosensor Based on Surface-Enhanced Raman Scattering. J. Am. Chem. Soc. 2003, 125, 588–593. [Google Scholar] [CrossRef] [PubMed]
  25. Yonzon, C.R.; Haynes, C.L.; Zhang, X.; Walsh, J.T.; van Duyne, R.P. A Glucose Biosensor Based on Surface-Enhanced Raman Scattering:  Improved Partition Layer, Temporal Stability, Reversibility, and Resistance to Serum Protein Interference. Anal. Chem. 2004, 76, 78–85. [Google Scholar] [CrossRef] [PubMed]
  26. Kaminský, J.; Kapitán, J.; Baumruk, V.; Bednárová, L.; Bour, P. Interpretation of Raman and Raman Optical Activity Spectra of a Flexible Sugar Derivative, the Gluconic Acid Anion. J. Phys. Chem. A 2009, 113, 3594–3601. [Google Scholar] [CrossRef] [PubMed] [Green Version]
  27. Cao, Y.C.; Jin, R.; Mirkin, C.A. Nanoparticles with Raman Spectroscopic Fingerprints for DNA and RNA Detection. Science 2002, 297, 1536–1540. [Google Scholar] [CrossRef] [PubMed]
  28. Küstner, B.; Gellner, M.; Schütz, M.; Schöppler, F.; Marx, A.; Ströbel, P.; Adam, P.; Schmuck, C.; Schlücker, S. SERS Labels for Red Laser Excitation: Silica-Encapsulated SAMs on Tunable Gold/Silver Nanoshells. Angew. Chem. Int. Ed. 2009, 48, 1950–1953. [Google Scholar] [CrossRef] [PubMed]
  29. Wang, Z.; Zong, S.; Li, W.; Wang, C.; Xu, S.; Chen, H.; Cui, Y. SERS-Fluorescence Joint Spectral Encoding Using Organic–Metal–QD Hybrid Nanoparticles with a Huge Encoding Capacity for High-Throughput Biodetection: Putting Theory into Practice. J. Am. Chem. Soc. 2012, 134, 2993–3000. [Google Scholar] [CrossRef] [PubMed]
  30. Eggert, H.; Frederiksen, J.; Morin, C.; Norrild, J.C. A New Glucose-Selective Fluorescent Bisboronic Acid. First Report of Strong α-Furanose Complexation in Aqueous Solution at Physiological pH. J. Org. Chem. 1999, 64, 3846–3852. [Google Scholar] [CrossRef]
  31. Yang, W.; He, H.; Drueckhammer, D.G. Computer-Guided Design in Molecular Recognition: Design and Synthesis of a Glucopyranose Receptor. Angew. Chem. Int. Ed. 2001, 40, 1714–1718. [Google Scholar] [CrossRef]
  32. Kong, K.V.; Lam, Z.; Lau, W.K.O.; Leong, W.K.; Olivo, M. A Transition Metal Carbonyl Probe for Use in a Highly Specific and Sensitive SERS-Based Assay for Glucose. J. Am. Chem. Soc. 2013, 135, 18028–18031. [Google Scholar] [CrossRef] [PubMed]
  33. Kong, K.V.; Ho, C.J.H.; Gong, T.; Lau, W.K.O.; Olivo, M. Sensitive SERS Glucose Sensing in Biological Media Using Alkyne Functionalized Boronic Acid on Planar Substrates. Biosens. Bioelectron. 2014, 56, 186–191. [Google Scholar] [CrossRef] [PubMed]
  34. Li, S.Y.; Wang, M. A Novel SERS-Active Tag Based on Bimetallic Flowerlike Au-Ag Nanoparticles. Curr. Nanosci. 2011, 7, 969–978. [Google Scholar] [CrossRef]
  35. Kruss, S.; Srot, V.; van Aken, P.A.; Spatz, J.P. Au–Ag Hybrid Nanoparticle Patterns of Tunable Size and Density on Glass and Polymeric Supports. Langmuir 2012, 28, 1562–1568. [Google Scholar] [CrossRef] [PubMed]
  36. Li, J.; Zhang, G.; Wang, L.; Shen, A.; Hu, J. Simultaneous enzymatic and SERS properties of bifunctional chitosanmodified popcorn-like Au-Ag nanoparticles for high sensitive detection of melamine in milk powder. Talanta 2015, 140, 204–211. [Google Scholar] [CrossRef] [PubMed]
  37. Zhang, Y.; Yang, P.; Muhammed, M.A.H.; Alsaiari, S.K.; Moosa, B.; Almalik, A.; Kumar, A.; Ringe, E.; Khashab, N.M. Tunable and Linker Free Nanogaps in Core–Shell Plasmonic Nanorods for Selective and Quantitative Detection of Circulating Tumor Cells by SERS. ACS Appl. Mater. Interfaces 2017, 9, 37597–37605. [Google Scholar] [CrossRef] [PubMed]
  38. Hu, X.; Wang, T.; Wang, L.; Dong, S. Surface-enhanced Raman scattering of 4-aminothiophenol self-assembled monolayers in sandwich structure with nanoparticle shape dependence: Off-surface plasmon resonance condition. J. Phys. Chem. C 2007, 111, 6962–6969. [Google Scholar] [CrossRef]
  39. Khlebtsov, B.; Khanadeev, V.; Khlebtsov, N. Surface-enhanced Raman scattering inside Au@Ag core/shell nanorods. Nano Research 2016, 9, 2303–2318. [Google Scholar] [CrossRef]
  40. Xu, J.-F.; Luo, S.-Y.; Liu, G.-K. Different Behaviors in the Transformation of PATP Adsorbed on Ag or Au Nanoparticles Investigated by Surface-Enhanced Raman spectroscopy – a Study of the Effects from Laser Energy and Annealing. Spectrochim. Acta, Part A 2005, 143, 35–39. [Google Scholar] [CrossRef] [PubMed]
  41. Sun, Y.; Wiley, B.; Li, Z.-Y.; Xia, Y. Synthesis and Optical Properties of Nanorattles and Multiple-Walled Nanoshells/Nanotubes Made of Metal Alloys. J. Am. Chem. Soc. 2004, 126, 9399–9406. [Google Scholar] [CrossRef] [PubMed]
  42. Sui, H.; Wang, Y.; Zhang, X.; Wang, X.; Cheng, W.; Su, H.; Wang, X.; Sun, X.; Han, X.X.; Zhao, B.; Ozaki, Y. Ultrasensitive Detection of Thyrotropin-Releasing Hormone Based on Azo Coupling and Surface-Enhanced Resonance Raman Spectroscopy. Analyst 2016, 141, 5181–5188. [Google Scholar] [CrossRef] [PubMed]
  43. Sun, X.; Lin, L.; Li, Z.; Zhang, Z.; Feng, J. Novel Ag-Cu substrates for surface-enhanced Raman scattering. Materials Letters 2009, 63, 2306–2308. [Google Scholar] [CrossRef]
  44. Chen, X.; Nguyen, T.H.D.; Gu, L.; Lin, M. Use of Standing Gold Nanorods for Detection of Malachite Green and Crystal Violet in Fish by SERS. J. Food Science. 2017, 82, 1640–1646. [Google Scholar] [CrossRef] [PubMed]
  45. Cardini, G.; Muniz-Miranda, M.; Pagliai, M.; Schettino, V. A Density Functional Study of the SERS Spectra of Pyridine Adsorbed on Silver Clusters. Theor. Chem. Acc. 2007, 117, 451–458. [Google Scholar] [CrossRef]
  46. Richter, A.P.; Lombardi, J.R.; Zhao, B. Size and Wavelength Dependence of the Charge-Transfer Contributions to Surface-Enhanced Raman Spectroscopy in Ag/PATP/ZnO Junctions. J. Phys. Chem. C 2010, 114, 1610–1614. [Google Scholar] [CrossRef]
  47. Xu, J.F.; Liu, G.-K. Laser-Induced Chemical Transformation of PATP Adsorbed on Ag Nanoparticles by Surface-Enhanced Raman Spectroscopy – a Study of the Effects from Surface Morphology of Substrate and Surface Coverage of PATP. Spectrochim. Acta, Part A 2015, 138, 873–877. [Google Scholar] [CrossRef] [PubMed]
  48. Torul, H.; Çiftçi, H.; Çetin, D.; Suludere, Z.; Boyacı, I.H.; Tamer, U. Paper Membrane-Based SERS Platform for the Determination of Glucose in Blood Samples. Anal. Bioanal. Chem. 2015, 407, 8243–8251. [Google Scholar] [CrossRef] [PubMed]
  49. Su, H.; Wang, Y.; Yu, Z.; Liu, Y.; Zhang, X.; Wang, X.; Sui, H.; Sun, C.; Zhao, B. Surface-Enhanced Raman Spectroscopy Study on the Structure Changes of 4-Mercaptophenylboronic Acid under Different pH Conditions. Spectrochim. Acta, Part A 2017, 185, 336–342. [Google Scholar] [CrossRef] [PubMed]
  50. Chen, P.; Wang, Z.; Zong, S.; Chen, H.; Zhu, D.; Zhong, Y.; Cui, Y. A wide range optical pH sensor for living cells using Au@Ag nanoparticles functionalized carbon nanotubes based on SERS signals. Anal. Bioanal. Chem. 2014, 406, 6337–6346. [Google Scholar] [CrossRef] [PubMed]
  51. Wang, C.; Rong, Z.; Wang, J.; Jiang, N.; Pang, Y.; Xiao, R.; Wang, S. Seed-Mediated Synthesis of High-Performance Silver-Coated Magnetic Nanoparticles and Their Use as Effective SERS substrates. Colloids Surf. A 2016, 506, 393–401. [Google Scholar] [CrossRef]
  52. Li, H.; Chen, Q.; Hassan, M.M.; Chen, X.; Ouyang, Q.; Guo, Z.; Zhao, J. A Magnetite/PMAA Nanospheres-Targeting SERS Aptasensor for Tetracycline Sensing Using Mercapto Molecules Embedded Core/Shell Nanoparticles for Signal Amplification. Biosens. Bioelectron. 2017, 92, 192–199. [Google Scholar] [CrossRef] [PubMed]
Figure 1. Synthesis of Au@Ag nanostructures containing an internal Raman standard.
Nanomaterials 08 00629 g001
Figure 2. (a–c) TEM images of core-shell nanoparticles (NPs) modified with 5 × 10⁻⁴ M 4-PATP; (d) UV-vis absorption spectra of Au NPs, Au-PATP NPs, and Au-PATP-Ag NPs colloids, the inset is the photograph of Au NPs, Au-PATP NPs, and Au-PATP-Ag NPs colloids (from left to right); (e) surface-enhanced Raman scattering (SERS) spectra of the metal NPs.
Nanomaterials 08 00629 g002aNanomaterials 08 00629 g002b
Figure 3. (a–c) TEM images of Au@Ag NPs modified with different concentrations of (5 × 10⁻⁵, 5 × 10⁻⁴, and 5 × 10⁻³ M, respectively); (d) the EDX analysis for Au@Ag NPs modified with 5 × 10⁻⁴ M with 4-PATP, (e,f) Raman SERS spectra obtained from R6G and CV with different metal NPs.
Nanomaterials 08 00629 g003aNanomaterials 08 00629 g003b
Figure 4. Synthesis of 4-MPBA–modified Au@Ag NPs for glucose detection.
Nanomaterials 08 00629 g004
Figure 5. (a) Original SERS spectra recorded at different concentrations of glucose; (b) SERS spectra of 4-MPBA–modified Au NPs and Au@Ag NPs; (c) Normalized SERS spectra recorded at different concentrations of glucose, and the inset is the enlarged view of the peak of 1177 cm−1; (de) the working curves of the peak at 1177 cm−1 based on normalized SERS spectra and original SERS spectra.
Nanomaterials 08 00629 g005
Figure 6. (a) Normalized SERS spectra of Au@Ag NPs recorded in the presence of different glucose levels in urine (b) the working curve for the peak at 1177 cm−1 based on normalized SERS spectra, (c) the working curve of the peak at 1177 cm−1 based on original SERS spectra.
Nanomaterials 08 00629 g006
Figure 7. (a) The SERS spectra of different concentration glucose detected by using MPBA-modified Ag nanoparticles; (b) the linear correlation of Raman peak intensity at 1177 cm−1 and the concentration of glucose.
Nanomaterials 08 00629 g007
Figure 8. SERS spectrum of glucose, uric acid, glucuronic acid, creatinine solutions, and their mixture with same concentration (10−3 M).
Nanomaterials 08 00629 g008
Table 1. Comparison of sensing performance for different detection methods.
Limit of Detection (LOD)Detection MethodDetection SelectivityReferences
0.1 mMSERS with Au@Ag NPs modified with internal standardUrine, Creatinine, Uric acid, Glucuronic acidThis work
0.56 mMNaked eye detection using glucose oxidaseCreatinine, Cysteine[4]
0.11 mMNear-infrared (NIR)Blood[10]
1 mMelectrochemical methodUric acid, Ascorbic acid[14]
0.1 mMSERS with Ag@Fabric NanoZymesUrine[18]
1 mMSERS with Au NPs substrateUrine[19]
10 nMSERS with nanorods assembled substrateGalactose, Fructose[20]
5.1 mMSERS substrate with metal carbonyl probeUrine[32]

