Article

Anti-Agglomeration Behavior and Sensing Assay of Chlorsulfuron Based on Acetamiprid-Gold Nanoparticles

1
Key Laboratory of Vegetables Quality and Safety Control, Ministry of Agriculture and Rural Affairs of China, Institute of Vegetables and Flowers, Chinese Academy of Agricultural Sciences, Beijing 100081, China
2
College of Life Sciences and Engineering, Hebei University of Engineering, Handan 056021, China
3
Institute of Quality Standard and Testing Technology for Agro Products, Chinese Academy of Agricultural Sciences, Key Laboratory of Agrifood Safety and Quality, Ministry of Agriculture and Rural Affairs of China, Beijing 100081, China
*
Author to whom correspondence should be addressed.
Nanomaterials 2018, 8(7), 499; https://doi.org/10.3390/nano8070499
Submission received: 19 June 2018 / Revised: 3 July 2018 / Accepted: 3 July 2018 / Published: 6 July 2018

Abstract

:
Monitoring of low levels of chlorsulfuron in environmental water samples is important. Although several detection methods have been developed, they all have some drawbacks, such as being time-consuming, requiring expensive instruments and experienced operators, and consuming large volumes of organic solvents. There is an urgent need for a simple, rapid, and inexpensive detection method for chlorsulfuron. Herein, such a method was developed using anti-aggregation of gold nanoparticles (AuNPs) in the presence of acetamiprid in agricultural irrigation water samples. Aggregation of the AuNPs was induced by acetamiprid, and this produced a distinct color change from Bordeaux red to blue. However, the strong hydrogen bonding interaction between chlorsulfuron and acetamiprid could inhibit AuNP aggregation. The effect of chlorsulfuron on the anti-agglomeration behavior of AuNPs was monitored by ultraviolet–visiblespectroscopy (UV-Vis) and the naked eye over a concentration range 0.1–100 mg/L. The detection limit for chlorsulfuron was 0.025 mg/L (signal-to-noise ratio of three). This colorimetric method was successfully applied to the determination of chlorsulfuron in spiked tap water and agricultural irrigation water with satisfactory recoveries (76.3%–94.2%).

1. Introduction

Sulfonylurea pesticides, an efficient class of herbicides, are commonly used for weed control in many crops [1]. Chlorsulfuron was the first sulfonylurea herbicide available commercially, and had been widely applied to control grass and broadleaf weeds [2]. Because chlorsulfuron is persistent and tends to migrate in soil and water, residues can be found in rivers and well water, which may harm agricultural crops through irrigation, and even humans and animals through drinking water [3]. Consequently, it is important to establish a simple, rapid, and highly sensitive method to monitor low levels of chlorsulfuron in environmental water samples.
Several analytical methods have been developed for chlorsulfuron analysis, mainly using gas chromatography [4], gas chromatography coupled to mass spectrometry [5], high performance liquid chromatography [6,7], high performance liquid chromatography coupled to mass spectrometry [8], fluorescent chemosensors [9], capillary electrophoresis [10], and immunosensors [11]. Although these analytical methods have high sensitivity and selectivity, they also have some drawbacks, such as being time-consuming, requiring expensive instruments and experienced operators, and consuming large volumes of organic solvents [12,13]. Consequently, a simple, rapid, inexpensive, and highly sensitive analytical method to determine trace amounts of chlorsulfuron in environmental water samples is required.
Gold nanoparticles (AuNPs) have attracted attention in many research areas because of their unique chemical, optical, and electronic properties [14,15]. Their strong surface plasmon resonance endows them with good signal generation and transduction. Many analytical strategies have been developed using AuNPs as signal recognition and transmission units with electrochemistry, fluorescence, bioassay, and colorimetry techniques [16,17,18]. Among these techniques, colorimetric assays based on the aggregation of AuNPs have been widely used for monitoring various pesticide residues, such as atrazine [19,20], triadimenol [21], imidacloprid [22], and dithiocarbamate [23]. However, the aggregation process could be induced by many interferences, and be affected by complex matrices. Recently, many colorimetric sensors based on the anti-aggregation of AuNPs have been developed to enhance the sensitivity and selectivity, and to avoid false positives or incorrect results [24,25,26]. Few studies have exploited anti-aggregation principles to develop an AuNPs-colorimetric assay for chlorsulfuron. Our group has designed the colorimetric sensor to determine the presence of metsulfuron-methyl based on the anti-aggregation of melamine-AuNPs. Although the colorimetric sensor could be used to detect trace amounts of metsulfuron-methyl residues in water samples, the sensor shows instability and poor selectivity because of the high reactivity of melamine molecules. Acetamiprid could induce AuNPs to aggregate and exhibit low reactivity with many interfering substances, which makes it a perfect candidate as the modified molecule in the anti-aggregation process [27].
Inspired by anti-aggregation colorimetry, our aim was to establish a simple and sensitive colorimetric assay based on the anti-agglomeration behavior of AuNPs for chlorsulfuron detection in environmental water samples. The aggregation of AuNPs was induced by acetamiprid, and was accompanied by a color change from Bordeaux red to blue. However, strong hydrogen bonding interactions between chlorsulfuron and acetamiprid could inhibit the aggregation of AuNPs, and induce a color shift from blue to red. The changes in absorption spectra could be recorded using an ultraviolet–visiblespectroscopy (UV-Vis) spectrophotometry, and color changes could be observed by the naked eye.

2. Materials and Methods

2.1. Chemicals and Apparatus

Chlorsulfuron, acetamiprid, atrazine, and hexazinone were bought from Sigma-Aldrich (St. Louis, MO, USA). NaCl, MgCl2, glucose, l-cysteine, and vitamin C were obtained from Aladdin Industrial Corporation (Shanghai, China). Chloroauric acid (HAuCl4) was purchased from Sinopharm Chemical Reagent Co., Ltd. (Shanghai, China). All other reagents were of analytical reagent grade.
UV-Vis absorption spectra were recorded on a NanoDrop One© spectrophotometer (Thermo ScientificManufacturer, City, Country, Waltham, MA USA). Transmission electron microscopy was performed using a JEM-200CX transmission electron microscope (TEM, JEOL, Tokyo, Japan). A Fourier transform infrared spectrometer (FT-IR-8400, Shimadzu, Kyoto, Japan) was used to record Fourier transform infrared spectra.

2.2. Synthesis of AuNPs

According to the literature [28,29], AuNPs were prepared by a reduction reaction between citrate and HAuCl4. All glassware was soaked in aqua regia (VHCl/VHNO3 = 3:1), and then cleaned with ultrapure water. HAuCl4 aqueous solution (1 mM, 150 mL) was heated at 100 °C for 30 min with vigorous stirring. Trisodium citrate solution (38.8 mM, 150 mL) was then added to the HAuCl4 aqueous solution, and the mixture was heated at 100 °C for another 15 min. The color of the solution changed from light yellow to Bordeaux red. After cooling to room temperature, the solution was filtered through a 0.22 µm syringe filter (Millipore, Billerica, MA, USA). The resulting suspension was stored at 4 °C until it was required for use.

2.3. Colorimetric Assay

Typically, 0.2 mL of AuNP solution was mixed with 0.2 mL of acetate buffer solution (10 mM, pH 3.5) and the mixture was incubated for 5 min. Chlorsulfuron (0.2 mL) solutions with different concentrations (0.1, 0.2, 0.5, 1.0, 2.0, 5.0, 10.0, 20.0, 50.0, and 100.0 mg/L) were added, and the solution was incubated for another 5 min. Next, acetamiprid solution (0.1 mL) was added and the final mixture was equilibrated for 20 min. UV-Vis spectra were recorded over the wavelength range 400–750 nm and the color change was observed by both the naked eye and a camera. The change in the absorbance at 523 nm (ΔA523) was used to determine the concentration of chlorsulfuron. Some common potential interfering substances, such as atrazine, hexazinone, glucose, l-cysteine, vitamin C, Na+, and Mg2+ were used to investigate the selectivity of this colorimetric method at 5, 10, and 20 mg/L.

2.4. Sample Pretreatment

Ethylenediaminetetraacetic acid (EDTA) was added to the tap water and environmental water samples to a final concentration of 1 mM to remove any heavy metal ions. Then, the solution was filtered through a 0.2 µm syringe filter (Millipore). The prepared suspension was spiked with standard solutions at concentrations of 0.5, 1.0, and 5.0 mg/L. Finally, the colorimetric method was used to determine the chlorsulfuron concentration.

3. Results and Discussion

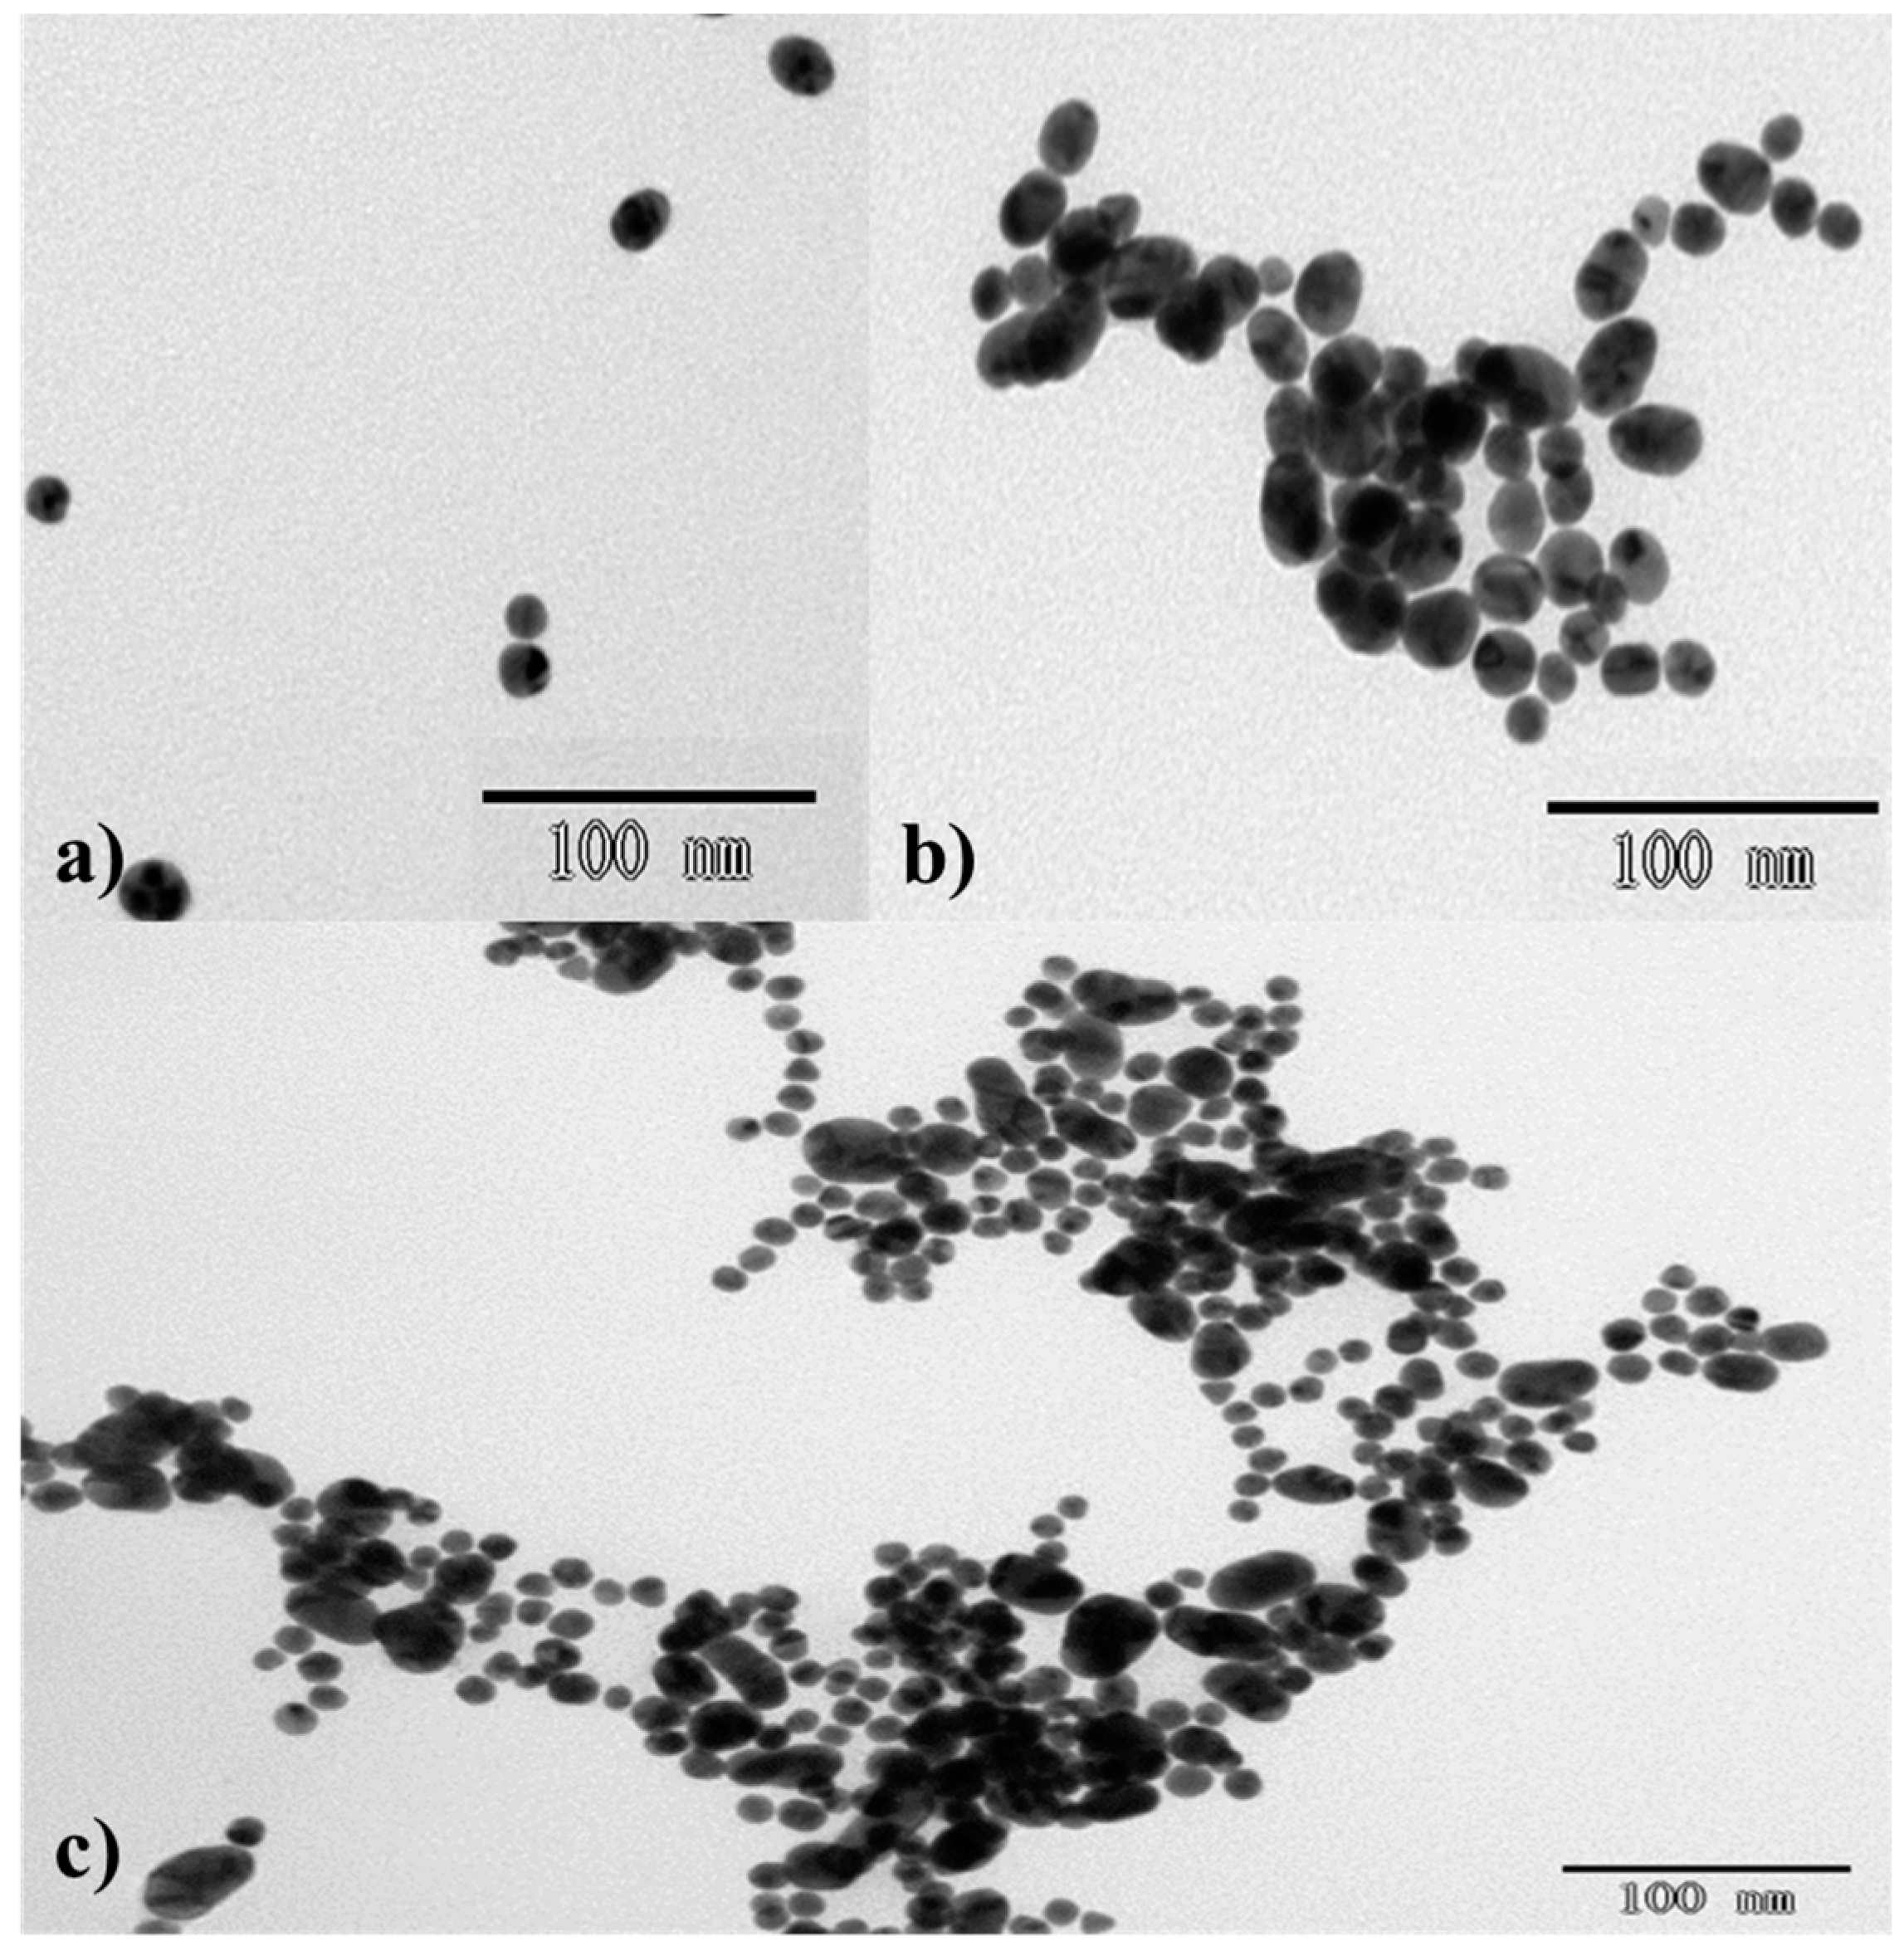
3.1. Characterization

Surface plasma resonance absorbance spectra were recorded for AuNPs, AuNPs with 2.0 mg/L chlorsulfuron, AuNPs with 20 mg/L acetamiprid, and AuNPs with 2.0 mg/L chlorsulfuron and 20 mg/L acetamiprid (Figure 1). The AuNPs were red and exhibited strong surface plasmon resonance absorption at about 523 nm. In the presence of chlorsulfuron, the color of the AuNPs was Bordeaux red. After adding 0.1 mL of 20 mg/L acetamiprid to the AuNPs solution, the intensity of the surface plasmon resonance absorption at 523 nm decreased, a new absorption band appeared at 640 nm, and the color changed from Bordeaux red to blue. These results indicated that aggregation of the AuNPs was induced by acetamiprid. However, when chlorsulfuron solutions with different concentrations were added to the AuNPs solution before mixing with acetamiprid, the aggregation of AuNPs induced by acetamiprid was inhibited and the color changed from blue to red.
The sizes and morphologies of the AuNPs, AuNPs with 20 mg/L acetamiprid, and AuNPs with 2.0 mg/L chlorsulfuron and 20 mg/L acetamiprid were investigated by transmission electron microscopy (Figure 2). Both the AuNPs and AuNPs with chlorsulfuron were monodisperse, with an AuNP average diameter of about 13 nm. This indicated that chlorsulfuron could not induce AuNP aggregation. In the presence of only acetamiprid, bulk random aggregations of AuNPs were observed. Fewer and smaller aggregates were observed than for AuNPs with 2.0 mg/L acetamiprid (Figure 2b,c), suggesting that formation of a complex between chlorsulfuron and acetamiprid prevented the AuNP aggregation.
Fourier transform infrared spectroscopy was used to study the hydrogen bonding interactions between chlorsulfuron and acetamiprid (Figure 3). The spectrum of chlorsulfuron showed adsorption peaks for –R-SO2– at 1364 cm−1 and 1714 cm−1 and a stretching band for –NH– at 1566 cm−1. From the spectrum of acetamiprid, the typical peaks observed at 2230 and 1600 cm−1 were attributed to the C≡N and C=N groups, respectively. By comparing the spectra of chlorsulfuron, acetamiprid and a complex of chlorsulfuron and acetamiprid, we observed the intensities of both stretching vibrations of the C=N group in acetamiprid and –R-SO2– in chlorsulfuron decreased, and the characteristic peak for–NH– in chlorsulfuron shifted. This indicated that hydrogen bonding interactions formed between chlorsulfuron and acetamiprid.

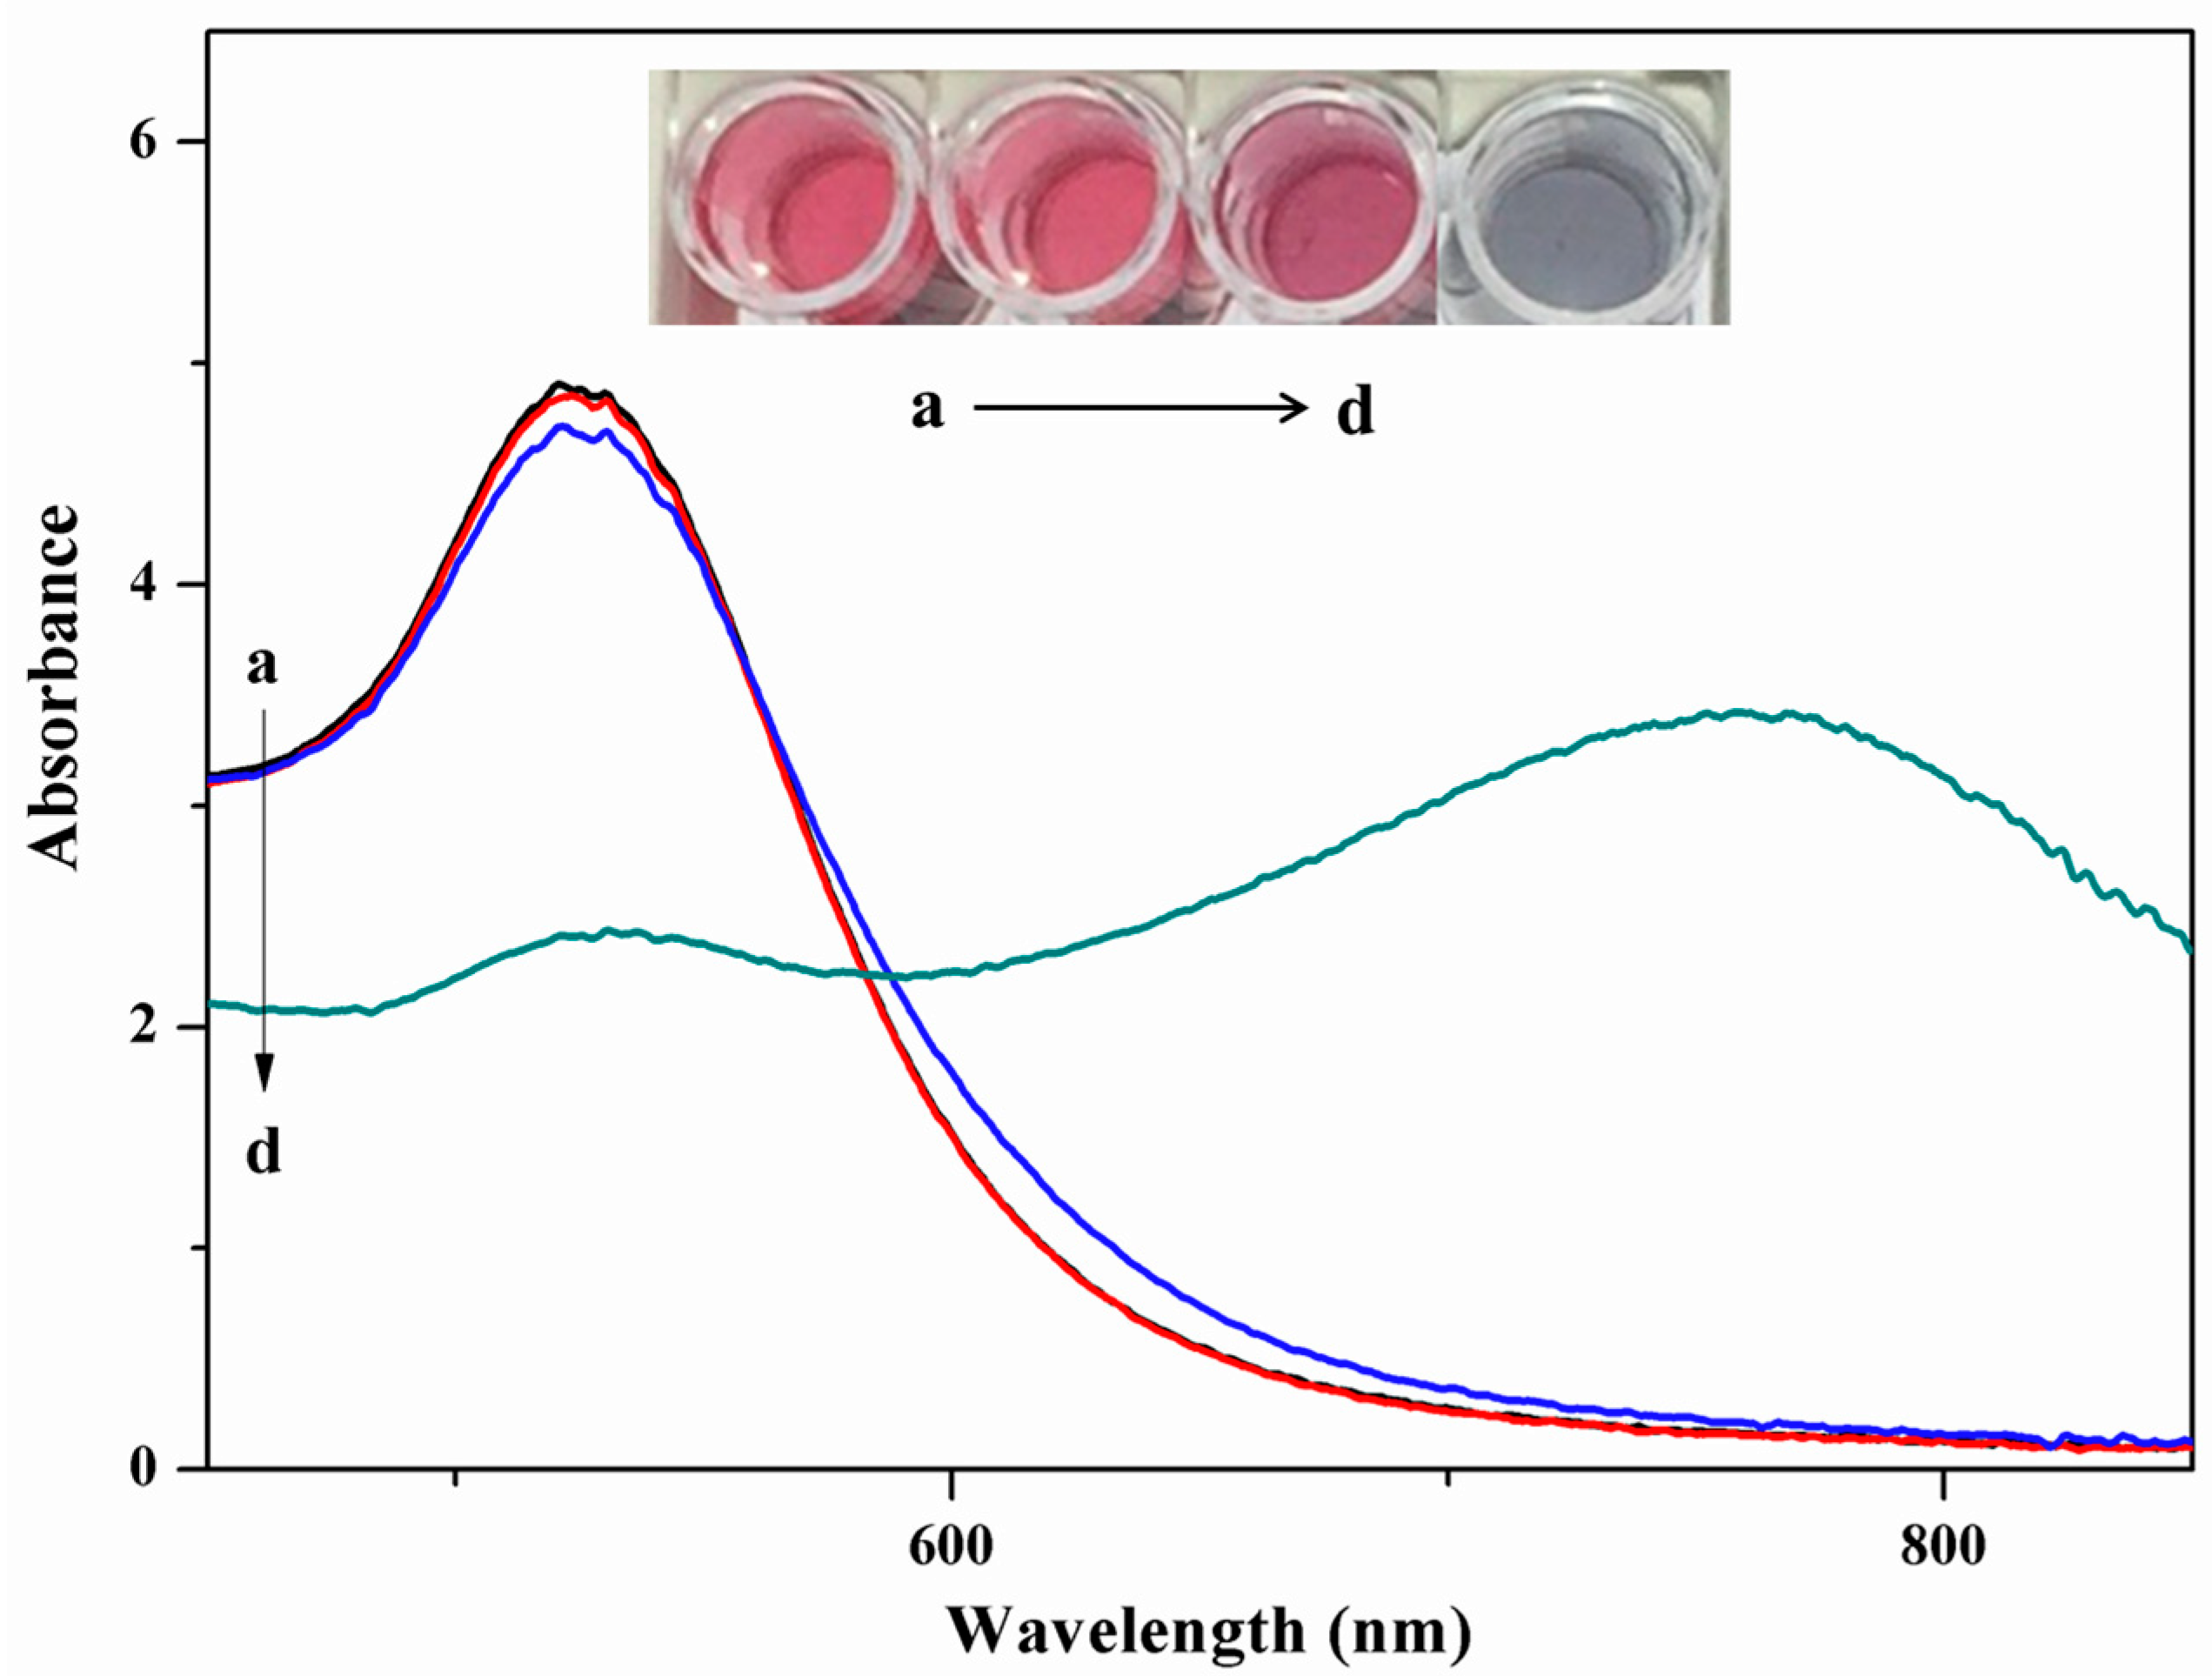
3.2. Colorimetric Sensing Mechanism

Figure 4 illustrates the colorimetric sensing scheme for chlorsulfuron detection based on the anti-aggregation of AuNPs. The AuNPs solution was wine colored with a strong surface plasmon resonance (SPR) absorption peak at about 523 nm. The aggregation of AuNPs was induced by acetamiprid with an accompanying distinct color change from Bordeaux red to blue. However, strong hydrogen bonding interactions between chlorsulfuron and acetamiprid could inhibit the aggregation of AuNPs. In this sensing system, acetamiprid was used as the aggregation reagent and chlorsulfuron acted as an anti-aggregation reagent. The change in absorbance at 523 nm was linearly related to the change in the chlorsulfuron concentration. Thus, the concentration of chlorsulfuron could be monitored by a UV-Vis spectrophotometer, or even qualitatively by the naked eye.

3.3. Optimization of the Method

Because detection with this colorimetric assay relies on the intensity of the change in color of the solution, it is important to optimize the critical parameters such as the acetamiprid concentration, buffer pH, and contact time, to establish the best analytical conditions.

3.3.1. Effect of the Acetamiprid Concentration

To increase the sensitivity of this colorimetric method, an appropriate concentration of acetamiprid needs to be selected to induce AuNP aggregation. The effect of the concentration of acetamiprid on aggregation in the presence of AuNPs and chlorsulfuron was investigated (Figure 5a). An increase in the acetamiprid concentration could cause an increase in the change in absorbance in the presence of different chlorsulfuron concentrations (10–50 mg/L). When the acetamiprid concentration was increased to over 20 mg/L, excess acetamiprid induced too much AuNP aggregation, and this decreased the response of this system in the presence of low chlorsulfuron concentrations. When the acetamiprid concentration was below 12.5 ppm, the response in the presence of high chlorsulfuron concentrations became less sensitive. Therefore, 20 mg/L was chosen as the appropriate acetamiprid concentration for further reactions.

3.3.2. Effect of pH

The pH of the reaction solution will also strongly affect the sensitivity of this sensing system. The effects of different acetate buffer pH values (3.0–6.5) on AuNP anti-aggregation were investigated (Figure 5b). When the pH was below 4.5, the AuNPs more readily aggregated, and the anti-aggregation performance of chlorsulfuron was reduced. When the pH was above 4.5, the response became less sensitive, and this narrowed the linear range of the colorimetric sensing system. Based on above results, pH 4.5 was selected for use in subsequent experiments.

3.4. Colorimetric Sensing of Chlorsulfuron
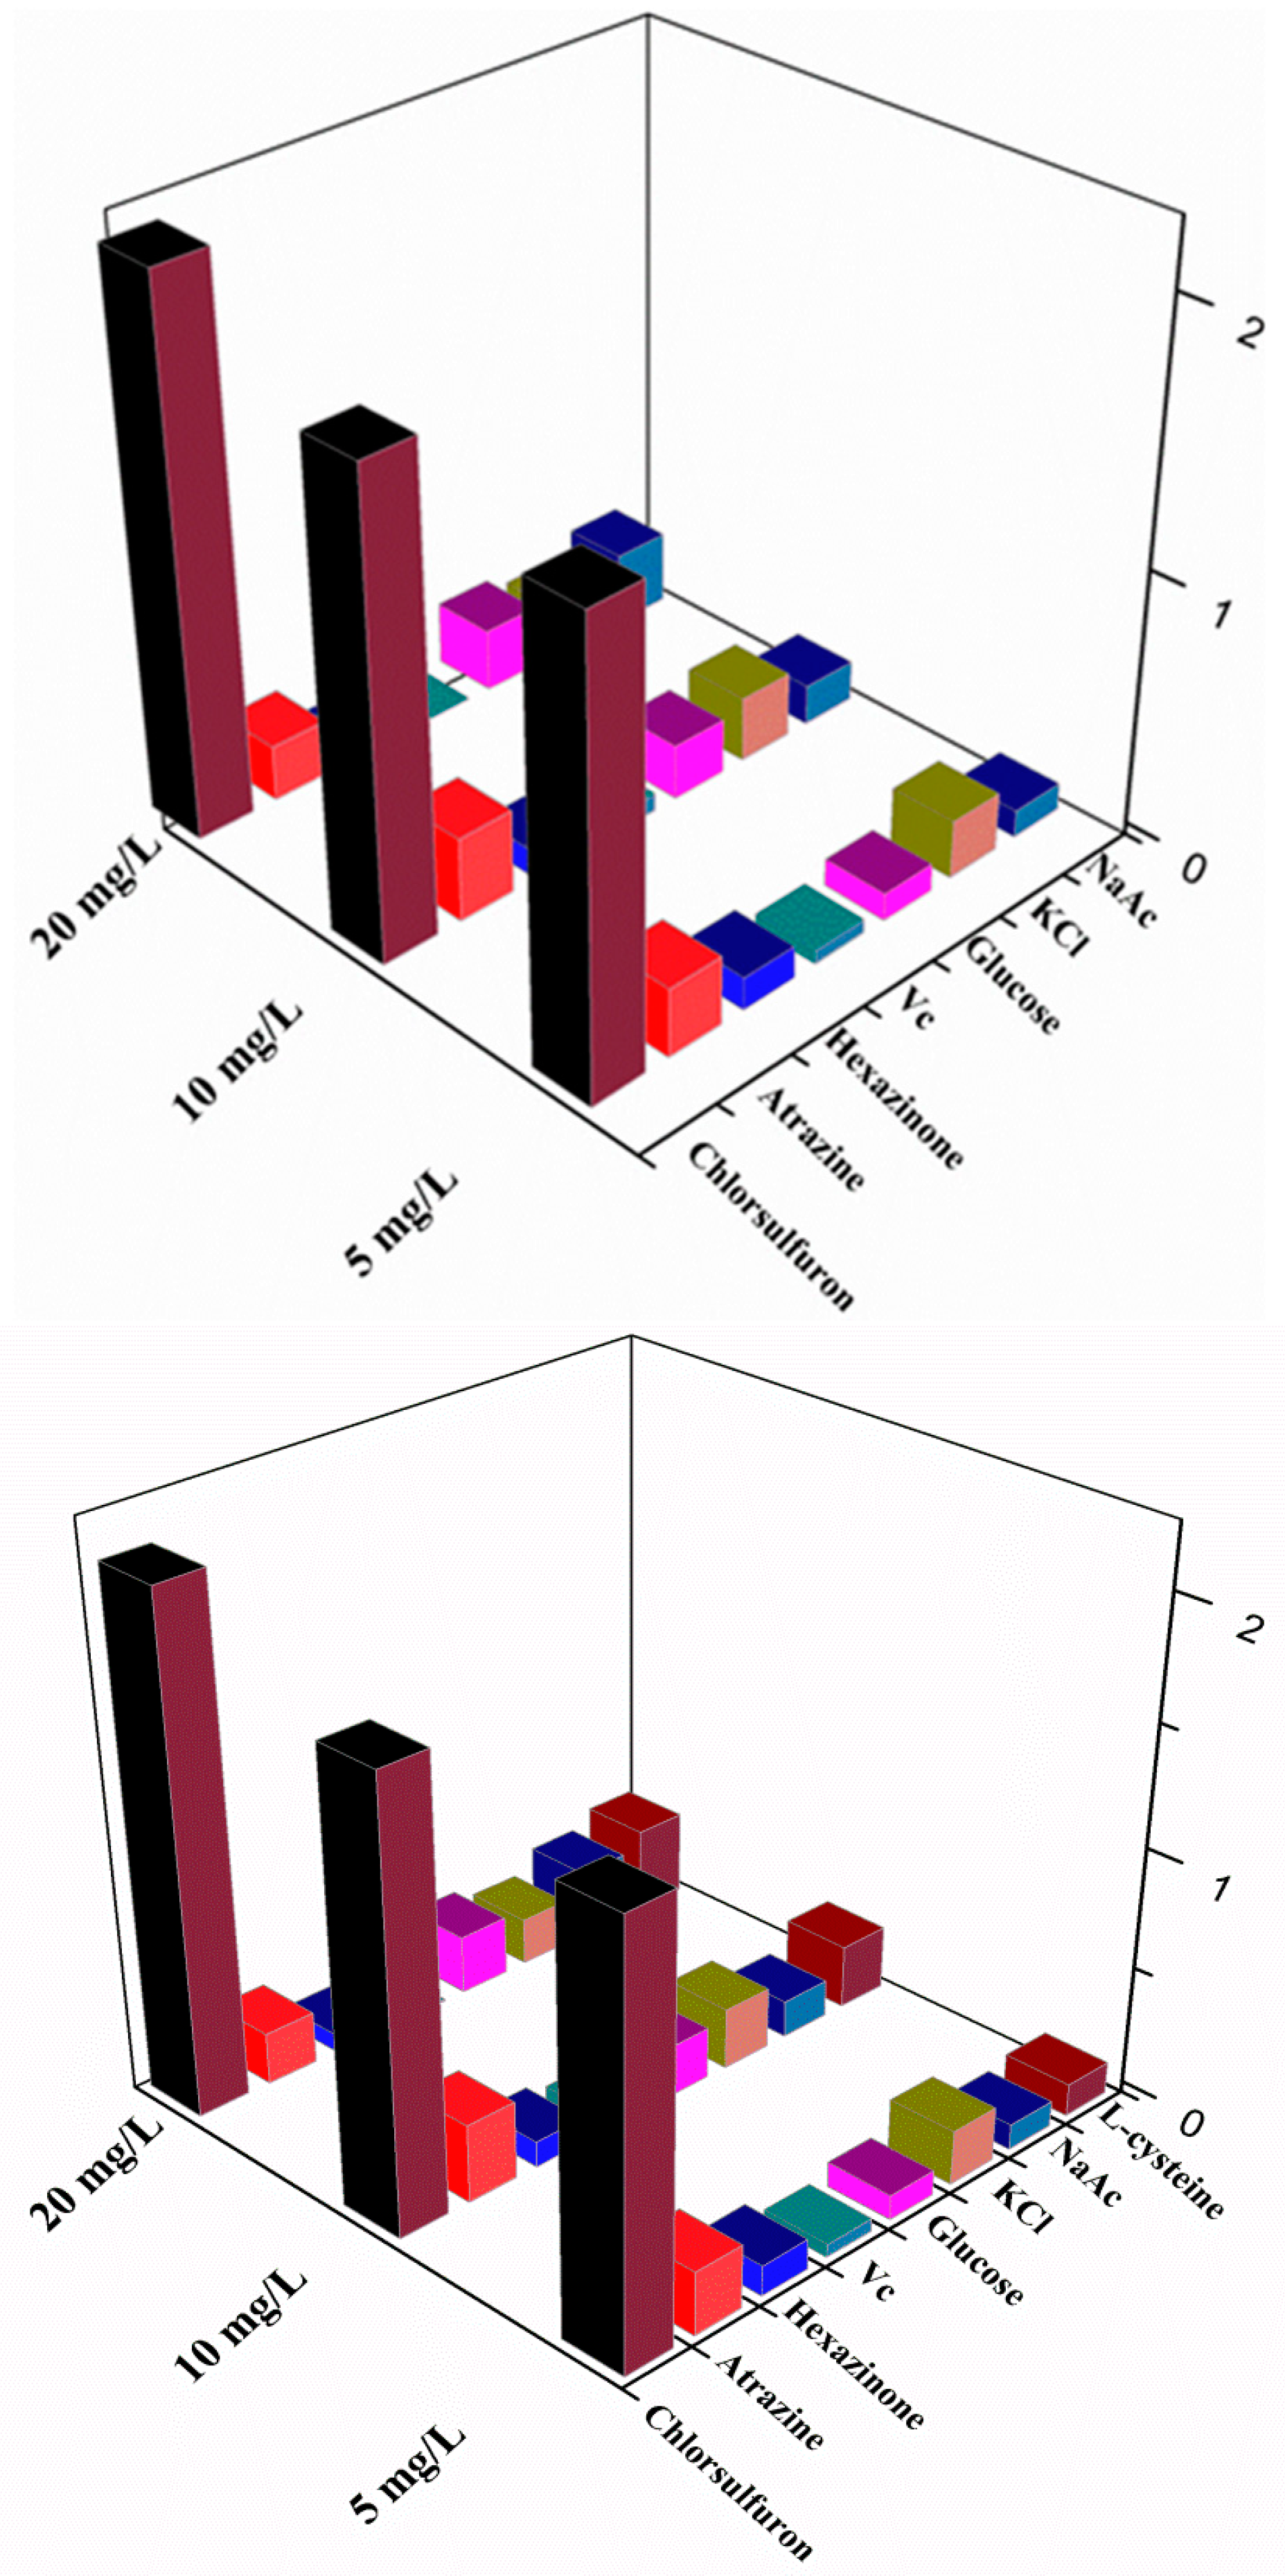
To determine the sensitivity and linear range of this anti-aggregation sensing strategy, solutions with different chlorsulfuron concentrations (0.1–100 mg/L) were added to the reaction solution under the optimized conditions. The intensity of the absorption peak at 640 nm decreased and the intensity of the surface plasmon resonance absorption of AuNPs at 523 nm increased (Figure 6a). An obvious color change from blue (purple) to Bordeaux red occurred.
In addition, the linearity was evaluated with different chlorsulfuron concentrations using the equation ΔA523 = AblankAsample, where Ablank is the absorbance recorded at 523 nm without any chlorsulfuron, and Asample is the absorbance recorded at 523 nm with chlorsulfuron. The analytical signals (ΔA523) were linearly related to the logarithm of different chlorsulfuron concentrations (0.1–100 mg/L). The calibration curve of ΔA523 versus chlorsulfuron concentration (Figure 6b) gave a linear relationship (y = 0.732x + 1.03), with a correlation coefficient (R2) of 0.987. For a signal-to-noise ratio of three, the limit of detection was 0.025 mg/L. The analytical performance of this colorimetric sensing method was compared with other chlorsulfuron detection methods (Table 1). Compared with other methods, the colorimetric assay established in this work is simpler, more rapid, and more economical, with no need for sophisticated instruments or time-consuming treatment procedures.

3.5. Selectivity

To assess the selectivity of this method for chlorsulfuron, the analytical signals of some common potential interfering substances (atrazine, hexazinone, glucose, l-cysteine, vitamin C, Na+, and Mg2+) were determined at 5, 10, and 20 mg/L. No obvious signal changes were observed in the presence of atrazine, hexazinone, glucose, l-cysteine, vitamin C, Na+, and Mg2+ (Figure 7). Only chlorsulfuron showed anti-aggregation and prevented a color change of the AuNPs from Bordeaux red to blue. However, heavy metal ions such as Pb2+ and Hg2+ could induce aggregation of AuNPs in a similar manner to acetamiprid, which would affect the quantitative analysis of chlorsulfuron. Consequently, it is very important to use EDTA to remove heavy metal ions from agricultural irrigation water samples before analysis using the developed method.

3.6. Application to Agricultural Irrigation Water Samples

The analytical performance of this colorimetric sensing system in a practical application was tested. Tap water, river water, and well water samples were treated with 1 mM EDTA and then spiked with standard solutions. Next, the chlorsulfuron concentrations were determined using the developed method. The recoveries of 0.5, 1.0, and 5.0 mg/L chlorsulfuron from the spiked environmental water samples ranged from 76.3% to 94.2%, and the relative standard deviations ranged from 3.62% to 7.34% (Table 2). These results suggest that the developed colorimetric assay could be used to monitor chlorsulfuron in environmental water samples.

4. Conclusions

A simple, rapid, and sensitive colorimetric detection method was developed for chlorsulfuron in agricultural irrigation water based on the anti-aggregation of AuNPs. The aggregation of AuNPs was induced by acetamiprid with an accompanying distinct color change from Bordeaux red to blue. However, strong hydrogen bonding between chlorsulfuron and acetamiprid could inhibit AuNP aggregation. The analytical signals (ΔA523) were linearly related to the logarithms of the chlorsulfuron concentrations (0.1–100 mg/L). The detection limit of chlorsulfuron was 0.025 mg/L (signal-to-noise ratio of 3). In addition, this colorimetric sensing assay was simple and rapid, without the need for any sophisticated instruments or complex experimental steps. The high sensitivity and good recoveries achieved indicate the colorimetric method may be used to monitor chlorsulfuron residues in environmental water samples.

Author Contributions

D.X. designed the experiments, G.L. analyzed the data and wrote the manuscript; R.Z. performed the experiments and L.L. processed the data; X.H., T.L., M.L. and J.W. discussed the results. All authors have contributed substantially to this work.

Funding

This research was funded by the National Natural Science Foundation of China (No. 31701695), the project of risk assessment on vegetable products (GJFP2018002) and the Basic Funds for Research and Development of Chinese Academy of Agriculture Sciences (Y2018PT25).

Conflicts of Interest

The authors declare no conflict of interest. The funders had no role in the design of the study; in the collection, analyses, or interpretation of data; in the writing of the manuscript, and in the decision to publish the results.

References

  1. Cara, I.-G.; Rusu, B.-G.; Raus, L.; Jitareanu, G. Sorption potential of alkaline treated straw and a soil for sulfonylurea herbicide removal from aqueous solutions: An environmental management strategy. Chemosphere 2017, 186, 360–366. [Google Scholar] [CrossRef] [PubMed]
  2. Souza, F.L.; Sáez, C.; Lanza, M.R.V.; Cañizares, P.; Rodrigo, M.A. Removal of chlorsulfuron and 2,4-D from spiked soil using reversible electrokinetic adsorption barriers. Purif. Technol. 2017, 178, 147–153. [Google Scholar] [CrossRef]
  3. Alesso, M.; Escudero, L.A.; Talio, M.C.; Fernández, L.P. Monitoring of chlorsulfuron in biological fluids and water samples by molecular fluorescence using rhodamine B as fluorophore. Talanta 2016, 160, 431–436. [Google Scholar] [CrossRef] [PubMed]
  4. Berrada, H.; Font, G.; Moltó, J.C. Influence of the solvent on the gas chromatographic behaviour of urea herbicides. Chromatographia 2001, 54, 253–262. [Google Scholar] [CrossRef]
  5. Kiljanek, T.; Niewiadowska, A.; Semeniuk, S.; Gaweł, M.; Borzęcka, M.; Posyniak, A. Multi-residue method for the determination of pesticides and pesticide metabolites in honeybees by liquid and gas chromatography coupled with tandem mass spectrometry-Honeybee poisoning incidents. J. Chromatogr. A 2016, 1435, 100–114. [Google Scholar] [CrossRef] [PubMed]
  6. Tadeo, J.L.; Sánchez-Brunete, C.; Pérez, R.A.; Fernández, M.D. Analysis of herbicide residues in cereals, fruits and vegetables. J. Chromatogr. A 2000, 882, 175–191. [Google Scholar] [CrossRef]
  7. Bernal, J.L.; Jime´nez, J.J.; Atienza, J. Determination of chlorsulfuron and tribenuron-methyl residues in agricultural soils. J. Chromatogr. A 1997, 778, 119–125. [Google Scholar] [CrossRef]
  8. Yan, C.; Zhang, B.; Liu, W.; Feng, F.; Zhao, Y.; Du, H. Rapid determination of sixteen sulfonylurea herbicides in surface water by solid phase extraction cleanup and ultra-high-pressure liquid chromatography coupled with tandem mass spectrometry. J. Chromatogr. B 2011, 879, 3484–3489. [Google Scholar] [CrossRef] [PubMed]
  9. Eremin, S.A.; Ryabova, I.A.; Yakovleva, J.N.; Yazynina, E.V.; Zherdev, A.V.; Dzantiev, B.B. Development of a rapid, specific fluorescence polarization immunoassay for the herbicide chlorsulfuron. Anal. Chim. Acta 2002, 468, 229–236. [Google Scholar] [CrossRef]
  10. Springer, V.H.; Lista, A.G. A simple and fast method for chlorsulfuron and metsulfuron methyl determination in water samples using multiwalled carbon nanotubes (MWCNTs) and capillary electrophoresis. Talanta 2010, 83, 126–129. [Google Scholar] [CrossRef] [PubMed]
  11. Nangia, Y.; Bhalla, V.; Kumar, B.; Suri, C.R. Electrochemical stripping voltammetry of gold ions for development of ultra-sensitive immunoassay for chlorsulfuron. Electrochem. Commun. 2012, 14, 51–54. [Google Scholar] [CrossRef]
  12. Coly, A.; Aaron, J.-J. Sensitive and rapid flow injection analysis of sulfonylurea herbicides in water with micellar-enhanced photochemically induced fluorescence detection. Anal. Chim. Acta 1999, 392, 255–264. [Google Scholar] [CrossRef]
  13. Ma, J.; Jiang, L.; Wu, G.; Xia, Y.; Lu, W.; Li, J.; Chen, L. Determination of six sulfonylurea herbicides in environmental water samples by magnetic solid-phase extraction using multi-walled carbon nanotubes as adsorbents coupled with high-performance liquid chromatography. J. Chromatogr. A 2016, 1466, 12–20. [Google Scholar] [CrossRef] [PubMed] [Green Version]
  14. Fusco, G.; Gallo, F.; Tortolini, C.; Bollella, P.; Ietto, F.; De Mico, A.; D’Annibale, S.; Antiochia, R.; Favero, G.; Mazzei, F. AuNPs-functionalized PANABA-MWCNTs nanocomposite-based impedimetric immunosensor for 2,4-dichlorophenoxy acetic acid detection. Biosens. Bioelectron. 2017, 93, 52–56. [Google Scholar] [CrossRef] [PubMed]
  15. Tan, L.; Chen, Z.; Zhang, C.; Wei, X.; Lou, T.; Zhao, Y. Colorimetric Detection of Hg2+ Based on the Growth of Aptamer-Coated AuNPs: The Effect of Prolonging Aptamer Strands. Small 2017, 13, 1603370. [Google Scholar] [CrossRef] [PubMed]
  16. Chen, N.; Liu, H.; Zhang, Y.; Zhou, Z.; Fan, W.; Yu, G.; Shen, Z.; Wu, A. A colorimetric sensor based on citrate-stabilized AuNPs for rapid pesticide residue detection of terbuthylazine and dimethoate. Sens. Actuat. B 2018, 255, 3093–3101. [Google Scholar] [CrossRef]
  17. Lu, S.; Wang, S.; Chen, C.; Sun, J.; Yang, X. Enzyme-free aptamer/AuNPs-based fluorometric and colorimetric dual-mode detection for ATP. Sens. Actuat. B 2018, 265, 67–74. [Google Scholar] [CrossRef]
  18. Dong, H.; Zou, F.; Li, H.; Zhu, H.; Koh, K.; Yin, Y.; Chen, H. Thionine mediated para-sulfonatocalix[4]arene capped AuNPs multilayers for sensitive electrochemical detection of acetylcholinesterase activity. Electrochim. Acta 2018, 267, 206–212. [Google Scholar] [CrossRef]
  19. Liu, G.; Wang, S.; Yang, X.; Li, T.; She, Y.; Wang, J.; Zou, P.; Jin, F.; Jin, M.; Shao, H. Colorimetric sensing of atrazine in rice samples using cysteamine functionalized gold nanoparticles after solid phase extraction. Anal. Methods 2016, 8, 52–56. [Google Scholar] [CrossRef]
  20. Liu, G.; Yang, X.; Li, T.; Yu, H.; Du, X.; She, Y.; Wang, J.; Wang, S.; Jin, F.; Jin, M.; et al. Spectrophotometric and visual detection of the herbicide atrazine by exploiting hydrogen bond-induced aggregation of melamine-modified gold nanoparticles. Microchim. Acta 2015, 182, 1983–1989. [Google Scholar] [CrossRef]
  21. Liu, G.; Huang, X.; Zheng, S.; Li, L.; Xu, D.; Xu, X.; Zhang, Y.; Lin, H. Novel triadimenol detection assay based on fluorescence resonance energy transfer between gold nanoparticles and cadmium telluride quantum dots. Dyes Pigments 2018, 149, 229–235. [Google Scholar] [CrossRef]
  22. Zhang, X.; Sun, Z.; Cui, Z.; Li, H. Ionic liquid functionalized gold nanoparticles: Synthesis, rapid colorimetric detection of imidacloprid. Sens. Actuat. B 2014, 191, 313–319. [Google Scholar] [CrossRef]
  23. Mehta, V.N.; Basu, H.; Singhal, R.K.; Kailasa, S.K. Simple and sensitive colorimetric sensing of Cd2+ ion using chitosan dithiocarbamate functionalized gold nanoparticles as a probe. Sens. Actuat. B 2015, 220, 850–858. [Google Scholar] [CrossRef]
  24. Zhou, Z.; Zhang, Y.; Kang, J.; Dong, C.; Chen, N.; Li, X.; Guo, Z.; Wu, A. Detection of herbicide glyphosates based on an anti-aggregation mechanism by using unmodified gold nanoparticles in the presence of Pb2+. Anal. Methods 2017, 9, 2890–2896. [Google Scholar] [CrossRef]
  25. Sun, X.; Liu, R.; Liu, Q.; Fei, Q.; Feng, G.; Shan, H.; Huan, Y. Colorimetric sensing of mercury (II) ion based on anti-aggregation of gold nanoparticles in the presence of hexadecyl trimethyl ammonium bromide. Sens. Actuat. B 2018, 260, 998–1003. [Google Scholar] [CrossRef]
  26. Safavi, A.; Ahmadi, R.; Mohammadpour, Z. Colorimetric sensing of silver ion based on anti aggregation of gold nanoparticles. Sens. Actuat. B 2017, 242, 609–615. [Google Scholar] [CrossRef]
  27. Liu, G.; Zhang, R.; Huang, X.; Li, L.; Liu, N.; Wang, J.; Xu, D. Visual and colorimetric sensing of metsulfuron-methyl by exploiting hydrogen bond-induced anti-aggregation of gold nanoparticles in the presence of melamine. Sensors 2018, 18, 1595. [Google Scholar] [CrossRef] [PubMed]
  28. Godoy-Reyes, T.M.; Llopis-Lorente, A.; Costero, A.M.; Sancenón, F.; Gaviña, P.; Martínez-Máñez, R. Selective and sensitive colorimetric detection of the neurotransmitter serotonin based on the aggregation of bifunctionalised gold nanoparticles. Sens. Actuat. B 2018, 258, 829–835. [Google Scholar] [CrossRef]
  29. Feng, B.; Zhu, R.; Xu, S.; Chen, Y.; Di, J. A sensitive LSPR sensor based on glutathione-functionalized gold nanoparticles on a substrate for the detection of Pb2+ ions. RSC Adv. 2018, 8, 4049–4056. [Google Scholar] [CrossRef]
Figure 1. (a) AuNPs (black line), (b) AuNPS with 2.0 mg/L chlorsulfuron (red line), (c) AuNPS with 2.0 mg/L chlorsulfuron and 2.0 mg/L acetamiprid (blue line), (d) AuNPS with 20 mg/L acetamiprid (green line).
Nanomaterials 08 00499 g001
Figure 2. TEM images of (a) AuNPs, (b) AuNPS with 2.0 mg/L chlorsulfuron and 20 mg/L chlorsulfuron, (c) AuNPS with 20 mg/L acetamiprid.
Nanomaterials 08 00499 g002
Figure 3. FT-IR spectra of: chlorsulfuron, chlorsulfuron, the complex of acetamiprid and chlorsulfuron.
Nanomaterials 08 00499 g003
Figure 4. Schematic illustration of Colorimetric sensing of chlorsulfuron based on anti-aggregation of gold nanoparticles in the presence of acetamiprid.
Nanomaterials 08 00499 g004
Figure 5. The plots of ΔA523 versus chlorsulfuron concentration under (a) different concentration of acetamiprid and (b) different pH condition.
Nanomaterials 08 00499 g005
Figure 6. (A) UV-Vis spectra and a photograph of (a) AuNP solutions, AuNP solutions with concentrations of chlorsulfuron of (b) 100 mg/L , (c) 50 mg/L, (d) 20 mg/L, (e) 10 mg/L, (f) 5.0 mg/L, (g) 2.0 mg/L, (h) 1.0 mg/L, (i) 0.5 mg/L, (j) 0.2 mg/L, (k) 0.1 mg/L (l) 0 mg/L in the presence of 20 mg/L acetamiprid and (B) standard calibration curve of the absorbance change of AuNPs at 523 nm (ΔA523) against chlorsulfuron concentration.
Nanomaterials 08 00499 g006
Figure 7. Absorption change ΔA523 of AuNPs in the presence of chlorsulfuron and other interfering substances.
Nanomaterials 08 00499 g007
Table 1. Comparison of the linear ranges and detection limits of different methods. LOD: Limit of Detection; HPLC-CAD: Liquid Chromatography-Charged Aerosol Detector; HPLC-UV: Liquid Chromatography-Ultraviolet Detector.
MethodsLinear Range (mg/L)LOD (mg/L)R2MatricesReference
HPLC-CAD 0.01–1.00.01–0.050.999Grain, straw, green plant[6]
HPLC-UV0.02–50.080.999Soil[7]
Fluorescence detection0.01–1.00.010.999Environmental water[9]
Electrochemical Immunoassay-0.005-Environmental water[11]
Anti-aggregation-AuNPs based UV–Vis detection0.1–1000.050.957Irrigation waterThis work
Table 2. Recoveries of chlorsulfuron in water samples (n = 3). RSD: Relative Standard Deviations.
SamplesSpiked (mg/L)Found (mg/L)Recovery (%)RSD (%)LOD (mg/L)
Tap water0---0.125
0.50.42184.14.25
1.00.81781.73.62
5.04.5290.46.47
Well water0---0.25
0.50.38276.37.34
1.00.78578.54.19
5.04.7194.25.62

