Aqueous Phase Synthesis of CuIn Alloy Nanoparticles and Their Application for a CIS (CuInSe2)-Based Printable Solar Battery

Abstract
:1. Introduction
2. Experimental
2.1. Calculations
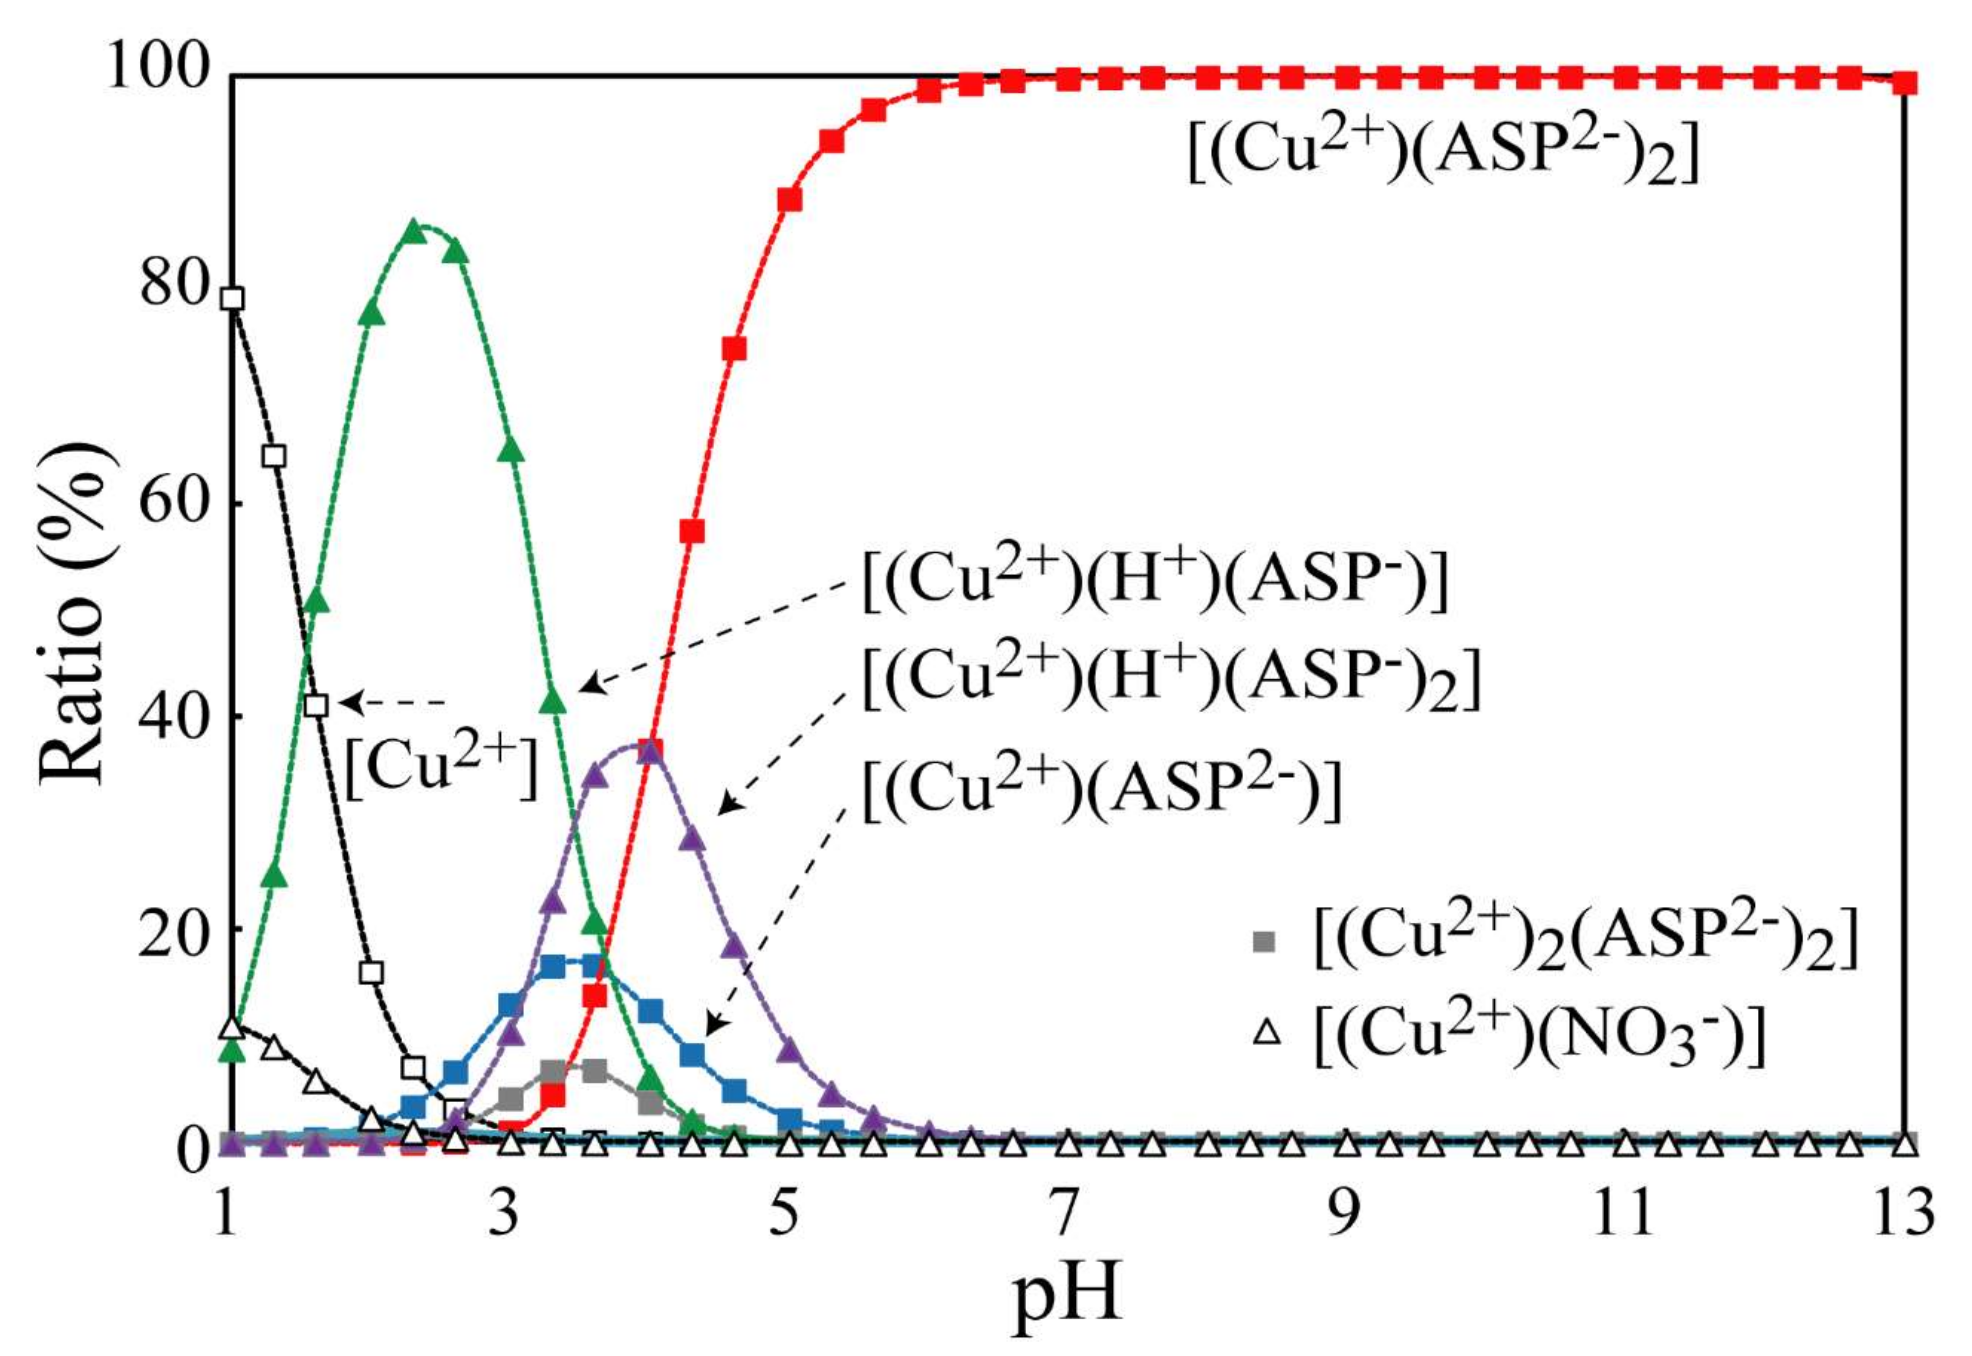
| [H(ASP)] = K1[H][ASP] | LogK1 = 9.65 |
| [(H)2(ASP)] = K2[H(ASP)][H] | LogK2 = 3.70 |
| [(H)3(ASP)] = K3[(H)2ASP][H] | LogK3 = 1.90 |
| [Cu(ASP)] = K4[Cu][ ASP] | LogK4 = 8.88 |
| [Cu(ASP)2] = K5[Cu][ ASP]2 | LogK5 = 15.6 |
| [Cu(H)(ASP)] = K6[Cu(ASP)][H] | LogK6 = 3.70 |
| [Cu(H)(ASP)2] = K7[Cu(ASP)2][H] | LogK7 = 4.00 |
| [(Cu)2(ASP)] = K8[Cu(ASP)][Cu] | LogK8 = 1.51 |
| [(Cu)2(ASP)2] = K9[Cu(ASP)2] [Cu] | LogK9 = 3.60 |
| [Cu(OH)] = K10[Cu][OH] | LogK10 = 6.50 |
| [Cu(OH)2] = K11[Cu][OH]2 | LogK11 = 11.8 |
| [Cu(OH)3] = K12[Cu][OH]3 | LogK12 = 14.5 |
| [Cu(OH)4] = K13[Cu][OH]4 | LogK13 = 16.4 |
| [(Cu)2(OH)] = K14[Cu]2[OH] | LogK14 = 8.20 |
| [(Cu)2(OH)2] = K15[Cu]2[OH]2 | LogK15 = 17.7 |
| [(Cu)3(OH)4] = K16[Cu]3[OH]4 | LogK16 = 35.2 |
| [Cu(NO3)] = K17[Cu][NO3] | LogK17 = −0.13 |
| [Cu(NO3)2] = K18[Cu][NO3]2 | LogK18 = −0.60 |
2.2. Reduction Potential Measurements of Homogenized Cu Complexes
2.3. Preparation and Selenization Method of Cu-In Alloy Nanoparticles
2.4. Evaluation of the Synthesized Materials
3. Results and Discussion
4. Conclusions
Acknowledgments
Author Contributions
Conflicts of Interest
References
- BP Group. BP Statistical Review of World Energy June 2014, 63rd ed.; BP Group: London, UK, 2014. [Google Scholar]
- Intergovernmental Panel on Climate Change (IPCC). Climate Change 2013: The Physical Science Basis; IPCC: Geneva, Switzerland, 2013. [Google Scholar]
- European Photovoltaic Industry Association (EPIA). Global Market Outlook for Photovoltaics 2014–2018; EPIA: Brussels, Belgium, 2014. [Google Scholar]
- Wagman, D.D.; Evans, W.H.; Parker, V.B.; Schumm, R.H.; Halow, I. The NBS Tables of Chemical Thermodynamic Properties. Selected Values for Inorganic and C1 and C2 Organic Substances in SI units; American Chemical Society: Washington, DC, USA, 1982. [Google Scholar]
- Espinosa, N.; García-Valverde, R.; Urbina, A.; Krebs, F.C. A life cycle analysis of polymer solar cell modules prepared using roll-to-roll methods under ambient conditions. Sol. Energy Mater. Sol. Cells 2011, 95, 1293–1302. [Google Scholar] [CrossRef]
- Henry, C.H. Limiting efficiencies of ideal single and multiple energy gap terrestrial solar cells. J. Appl. Phys. 1980, 51, 4494–4500. [Google Scholar] [CrossRef]
- Green, M.A.; Emery, K.; Hishikawa, Y.; Warta, W. Solar cell efficiency tables (version 35). Prog. Photovolt. Res. Appl. 2010, 18, 144–150. [Google Scholar] [CrossRef]
- Venkatachalam, M.; Kannan, M.D.; Jayakumar, S.; Balasundaraprabhu, R.; Muthukumarasamy, N. Effect of annealing on the structural properties of electron beam deposited CIGS thin films. Thin Solid Films 2008, 516, 6848–6852. [Google Scholar] [CrossRef]
- Čampa, A.; Krč, J.; Malmström, J.; Edoff, M.; Smole, F.; Topič, M. The potential of textured front ZnO and flat TCO/metal back contact to improve optical absorption in thin Cu(In,Ga)Se2 solar cells. Thin Solid Films 2007, 515, 5968–5972. [Google Scholar] [CrossRef]
- Powalla, M.; Cemernjak, M.; Eberhardt, J.; Kesslera, F.; Kniesea, R.; Mohring, H.D.; Dimmler, B. Large-area CIGS modules: Pilot line production and new developments. Sol. Energy Mater. Sol. Cells 2006, 90, 3158–3164. [Google Scholar] [CrossRef]
- Alsema, E.; de Wild-Scholten, M.J. Environmental Impacts of Crystalline Silicon Photovoltaic Module Production. In Proceedings of the 13th CIRP International Conference on Life Cycle Engineering, Leuven, Belgium, 31 May–2 June 2006. [Google Scholar]
- Kaelin, M.; Rudmann, D.; Tiwari, A.N. Tiwari, Low cost processing of CIGS thin film solar cells. Sol. Energy 2004, 77, 749–756. [Google Scholar] [CrossRef]
- Panthani, M.G.; Akhavan, V.; Goodfellow, B.; Schmidtke, J.P.; Dunn, L.; Dodabalapur, A.; Korgel, B.A. Synthesis of CuInS2, CuInSe2, and Cu(InxGa1-x)Se2 (CIGS) nanocrystal “inks” for printable photovoltaics. J. Am. Chem. Soc. 2008, 130, 16770–16777, [b] Ram Kumar, J., Ananthakumar, S. & Moorthy Babu, S. Journal of Elec Materi (2017) 46: 296. [Google Scholar] [CrossRef] [PubMed]
- Guillemoles, J.F.; Kronik, L.; Cahen, D.; Rau, U.; Jasenek, A.; Schock, H.W. Stability issues of Cu(In,Ga)Se2-based solar cells. J. Phys. Chem. B 2000, 104, 4849–4862. [Google Scholar] [CrossRef]
- Stappert, S.; Rellinghaus, B.; Acet, M.; Wassermann, E.F. Gas-phase preparation of L10 ordered FePt nanoparticles. J. Cryst. Growth 2003, 252, 440–450. [Google Scholar] [CrossRef]
- Repins, I.; Contreras, M.A.; Egaas, B.; DeHart, C.; Scharf, J.; Perkins, C.L.; Noufi, R. 19.9%-efficient ZnO/CdS/CuInGaSe2 Solar Cell with 81.2% Fill Factor. Prog. Photovolt. Res. Appl. 2008, 16, 235–239. [Google Scholar] [CrossRef]
- Choi, I.H.; Peter, Y.Y. Preparation of CuInSe2/CuGaSe2 two layers absorber film by meta-organic chemical vapor deposition. Curr. Appl. Phys. 2009, 9, 151–154. [Google Scholar] [CrossRef]
- Bhattacharya, R.N. Electrodeposited two-layer Cu-In-Ga-Se/In-Se thin films. J. Electrochem. Soc. 2010, 157, D406–D410. [Google Scholar] [CrossRef]
- Lim, Y.S.; Jeong, J.; Kim, J.Y.; Ko, M.J.; Kim, H.; Kim, B.; Lee, D.K. Binder-free Cu-In alloy nanoparticles precursor and their phase transformation to chalcogenides for solar cell applications. J. Phys. Chem. C 2013, 117, 11930–11940. [Google Scholar] [CrossRef]
- Liu, S.H.; Chen, F.S.; Lu, C.H. Synthesis of CuInSe2 films via selenizing the Cu-In alloy-containing nanopowders. J. Alloys Compd. 2012, 517, 14–19. [Google Scholar] [CrossRef]
- Takahashi, H.; Konishi, N.; Ohno, H.; Takahashi, K.; Koike, Y.; Asakura, K.; Muramatsu, A. Preparation of well-crystallized Pd20Te7 alloy nanoparticulate catalysts withuniform structure and composition in liquid-phase. Appl. Catal. A Gen. 2011, 392, 80–85. [Google Scholar] [CrossRef]
- Takahashi, H.; Mabuchi, T.; Yokoyama, S.; Tohji, K. Synthesis method for well crystallized alloy nanoparticles in aqueous solution under room temperature by controlling the metal complexes condition. In Nanotechnology 2013: Advanced Materials, CNTs, Particles, Films and Composites (Volume 1); CRC Press: Boca Raton, FL, USA, 2013. [Google Scholar]
- Hayes, J.R.; Hodge, A.M.; Biener, J.; Hamza, A.V.; Sieradzki, K. Monolithic nanoporous copper by dealloying Mn-Cu. J. Mater. Res. 2006, 21, 2611–2616. [Google Scholar] [CrossRef]
- Chou, N.H.; Ke, X.; Schiffer, P.; Schaak, R.E. Room-temperature chemical synthesis of shape-controlled indium nanoparticles. J. Am. Chem. Soc. 2008, 130, 8140–8141. [Google Scholar] [CrossRef] [PubMed]
- Badawy, W.A.; El-Rabiee, M.M.; Helal, N.H.; Nady, H. Effect of nickel content on the electrochemical behavior of Cu-Al-Ni alloys in chloride free neutral solutions. Electrochim. Acta 2010, 56, 913–918. [Google Scholar] [CrossRef]
- Caballero-Briones, F.; Palacios-Padrós, A.; Sanz, F. CuInSe2 films prepared by three step pulsed electrodeposition. Deposition mechanisms, optical and photoelectrochemical studies. Electrochim. Acta 2011, 56, 9556–9567. [Google Scholar] [CrossRef]
- Tsujiguchi, M. Indium Recovery and Recycling from an LCD Panel. In Design for Innovative Value Towards a Sustainable Society; Springer Science + Business Media: Berlin, Germany, 2012; pp. 743–746. [Google Scholar]
- Massalski, T.B.; Okamoto, H. Binary Alloy Phase Diagrams, 2nd ed.; ASM International: Minerals Park, OH, USA, 1990; pp. 1424–1426. [Google Scholar]
- Okamoto, H. Cu−In (Copper−Indium). J. Phase Equilib. Diffus. 2005, 26, 645. [Google Scholar] [CrossRef]
- Simic, V.; Marinkovic, Z. Room temperature interactions in copper-metal thin film couples. J. Less Common Met. 1980, 72, 133–140. [Google Scholar] [CrossRef]
- Roy, R.; Pradhan, S.K.; De, M.; Sen, S.K. Structural characterization of the CuIn intermetallic phase produced by interfacial reactions in Cu/In bimetallic films. Thin Solid Films 1993, 229, 140–142. [Google Scholar] [CrossRef]
- Orbey, N.; Birkmire, R.W.; Russell, T.F.; Jones, G.A. Copper-indium alloy transformations. J. Phase Equilib. 2000, 21, 509–513. [Google Scholar] [CrossRef]
- Pisarkiewicz, T.; Jankowski, H.; Schabowska-Osiowska, E.; Maksymowicz, L.J. Fabrication of thin film polycrystalline CIS photovoltaic heterostructure. Opto-Electron. Rev. 2003, 11, 297–304. [Google Scholar]
- Yan, Y.-H.; Liu, Y.-C.; Fang, L.; Zhu, J.-S.; Zhao, H.-H.; Li, D.-R.; Lu, Z.-C.; Zhou, S.-X. Characterization of CuInS2 thin films prepared by sulfurization of Cu-In precursor. Trans. Nonferrous Met. Soc. China 2008, 18, 1083–1088. [Google Scholar] [CrossRef]
- Chang, J.; Lee, J.H.; Cha, J.H.; Jung, D.Y.; Choi, G.; Kim, G. Bimetallic nanoparticles of copper and indium by borohydride reduction. Thin Solid Films 2011, 519, 2176–2180. [Google Scholar] [CrossRef]
- Shin, H.S.; Yang, H.J.; Kim, S.B.; Lee, M.S. Mechanism of growth of colloidal silver nanoparticles stabilized by polyvinyl pyrrolidone in γ-irradiated silver nitrate solution. J Colloid Interface Sci. 2004, 274, 89–94. [Google Scholar] [CrossRef] [PubMed]
- Agnihotri, O.P.; Ram, P.R.; Thangaraj, R.; Sharma, A.K.; Raturi, A. Structural and optical properties of sprayed CuInSe2 films. Thin Solid Films 1983, 102, 291–297. [Google Scholar] [CrossRef]
- Schmid, D.; Ruckh, M.; Grunwald, F.; Schock, H.W. Chalcopyrite/defect chalcopyrite heterojunctions on the basis of CulnSe2. J. Appl. Phys. 1993, 73, 2902–2909. [Google Scholar] [CrossRef]
- Park, J.H.; Yang, I.S.; Cho, H.Y. Micro-raman spectroscopy on polycrystalline CulnSe2 formation. Appl. Phys. A 1994, 58, 125–128. [Google Scholar] [CrossRef]
- Bodnar, I.V.; Gremenok, V.F.; Schmitz, W.; Bente, K.; Doering, T. Preparation and investigation of (CuInSe2)x(2ZnSe)1-x and (CuInTe2)x(2ZnTe)1-x solid solution crystals. Cryst. Res. Technol. 2004, 39, 301–307. [Google Scholar] [CrossRef]
- Brummer, A.; Honkimäki, V.; Berwian, P.; Probst, V.; Palm, J.; Hock, R. Formation of CuInSe2 by the annealing of stacked elemental layers—Analysis by in situ high-energy powder diffraction. Thin Solid Films 2003, 437, 297–307. [Google Scholar] [CrossRef]
- Izquierdo-Roca, V.; Saucedo, E.; Ruiz, C.M.; Fontané, X.; Calvo-Barrio, L.; Álvarez-Garcia, J.; Bermudez, V. Raman scattering and structural analysis of electrodeposited CuInSe2 and S-rich quaternary CuIn(S.,Se)2 semiconductors for solar cells. Phys. Status Solidi A 2009, 206, 1001–1004. [Google Scholar] [CrossRef]
- Hibberd, C.J.; Ernits, K.; Kaelin, M.; Müller, U.; Tiwari, A.N. Chemical incorporation of copper into indium selenide thin-films for processing of CuInSe2 solar cells. Prog. Photovolt. Res. Appl. 2008, 16, 585–593. [Google Scholar] [CrossRef]
- Rincón, C.; Ramirez, F.J. Lattice vibrations of CuInSe2 and CuGaSe2 by raman microspectrometry. J. Appl. Phys. 1992, 72, 4321–4324. [Google Scholar] [CrossRef]
- Minceva-Sukarova, B.; Najdoski, M.; Grozdanov, I.; Chunnilall, C.J. Raman spectra of thin solid films of some metal sulfides. J. Mol. Struct. 1997, 410, 267–270. [Google Scholar] [CrossRef]
- Chang, C.H.; Davydov, A.; Stanbery, B.J.; Anderson, T.J. The conference record of the 25th IEEE photovoltaic specialists conference. In Proceedings of the 25th IEEE Photovoltaic Specialists Conference, Washington, DC, USA, 13–17 May 1996; p. 849. [Google Scholar]
- Hegedus, S.S.; Shafarman, W.N. Thin-film solar cells: Device measurements and analysis. Prog. Photovolt. 2004, 12, 155–176. [Google Scholar] [CrossRef]
- Lundberg, O.; Bodegård, M.; Malmström, J.; Stolt, L. Influence of the Cu(In,Ga)Se2 thickness and Ga grading on solar cell performance. Prog. Photovolt. Res. Appl. 2003, 11, 77–88. [Google Scholar] [CrossRef]


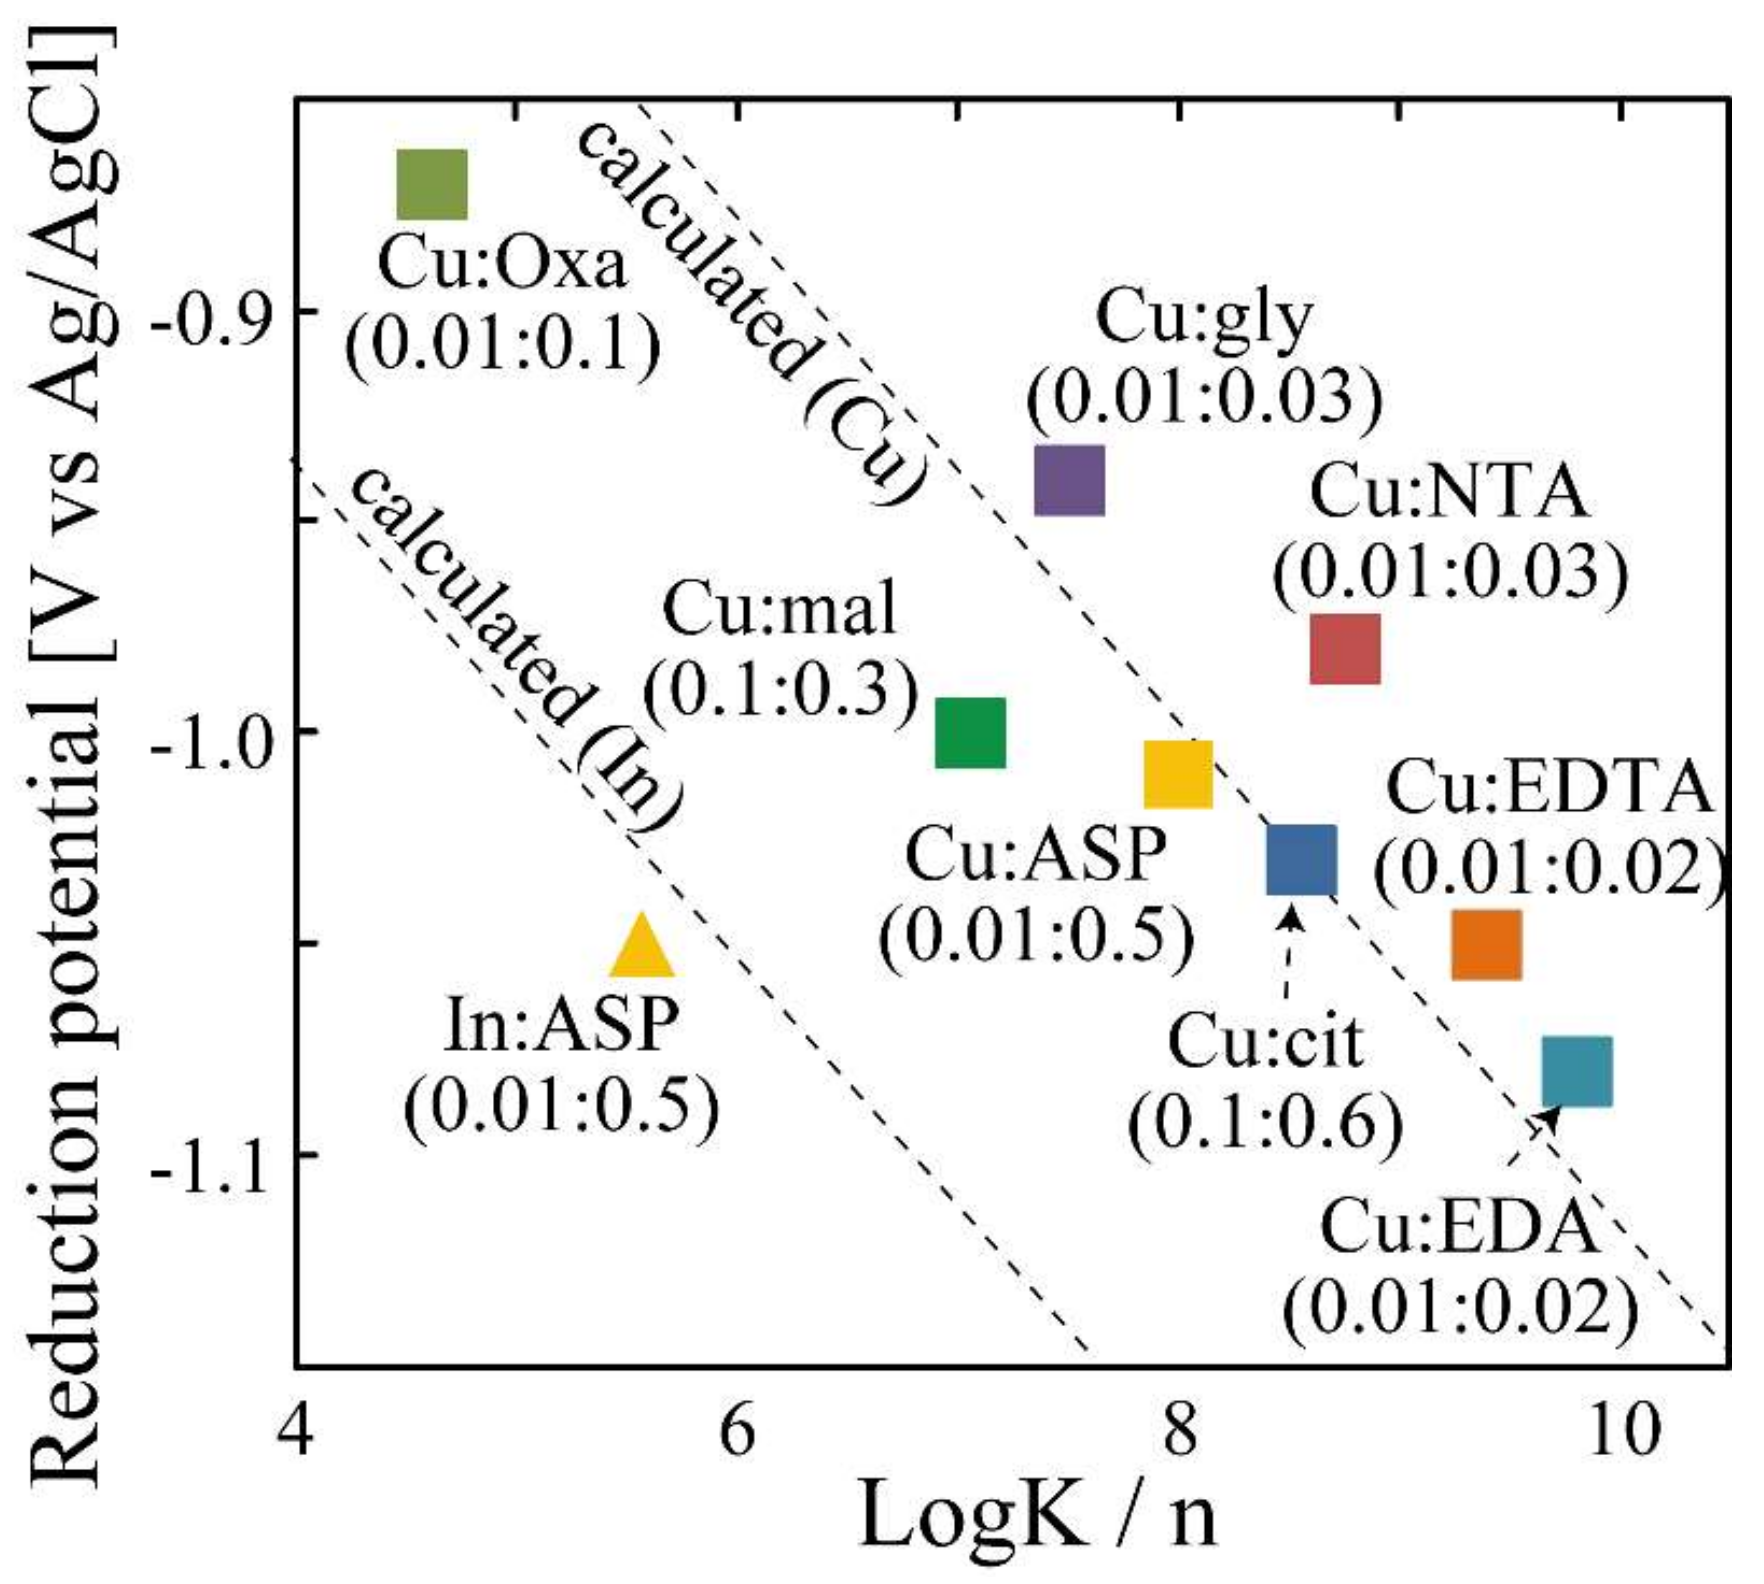
| Complex Reagent | Concentration of Cu (mol/L) | Concentration of Complex Reagent (mol/L) | Homogenized Species | Ratio of Homogenized Species (%) | Reduction Potential [V(vs. Ag/AgCl)] |
|---|---|---|---|---|---|
| oxalic acid | 0.01 | 0.1 | [(Cu2+)(oxa2−)2] | 100 | −0.87 |
| glycine | 0.01 | 0.03 | [(Cu2+)(gly−)2] | 100 | −0.94 |
| EDA | 0.01 | 0.02 | [(Cu2+)(EDA)2] | 100 | −1.08 |
| ASP | 0.01 | 0.06 | [(Cu2+)(ASP2−)2] | 100 | −1.01 |
| NTA | 0.01 | 0.03 | [(Cu2+)(NTA3−)2] | 100 | −0.98 |
| EDTA | 0.01 | 0.02 | [(Cu2+)(EDTA4−)] | 96.2 | −1.05 |
| malic acid | 0.01 | 0.03 | [(Cu2+)2(OH−)2(mal2−)2] | 92.8 | −1.00 |
| citric acid | 0.01 | 0.06 | [(Cu2+)2(OH−)2(cit3−)2] | 93.8 | −1.03 |
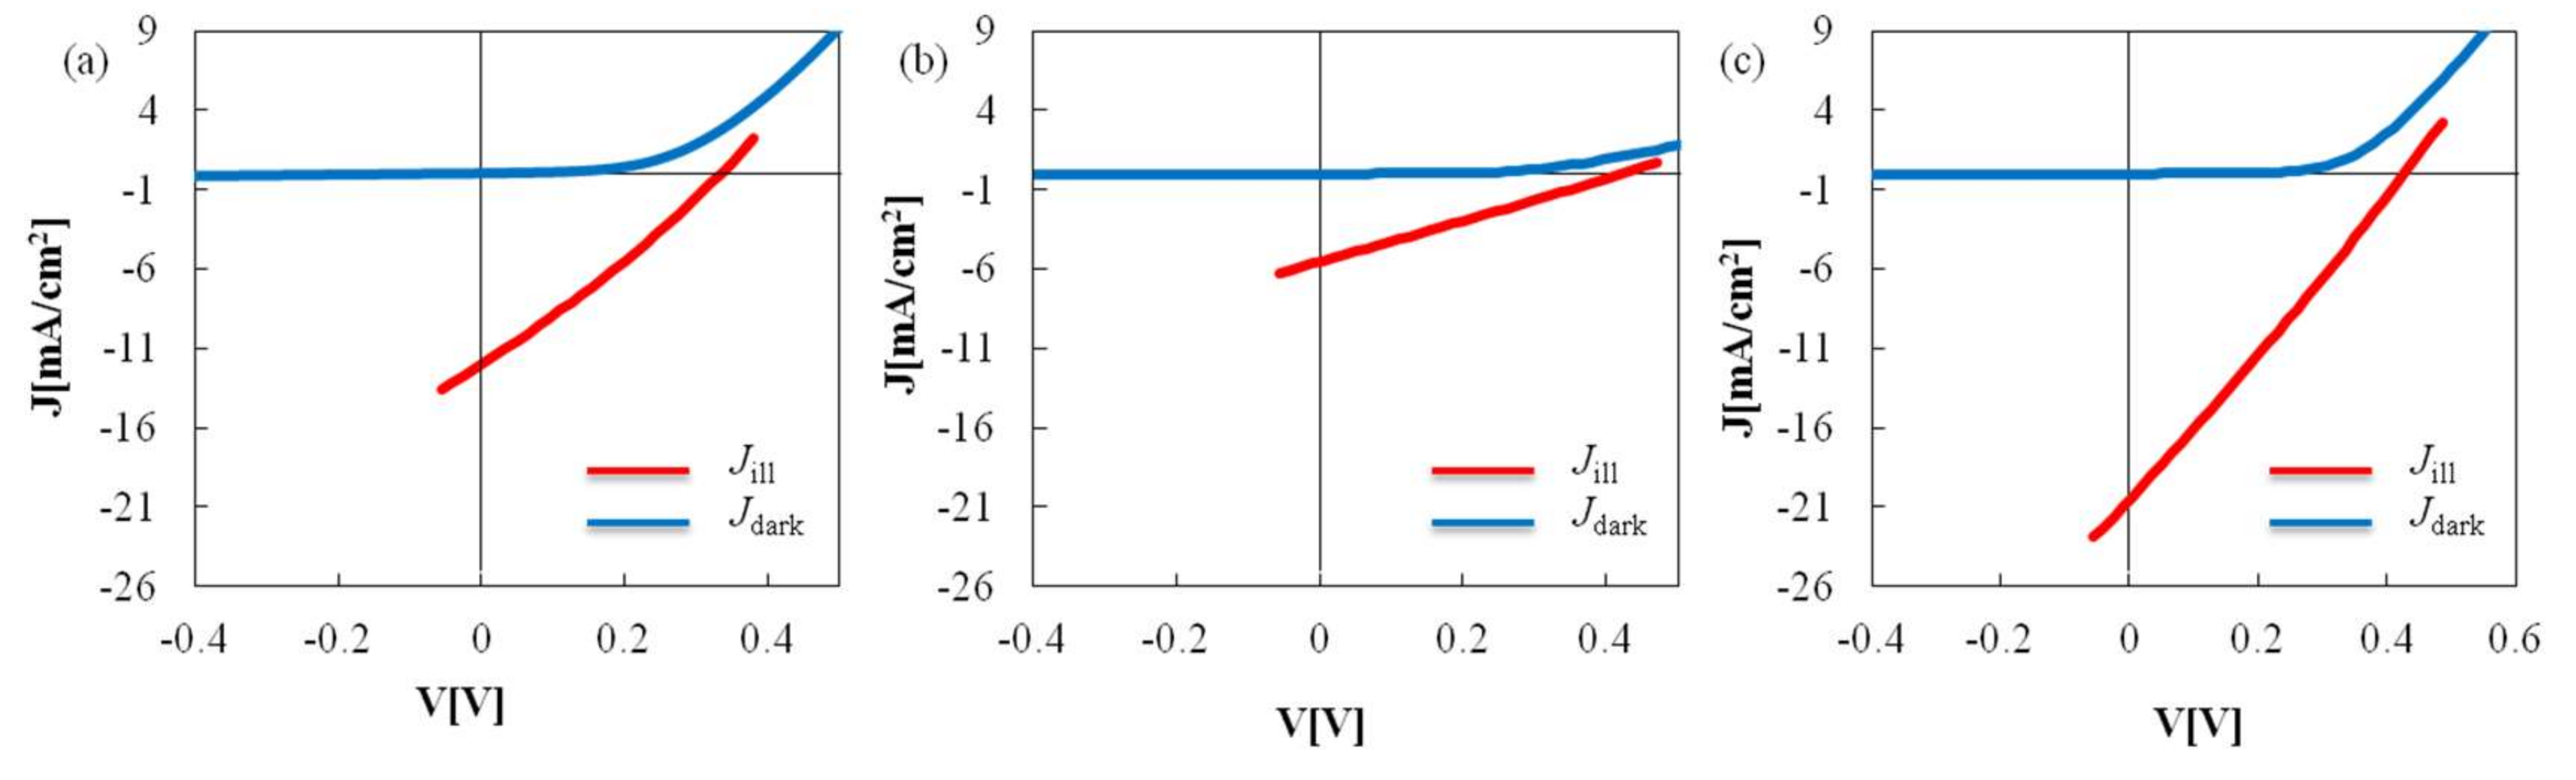
| Sample | VOC (mV) | JSC (mA/cm2) | FF | η (%) |
|---|---|---|---|---|
| PVP(K16–18), Cu/In = 0.91 | 330 | 12.0 | 0.28 | 1.12 |
| PVP(K25) Cu/In = 0.91 | 420 | 5.53 | 0.26 | 0.60 |
| PVP(K25) Cu/In = 0.81 | 430 | 20.5 | 0.26 | 2.30 |
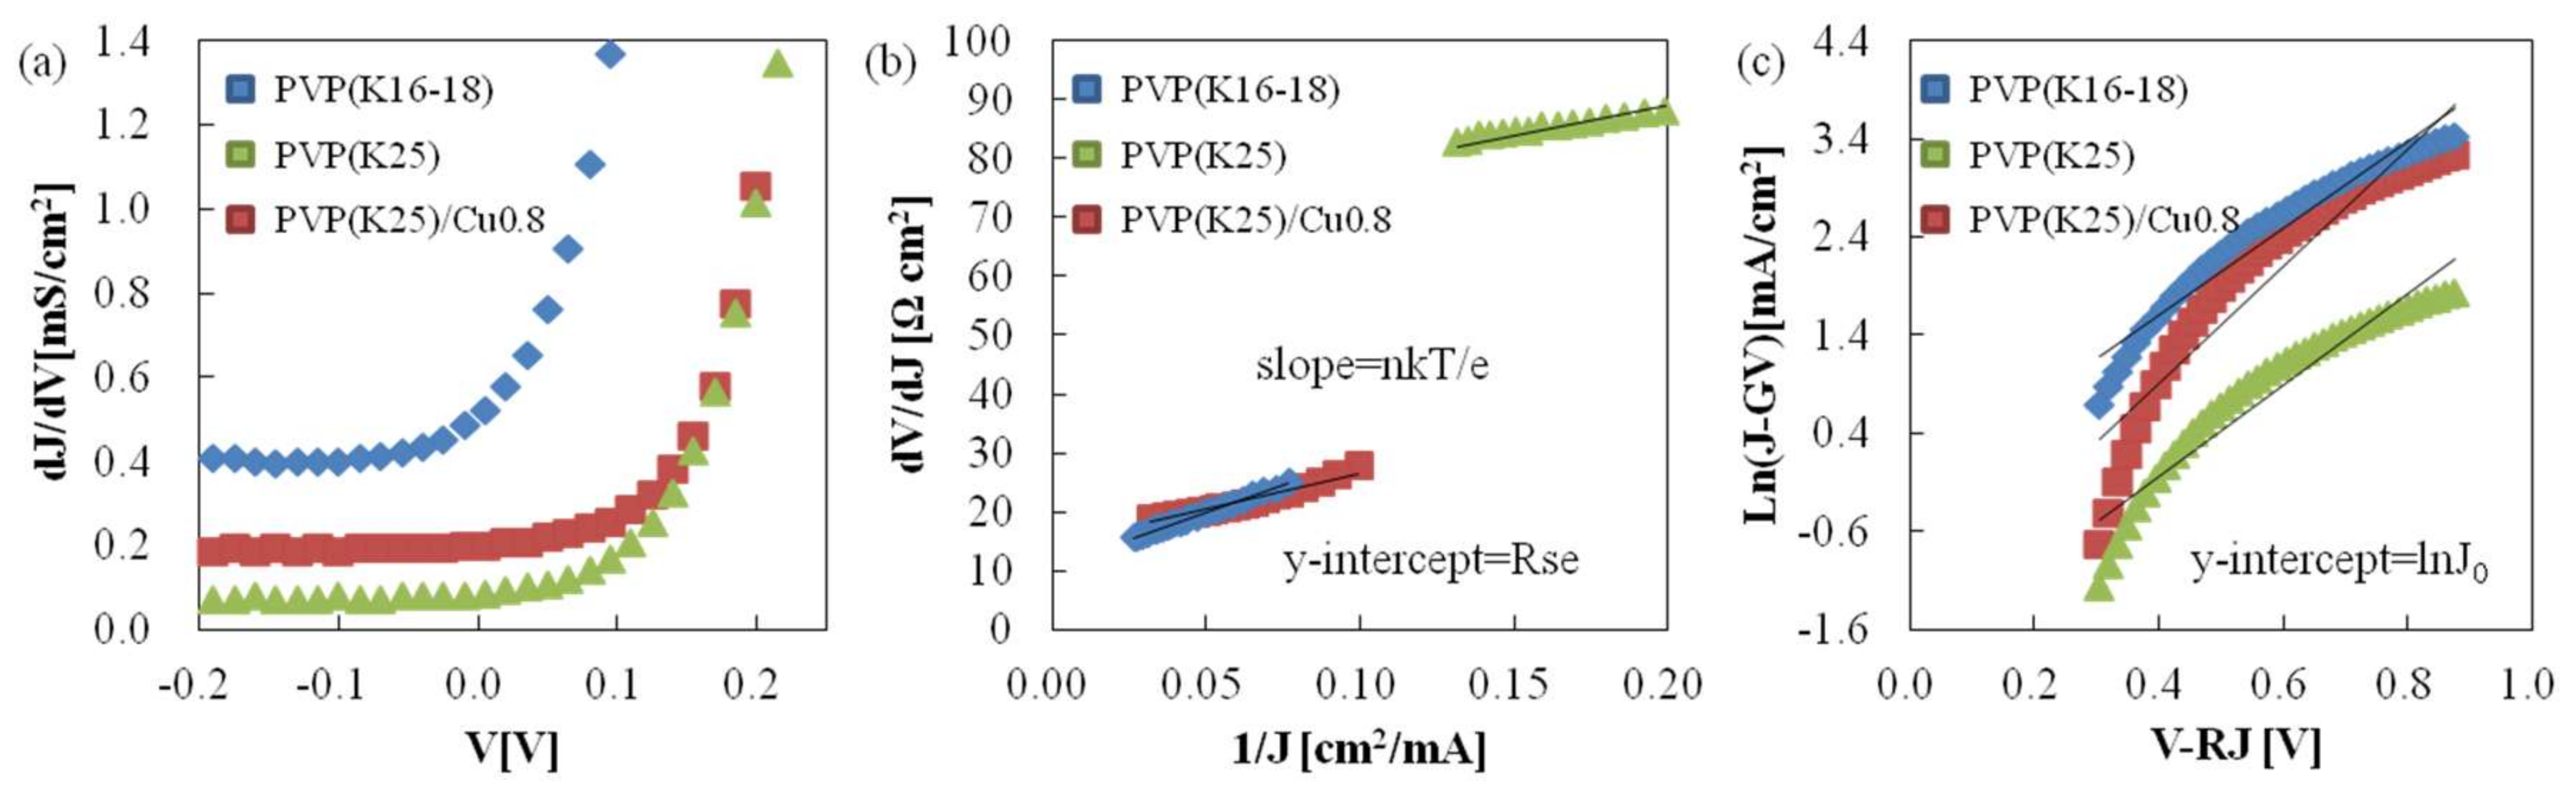
| Sample | Gsh (mS/cm2) | Rse (Ω cm2) | n | J0 (mA/cm2) |
|---|---|---|---|---|
| PVP(K16–18) | 0.40 | 10.8 | 7.06 | 0.86 |
| PVP(K25) | 0.08 | 68.4 | 4.00 | 0.15 |
| PVP(K25)/Cu0.8 | 0.20 | 14.3 | 4.71 | 0.23 |
| CIGS(gas phase) (η = 15.5%) | 0.05 | 0.20 | 1.50 | 2 × 10⁻⁶ |
© 2018 by the authors. Licensee MDPI, Basel, Switzerland. This article is an open access article distributed under the terms and conditions of the Creative Commons Attribution (CC BY) license (http://creativecommons.org/licenses/by/4.0/).
Share and Cite
Takahashi, H.; Fujiki, H.; Yokoyama, S.; Kai, T.; Tohji, K. Aqueous Phase Synthesis of CuIn Alloy Nanoparticles and Their Application for a CIS (CuInSe2)-Based Printable Solar Battery. Nanomaterials 2018, 8, 221. https://doi.org/10.3390/nano8040221
Takahashi H, Fujiki H, Yokoyama S, Kai T, Tohji K. Aqueous Phase Synthesis of CuIn Alloy Nanoparticles and Their Application for a CIS (CuInSe2)-Based Printable Solar Battery. Nanomaterials. 2018; 8(4):221. https://doi.org/10.3390/nano8040221
Chicago/Turabian StyleTakahashi, Hideyuki, Hironari Fujiki, Shun Yokoyama, Takayuki Kai, and Kazuyuki Tohji. 2018. "Aqueous Phase Synthesis of CuIn Alloy Nanoparticles and Their Application for a CIS (CuInSe2)-Based Printable Solar Battery" Nanomaterials 8, no. 4: 221. https://doi.org/10.3390/nano8040221
APA StyleTakahashi, H., Fujiki, H., Yokoyama, S., Kai, T., & Tohji, K. (2018). Aqueous Phase Synthesis of CuIn Alloy Nanoparticles and Their Application for a CIS (CuInSe2)-Based Printable Solar Battery. Nanomaterials, 8(4), 221. https://doi.org/10.3390/nano8040221