Article

Determining the Degree of [001] Preferred Growth of Ni(OH)2 Nanoplates

1
College of Materials Science and Engineering; Shanxi Key Laboratory of Advanced Magnesium-based Materials, Taiyuan University of Technology, Taiyuan, 030024, China
2
Laboratoire de Chimie Physique et Microbiologie pour les Matériaux et l′Environnement (LCPME), UMR 7564, CNRS-Université de Lorraine, Villers-lès-Nancy 54600, France
3
Materials Program, Department of Chemical and Materials Engineering, University of Kentucky, Lexington, KY 40506, USA
*
Authors to whom correspondence should be addressed.
Nanomaterials 2018, 8(12), 991; https://doi.org/10.3390/nano8120991
Submission received: 13 October 2018 / Revised: 12 November 2018 / Accepted: 27 November 2018 / Published: 30 November 2018

Abstract

:
Determining the degree of preferred growth of low-dimensional materials is of practical importance for the improvement of the synthesis methods and applications of low-dimensional materials. In this work, three different methods are used to analyze the degree of preferred growth of the Ni(OH)2 nanoplates synthesized without the use of a complex anion. The results suggest that the preferred growth degree of the Ni(OH)2 nanoplates calculated by the March parameter and the expression given by Zolotoyabko, which are based on the analysis and texture refinement of the X-ray diffraction pattern, are in good accordance with the results measured by SEM and TEM imaging. The method using the shape function of crystallites is not suitable for the determination of the preferred growth degree of the Ni(OH)2 nanoplates. The method using the March parameter and the expression given by Zolotoyabko can be extended to the analysis of block materials.

Graphical Abstract

1. Introduction

All polycrystalline materials, including block and powder materials, exhibit preferred orientation of crystallites, to some degree, i.e., texture, due to the mechanical deformation and microstructure evolution during material processing [1,2,3]. It is of great importance to analyze and determine the preferred orientation when the material properties are orientation-dependent. Electrical, magnetic and mechanical properties of crystals with cubic symmetry are independent on the orientation [4,5,6].
There are several techniques available to determine the degree of the preferred orientation of powder materials, including optical microscopy (OM), scanning electron microscopy (SEM) and transmission electron microscopy (TEM). The principle in TEM using to determine the preferred growth degree of powder materials is based on the analysis of TEM images and the corresponding diffraction pattern or phase-contrast images along appropriate crystal axis [7]. However, both SEM and TEM can only reveal limited portion of the preferred growth of powder materials, and OM can only be used to analyze the structures with characteristic dimensions more than 200 nm. Also, it is easy to introduce artifacts in replicating real 3-D morphology from projected 2-D images from optical/electronic images, especially TEM images. It is very difficult to use the imaging-related techniques to determine the degree of the preferred growth of nanostructures.
X-ray diffraction (XRD) is another effective way to determine the preferred orientation degree in polycrystalline materials. With a tilting holder in the X-ray diffractometer, pole figure/inverse pole figure or the orientation distribution function can be used to characterize the blocking materials, such as metals. Yet, there are limited reports on the XRD use in the analysis of the preferred growth degree of powder materials, such as nanostructured Ni(OH)2 and Cd(OH)2 with hexagonal or trigonal symmetry, which have specific preferred growth of [001] [8,9]. In this study, we synthesize Ni(OH)2 nanoplates without the use of any complex anion, and calculate the March parameter (rn) of the preferred growth with fitting the XRD spectra of the Ni(OH)2 nanoplates by the whole powder pattern fitting method (WPPF) in the framework of the March-Dollase function [10,11]. Afterwards, the degree of the preferred growth degree (η) of the Ni(OH)2 nanoplates is determined with using Zolotoyabko’s normalized equation (ηX) [1], the ellipsoidal model (ηE) and direct measurement (ηM) in SEM and TEM images. The preferred growth degree within the ellipsoidal model and direct measurement in SEM and TEM is defined by the ratio of the short axis and long axis in average (η = D00l/Dhk0). The overall aim in this study is to offer a simpler way to determine the degree in the preferred powder materials.

2. Experimental Section

2.1. Fabrication of Ni(OH)2 Nanoplates

NiCl2·6H2O (99%) and NaOH (99%) were obtained from Sigma-Aldrich (Sinopharm Chemical Reagent Co., Ltd, Shanghai, China) without further purification. The as-received 0.1 M NiCl2·6H2O of X mL and 0.2 M NaOH of 2X mL were mixed under magnetic stirring to form a homogeneous solution (solvent: deionized water). Multiple centrifugations were used to remove the sodium chloride precipitates from the solution. The homogeneous solution of 40 mL was placed in a Teflon-lined stainless-steel autoclave (Yanzheng experimental instrument co., LTD, Shanghai, China, 60 mL), which was sealed and maintained at 180 °C for 10 h and cooled to room temperature in the furnace. The light green product collected from the Teflon-lined stainless-steel autoclave was washed by distilled water and ethanol. The washed product was dried in a vacuum oven at 60 °C for 6 h.

2.2. Materials Characterization

The XRD analysis of the synthesized products (Ni(OH)2 nanoplates) was performed on a Rigaku X-ray diffractometer (40 kV, 40 mA, Cu Kα radiation: 1.54184 Å, Rigaku Corporation, Akishima-shi, Tokyo, Japan) equipped with a one-dimensional array detector (DteX250(H) Rigaku Corporation, Akishima-shi, Tokyo, Japan) at room temperature. The incident Sola slit and the length of limiting slit are 1/6° and 10 mm, and the scan step is 0.01° for the 2θ in a range of 10° to 100°. The morphology and the electron diffraction pattern of the synthesized products (Ni(OH)2 nanoplates) were analyzed on a scanning electron microscope (MIRA3 LMH, TESCAN Corporation, Brno, Czech) and transmission electron microscope (JEOL 2100F, JEOL ltd, Akishima, Tokyo, Japan), respectively.

2.3. Methodology

The analysis of the XRD patterns was performed, using the software of Rigaku SmartLab Studio II (Rigaku Corporation, Akishima-shi, Tokyo, Japan). The second derivative method was used to identify the diffraction peaks in the XRD patterns, and the split pseudo-Voigt function was used to fit a single peak. The whole powder pattern fitting method (WPPF) without reference to a structural model, as proposed by Pawley in the analysis of the neutron powder data, was used to fit the diffraction spectra [12]. The texture refinement was used to determine the March parameter from the March-Dollase function (W(α)) [10,11]
W ( α ) = ( r n 2 cos 2 α n , h + r n 1 sin 2 α n , h ) 3 / 2
here, αn,h is the angle between the orientation vector and diffraction plane vector. The March number rn determines the preferred orientation strength. The March-Dollase function represents the crystallite fraction with the reciprocal lattice vectors being perpendicular to the sample surface [1]. For rn = 1, there is no preferred orientation (random orientation); for rn < 1, there is a preferred orientation by plate crystallites with the orientation vector perpendicular to the plate surface; and for rn > 1, there is a preferred orientation by needle crystallites with the orientation vector parallel to the longitudinal direction of needles.

3. Results and Discussion
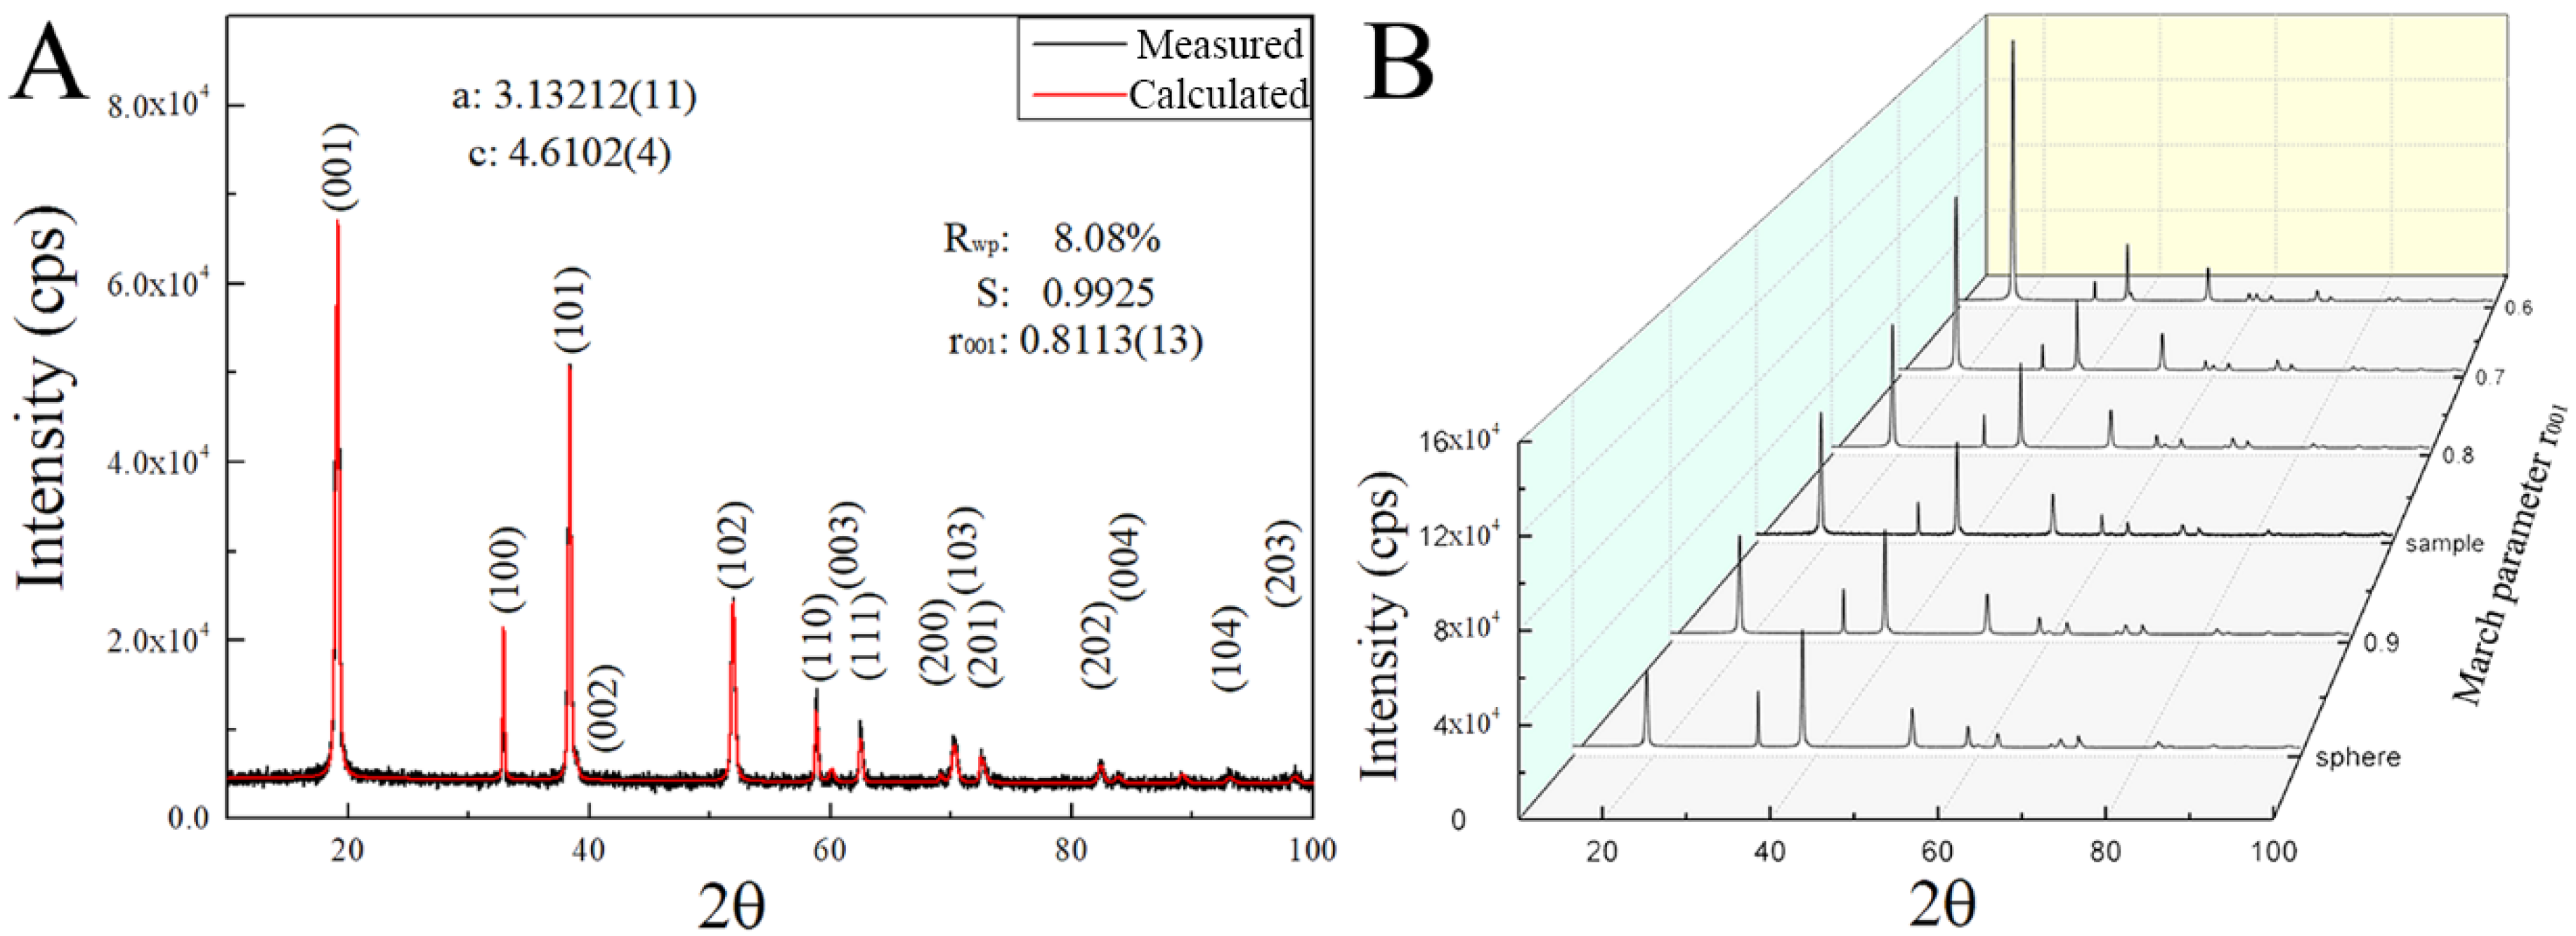
In Figure 1A, the XRD pattern of the synthesized product is shown, in which all the diffraction peaks can be indexed by the trigonal structure of theophrastite (Ni(OH)2 mineral) with the space group P-3m1 [13]. However, comparing with the peaks calculated from the crystallographic information file (ICSD 24015), as shown by the calculated XRD pattern, a slight offset is observed in the diffraction angles (2θ) between measured data and calculated results, which likely is due to the difference in the lattice constants. After performing the refinement calculation of the lattice constants (a, b and c) and the profile function parameters, we obtain lattice constants of the synthesized Ni(OH)2: a = 3.13212(11) and c = 4.6102(4) Å.
Figure 1A also depicts the calculated XRD pattern of the synthesized Ni(OH)2 with indexed planes. The modified crystallographic file was used in the further profile and texture refinement to determine the preferred direction degree.
It is known that diffraction peak experiences an angle broadening in crystalline materials with grain size less than 100 nm or under lattice strain [14]. The diffraction peak broadening for the synthesized Ni(OH)2 is likely due to the submicron crystallite sizes. From Figure 1A, we note that the FWHM (full width at half maximum) of the (001) diffraction peak of Ni(OH)2 is much wider than those of (100) and (110), suggesting that the crystallite size along the [001] direction is much smaller than those along the [100] and [110] directions and the crystallites of Ni(OH)2 are ellipsoidal instead of spherical shape.
To separate the instrumental broadening from the peak broadening of Ni(OH)2, we used a silicon standard specimen for the instrumental broadening estimation during the comprehensive analysis of the synthesized Ni(OH)2 by SmartLab Studio II. Table 1 lists the corrected FWHM values of the synthesized Ni(OH)2. The FWHM of the peaks (001), (002), (003) and (004) are 0.395, 0.54, 0.43 and 0.33°, respectively, which are much larger than those of the other peaks; the FWHM of the peaks (100), (110) and (200) are 0.083, 0.143 and 0.09°, respectively. The analysis of the widest peak (00l) and the narrowest peak (hk0) parameters suggests that the synthesized Ni(OH)2 crystallites are two-dimensional in shape, and the diameter of synthesized Ni(OH)2 crystallites along [hk0], Dhk0, is much larger than that along the [00l] direction, D00l. Thus, the synthesized Ni(OH)2 is present in the two-dimension nanoplate shapes.
In the standard diffraction spectra calculated with spherical crystallites, the integrated intensity of (101) should be larger than that of (001), as shown in Figure 1B (sphere). According to the measured diffraction data, there exists the preferred growth of Ni(OH)2 crystallites responsible for the abnormal integrated intensity ratio between (001) and (101). Using the March-Dollase function in the smartLab Studio II, we performed the profile and texture refinement to determine the degree of the preferred direction [001], i.e., the smallest dimension of the two-dimensional Ni(OH)2 crystallites. The calculation gives the March parameter of r001 = 0.8113, as shown in the calculated XRD spectrum of Figure 1A with Rwp = 8.08% and S = 0.9925.
Figure 1B depicts the variation of the simulated diffraction spectra with the March parameter r00l. Increasing the March parameter r00l leads to the increase of the intensity ratio between (001) and (101). This ratio likely represents the preferred growth degree of the synthesized Ni(OH)2. The standard theophrastite (JCPDS. No.14-0117) given by ICDD also shows preferred growth because the ratio of the diffraction intensity of (001) and (101) is 1. Yet, the March parameter r00l cannot effectively represent the preferred growth degree of the 2-D Ni(OH)2 crystallites.
Zolotoyabko established a relationship between the degree of preferred growth and the March parameter rn extracted from diffraction measurements using the nominalized March-Dollase function W(α). He proposed that the degree of preferred growth can be expressed by η as
η = 100 % [ ( 1 r n ) 3 1 r n 3 ] 1 / 2
for r001 = 0.8113, we obtain the degree of the [001] preferred growth deduced in X-ray diffraction, ηX, as 12.00%.
Žunić and Dohrup demonstrated that an ellipsoid in reference to crystallographic axes (triclinic case) can be expressed as [15]
b 11 x c 2 + b 22 y c 2 + b 33 z x 2 + 2 b 12 x c y c + 2 b 13 x c z c + 2 b 23 y c z c = 1
where bij (i, j = 1, 2, 3) are the coefficients related to reciprocal axes. The symbols xc, yc and zc stand for the parameters in describing the surface function. Thus, the simulated ellipsoid can be expressed as
b 11 h 2 + b 22 k 2 + b 33 l 2 + 2 b 12 h k + 2 b 13 h l + 2 b 23 k l = 9 16 D h k l 2 d h k l 2
here, Dhkl is the surface average diameter of the ellipsoidal crystallites (D00l and Dhk0) obtained from the normalized expressions of anisotropic line broadening, and dhkl is the interplanar spacing. The meanings of the letters: h, k and l are consistent with the subscript in Dhkl and dhkl. Table 2 lists the coefficients of the refined ellipsoidal crystallites of the synthesized Ni(OH)2. Using the fitting coefficients for the synthesized Ni(OH)2, we obtain the main diameters of D00l and Dhk0 as 31.40 and 185.95 nm, respectively. The synthesized Ni(OH)2 indeed is present in the shape of nanoplates with the [001] preferred growth and the degree (ηE) of the [001] preferred growth is 16.89%.
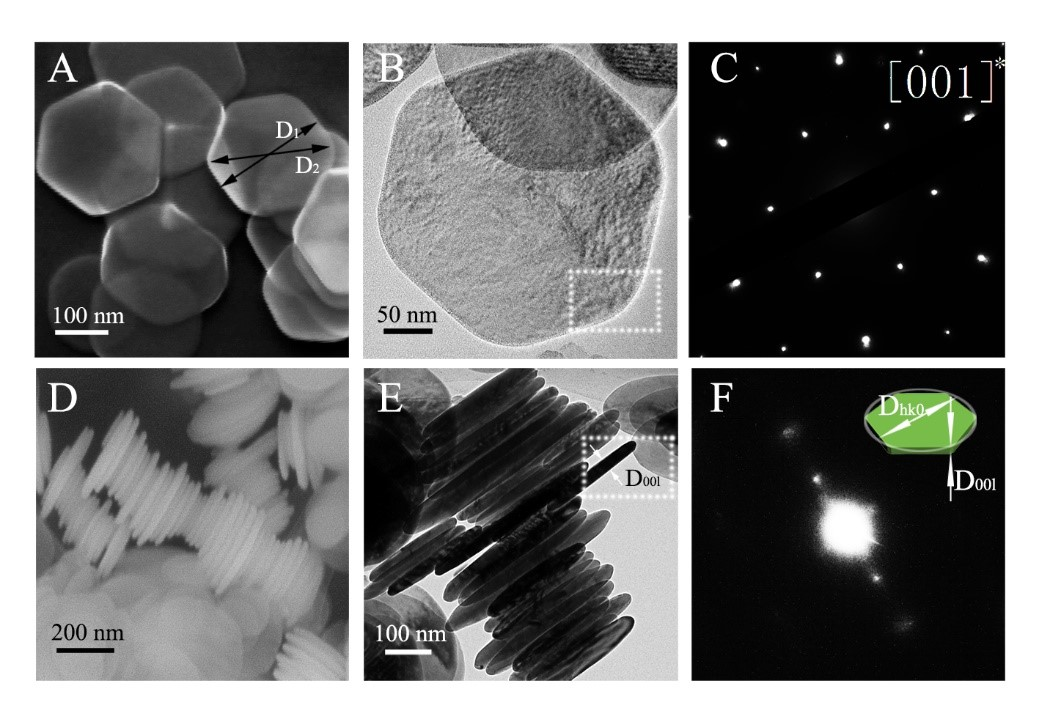
Figure 2A,B,D,E shows the SEM and TEM images of the synthesized Ni(OH)2, confirming the shape of nanoplates determined by the analysis of the XRD pattern via the whole powder pattern. Figure 2C depicts the selected area electron diffraction (SAED) pattern of the Ni(OH)2 nanoplates. If the diameter of a grain in the preferred direction is much longer or shorter than that of its normal directions, it can be rendered as the preferred growth. Thus, the Ni(OH)2 nanoplates exhibit six-fold symmetry about the [001] direction in accordance with the preferred growth obtained by X-ray diffraction. The synthesized Ni(OH)2 powder contains two-dimension nanoplates with the normal of the surface of the nanoplates being (001) and D001 being much smaller than Dhk0. To confirm the trigonal symmetry, in Figure 2C, the SAED pattern is shown for a single crystal Ni(OH)2 nanoplate. Thus, the degree of the preferred growth of Ni(OH)2 grains characterized by the X-ray diffraction could be revealed by the Ni(OH)2 nanoplates observation by SEM and TEM. It needs to point out that the phase-contrast images may not reveal the structure of the Ni(OH)2 nanoplates due to possible damage induced by electron beam with an energy of 200 KeV.
Figure 2D,E shows the SEM and TEM images of the side surfaces of the synthesized Ni(OH)2 nanoplates. The SAED pattern of the square area in Figure 2E is shown in Figure 2F. The one-way diffraction spots revel the spacing of [001] for the Ni(OH)2 nanoplates in consistence with the plane (001) normal of the surface of the nanoplates. Note that the crystal orientation cannot be indexed by the one-way diffraction pattern.
With using an ellipsoid model, Žunić and Dohrup proved that the average ellipsoid size follows an equivalent ellipsoidal function in X-ray diffraction [15]. As follows from Equation 1, the orientation distribution depends only on March parameter (r) and angle (θ), with no crystallite size being involved. However, the degree of the preferred Ni(OH)2 nanoplates could be determined from measuring the edge length of the preferred growth and its normal diameter. Thus, the preferred direction and normal direction diameters are measured to confirm the results in X-ray diffraction. In this paper, the degree of averaged crystallite shape in [001] preferred Ni(OH)2 is simply defined as the ratio of D00l and Dhk0 labelled in Figure 2F. From Figure 2D,E, we note that there are some Ni(OH)2 nanoplates tilted or truncated, and expect to obtain a distribution of the diameters of Dhk0 and D00l. Statistical analysis of the SEM and TEM images of the side surfaces of 288 Ni(OH)2 nanoplates was performed in Image J to calculate the diameters of Dhk0 and D00l. We obtain D00l of 24.34 ± 3.54 nm.
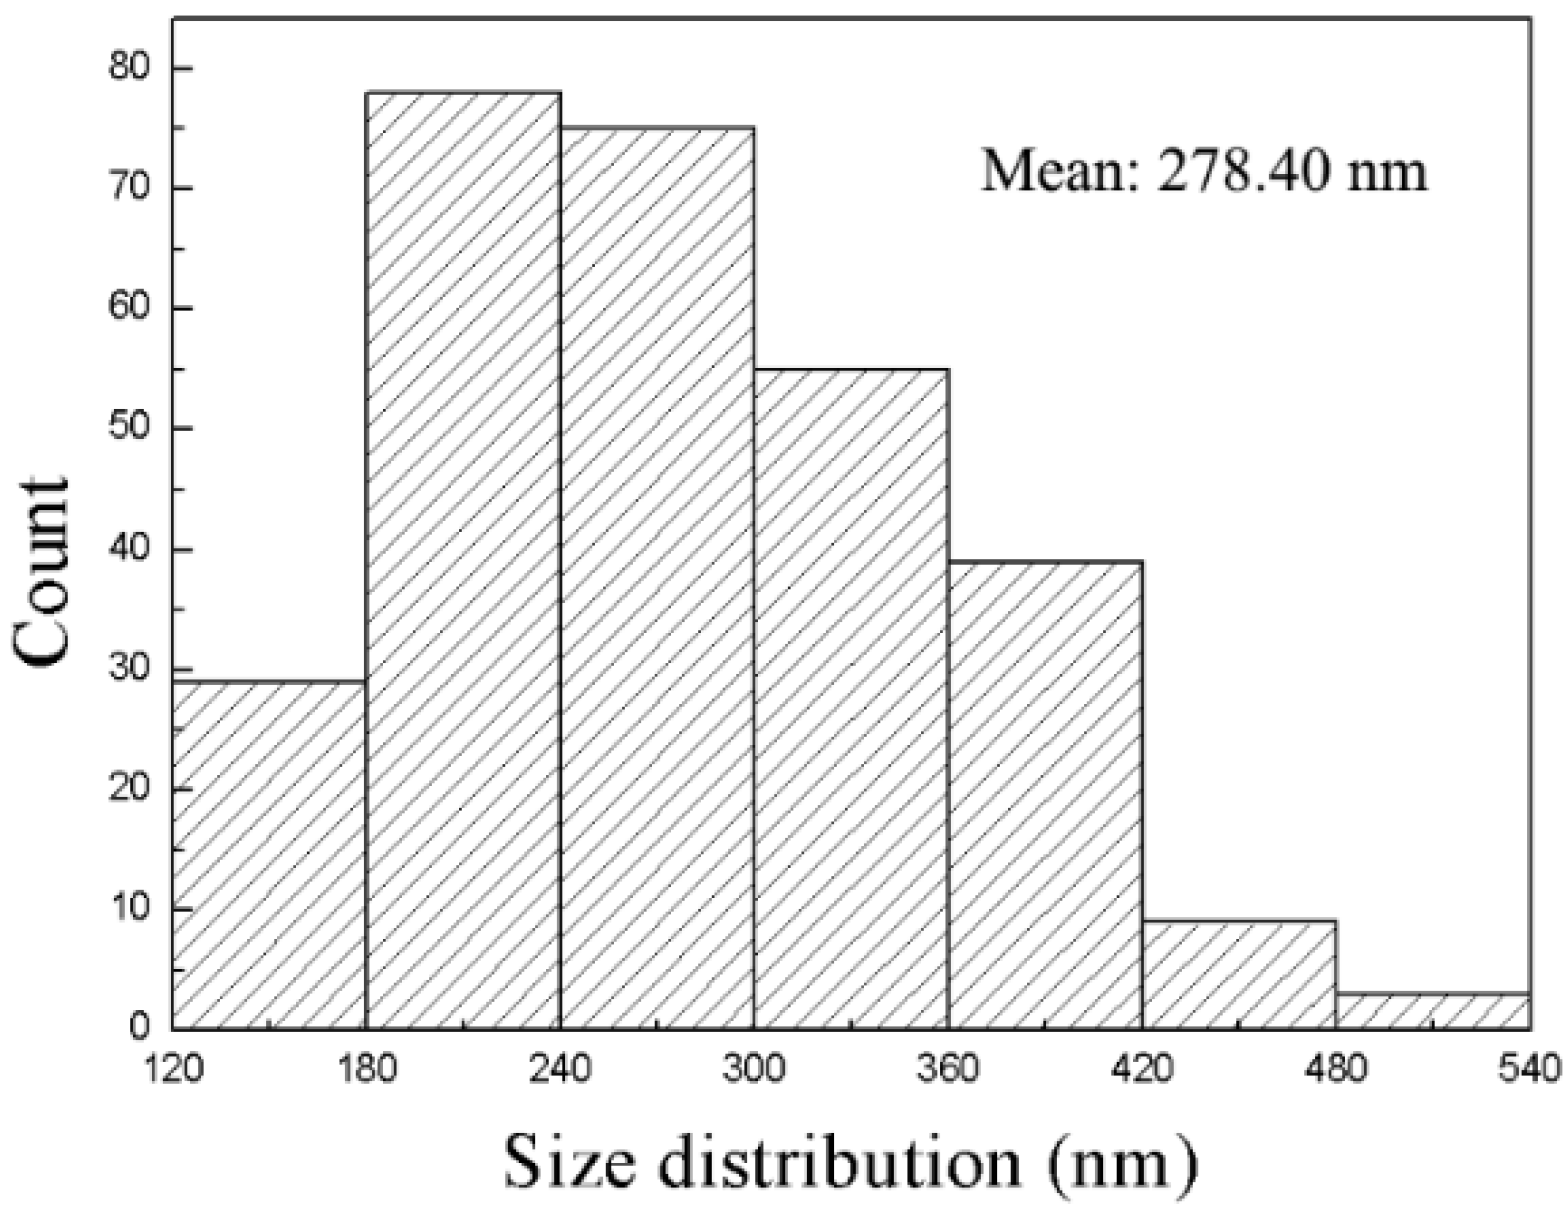
Figure 3 shows the distribution of Dhk0 of the Ni(OH)2 nanoplates over 288 nanoplates. The Dhk0 is in the range of 129.31–539.68 nm, and the averaged Dhk0 is 278.4 nm. Using the Dhk0 and D00l, we obtain the degree of [001] preferred growth as 8.74%. The λ-like distribution of the Dhk0 of the Ni(OH)2 nanoplates, as shown in Figure 3, reveals the difficulty in the counting of Ni(OH)2 nanoplates of small diameters, resulting in smaller ηM than ηX. We conclude that the degree of the [001] preferred growth of the Ni(OH)2 nanoplates, ηX, calculated by the WPPF reflects the degree of the [001] preferred growth of the Ni(OH)2 nanoplates, ηM.
Compared the values of 278.40 and 24.34 nm of Dhk0 and D00l measured by SEM and TEM with those of 185.95 and 31.40 nm calculated from the ellipsoidal model, we note that there are significant differences between the corresponding values. The shape function of crystallites is not suitable for the description of the shape of nanoplates, and the calculated values cannot be used to represent diameters of Dhk0 and D00l of the Ni(OH)2 nanoplates.
For the situation when the shape parameters of crystallites cannot be accounted for the actual sizes, an average spherical shape can be assumed. Using the Halder-Wagner’s method, we can calculate Dhk0 from the slope of the line plotting of β 2 / tan 2 θ vs. β / tan θ sin θ for the FWHM of (100), (110)and (200) and D00l from the FWHM of (001), (002), (003) and (004) [16]. As shown in Figure S1 the calculated diameters of D00l and Dhk0 are 22.2 ± 1.3 and 93.7 ± 14.1 nm, respectively. The edge length in [001] of the Ni(OH)2 is in good relation to the results 24.34 nm determined by SEM and TEM images. The diameter of the crystallites below 100 nm will result the widening in the diffraction peaks, which may be accounted for the inappropriate edge length in [hk0] [14].

4. Summary

We have synthesized Ni(OH)2 nanoplates without the use of any complex anion. Three different methods are used to analyze the degree of preferred growth of the Ni(OH)2 nanoplates. Using the March-Dollase method and the whole powder pattern fitting method, we obtain the March parameter of r001 = 0.8113 through the texture refinement. The degree of [001] preferred growth of the Ni (OH)2 nanoplates, ηX, is found to be 12.00% from the March parameter of r001 and the normalized expression given by Zolotoyabko. The shape function of crystallites is not suitable to directly describe the shape of the Ni(OH)2 nanoplates. Using the Halder-Wagner’s method, we obtain the edge length of D001 as 22.2 ± 1.3 nm that is in good relation to the results measured by SEM and TEM imaging. The TEM imaging of the Ni(OH)2 nanoplate reveals that the Ni(OH)2 nanoplates exhibit six-fold symmetry about the [001] being the preferred growth. The measured degree of [001] preferred growth of the Ni(OH)2 nanoplates, ηM, is 8.74%, slightly less than ηx. The March parameter and the expression given by Zolotoyabko can be used to effectively calculate the degree of preferred growth of nanostructural materials (0 < r < 1), which can be extended to the analysis of block materials.

Supplementary Materials

The following are available online at https://www.mdpi.com/2079-4991/8/12/991/s1, Figure S1: The simulated linear function with Halder-Wagner’s method. The Diameters of D00l and Dhk0 are determined.

Author Contributions

Taotao Li, conceptualization, methodology, software and writing-original draft preparation. Wanggang zhang and Fuqian yang, writing-review & editing and visualization. Funding Acquisition, Pro. Wei Liang. Ning Dang, discussion on the preferred orientation and preferred growth.

Funding

This work was supported by the National Natural Science Foundation of China (No. 51274149, NO. 51175363 and NO. 51474152) and Projects of International Cooperation in Shanxi, No.:201603D421026.

Acknowledgments

I am much indebted to Dr. Huihu Lu in Taiyuan University of Technology for his kind interest and supervision.

Conflicts of Interest

The authors declare no conflict of interest.

References

  1. Zolotoyabko, E. Determination of the degree of preferred orientation within the March-Dollase approach. J. Appl. Crystallogr. 2009, 42, 513–518. [Google Scholar] [CrossRef]
  2. Atuchin, V.V.; Chimitova, O.D.; Gavrilova, T.A.; Molokeev, M.S.; Kim, S.J.; Surovtsev, N.V.; Bazarov, B.G. Synthesis, structural and vibrational properties of microcrystalline RbNd(MoO4)2. J. Cryst. Growth 2011, 318, 683–686. [Google Scholar] [CrossRef]
  3. Atuchin, V.V.; Beisel, N.F.; Kokh, K.A.; Kruchinin, V.N.; Korolkov, I.V.; Pokrovsky, L.D.; Tsygankova, A.R.; Kokh, A.E. Growth and microstructure of heterogeneous crystal GaSe:InS. Crystengcomm 2013, 15, 1365–1369. [Google Scholar] [CrossRef]
  4. Li, B.L.; Godfrey, A.; Meng, Q.C.; Liu, Q.; Hansen, N. Microstructural evolution of IF-steel during cold rolling. Acta Mater. 2004, 52, 1069–1081. [Google Scholar] [CrossRef]
  5. Liu, H.; Liu, Z.; Cao, G.; Li, C.; Wang, G. Microstructure and texture evolution of strip casting 3 wt% Si non-oriented silicon steel with columnar structure. J. Magn. Magn. Mater. 2011, 323, 2648–2651. [Google Scholar] [CrossRef]
  6. Song, H.Y.; Liu, H.T.; Lu, H.H.; An, L.Z.; Zhang, B.G.; Liu, W.Q.; Cao, G.M.; Li, C.G.; Liu, Z.Y.; Wang, G.D. Fabrication of grain-oriented silicon steel by a novel way: Strip casting process. Mat. Lett. 2014, 137, 475–478. [Google Scholar] [CrossRef]
  7. Li, T.; Dang, N.; Liang, M.; Guo, C.; Lu, H.; Ma, J.; Liang, W. TEM observation of general growth behavior for silver electroplating on copper rod. Appl. Surf. Sci. 2018, 451, 148–154. [Google Scholar] [CrossRef]
  8. Mao, Y.; Li, T.; Guo, C.; Zhu, F.; Zhang, C.; Wei, Y.; Hou, L. Cycling stability of ultrafine β-Ni(OH)2 nanosheets for high capacity energy storage device via a multilayer nickel foam electrode. Electrochim. Acta 2016, 211, 44–51. [Google Scholar] [CrossRef]
  9. Ghoshal, T.; Kar, S.; Chaudhuri, S. Synthesis of nano and micro crystals of Cd(OH)2 and CdO in the shape of hexagonal sheets and rods. Appl. Surf. Sci. 2007, 253, 7578–7584. [Google Scholar] [CrossRef]
  10. March, A. Mathematische Theorie der Regelung nach der Korngestah bei affiner Deformation. Z. Krist.-Cryst. Mater. 1932, 81, 285–297. [Google Scholar] [CrossRef]
  11. Dollase, W.A. Correction of intensities for preferred orientation in powder diffractometry: Application of the March model. J. Appl. Crystallogr. 1986, 19, 267–272. [Google Scholar] [CrossRef]
  12. Pawley, G.S. Unit-cell refinement from powder diffraction scans. J. Appl. Crystallogr. 1981, 14, 357–361. [Google Scholar] [CrossRef] [Green Version]
  13. Cairns, R.W.; Ott, E. X-Ray Studies of the System Nickel-Oxygen-Water. I. Nickelous Oxide and Hydroxide1. J. Am. Chem. Soc. 1933, 55, 527–533. [Google Scholar] [CrossRef]
  14. Langford, J.I.; Wilson, A.J.C. Scherrer after sixty years: A survey and some new results in the determination of crystallite size. J. Appl. Crystallogr. 1978, 11, 102–113. [Google Scholar] [CrossRef] [Green Version]
  15. Balić Žunić, T.; Dohrup, J. Use of an ellipsoid model for the determination of average crystallite shape and size in polycrystalline samples. Powder Diffr. 1999, 14, 203–207. [Google Scholar] [CrossRef]
  16. Halder, N.C.; Wagner, C.N.J. Separation of particle size and lattice strain in integral breadth measurements. Acta Crystallogr. 1966, 20, 312–313. [Google Scholar] [CrossRef] [Green Version]
Figure 1. (A) The measured and simulated XRD spectra (the smaller the value of Rwp, or the closer the value of S to 1, the better is the match between the measured and simulated data), and (B) the simulated XRD diffraction spectra with strong preferred orientation of the [001] type (rn = 1 (sphere) without preferred orientation; rn < 1 with the preferred orientation by plate crystallites; and rn > 1 with the preferred orientation by needle crystallites).
Nanomaterials 08 00991 g001
Figure 2. (A) SEM and (B) TEM images of Ni(OH)2 nanoplates (top view), (C) SAED pattern of the square area in B, (D) SEM and (E) TEM mages of Ni(OH)2 nanoplates (side view), and (F) SAED pattern of the square area in E (The inset in F is a schematic of a Ni(OH)2 nanoplate showing the diameter of Dhk0 and D00l).
Nanomaterials 08 00991 g002
Figure 3. Distribution of Dhk0 of the Ni(OH)2 nanoplates over 288 nanoplates.
Nanomaterials 08 00991 g003
Table 1. FWHM (β) of the measured peaks of Ni(OH)2 after the correction of the instrumental broadening by external standard method (Si) from Rigaku.
2θ (°)Int. W (°)hkl2θ (°)Int. W (°)hkl
19.1470.39500169.2010.09200
32.8770.08310070.240.53103
38.3800.23510172.5450.40201
38.920.5400282.430.38202
51.9200.3810283.910.33004
58.8600.14311093.100.46104
60.220.4300398.450.42203
62.5290.22111
Table 2. Coefficients of the ellipsoid in simulating the preferred growth of Ni(OH)2 (the ellipsoid is characterized by six coefficients).
b11b22b33b12b13b23
7.029E-87.029E-88.506E-73.515E-800

