An Ab Initio Study of Pressure-Induced Reversal of Elastically Stiff and Soft Directions in YN and ScN and Its Effect in Nanocomposites Containing These Nitrides


Abstract
1. Introduction
2. Methods
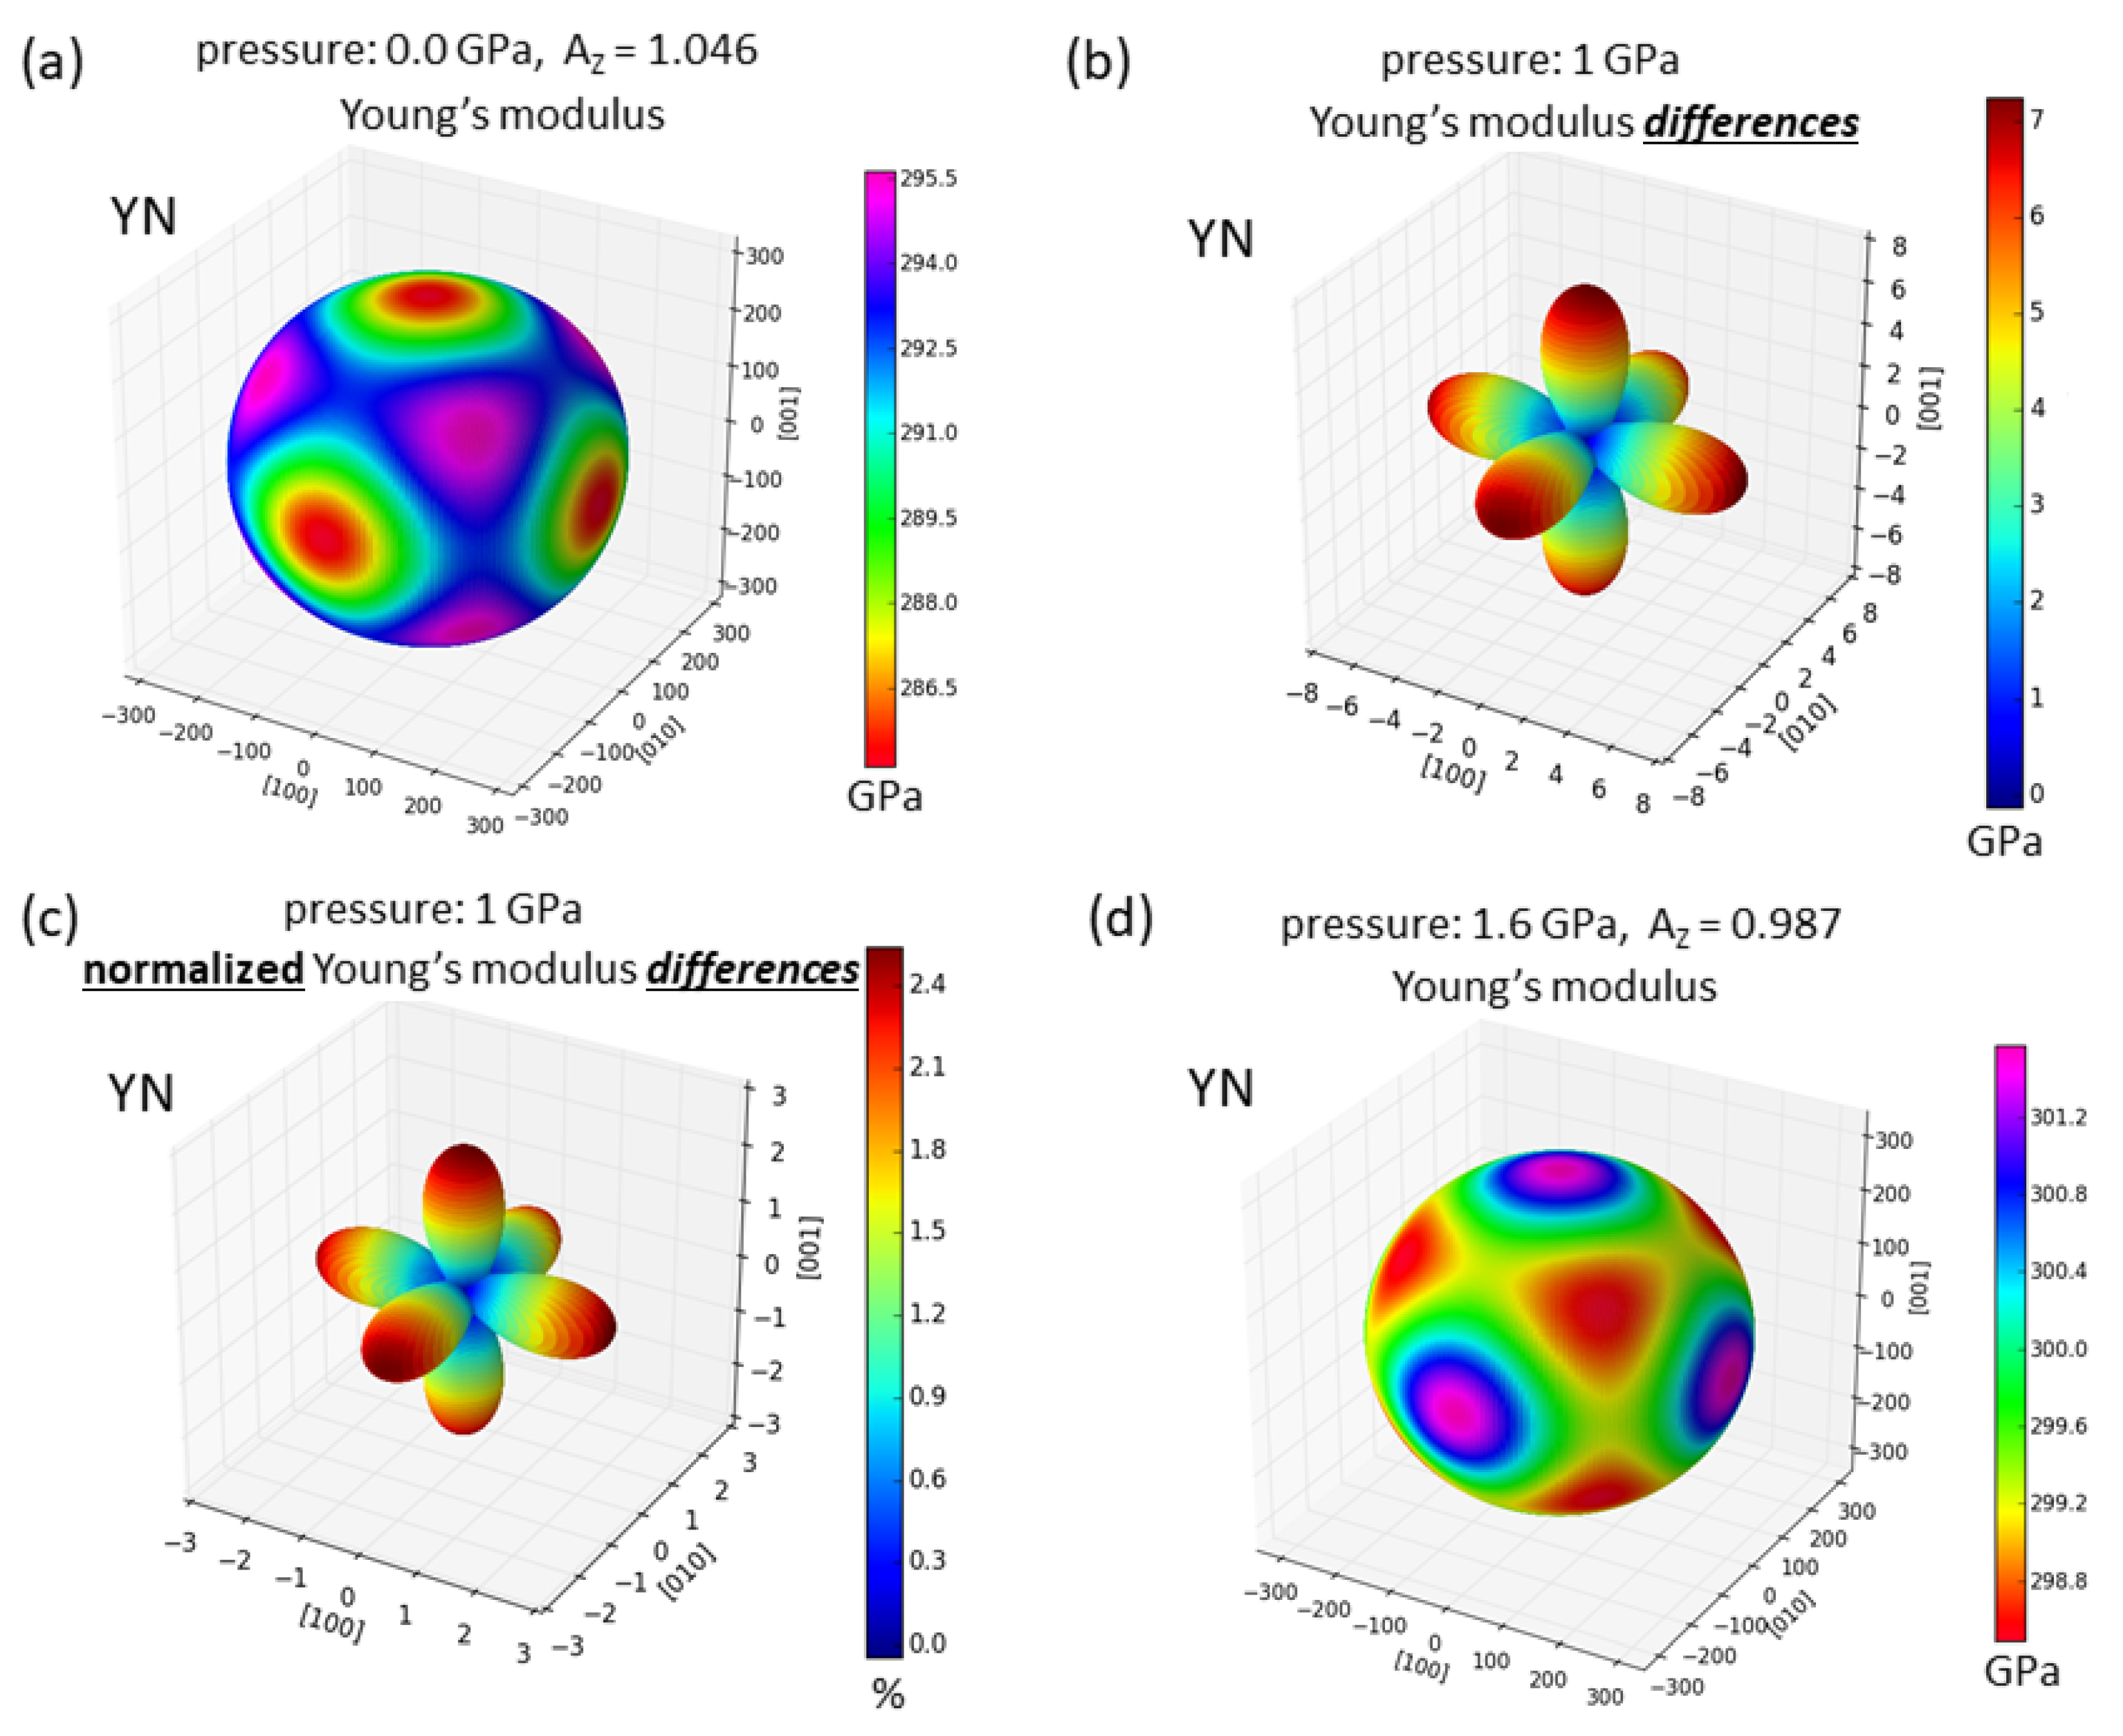
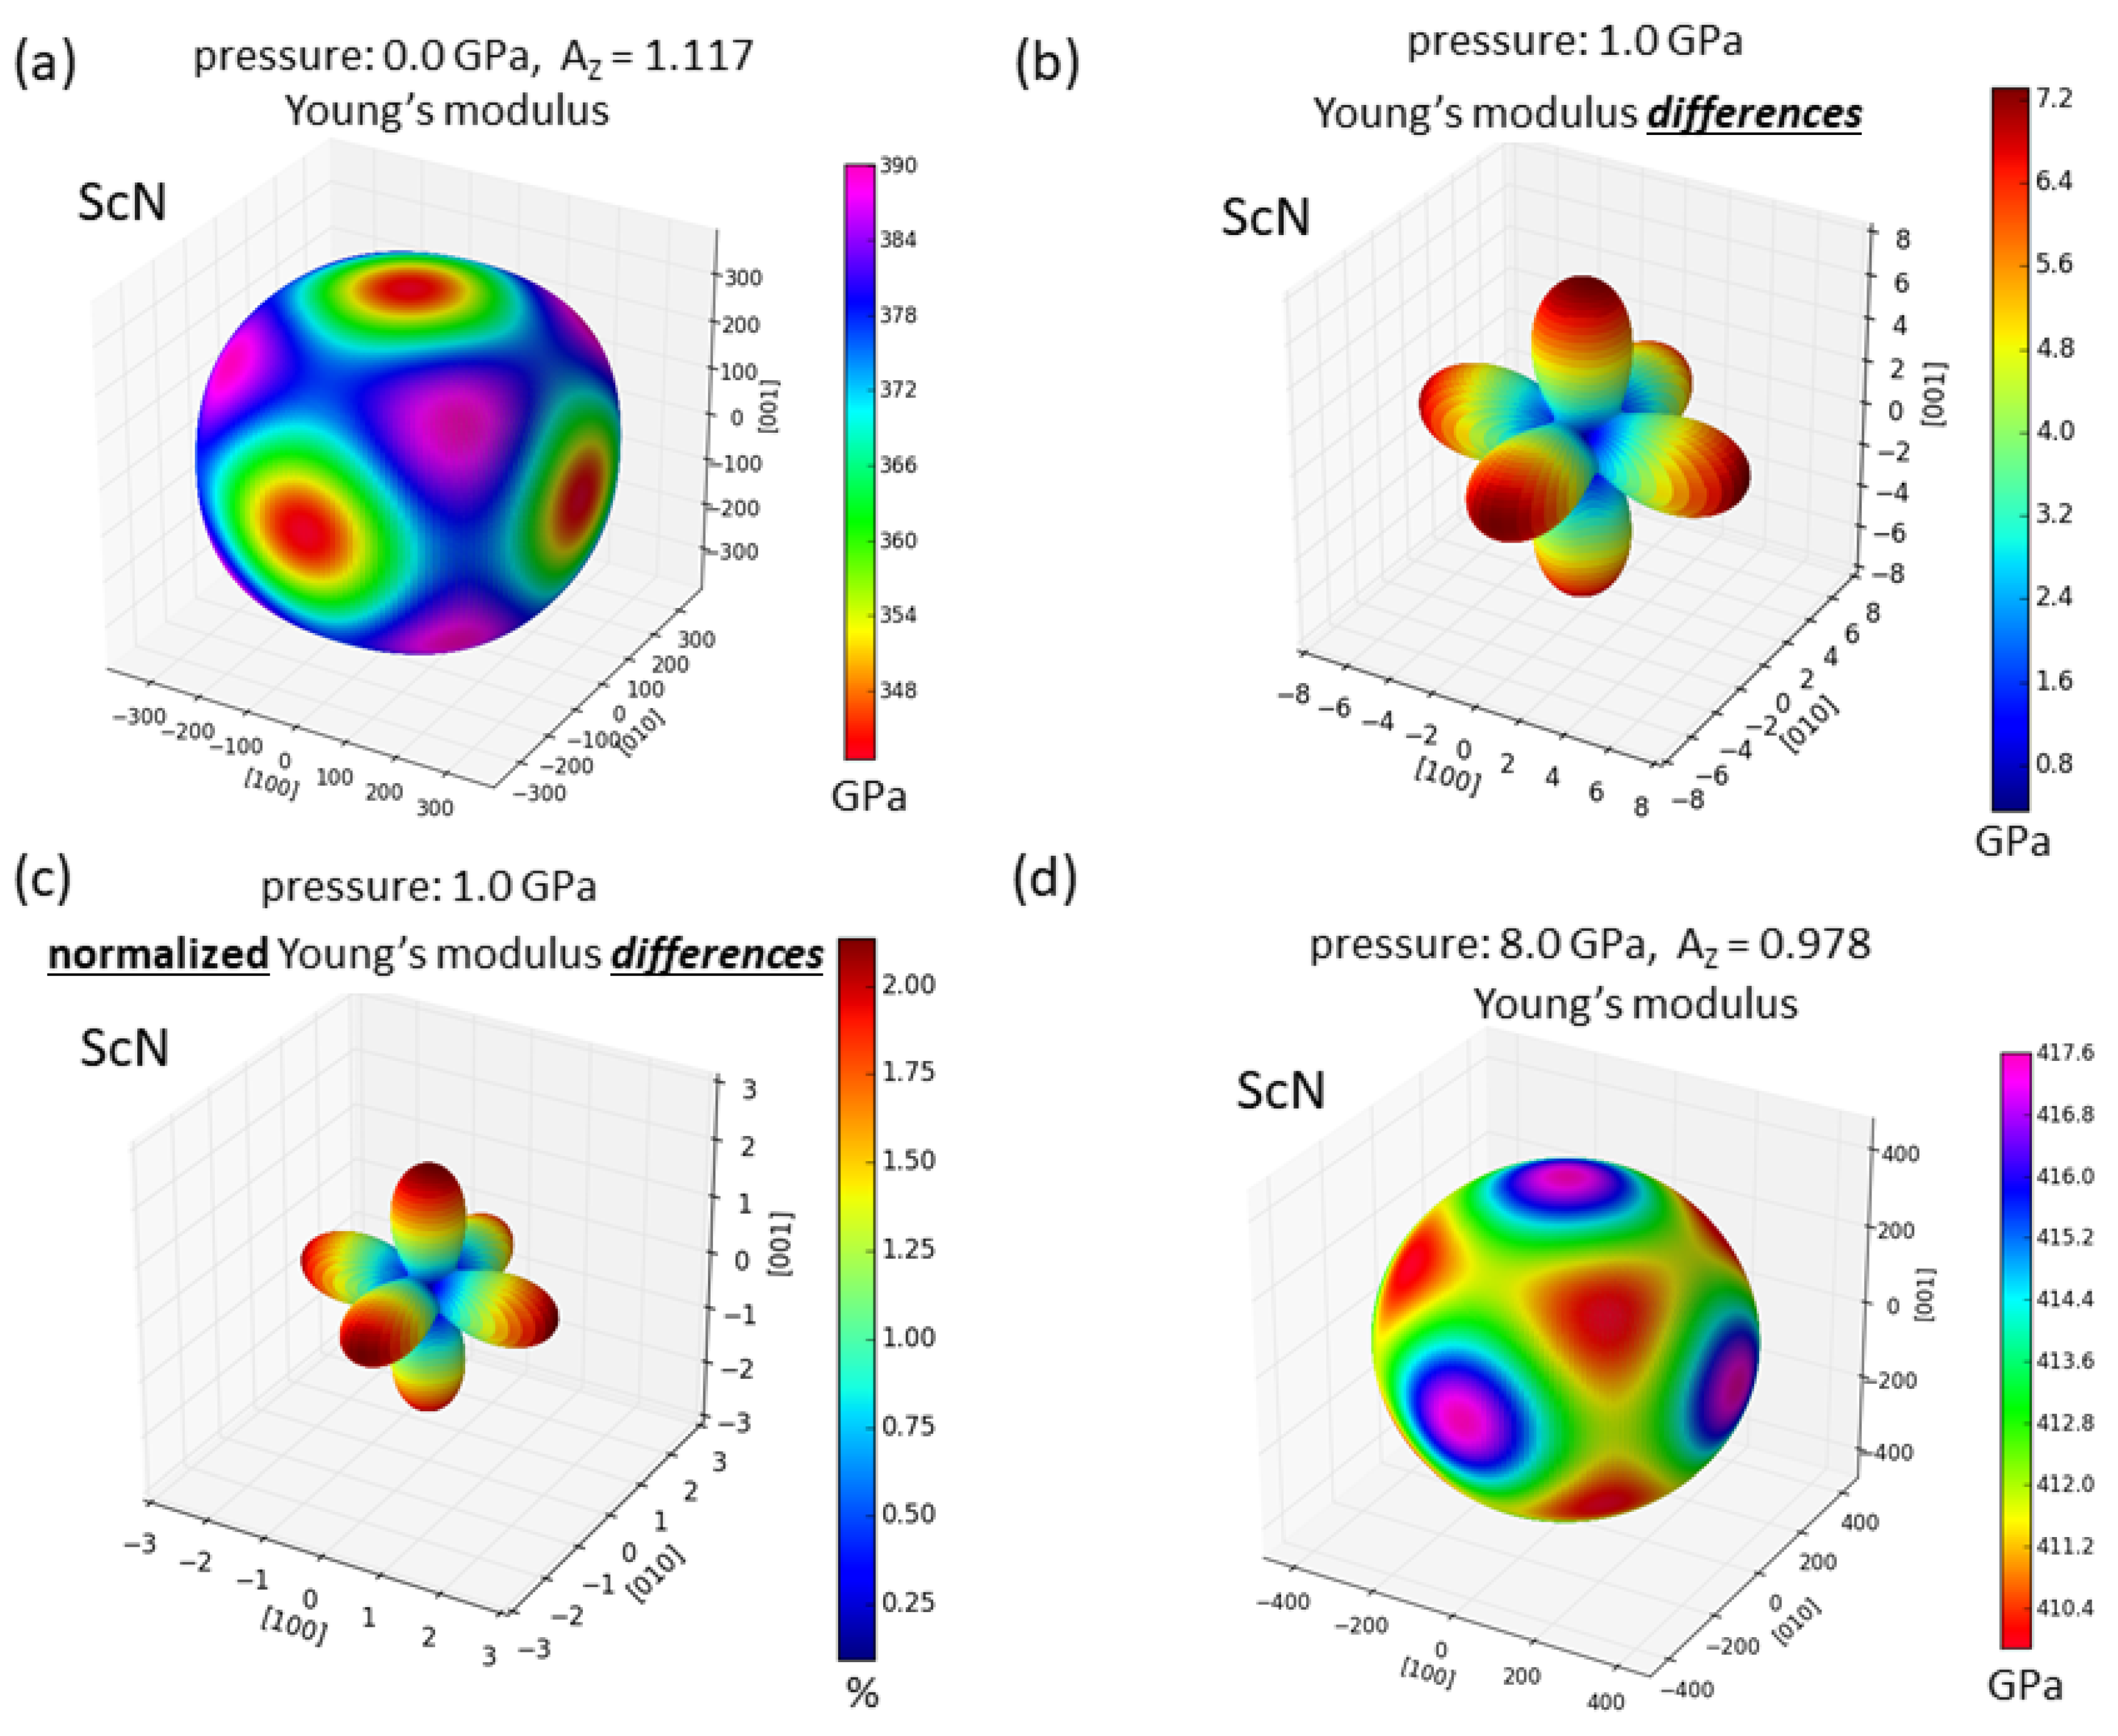
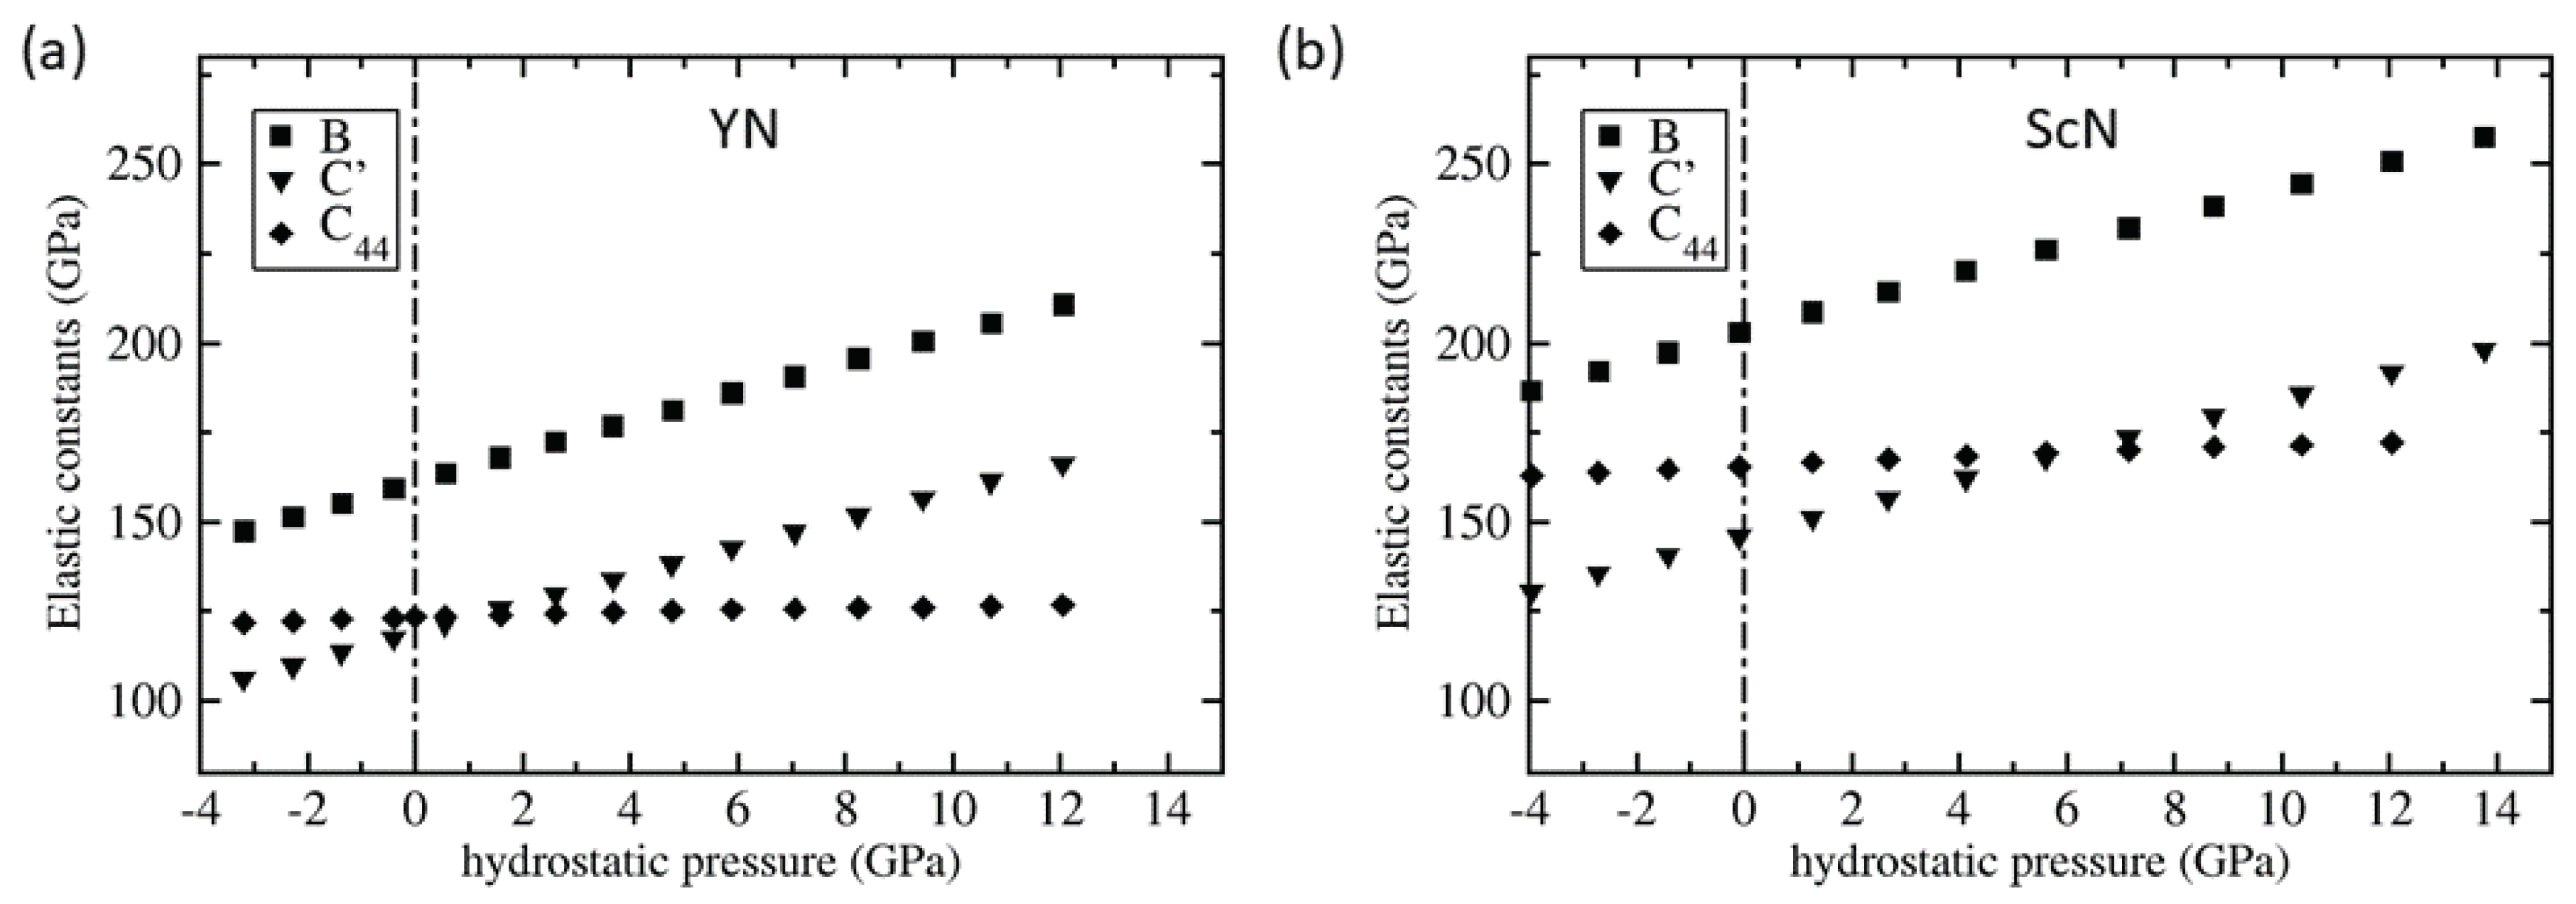
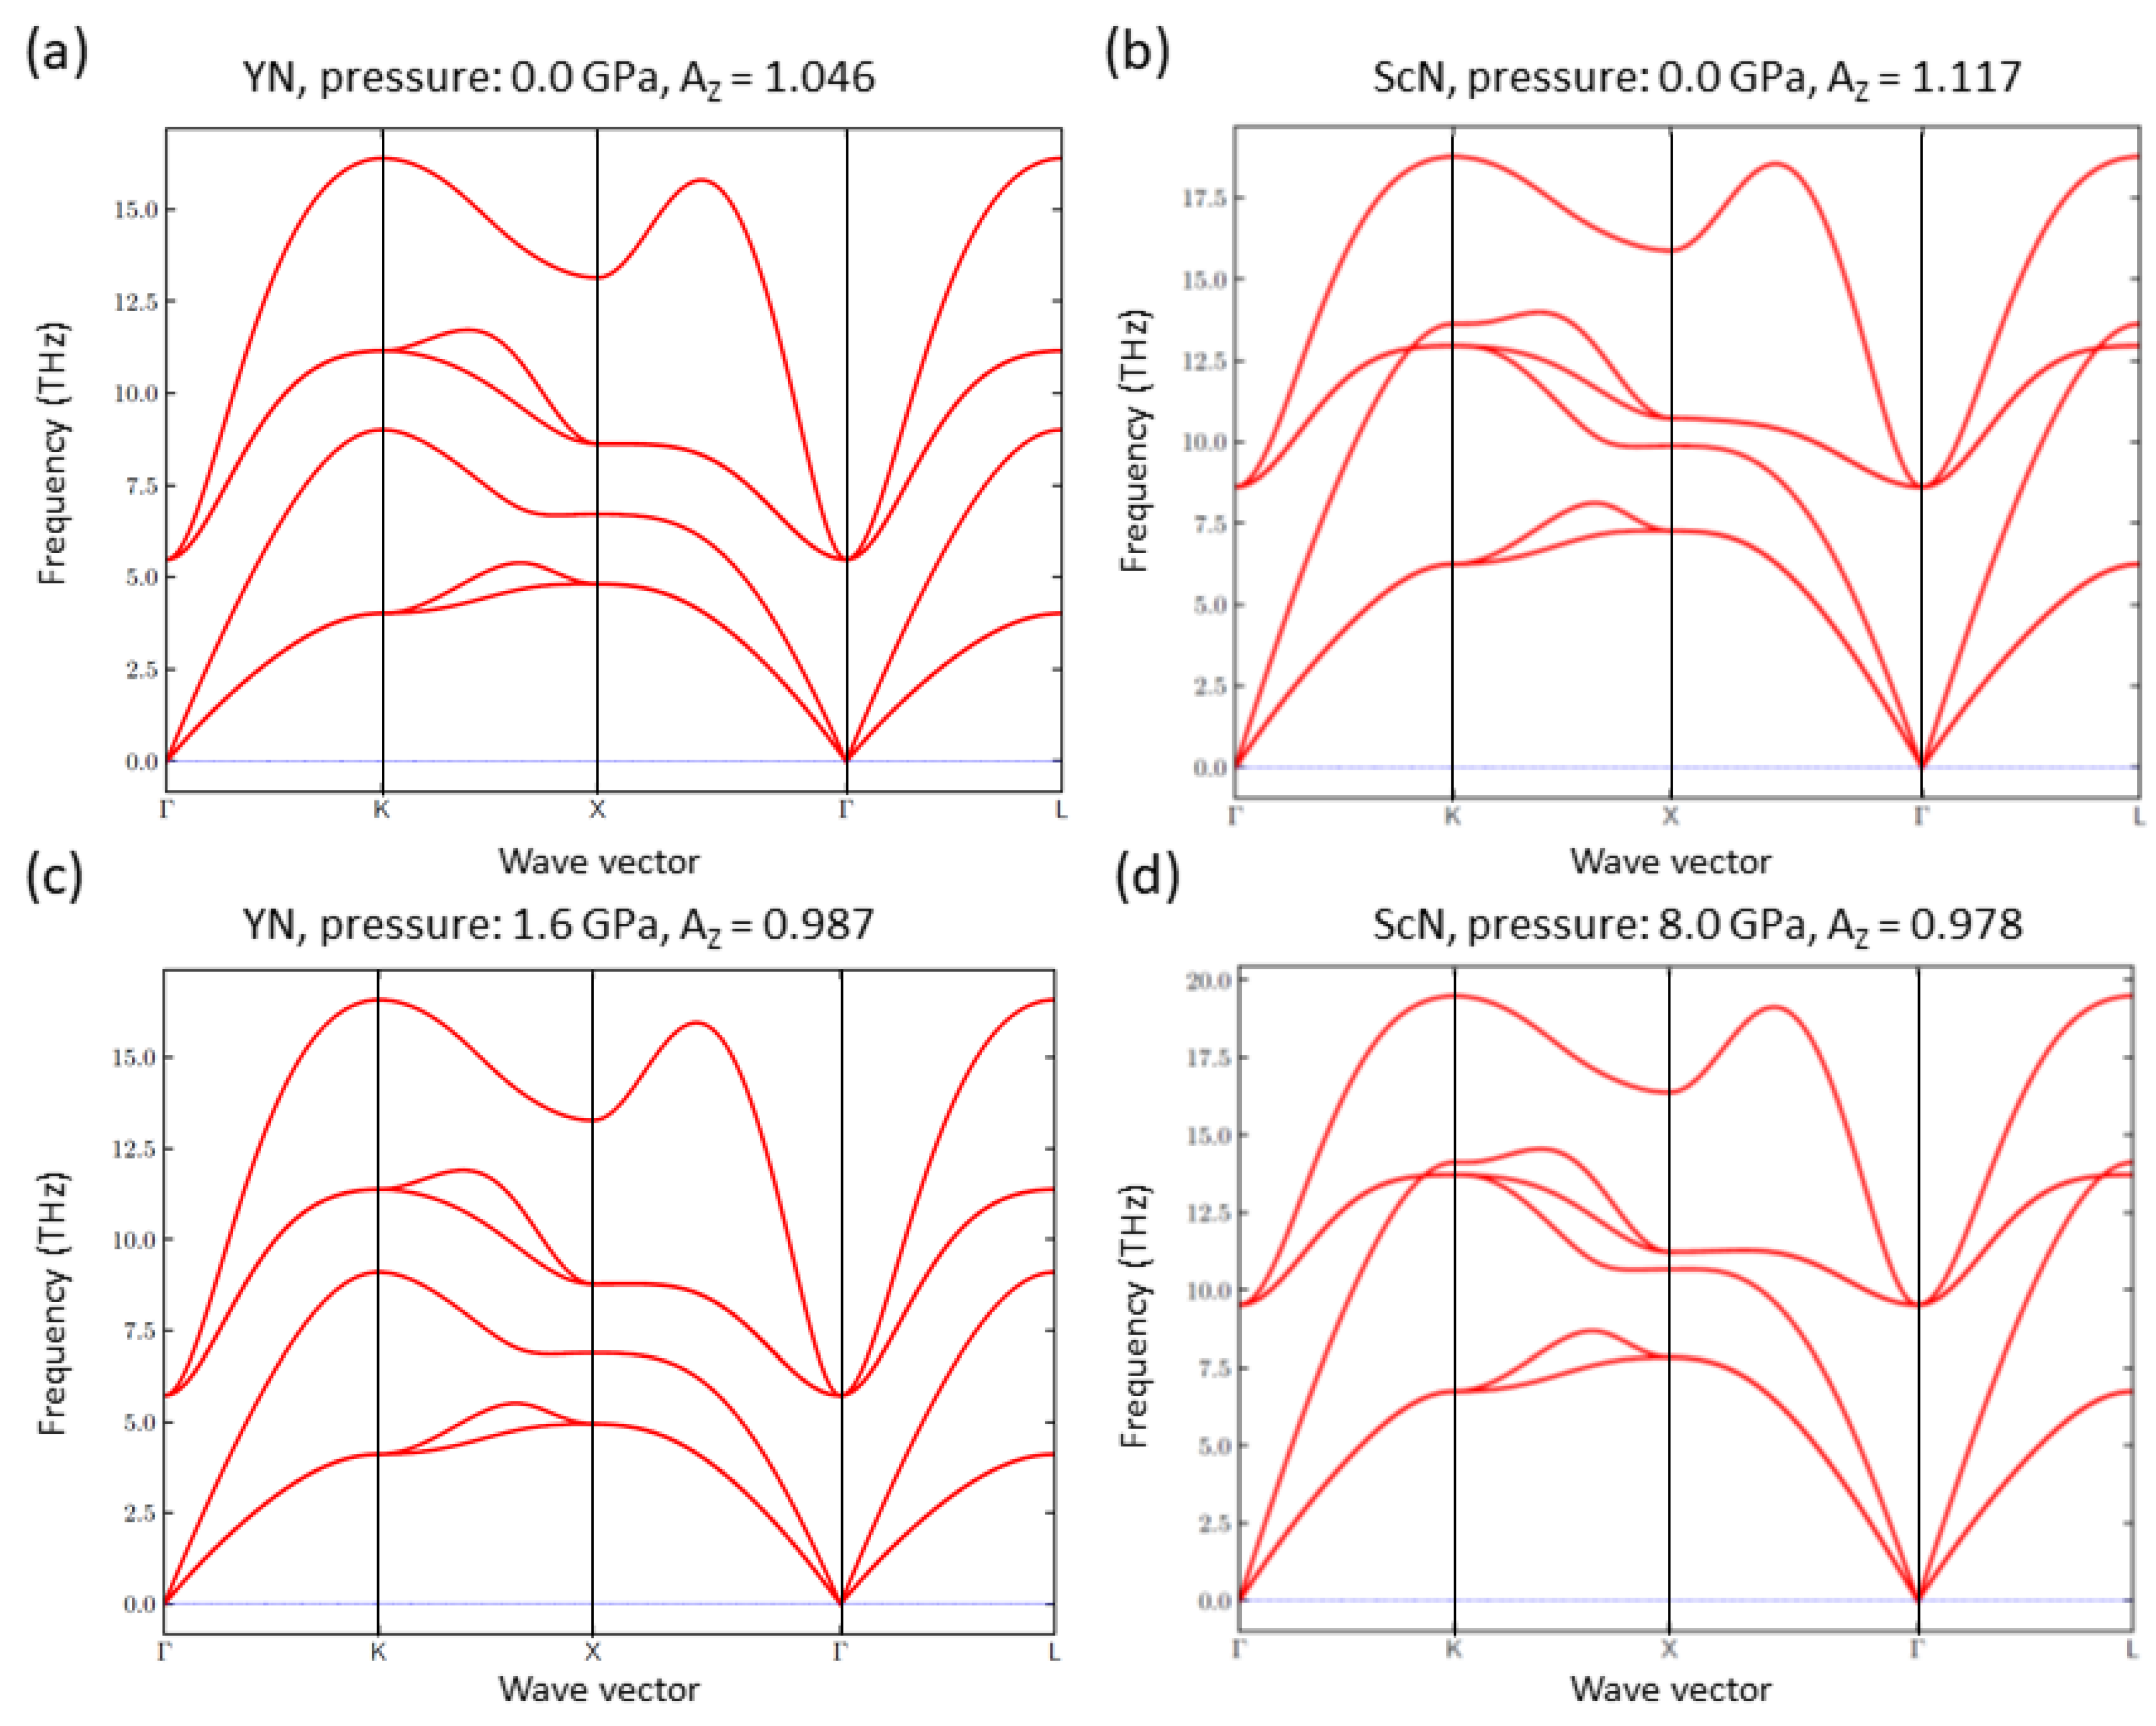
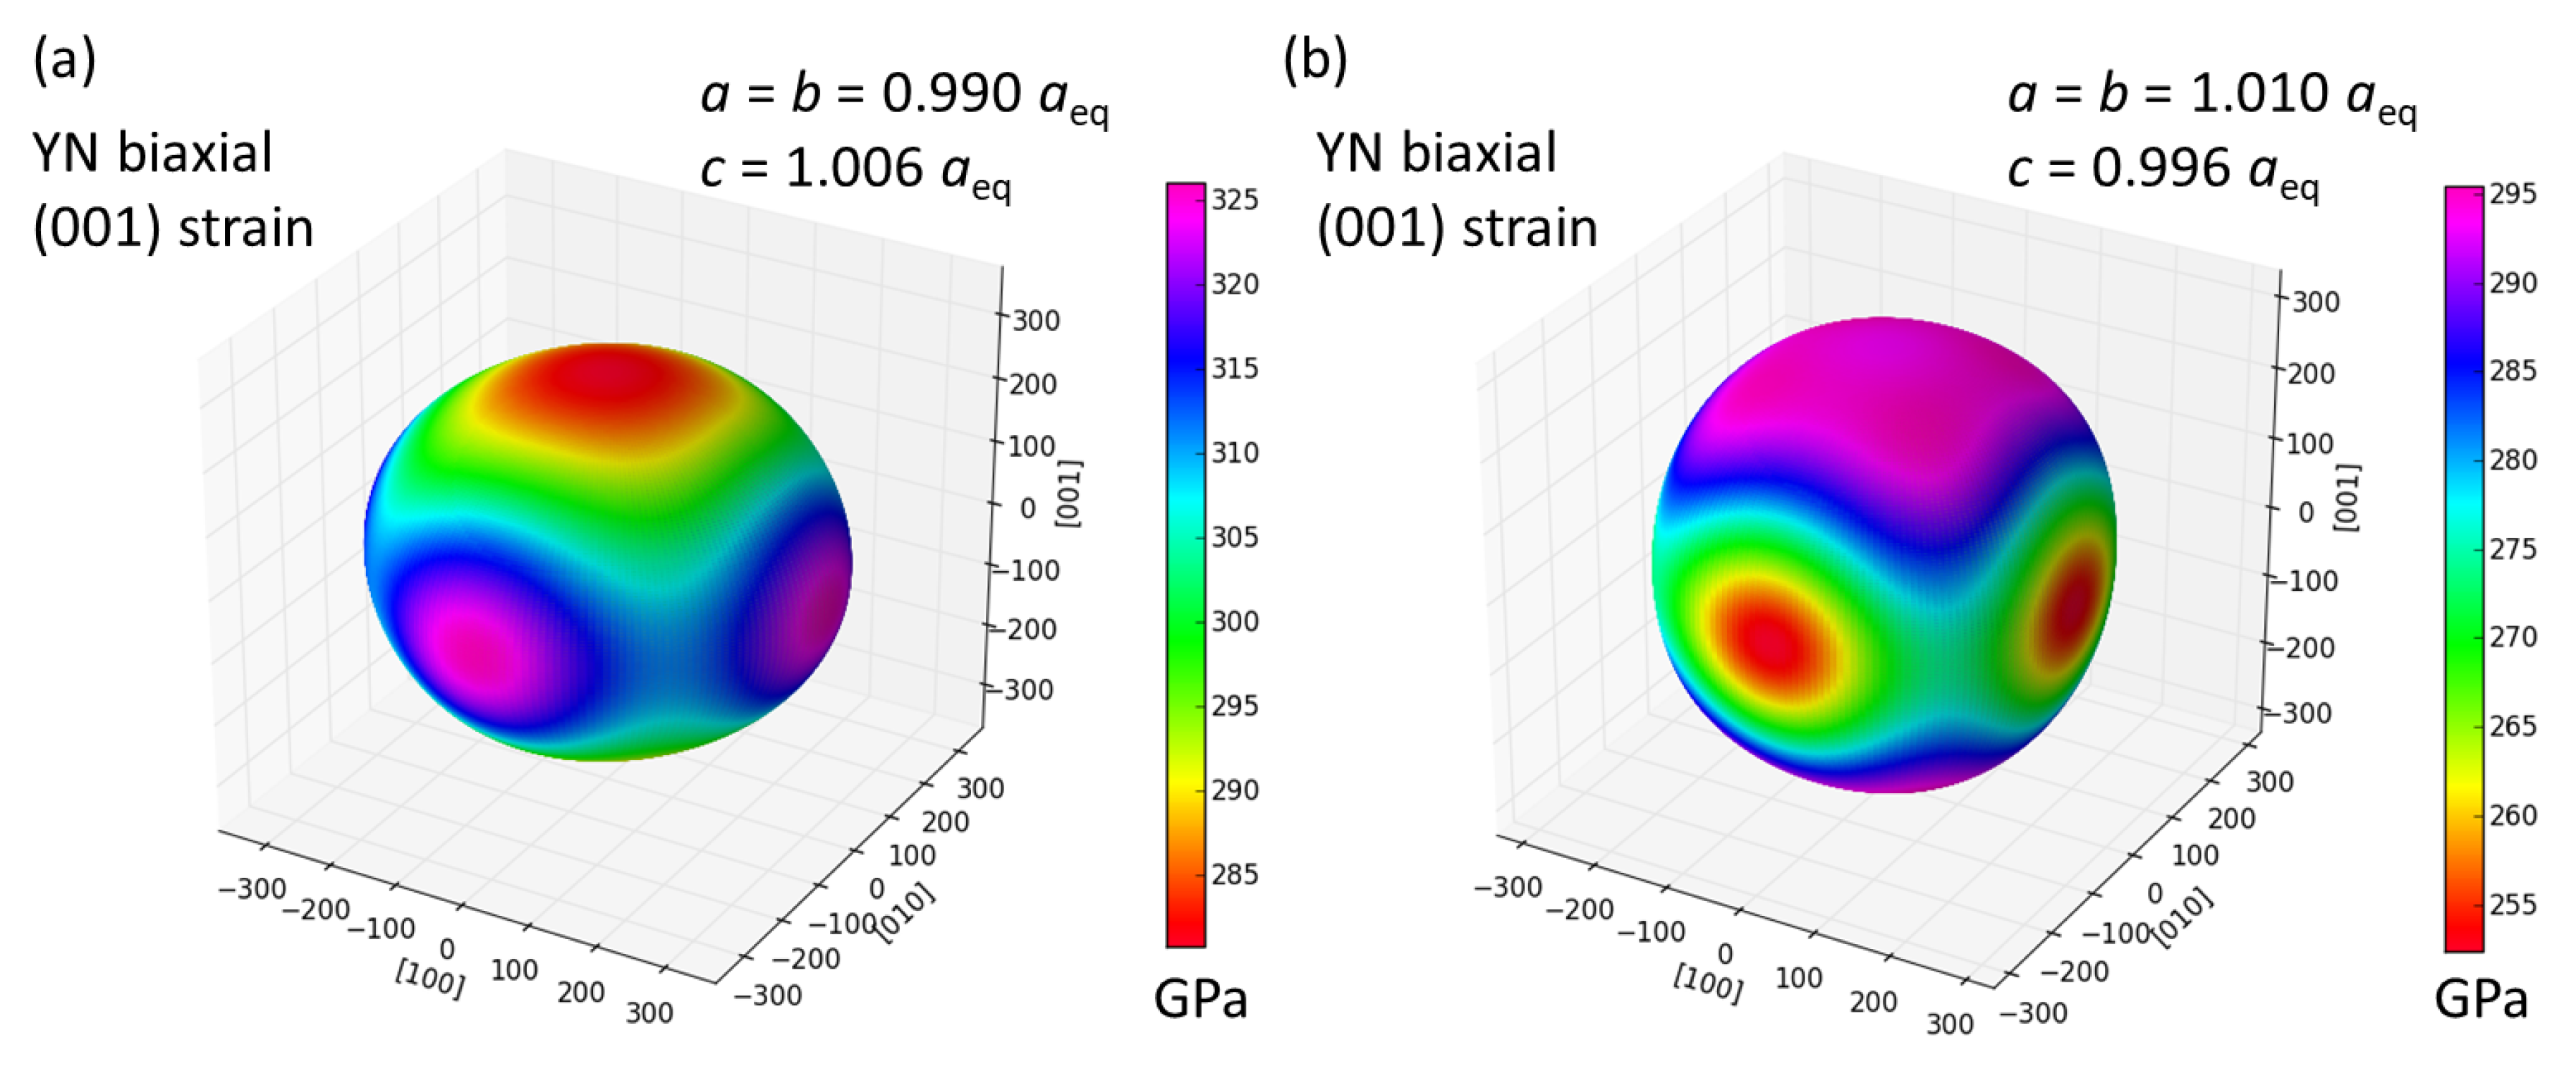
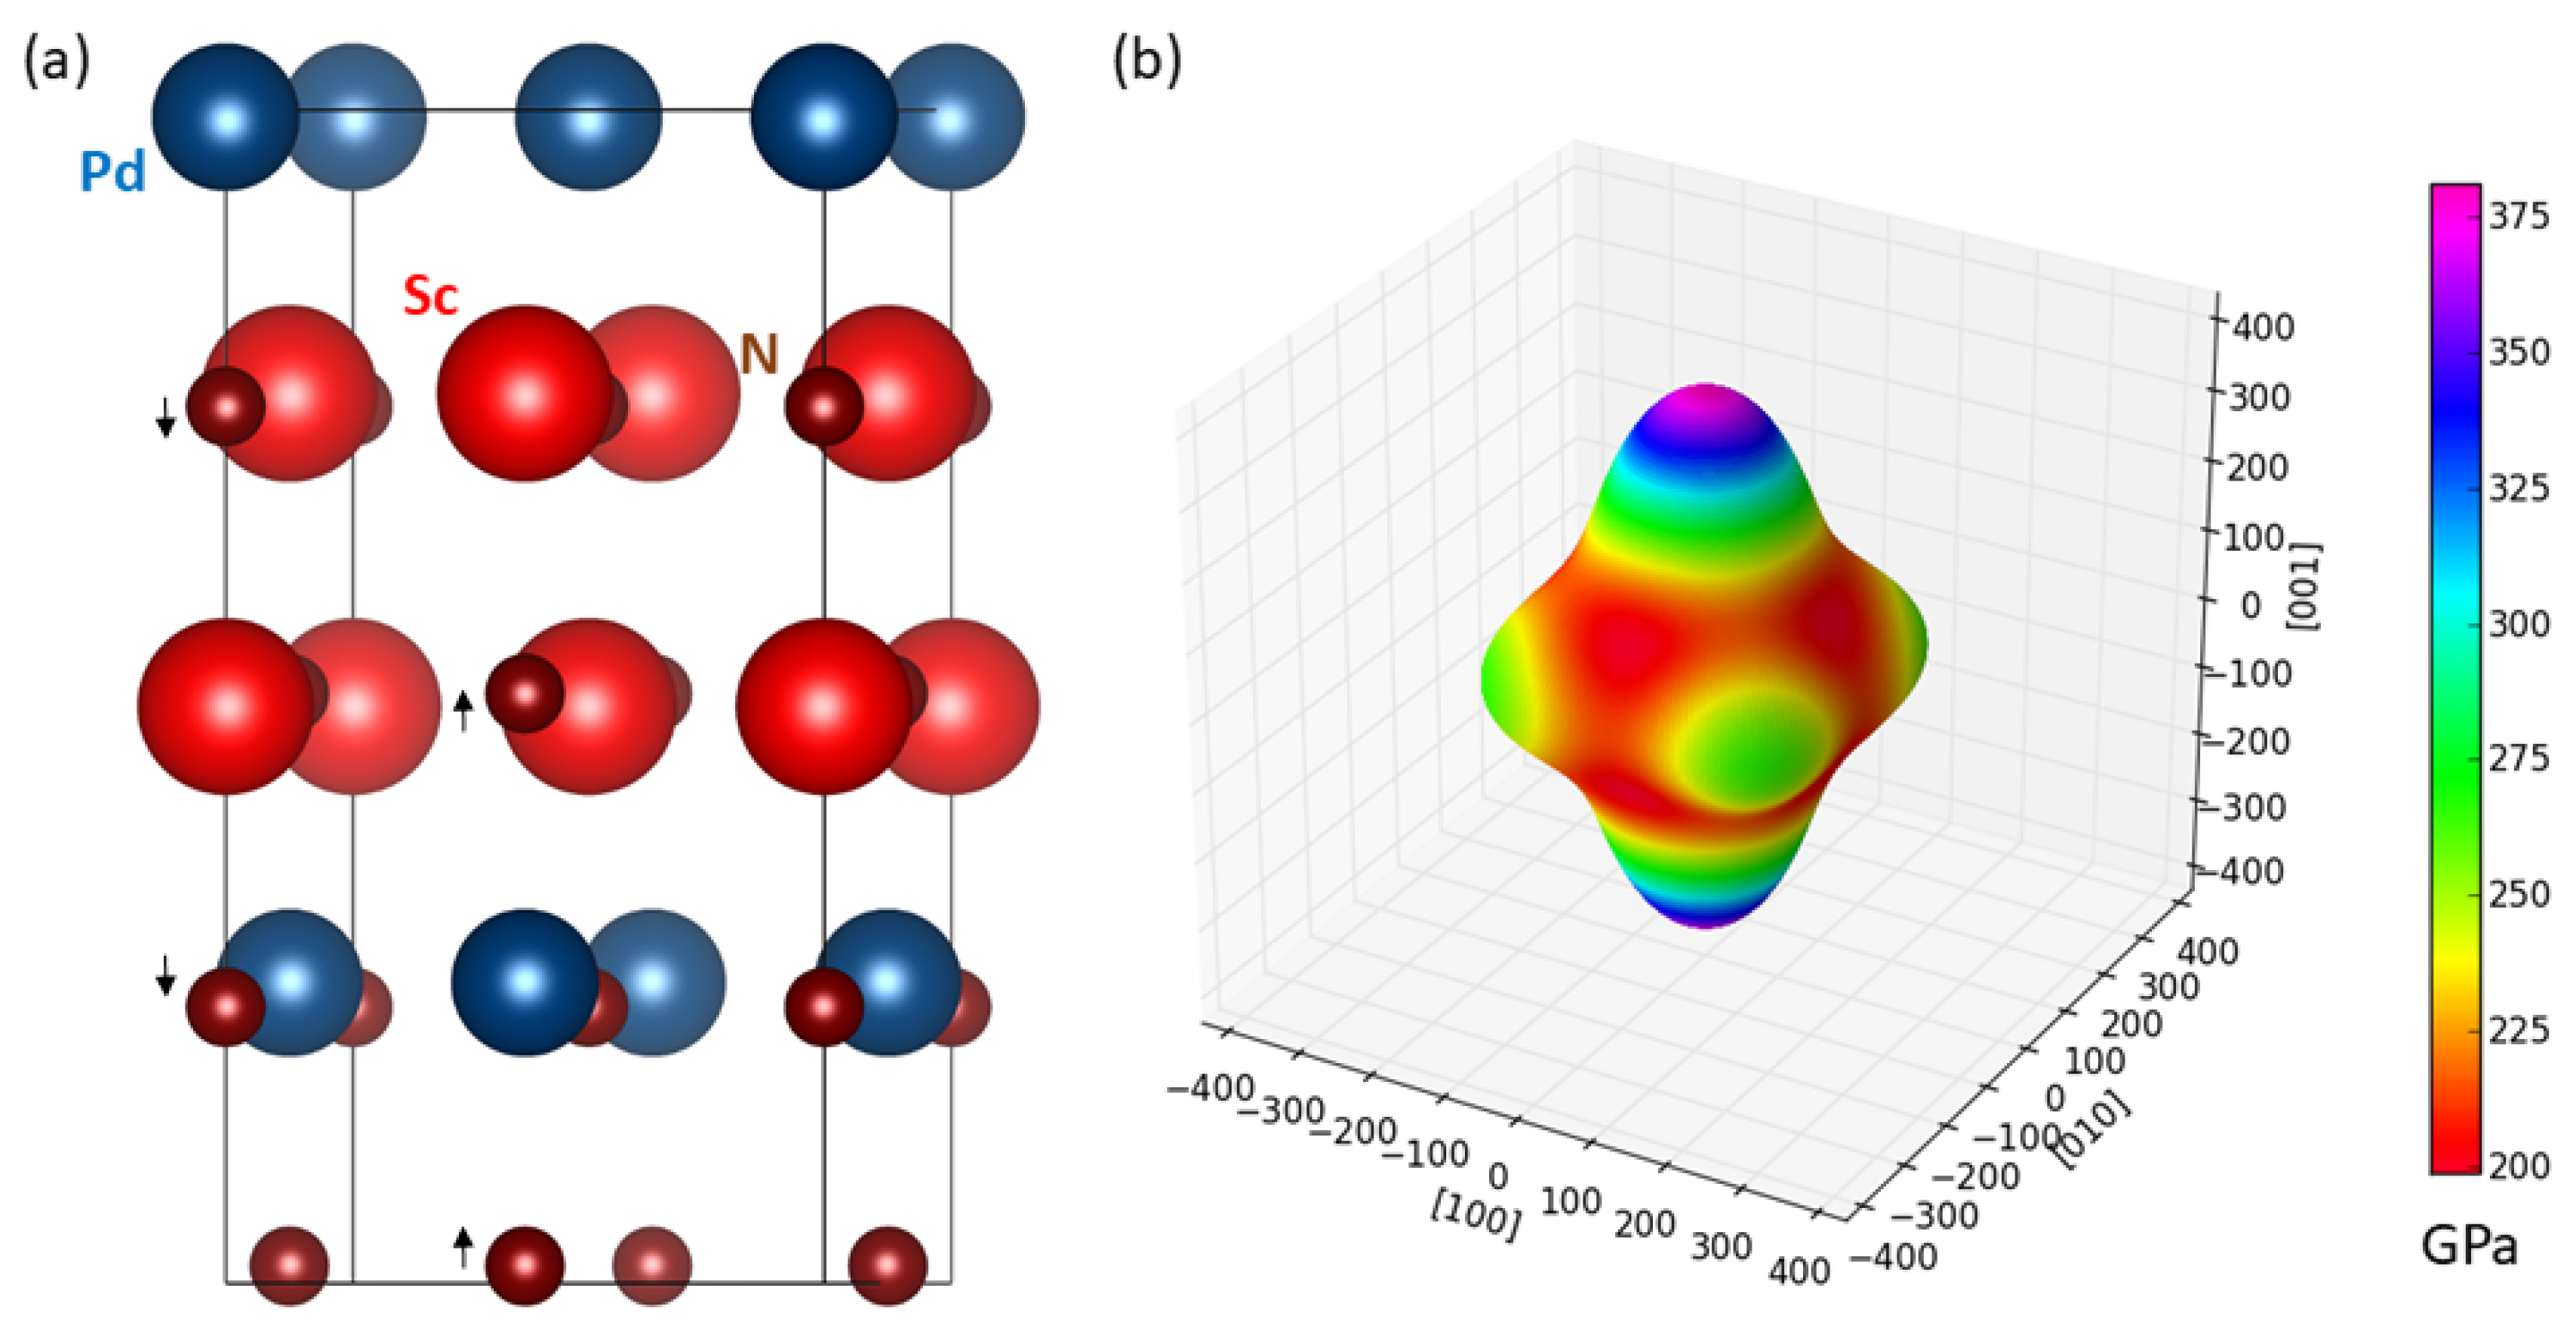
3. Results
4. Conclusions
Author Contributions
Funding
Acknowledgments
Conflicts of Interest
References
- Bacon, D.; Barnett, D.; Scattergood, R. Anisotropic continuum theory of lattice defects. Prog. Mater. Sci. 1979, 23, 51–262. [Google Scholar] [CrossRef]
- Ting, T.C.T. Anisotropic Elasticity; Oxford University Press: New York, NY, USA, 1996. [Google Scholar]
- Udyansky, A.; von Pezold, J.; Bugaev, V.N.; Friák, M.; Neugebauer, J. Interplay between long-range elastic and short-range chemical interactions in Fe-C martensite formation. Phys. Rev. B 2009, 79, 224112. [Google Scholar] [CrossRef]
- Lothe, J. Dislocations in Continuous Elastic Media, in Elastic Strain Fields and Dislocation Mobility; Series of Modern Problems in Condensed Matter Physics; Elsevier: Amsterdam, The Netherlands, 1992; Volume 31. [Google Scholar]
- Mouhat, F.; Coudert, F.-X. Necessary and sufficient elastic stability conditions in various crystal systems. Phys. Rev. B 2014, 90, 224104. [Google Scholar] [CrossRef]
- Kraut, E.A. Advances in the theory of anisotropic elastic wave propagation. Rev. Geophys. 1963, 1, 401–448. [Google Scholar] [CrossRef]
- Ting, T.C.T. Longitudinal and transverse waves in anisotropic elastic materials. Acta Mech. 2006, 185, 147–164. [Google Scholar] [CrossRef]
- Thurston, R.; Brugger, K. Third-order elastic constants + velocity of small amplitude elastic waves in homogeneously stressed media. Phys. Rev. 1964, 133, A1604. [Google Scholar] [CrossRef]
- Brugger, K.; Thurston, R. Sound velocity in stressed crystals + 3-order elastic coefficients. J. Acoust. Soc. Am. 1964, 36, 1041. [Google Scholar] [CrossRef]
- Brugger, K. Pure modes for elastic waves in crystals. J. Appl. Phys. 1965, 36, 759. [Google Scholar] [CrossRef]
- Brugger, K. Generalized Gruneisen parameters in anisotropic Debye model. Phys. Rev. 1965, 137, 1826. [Google Scholar] [CrossRef]
- Körmann, F.; Dick, A.; Grabowski, B.; Hallstedt, B.; Hickel, T.; Neugebauer, J. Free energy of bcc iron: Integrated ab initio derivation of vibrational, electronic, and magnetic contributions. Phys. Rev. B 2008, 78, 033102. [Google Scholar] [CrossRef]
- Zhao, J.; Winey, J.M.; Gupta, Y.M. First-principles calculations of second- and third-order elastic constants for single crystals of arbitrary symmetry. Phys. Rev. B 2007, 75, 094105. [Google Scholar] [CrossRef]
- Ledbetter, H.; Naimon, E. Elastic properties of metals and alloys. II. Copper. J. Phys. Chem. Ref. Data 1974, 3, 897. [Google Scholar] [CrossRef]
- Lincoln, R.C.; Koliwad, K.M.; Ghate, P.B. Morse-Potential Evaluation of Second- and Third-Order Elastic Constants of Some Cubic Metals. Phys. Rev. 1967, 157, 463–466. [Google Scholar] [CrossRef]
- De Jong, M.; Winter, I.; Chrzan, D.C.; Asta, M. Ideal strength and ductility in metals from second- and third-order elastic constants. Phys. Rev. B 2017, 96, 014105. [Google Scholar] [CrossRef]
- Kim, K.Y.; Sachse, W.; Every, A.G. On the determination of sound speeds in cubic crystals and isotropic media using a broadband ultrasonic point-source/point-receiver method. J. Acoust. Soc. Am. 1993, 93, 1393–1406. [Google Scholar] [CrossRef]
- Tasnádi, F.; Abrikosov, I.A.; Rogström, L.; Almer, J.; Johansson, M.P.; Odén, M. Significant elastic anisotropy in Ti1−xAlxN alloys. Appl. Phys. Lett. 2010, 97, 231902. [Google Scholar] [CrossRef]
- Saha, B.; Sands, T.D.; Waghmare, U.V. Electronic structure, vibrational spectrum, and thermal properties of yttrium nitride: A first-principles study. J. Appl. Phys. 2011, 109, 073720. [Google Scholar] [CrossRef]
- Yang, J.W.; An, L. Ab initio calculation of the electronic, mechanical, and thermodynamic properties of yttrium nitride with the rocksalt structure. Phys. Status Solidi (b) 2014, 251, 792–802. [Google Scholar] [CrossRef]
- Mancera, L.; Rodriguez, J.A.; Takeuchi, N. Theoretical study of the stability of wurtzite, zinc-blende, NaCl and CsCl phases in group IIIB and IIIA nitrides. Phys. Status Solidi (b) 2004, 241, 2424–2428. [Google Scholar] [CrossRef]
- Zerroug, S.; Ali Sahraoui, F.; Bouarissa, N. Ab initio calculations of yttrium nitride: Structural and electronic properties. Appl. Phys. A 2009, 97, 345–350. [Google Scholar] [CrossRef]
- Stampfl, C.; Mannstadt, W.; Asahi, R.; Freeman, A.J. Electronic structure and physical properties of early transition metal mononitrides: Density-functional theory LDA, GGA, and screened-exchange LDA FLAPW calculations. Phys. Rev. B 2001, 63, 155106. [Google Scholar] [CrossRef]
- Liu, Z.T.Y.; Zhou, X.; Khare, S.V.; Gall, D. Structural, mechanical and electronic properties of 3d transition metal nitrides in cubic zincblende, rocksalt and cesium chloride structures: A first-principles investigation. J. Phys. Condens. Matter 2014, 26, 025404. [Google Scholar] [CrossRef] [PubMed]
- Mattesini, M.; Magnuson, M.; Tasnádi, F.; Höglund, C.; Abrikosov, I.A.; Hultman, L. Elastic properties and electrostructural correlations in ternary scandium-based cubic inverse perovskites: A first-principles study. Phys. Rev. B 2009, 79, 125122. [Google Scholar] [CrossRef]
- Hohenberg, P.; Kohn, W. Inhomogeneous electron gas. Phys. Rev. 1964, 136, B864–B871. [Google Scholar] [CrossRef]
- Kohn, W.; Sham, L.J. Self-consistent equations including exchange and correlation effects. Phys. Rev. 1965, 140, A1133–A1138. [Google Scholar] [CrossRef]
- Kresse, G.; Hafner, J. Ab initio molecular dynamics for liquid metals. Phys. Rev. B 1993, 47, 558–561. [Google Scholar] [CrossRef]
- Kresse, G.; Furthmüller, J. Efficient iterative schemes for ab initio total-energy calculations using a plane-wave basis set. Phys. Rev. B 1996, 54, 11169–11186. [Google Scholar] [CrossRef]
- Blöchl, P.E. Projector augmented-wave method. Phys. Rev. B 1994, 50, 17953–17979. [Google Scholar] [CrossRef]
- Kresse, G.; Joubert, D. From ultrasoft pseudopotentials to the projector augmented-wave method. Phys. Rev. B 1999, 59, 1758. [Google Scholar] [CrossRef]
- Holec, D.; Friák, M.; Neugebauer, J.; Mayrhofer, P.H. Trends in the elastic response of binary early transition metal nitrides. Phys. Rev. B 2012, 85, 064101. [Google Scholar] [CrossRef]
- Perdew, J.P.; Wang, Y. Accurate and simple analytic representation of the electron-gas correlation energy. Phys. Rev. B 1992, 45, 13244–13249. [Google Scholar] [CrossRef]
- Zhou, L.; Holec, D.; Mayrhofer, P.H. First-principles study of elastic properties of Cr-Al-N. J. Appl. Phys. 2013, 113, 043511. [Google Scholar] [CrossRef]
- Togo, A.; Tanaka, I. First principles phonon calculations in materials science. Scr. Mater. 2015, 108, 1–5. [Google Scholar] [CrossRef]
- Mancera, L.; Rodríguez, J.A.; Takeuchi, N. First principles calculations of the ground state properties and structural phase transformation in YN. J. Phys. Condens. Matter 2003, 15, 2625. [Google Scholar] [CrossRef]
- Pearson’s Handbook of Crystallographic Data for Intermetallic Phases; American Society for Metals: Metals Park, OH, USA, 1985.
- Brik, M.; Ma, C.G. First-principles studies of the electronic and elastic properties of metal nitrides XN (X=Sc, Ti, V, Cr, Zr, Nb). Comput. Mater. Sci. 2012, 51, 380–388. [Google Scholar] [CrossRef]
- Gall, D.; Petrov, I.; Hellgren, N.; Hultman, L.; Sundgren, J.E.; Greene, J.E. Growth of poly- and single-crystal ScN on MgO(001): Role of low-energy irradiation in determining texture, microstructure evolution, and mechanical properties. J. Appl. Phys. 1998, 84, 6034–6041. [Google Scholar] [CrossRef]
- Birch, F. Finite Elastic Strain of Cubic Crystals. Phys. Rev. 1947, 71, 809. [Google Scholar] [CrossRef]
- Perdew, J.P.; Burke, K.; Ernzerhof, M. Generalized Gradient Approximation Made Simple. Phys. Rev. Lett. 1996, 77, 3865–3868. [Google Scholar] [CrossRef] [PubMed]
- Titrian, H.; Aydin, U.; Friák, M.; Ma, D.; Raabe, D.; Neugebauer, J. Self-consistent Scale-bridging Approach to Compute the Elasticity of Multi-phase Polycrystalline Materials. MRS Proc. 2013, 1524, mrsf12-1524-rr06-03. [Google Scholar] [CrossRef]
- Friák, M.; Counts, W.; Ma, D.; Sander, B.; Holec, D.; Raabe, D.; Neugebauer, J. Theory-Guided Materials Design of Multi-Phase Ti-Nb Alloys with Bone-Matching Elastic Properties. Materials 2012, 5, 1853–1872. [Google Scholar] [CrossRef]
- Zhu, L.F.; Friák, M.; Lymperakis, L.; Titrian, H.; Aydin, U.; Janus, A.; Fabritius, H.O.; Ziegler, A.; Nikolov, S.; Hemzalová, P.; Raabe, D.; Neugebauer, J. Ab initio study of single-crystalline and polycrystalline elastic properties of Mg-substituted calcite crystals. J. Mech. Behav. Biomed. Mater. 2013, 20, 296–304. [Google Scholar] [CrossRef] [PubMed]
- Mayrhofer, P.H.; Fischer, F.D.; Boehm, H.J.; Mitterer, C.; Schneider, J.M. Energetic balance and kinetics for the decomposition of supersaturated Ti1-xAlxN. Acta Mater. 2007, 55, 1441–1446. [Google Scholar] [CrossRef]
- Wu, L.; Chen, M.; Li, C.; Zhou, J.; Shen, L.; Wang, Y.; Zhong, Z.; Feng, M.; Zhang, Y.; Han, K.; et al. Ferromagnetism and matrix-dependent charge transfer in strained LaMnO3-LaCoO3 superlattices. Mater. Res. Lett. 2018, 6, 501–507. [Google Scholar] [CrossRef]
- Koutná, N.; Holec, D.; Friák, M.; Mayrhofer, P.H.; Šob, M. Stability and elasticity of metastable solid solutions and superlattices in the MoN–TaN system: First-principles calculations. Mater. Des. 2018, 144, 310–322. [Google Scholar] [CrossRef]
- Jiang, M.; Xiao, H.Y.; Peng, S.M.; Yang, G.X.; Liu, Z.J.; Zu, X.T. A comparative study of low energy radiation response of AlAs, GaAs and GaAs/AlAs superlattice and the damage effects on their electronic structures. Sci. Rep. 2018, 8. [Google Scholar] [CrossRef] [PubMed]
- Wen, Y.N.; Gao, P.F.; Xia, M.G.; Zhang, S.L. Half-metallic ferromagnetism prediction in MoS2-based two-dimensional superlattice from first-principles. Mod. Phys. Lett. B 2018, 32. [Google Scholar] [CrossRef]
- Friák, M.; Tytko, D.; Holec, D.; Choi, P.P.; Eisenlohr, P.; Raabe, D.; Neugebauer, J. Synergy of atom-probe structural data and quantum-mechanical calculations in a theory-guided design of extreme-stiffness superlattices containing metastable phases. New J. Phys. 2015, 17, 093004. [Google Scholar] [CrossRef]
- Dai, Q.; Eckern, U.; Schwingenschlog, U. Effects of oxygen vacancies on the electronic structure of the (LaVO3)6/SrVO3 superlattice: A computational study. New J. Phys. 2018, 20. [Google Scholar] [CrossRef]
- Jiang, M.; Xiao, H.; Peng, S.; Qiao, L.; Yang, G.; Liu, Z.; Zu, X. First-Principles Study of Point Defects in GaAs/AlAs Superlattice: the Phase Stability and the Effects on the Band Structure and Carrier Mobility. Nanoscale Res. Lett. 2018, 13. [Google Scholar] [CrossRef]
- Chen, H.; Millis, A.J.; Marianetti, C.A. Engineering Correlation Effects via Artificially Designed Oxide Superlattices. Phys. Rev. Lett. 2013, 111. [Google Scholar] [CrossRef]
- Mottura, A.; Janotti, A.; Pollock, T.M. A first-principles study of the effect of Ta on the superlattice intrinsic stacking fault energy of L12-Co3(Al,W). Intermetallics 2012, 28, 138–143. [Google Scholar] [CrossRef]
- Rosengaard, N.; Skriver, H. Ab-initio study of antiphase boundaries and stacking-faults in L12 and D022 compounds. Phys. Rev. B 1994, 50, 4848–4858. [Google Scholar] [CrossRef]
- Torres-Pardo, A.; Gloter, A.; Zubko, P.; Jecklin, N.; Lichtensteiger, C.; Colliex, C.; Triscone, J.M.; Stephan, O. Spectroscopic mapping of local structural distortions in ferroelectric PbTiO3/SrTiO3 superlattices at the unit-cell scale. Phys. Rev. B 2011, 84. [Google Scholar] [CrossRef]
- Chawla, V.; Holec, D.; Mayrhofer, P.H. Stabilization criteria for cubic AlN in TiN/AlN and CrN/AlN bi-layer systems. J. Phys. D Appl. Phys. 2013, 46. [Google Scholar] [CrossRef]
- Cooper, V.R.; Rabe, K.M. Enhancing piezoelectricity through polarization-strain coupling in ferroelectric superlattices. Phys. Rev. B 2009, 79. [Google Scholar] [CrossRef]
- Chen, B.; Zhang, Q.; Bernholc, J. Si diffusion in gaas and si-induced interdiffusion in gaas/alas superlattices. Phys. Rev. B 1994, 49, 2985–2988. [Google Scholar] [CrossRef]
- Schmid, U.; Christensen, N.; Cardona, M.; Lukes, F.; Ploog, K. Optical anisotropy in GaAs/AlSs(110) superlattices. Phys. Rev. B 1992, 45, 3546–3551. [Google Scholar] [CrossRef]
- Gibson, Q.D.; Schoop, L.M.; Weber, A.P.; Ji, H.; Nadj-Perge, S.; Drozdov, I.K.; Beidenkopf, H.; Sadowski, J.T.; Fedorov, A.; Yazdani, A.; et al. Termination-dependent topological surface states of the natural superlattice phase Bi4Se3. Phys. Rev. B 2013, 88. [Google Scholar] [CrossRef]
- Park, C.; Chang, K. Structural and electronic-properties of gap-alp (001) superlattices. Phys. Rev. B 1993, 47, 12709–12715. [Google Scholar] [CrossRef]
- Romanyuk, O.; Hannappel, T.; Grosse, F. Atomic and electronic structure of GaP/Si(111), GaP/Si(110), and GaP/Si(113) interfaces and superlattices studied by density functional theory. Phys. Rev. B 2013, 88. [Google Scholar] [CrossRef]
- Abdulsattar, M.A. SiGe superlattice nanocrystal pure and doped with substitutional phosphorus single atom: Density functional theory study. Superlattices Microstruct. 2011, 50, 377–385. [Google Scholar] [CrossRef]
- Botti, S.; Vast, N.; Reining, L.; Olevano, V.; Andreani, L. Ab initio and semiempirical dielectric response of superlattices. Phys. Rev. B 2004, 70. [Google Scholar] [CrossRef]
- Rondinelli, J.M.; Spaldin, N.A. Electron-lattice instabilities suppress cuprate-like electronic structures in SrFeO3/OSrTiO3 superlattices. Phys. Rev. B 2010, 81. [Google Scholar] [CrossRef]
- Momma, K.; Izumi, F. VESTA 3 for three-dimensional visualization of crystal, volumetric and morphology data. J. Appl. Crystallogr. 2011, 44, 1272–1276. [Google Scholar] [CrossRef]


| C11 | C12 | C44 | C11/ | C12/ | C44/ | |
|---|---|---|---|---|---|---|
| YN | 318 | 81 | 124 | 7.55 | 1.12 | −0.70 |
| (321 [24] *) | (81 [24] *) | (124 [24] *) | ||||
| (304 [24] **) | (76 [24] **) | (122 [24] **) | ||||
| (317 [24] ) | (80 [24] ) | (123 [24] ) | ||||
| (310 [24] ) | (81 [24] ) | (124 [24] ) | ||||
| ScN | 388 | 106 | 166 | 7.49 | 1.02 | −0.51 |
| (399 [24]) | (96 [24]) | (158 [24]) | ||||
| (397 [25]) | (131 [25]) | (170 [25]) | ||||
| (354 [38]) | (100 [38]) | (170 [38]) | ||||
| C | C | C | C | C | C | |
| YN | −4100 | −160 | 180 | 180 | −225 | 185 |
| ScN | −5100 | −190 | 260 | 200 | −330 | 215 |
© 2018 by the authors. Licensee MDPI, Basel, Switzerland. This article is an open access article distributed under the terms and conditions of the Creative Commons Attribution (CC BY) license (http://creativecommons.org/licenses/by/4.0/).
Share and Cite
Friák, M.; Kroupa, P.; Holec, D.; Šob, M. An Ab Initio Study of Pressure-Induced Reversal of Elastically Stiff and Soft Directions in YN and ScN and Its Effect in Nanocomposites Containing These Nitrides. Nanomaterials 2018, 8, 1049. https://doi.org/10.3390/nano8121049
Friák M, Kroupa P, Holec D, Šob M. An Ab Initio Study of Pressure-Induced Reversal of Elastically Stiff and Soft Directions in YN and ScN and Its Effect in Nanocomposites Containing These Nitrides. Nanomaterials. 2018; 8(12):1049. https://doi.org/10.3390/nano8121049
Chicago/Turabian StyleFriák, Martin, Pavel Kroupa, David Holec, and Mojmír Šob. 2018. "An Ab Initio Study of Pressure-Induced Reversal of Elastically Stiff and Soft Directions in YN and ScN and Its Effect in Nanocomposites Containing These Nitrides" Nanomaterials 8, no. 12: 1049. https://doi.org/10.3390/nano8121049
APA StyleFriák, M., Kroupa, P., Holec, D., & Šob, M. (2018). An Ab Initio Study of Pressure-Induced Reversal of Elastically Stiff and Soft Directions in YN and ScN and Its Effect in Nanocomposites Containing These Nitrides. Nanomaterials, 8(12), 1049. https://doi.org/10.3390/nano8121049