Article

One-Step Synthesis of Ag@TiO2 Nanoparticles for Enhanced Photocatalytic Performance

1
National Engineering Laboratory for Modern Silk, College of Textile and Clothing Engineering, Soochow University, Suzhou 215123, China
2
Nantong Textile & Silk Industrial Technology Research Institute, Nantong 226314, China
*
Authors to whom correspondence should be addressed.
Nanomaterials 2018, 8(12), 1032; https://doi.org/10.3390/nano8121032
Submission received: 5 November 2018 / Revised: 3 December 2018 / Accepted: 10 December 2018 / Published: 12 December 2018

Abstract

:
Polyamide network polymers (PNP) modified TiO2 nanoparticles (NPs) were decorated with Ag NPs in hydrothermal gel method, forming one-step synthesized photocatalysts, Ag@TiO2 NPs. The effect of PNP and the amount of Ag NPs added were investigated in this work. PNP acted as a nanocage to prevent TiO2 aggregation and capture Ag accurately, which could effectively control product sizes and improve dispersibility in solvents. Simultaneously, TiO2 NPs modified with Ag NPs exhibited remarkable photocatalytic effects. One-step synthesis simplified the experimental process and avoided the agglomeration of silver ions during the secondary reaction, achieving the purpose of uniform distribution at a specific location of TiO2 NPs. The prepared Ag@TiO2 NPs-0.5 could remove 79.49% of Methyl Orange (MO) after 3 h of ultraviolet light irradiation, which was 2.7 times higher than the reaction rate of pure TiO2 NPs. It also exhibited good photoactivity under Visible light conditions. Moreover, the mineralization rate of MO over the Ag@TiO2 NPs-0.5 could be up to 72.32% under UV light and 47.08% under Visible light irradiation, which revealed that the prepared catalysts could effectively degrade most of the MO to CO2 and H2O. The samples also demonstrated the excellent stability and easy recyclability with over 90% of the original catalytic level for MO degradation. The photocatalysts studied also exerted broad application prospects such as photovoltaic hydrogen production, electronic sensors and biomedicine.

1. Introduction

With the rapid advancement of industrialization, human survival faces serious challenges of environmental pollution and energy shortage, which has caused harm to human health [1,2]. Compared with other industries, the textile and dye industry produce 70% of all world annual wastewaters, hence eliminating the dyes in wastewater is especially vital for environmental protection [3,4]. However, till now, traditional methods implemented previously have not been able to remove these organic pollutants from the roots, while semiconductor photocatalytic technology is a viable option to solve this problem [5]. Photocatalytic activity and photostability are important indicators for evaluating photocatalytic quality, but few catalysts have both high photocatalytic activity and excellent light stability, such as oxide semiconductor TiO2.
Nanosized TiO2, first reported by Fujishima, has caused much attention thanks to its low price, non-toxicity, excellent chemical stability, and wide availability [6,7,8]. However, anatase TiO2 can only absorb the wavelengths of sunlight (λ < 400 nm) owing to the wide bandgap (3.2 eV), which greatly limits the utilization of solar energy. Moreover, photogenerated electrons and holes are easily re-combined, resulting in low photocatalytic activity [9,10,11]. Narrowing the band gap of TiO2 to broaden the absorption spectrum response interval and reducing the recombination rate of photoinduced electron-hole pairs, have become research hotspots to improve photocatalytic performance [12,13].
In recent years, in order to improve the catalytic effect of TiO2 nanoparticles (NPs), surface modification and ion doping were further studied [14,15,16]. The introduction of noble metal to a semiconductor catalyst is one of the effective methods resulting from the synergistic effect of Schottky barrier and surface plasmon resonance [17,18]. On the one hand, the Schottky barrier is formed to accelerate electron/hole separation. On the other hand, TiO2 NPs can absorb more photons because of the plasmon resonance effect [19,20]. With its low cost, low toxicity and simple preparation, Ag has become a suitable candidate.
There have been many studies on the modification of TiO2 NPs with Ag, while most of them are synthesized by two-step methods, where Ag NPs first are prepared and then combined with TiO2 NPs. Oxidation of metal particles, agglomeration of the secondary reaction, and the length of the experiment greatly limit the quality of the product, resulting in insufficient photocatalytic ability of the obtained photocatalyst. In this paper, a one-step synthesis of Ag@TiO2 nanoparticles using nanocage as a junction is designed to generate Ag@TiO2 in situ. PNP is a polyamide network polymer containing a large amount of amine groups, which is used to surface-modify, as a nanocage, to prevent TiO2 NPs aggregation and capture Ag at a fixed position of TiO2 NPs [21,22].
To the end, the optimal addition amount of PNP and Ag NPs was obtained by analyzing the origin of the enhancement mechanism and testing the different parameters. The as-prepared composite sample displayed an excellent performance in the catalytic degradation test, because the synergies of Ag and TiO2 nanoparticles accelerated the transmission of photogenerated electrons, ultimately increasing the photocatalytic rate, and the results are discussed next.

2. Materials and Methods

2.1. Materials

Tetrabutyl titanate (TBT), glacial acetic acid (CH3COOH, >99%), silver nitrate (AgNO3), absolute ethanol (CH3CH2OH, >99%) were provided by Sigma-Aldrich, St. Louis, MO, USA. Methyl Orange (MO) was supplied from Adamas Reagent Co. Ltd., Shanghai, China. The reagents in this research were analytical grade and required no further purification. Polyamide network polymers (PNP) was formulated to 100 g/L for the following experiment, which were prepared in our previous paper [21].

2.2. Preparation of Photocatalysts

2.2.1. Preparation of Pure TiO2 Nanoparticles

A total of 10 g TBT was dissolved in 30 mL absolute ethanol, and constantly mixed with ultrasonic for 0.5 h. The obtained mixed solution is referred to as liquid A. Moreover, 60 mL of Liquid B was placed in a three-necked flask containing deionized water, glacial acetic acid, and absolute ethanol at a volume ratio of 1:1:4. Then, liquid A was dripped into Liquid B at a rate of 1 mL per minute under stirring for up to 2 h, at ambient temperature. The gel was formed after 24–36 h, with the color changing from transparent to light blue.
A total of 1 mol PNP solution (100 g/L) was added into 10 g gel and kept under magnetic stirring until completely dissolved. Afterwards, the mixture was poured into a 100 mL polytetrafluoroethylene lining, which was kept at 200 °C for 8 h in an autoclave. After naturally cooling to room temperature, the obtained product was centrifuged multiple times to eliminate excess precursor and PNP until the pH of the solution returned to neutral. Finally, the TiO2 NPs white in color were obtained under 60 °C dry conditions.

2.2.2. Preparation of Ag@ TiO2 Nanoparticles

In this study, Ag@TiO2 NPs were one-step produced with AgNO3 as metal source and TBT as the precursor. According to this procedure, 10 g TBT was dispersed in absolute ethanol at a volume ratio of 1:3. The above solution was then added dropwise into a 60 mL mixture solution, which was made up of 10 mL deionized water, 40 mL absolute ethanol and 10 mL glacial acetic acid. After stirring for 3 h at 20 °C, the solution turned into gels. A suspension composed of 10 g gels, 1 mol PNP solution (100 g/L) and 0.1 M AgNO3 solution was stirred for 2 h. Next, the mixture was poured into a 100 mL polytetrafluoroethylene lining and hydrothermally treated for 8 h at 200 °C. In order to optimize the molar ratio of Ag to TiO2, Ag@TiO2 with different molar ratios of AgNO3 (0.25%, 0.5% and 1%) were prepared and the resulting samples were labelled as Ag@TiO2 NPs-x, where x was 0.25, 0.5, and 1, respectively. In all cases, the samples were washed thoroughly to get rid of excess precursor and PNP solution and then stored at 60 °C in a vacuum oven until required.

2.3. Materials Characterization

The Hitachi S-4800 scanning electron microscopy (Hitachi Ltd. Tokyo, Japan) was used to show the images of the samples surface morphology and particle size distribution. In order to better analyze the morphology and particle size, transmission electron microscopy with EDS capabilities (TEM), high-resolution electron microscopy (HRTEM) and selected area electron diffraction (SAED) were tested on a Tecnai G2 F20 S-TWIN (FEI, Hillsboro, OR, USA) operating at 200 kV. The X-ray diffraction scanning rate of 5° min−1 characterized the crystal form of the products, with Cu-Kα (λ = 0.1542 nm), equal voltage of 40 KV and equal current of 200 mA. All data from 20° to 80° in the XRD spectrum were integrated and recorded, and the characteristic peaks were determined by comparison with the Joint Committee on Powder Diffraction Standards (JCPDS 21-1272 and JCPDSCard No. 04-0783) [23,24]. PHI-5700 ESCA apparatus was operated to test the X-ray photoelectron spectroscopy. It could be seen from the spectrum that all the values of binding energy were adjusted with the help of the hydrocarbon band (C 1 s: 284.8 eV), the X-ray source expressed Al Ka (hv = 1486.6 eV). Fourier transform infrared spectra (FTIR) of pure TiO2 NPs and Ag@TiO2 hybrid NPs were measured on a Nicolet 5700 instrument (Thermo Electron Corporation, Beverly, MA, USA). Evolution 220 UV-Vis spectrophotometer (Thermo Fisher Scientific, Boston, MA, USA) was used to detect the absorption capacity of the prepared hybrid catalysts. It should be noted that integrating sphere method using BaSO4 powder as the background was carried out in this experiment, where the measurement range was 200–800 nm. Simultaneously, the total MO contents in the tests were also recorded (λ = 463 nm).

2.4. Photoelectrochemical Measurements

The photoelectrical response and electrochemical impedancespectroscopy (EIS) play vital roles in evaluating the separation efficiency of the photogenerated carriers. The photoelectrochemical measurements were performed in a standard three electrodes system with a 0.1 M Na2SO4 aqueous electrolyte solution using a PGSTAT302N electrochemical workstation (Swiss Wantong China Ltd., Shanghai, China). Platinum wire and saturated calomel electrode would serve as the counter electrode and the reference electrode, respectively. The working electrode was obtained by dipcoating 3 μm of the suspension onto glassy carbon electrode. Photo-responses were measured at 0.0 V and the EIS measurements were defined at a 5 mV AC voltage amplitude with a frequency range of 105 to 10−1 Hz. The working electrodes were irradiated by a 300 W Xe lamp. The set light-liquid interface distance was 15 cm, the light intensity was 50 mW cm−2 and the d of the glassy carbon electrode was 3 mm.

2.5. Photocatalytic Activity Measurements

The ability of photodegradation of dye determined the photocatalytic performance of the catalyst, and the as-prepared catalyst was placed into MO for photodegradation reaction to evaluate the effect. A 20 W UV light lamp (365 nm) and 300 W Xe lamp (equipped with a 420 nm filter) were applied as the light source to induce photocatalysis, and light intensity for both was 50 mW cm−2. The set light-liquid interface distance was 15 cm. According to previous standards, 100 mg catalysts were dispersed in beaker containing 100 mL MO (20 mg/L) and the solution was thoroughly mixed for approximately 15 min. Considering the adsorption-desorption between the sample and the dye, the test solution needed to be pretreated in the dark prior to the experiment [25]. Afterwards, the suspension was stirred for 3 h under irradiation and 3 mL of the droplet was uniformly sampled at a given time interval into a tube, centrifuging for testing.
By measuring the maximum absorption of the MO characteristic peak at 463 nm, the absorption standard curve equations for MO could be depicted on a UV-Vis spectrophotometer. The mineralization rates of MO were obtained using the total organic carbon (TOC) equipment (Multi N/C 2100, TOC/TN, Analytikjena, Jena, Germany). Reusability was another key indicator for determining the performance of the catalyst, hence 100 mg of Ag@TiO2 NPs was subjected to cyclic photocatalytic testing five times in a row. During the test, the MO concentration was always set to 20 mg/L. After each cycle, the catalyst was collected by centrifugation and dried at 60 °C for the next usage.

3. Results and Discussion

3.1. Preparation of Ag@TiO2 NPs

For nanocatalysts, particle size and dispersibility in solvents are two important parameters. Surfactants or polymers are typically added during the preparation to control the size of the nanoparticles and increase the dispersibility in the solvent. In this work, polymer PNP was used as a template to find the appropriate amount added without metal loading. In order to clearly verify the change in diameter and dispersion of TiO2 nanoparticles, SEM was employed for further examination. Figure 1 depicts the SEM images of the TiO2 NPs synthesized by the PNP in the conditions of different molars. As shown in Figure 1a, the pure TiO2 NPs have a small particle size but have serious agglomeration owing to the high surface energy, which results in poor dispersibility as well as extremely large size ranges. After that, by adjusting the amount of PNP added to 0.25, 0.5 and 1 mol (Figure 1b–d), respectively, more and more PNP is added for the preparation of the TiO2 NPs, hence the growing nanoparticles are confined by the polymeric nanocages in order to prevent from aggregating [26,27]. Compared with the pure TiO2 NPs, the agglomeration phenomenon and the dispersibility are gradually improved. It follows that the overall size is controlled in the range of 30–40 nm after adding 1 mol of PNP, and most of the synthesized nanoparticles show good dimensional uniformity, which indicates a suitable amount of PNP solution can effectively improve the dispersion ability and keep the particle size at a small level. However, as the amount of PNP added exceeds 1 mol (Figure 1e,f), the mean diameter would become larger, which is caused by the steric hindrance generated with a large number of cavities between the branches. Thus, 1 mol PNP (100 g/L) was selected to prepare Ag@TiO2 NPs for the following work.
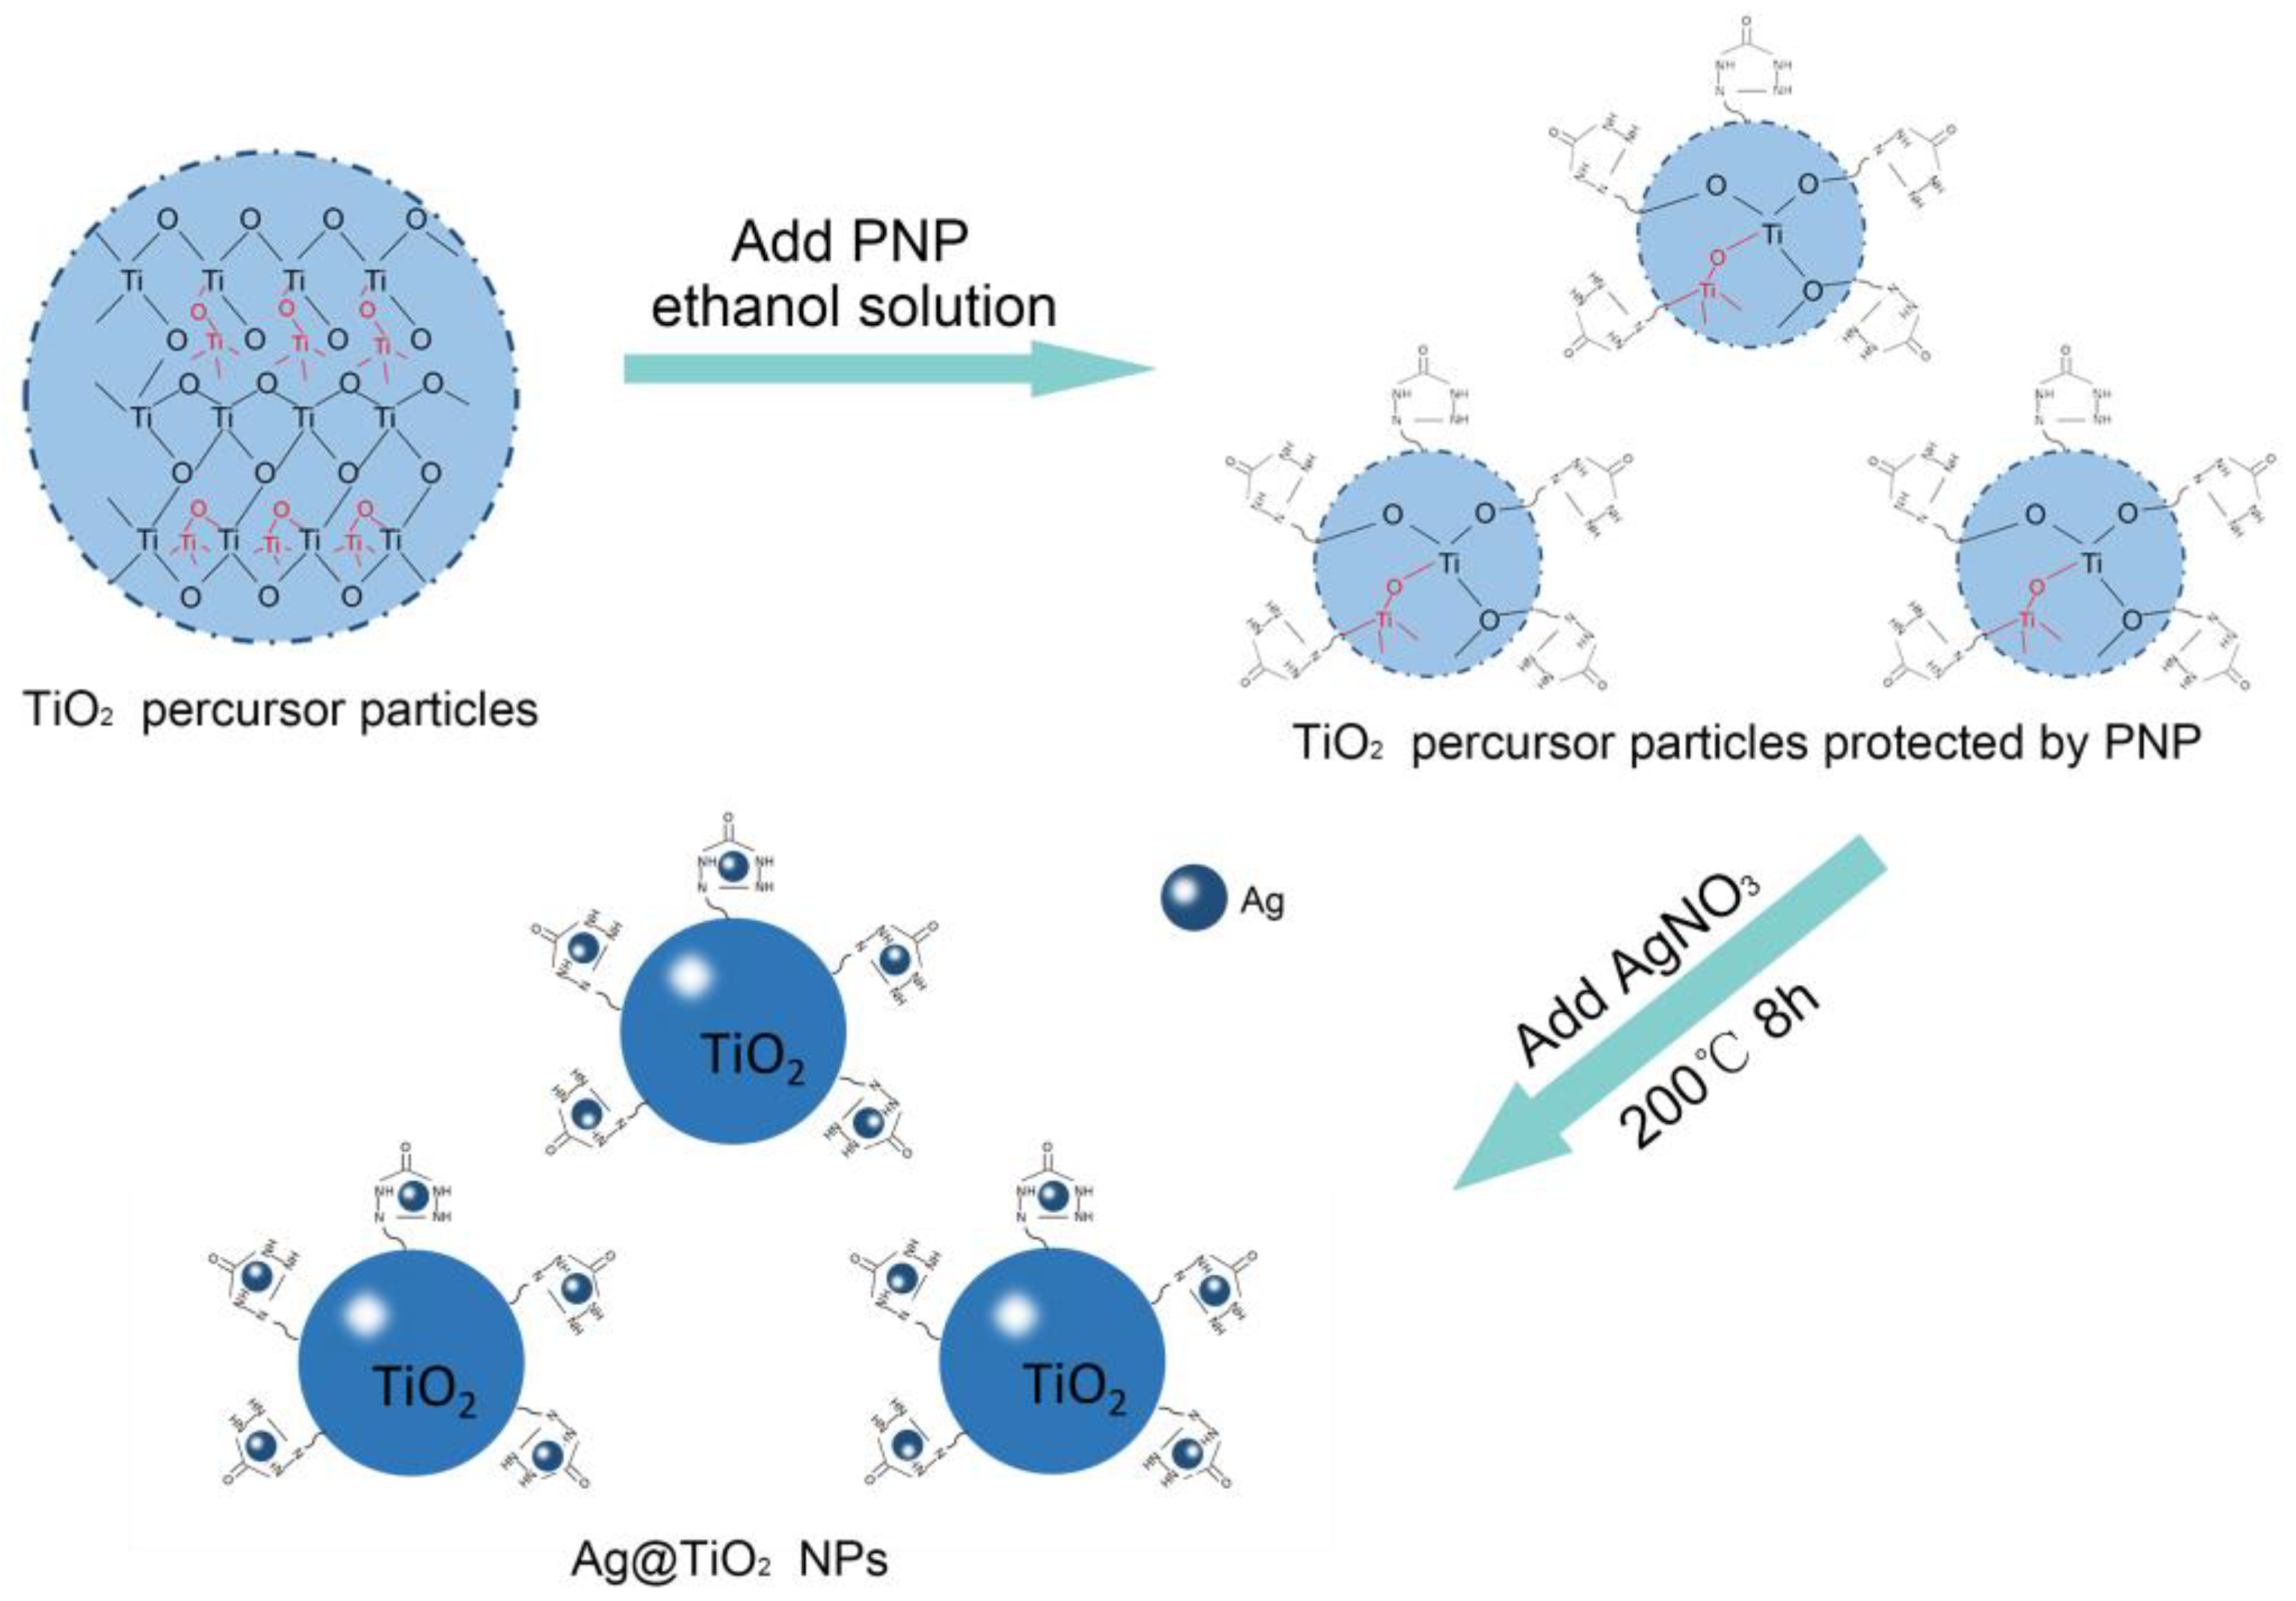
The key steps of designing the pure TiO2 NPs and Ag@TiO2 NPs by the hydrothermal gel method are illustrated in Scheme 1. The first step of our approach was to prepare the TiO2 precursor obtained by hydrolyzing TBT, as Ti source, into a gel form. To prevent the aggregation in the next hydrothermal reaction, prepared PNP was introduced for protecting TiO2. Finally, Ag@TiO2 NPs was synthesized under high temperature and high pressure conditions, and the color turned a deep reddish brown.
Our previous works have found that by using PNP as a nanocage, a polyamide network polymer that contains numerous amine groups, metal particles can be complexed with amine groups and reduced to Ag NPs at a fixed position in the network structure during the initial stage of hydrothermal reaction [28]. Since the space of the network structure is limited, the size of the Ag NPs grown inside will be restricted, so that products with small size and uniform distribution are obtained. Meanwhile, the surface of the Ag NPs is rich in amino groups, which can be linked to the hydroxyl groups on the surface of the TiO2 by hydrogen bonding, thereby achieving the effect of physically preventing aggregation [22]. These two findings inspired us to design a method to complete the growth of Ag and TiO2 NPs in one-step.
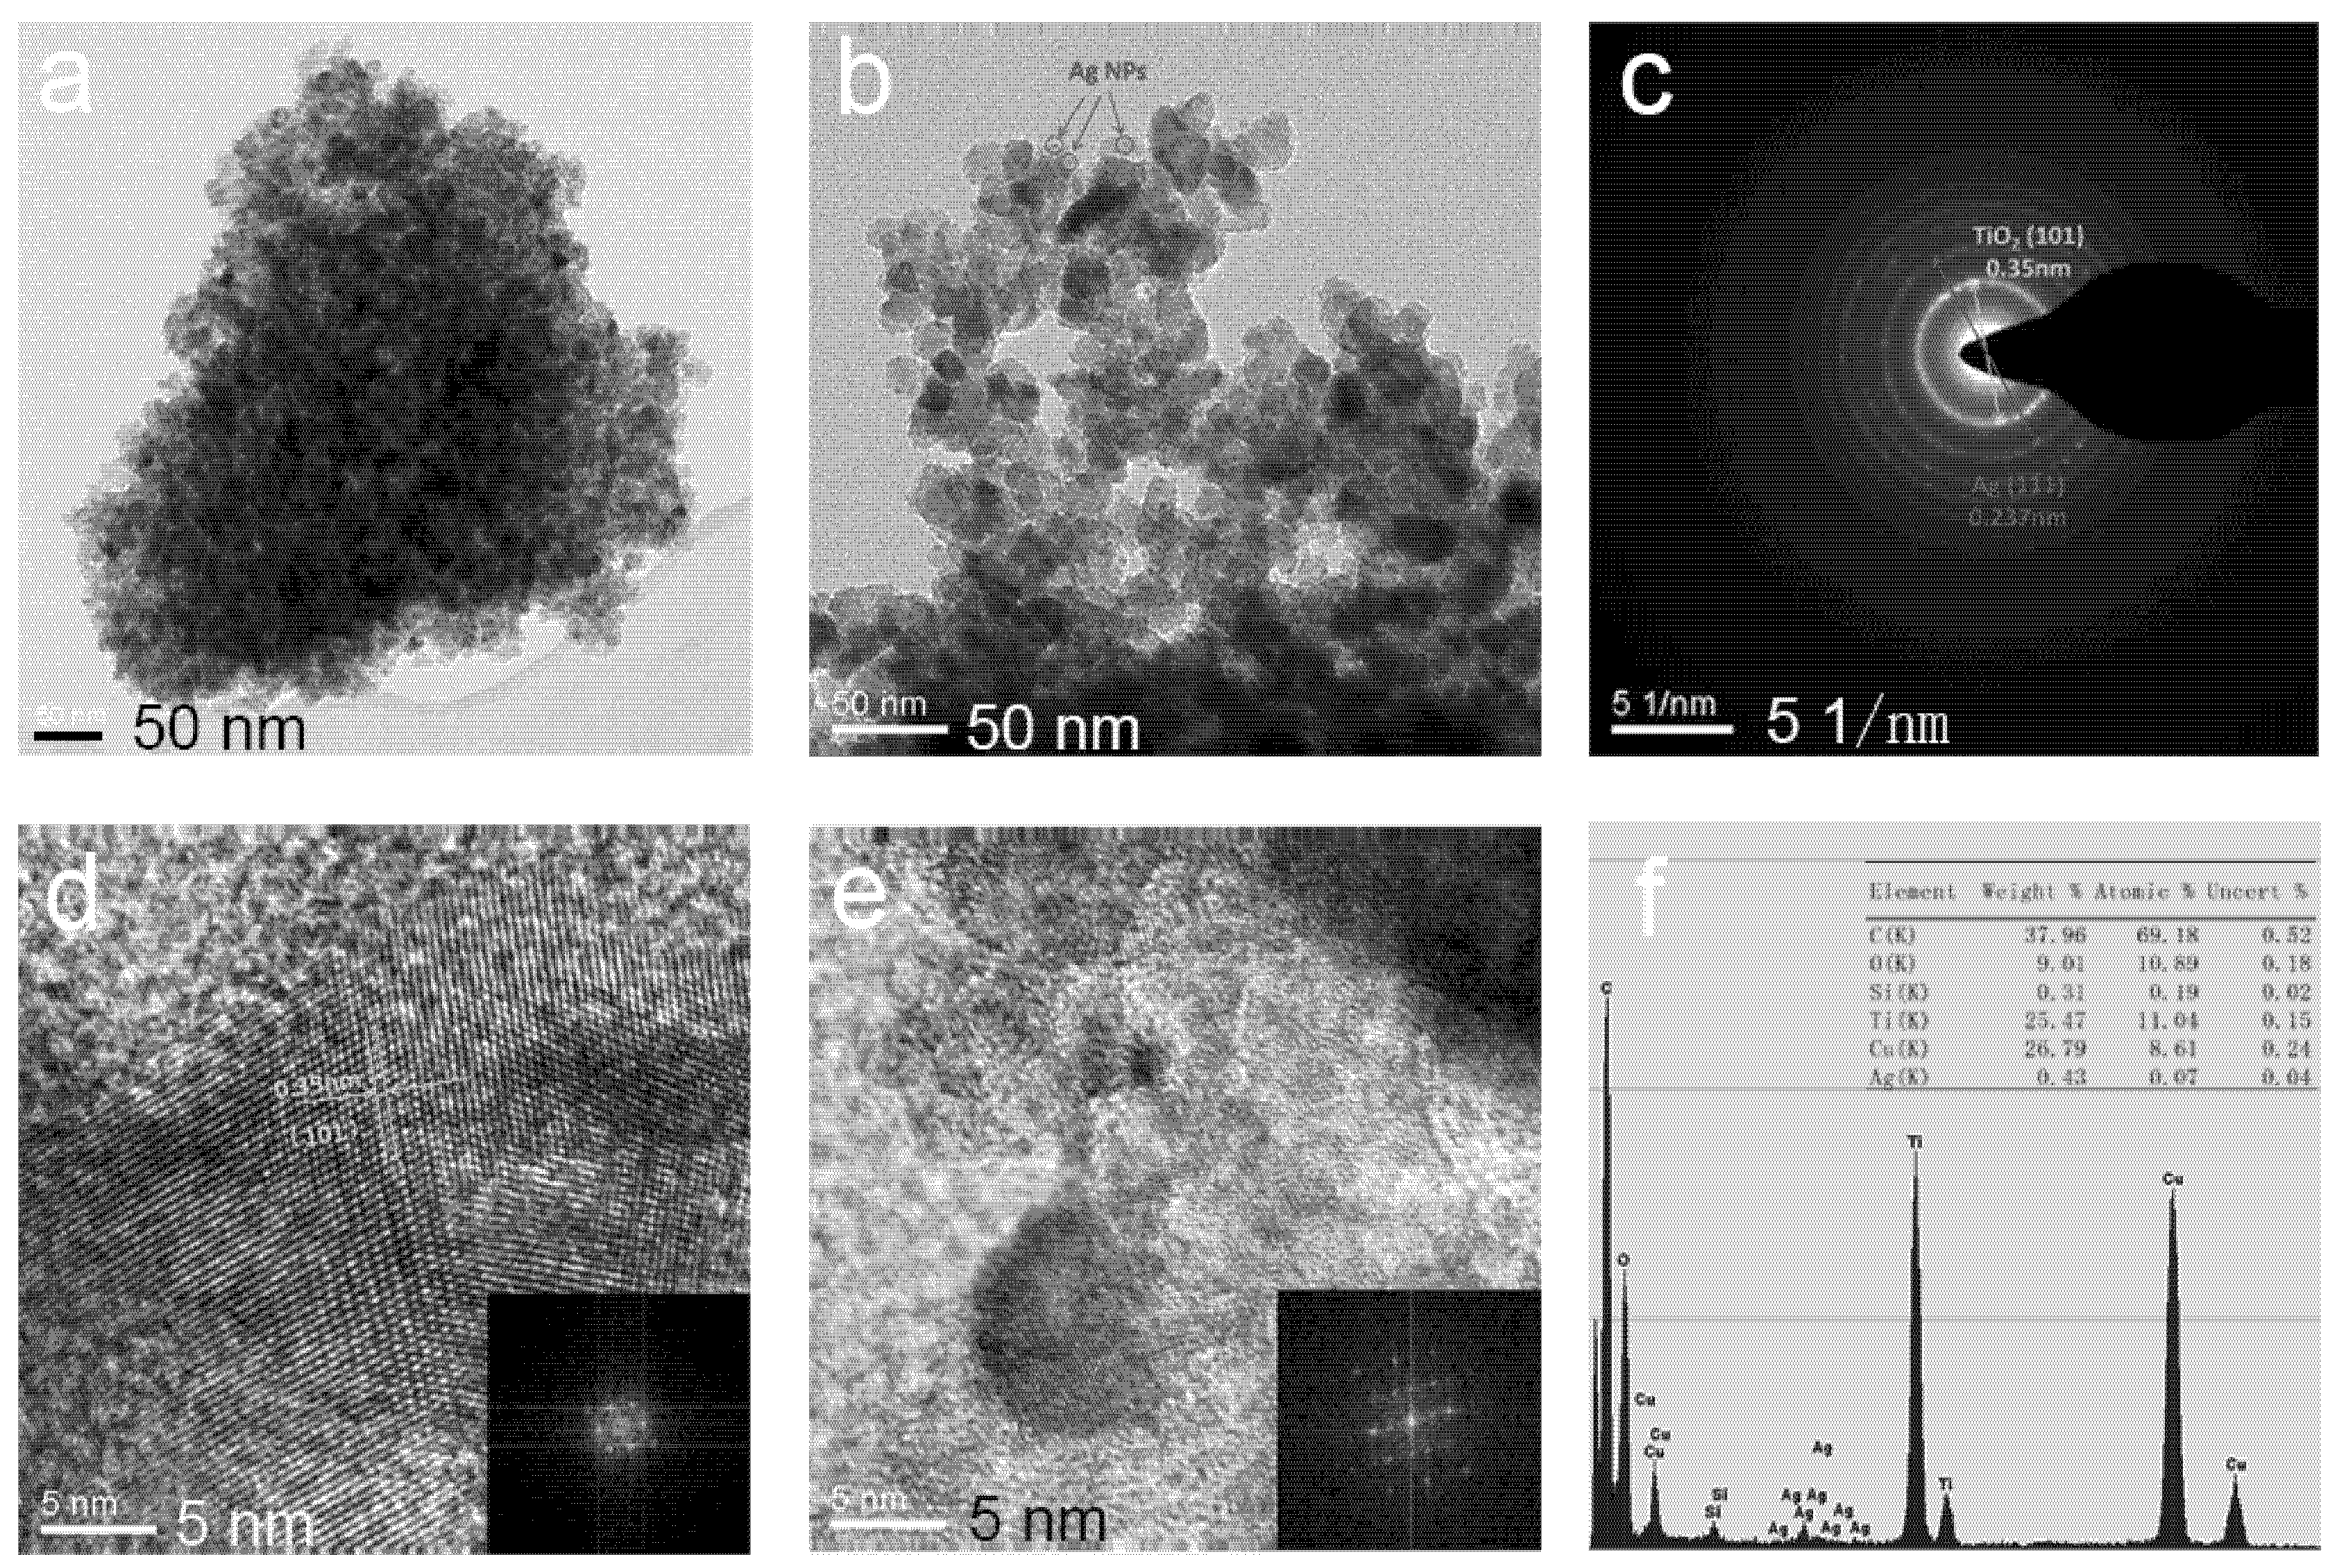
After loading the silver particles, the morphology, structure and property of the photocatalyst were also changed. To further explore the morphologies, the lattice parameters and the element content of the samples, TEM, SAED, HRTEM and EDS were employed. The results are displayed in Figure 2 below. It is depicted that pure TiO2 NPs (Figure 2a) have undergone severe agglomeration, whereas Ag@TiO2 NPs-0.5 (Figure 2b) show excellent dispersibility and small particle size under the synergy of PNP and Ag NPs. It can clearly see that Ag NPs (d <10 nm) are embedded on the surface of TiO2 NPs from the low magnification TEM image, as shown in Figure 2b, which also proves the existence of Ag NPs. A SAED pattern of Ag@TiO2 NPs-0.5 is indicated in Figure 2c. The (111) crystal plane of Ag NPs and the (101) crystal plane of anatase are confirmed to match the d values obtained in the results. Meanwhile, the HRTEM image of TiO2 and Ag (d is around 8 nm), accompanied by a fast Fourier transform (FFT) mode of local regions (inset), which exhibits the lattice fringes of TiO2 (101) and Ag (111) planes with interplanar spacing of about 0.35 and 0.237 nm, respectively, are observed in Figure 2d,e [29]. The results are consistent with the results obtained from the diffraction pattern, indicating the as-prepared Ag@TiO2 NPs is high quality. Figure 2f depicts the EDS of Ag@TiO2 NPs-0.5, and the content of each element is also listed in the table where the Ag atom content is small, accounting for 0.6% of the Ti atom, which is also consistent with the experimentally set ratio.
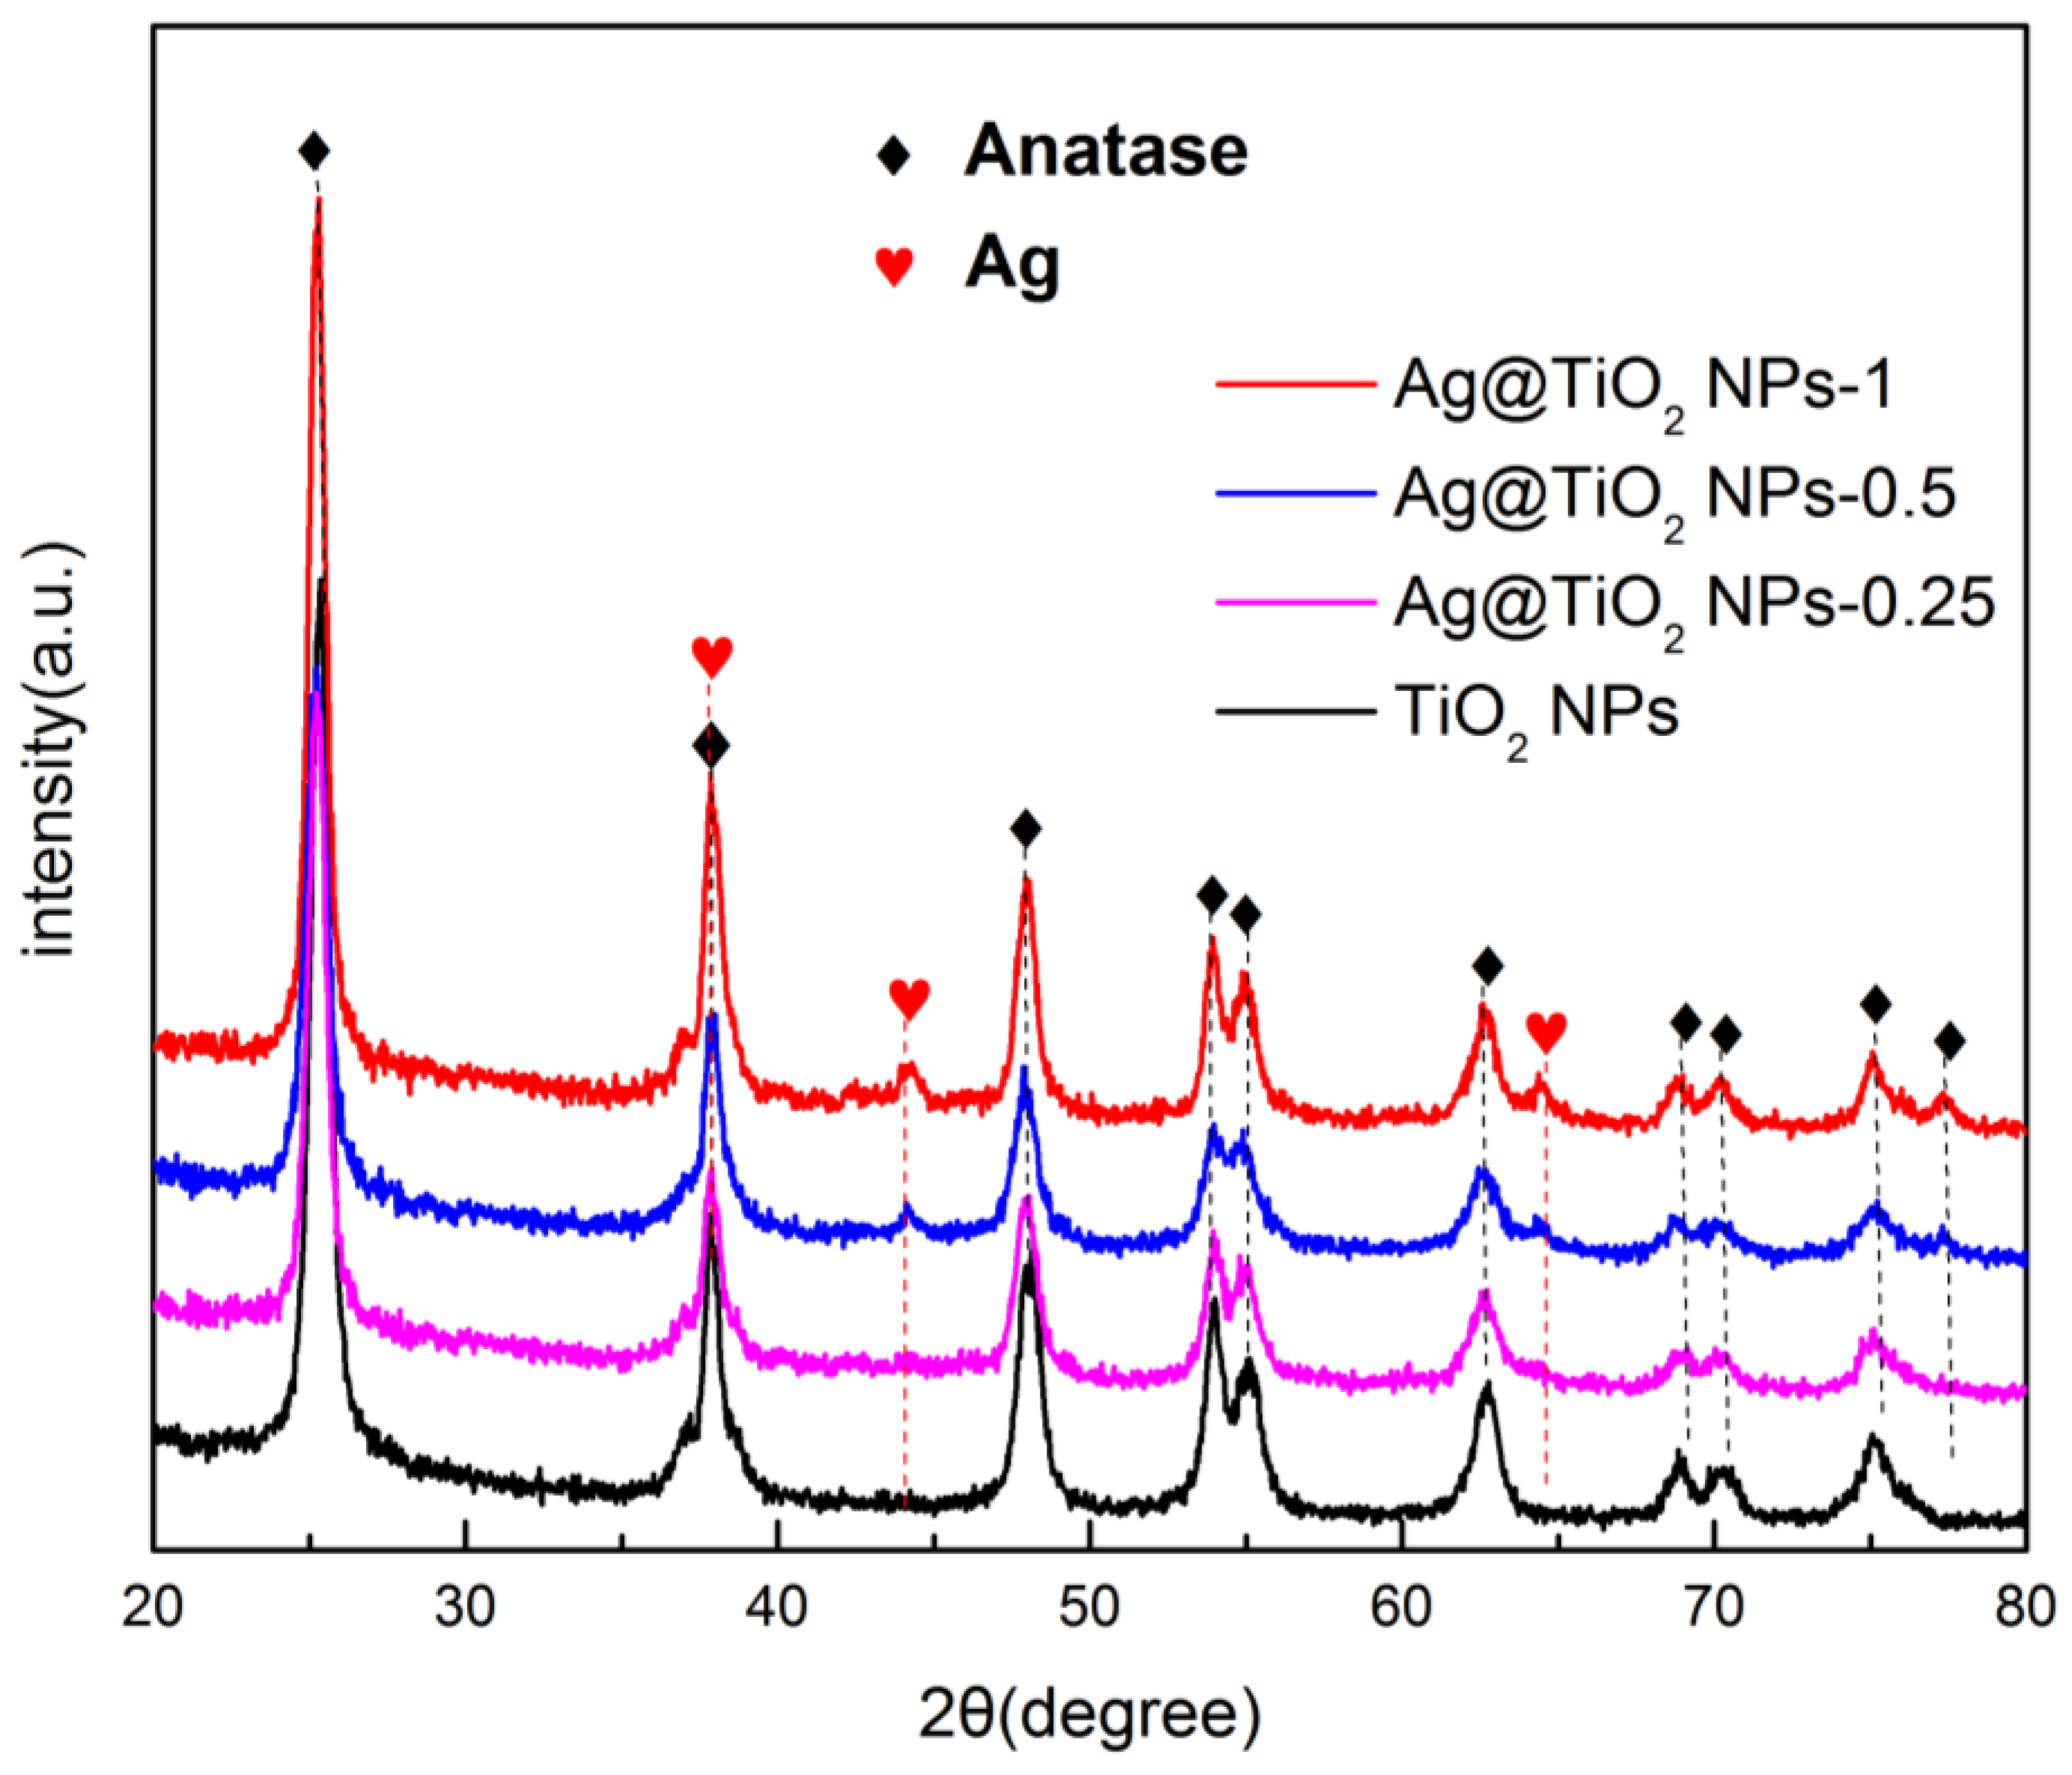
XRD patterns were utilized to characterize the structure of as-prepared catalyst. Figure 3 shows the test results of TiO2 NPs and Ag@TiO2 NPs prepared through the one step in situ hydrothermal method. The Ag@TiO2 NPs are mainly composed of anatase and nano silver, which are marked “Anatase” and “Ag” in the image. It is shown that the diffraction peaks at Bragg angles (2θ) of 25.3, 37.9, 48.05, 53.9, 55.06, 62.4, 68.76, 70.3, 75.06, 78.67 correspond to the (101), (004), (200), (105), (211), (204), (116), (220), (215), (206) lattice planes of anatase TiO2 (JCPDS 21-1272). As observed, the crystal shape of the diffraction peaks appear clear and sharp, and there are no other impurity peaks, indicating well-formed crystal structures of the as-prepared TiO2. In addition, the (200), (220) lattice planes at Bragg angles (2θ) of 44.2 and 64.4 (JCPDSCard No. 04-0783) belong to Ag consistent with the TEM results, the peak intensities of which become stronger with an increase in the molar mass. It is noteworthy that since the diffraction band of the Ti (004) lattice plane is too high at 37.9°, the (111) characteristic peak of Ag is covered. Using the formula Scherrer Equation (1), the particle size corresponding to each crystal plane can be theoretically calculated [30,31]. Taking Ag@TiO2 NPs-0.5 as an example, the mean diameter of TiO2 NPs is estimated at 17, nm consistent with TEM results.
D = K λ β cos θ ,
where K expresses a constant with a value of 0.89, the X-ray incident wavelength is represented by λ with a value of 0.154 nm, θ represents the half-diffraction angle and β is the full width at half maximum (rad).
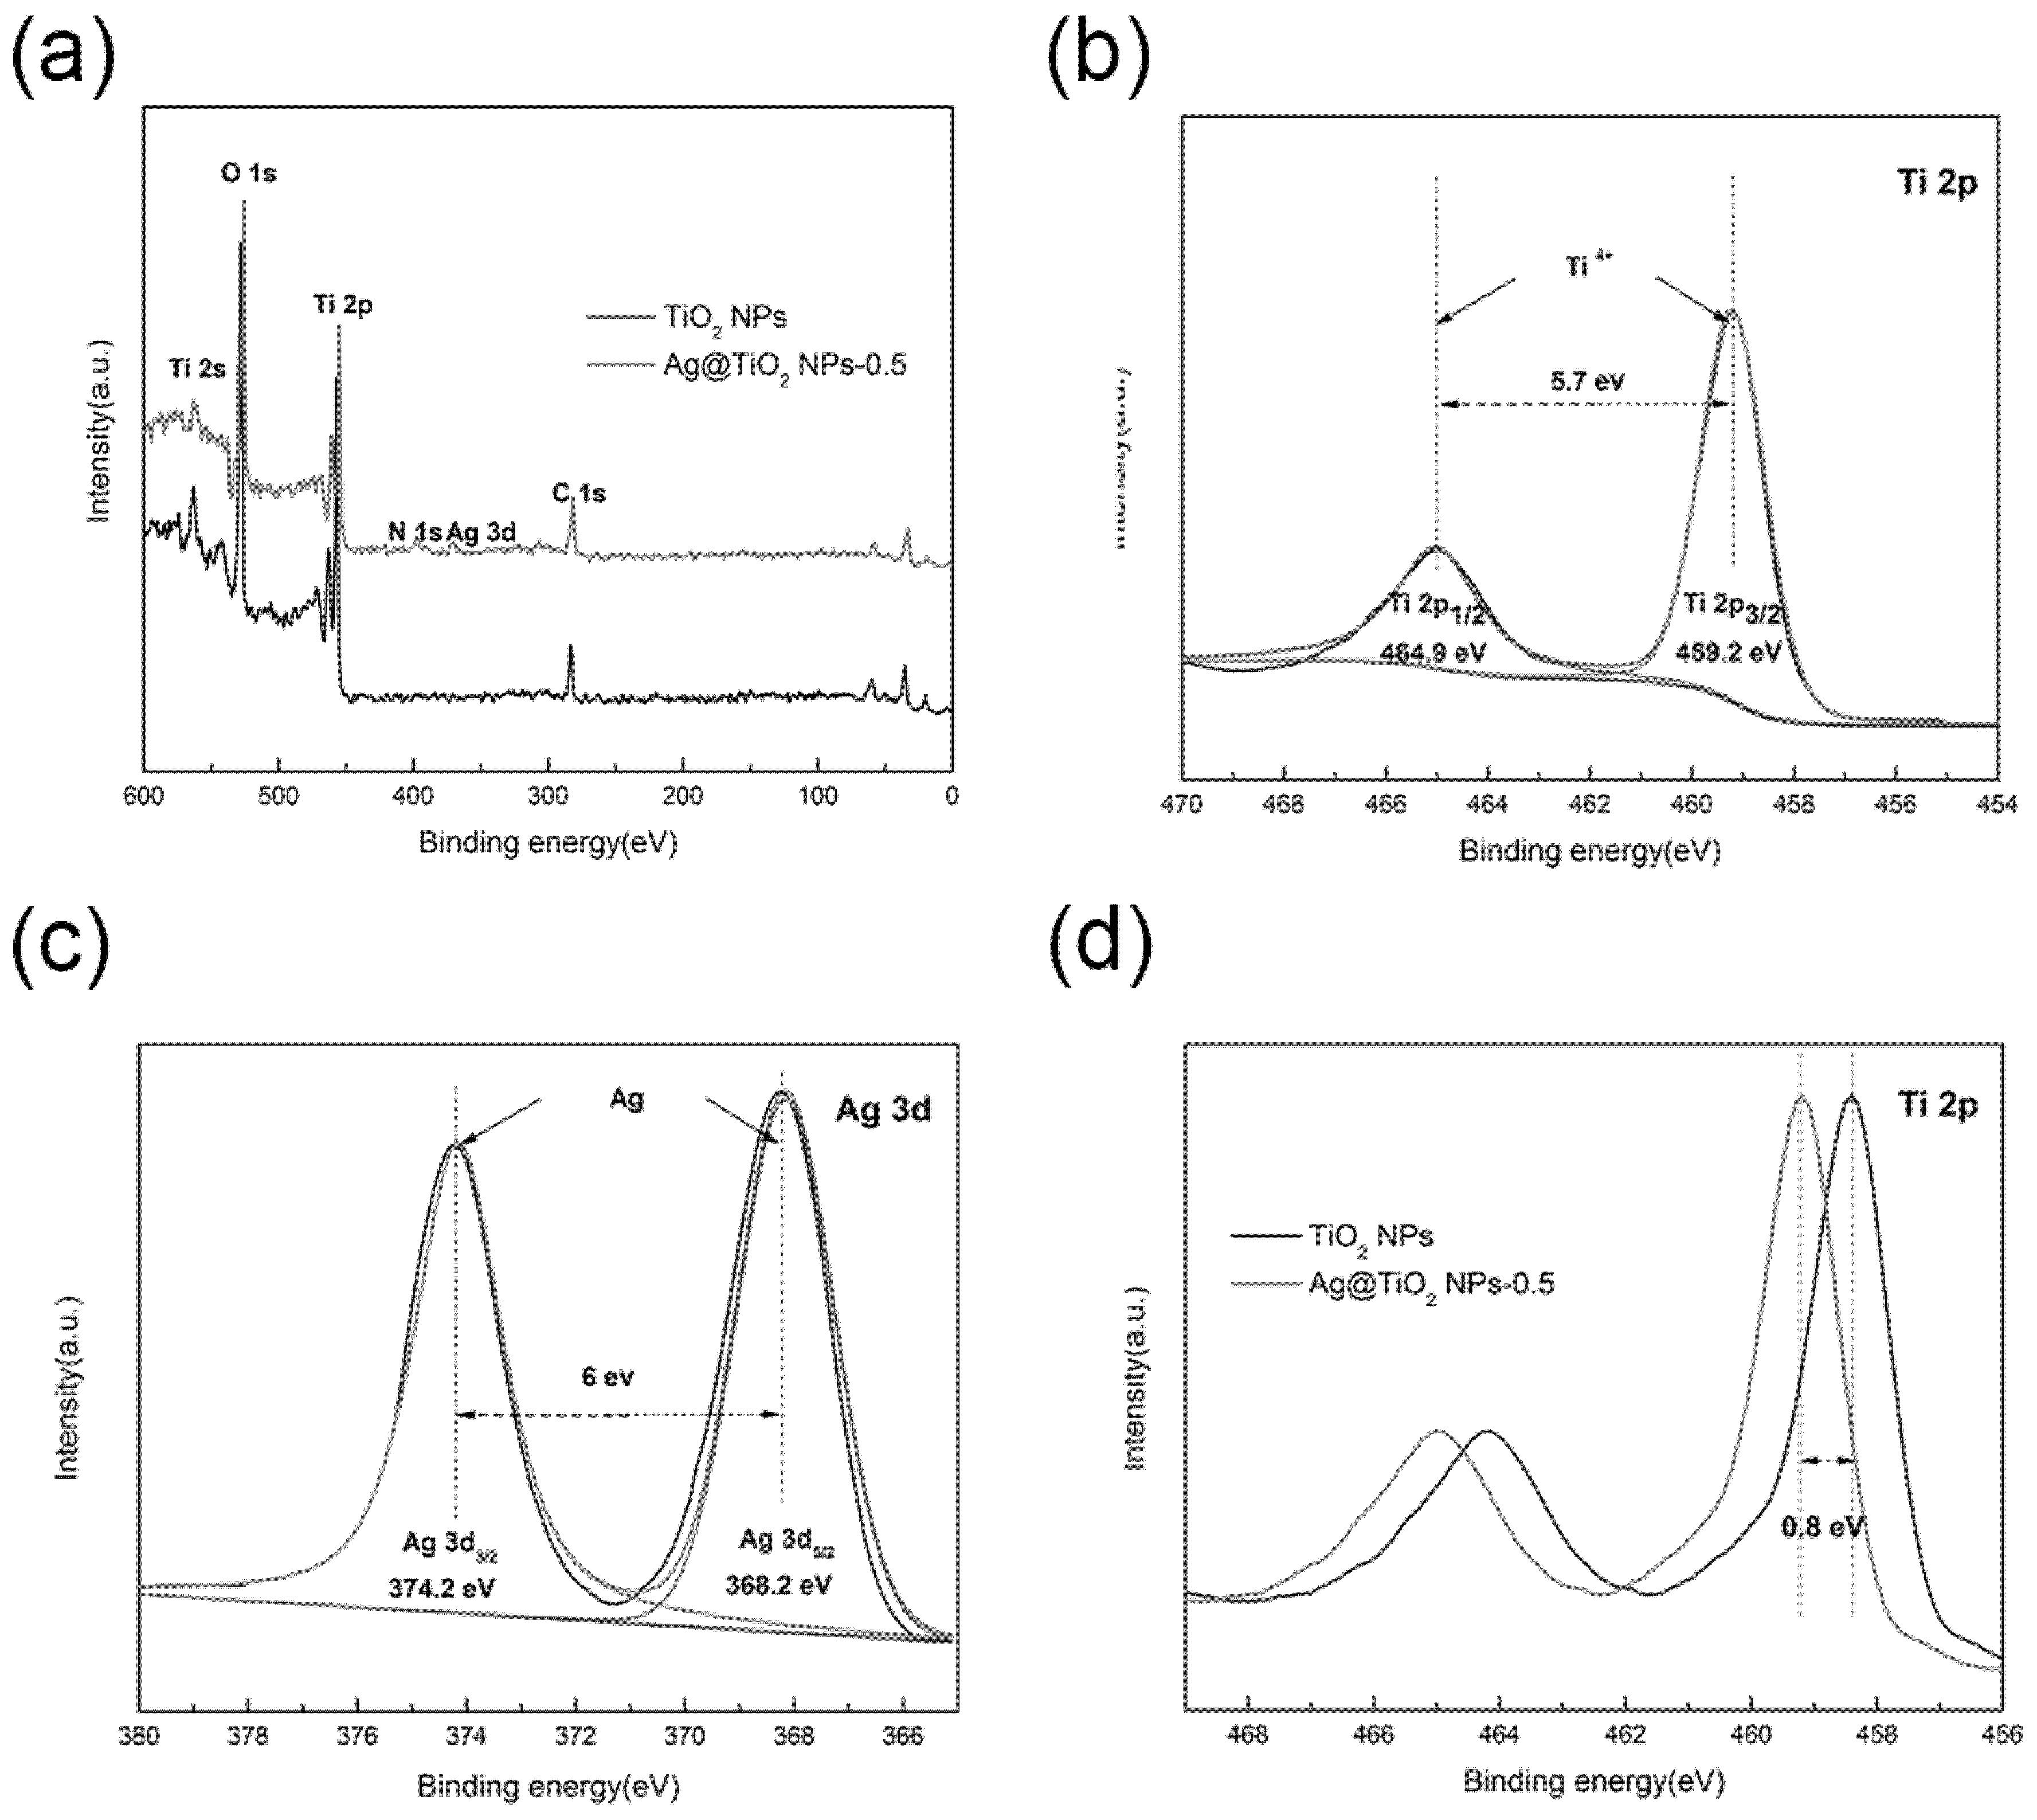
XPS was implemented to further investigate the valence state of Ti and Ag atoms in Ag@TiO2 NPs. The C, O, N, Ti and Ag elements can be observed in the survey spectrum (Figure 4a), whereas the C1s at 286.8 eV is used as a standard to determine the characterization data. Taking Ag@TiO2 NPs-0.5 as an example, the XPS narrow-spectrum Ti 2p is shown in Figure 4b, and the binding energy generated by the spin-orbital splitting of the Ti 2p1/2 and Ti 2p3/2 peaks are 464.9 and 459.2 eV, which clearly proves that Ti exists in the form of Ti4+ in the sample [32,33,34]. Furthermore, compared with pure TiO2 NPs, the binding energy at Ti 2p (Figure 4d) increases by approximately 0.8 eV as the amount of AgNO3 is added. This phenomenon is caused by the difference in Fermi level between TiO2 and Ag, where electrons are transferred from TiO2 with high energy level to Ag until the energy levels are equal, resulting in a decline in the density of external electron clouds for Ti ions, and an increase in binding energy [35]. Figure 4c exhibits two characteristic peaks of the Ag 3d spectrum, where the binding energy of Ag 3d3/2 is 374.2 eV and Ag 3d5/2 is 368.2 eV. Carefully compared with Ag@TiO2 NPs-1 and Ag@TiO2 NPs-0.25 (Figure S1a,b), it can be seen that the splitting width between Ag 3d3/2 and Ag 3d5/2 are also 6 eV, indicating the presence of Ag0 chemical states in the Ag@TiO2 NPs [36].
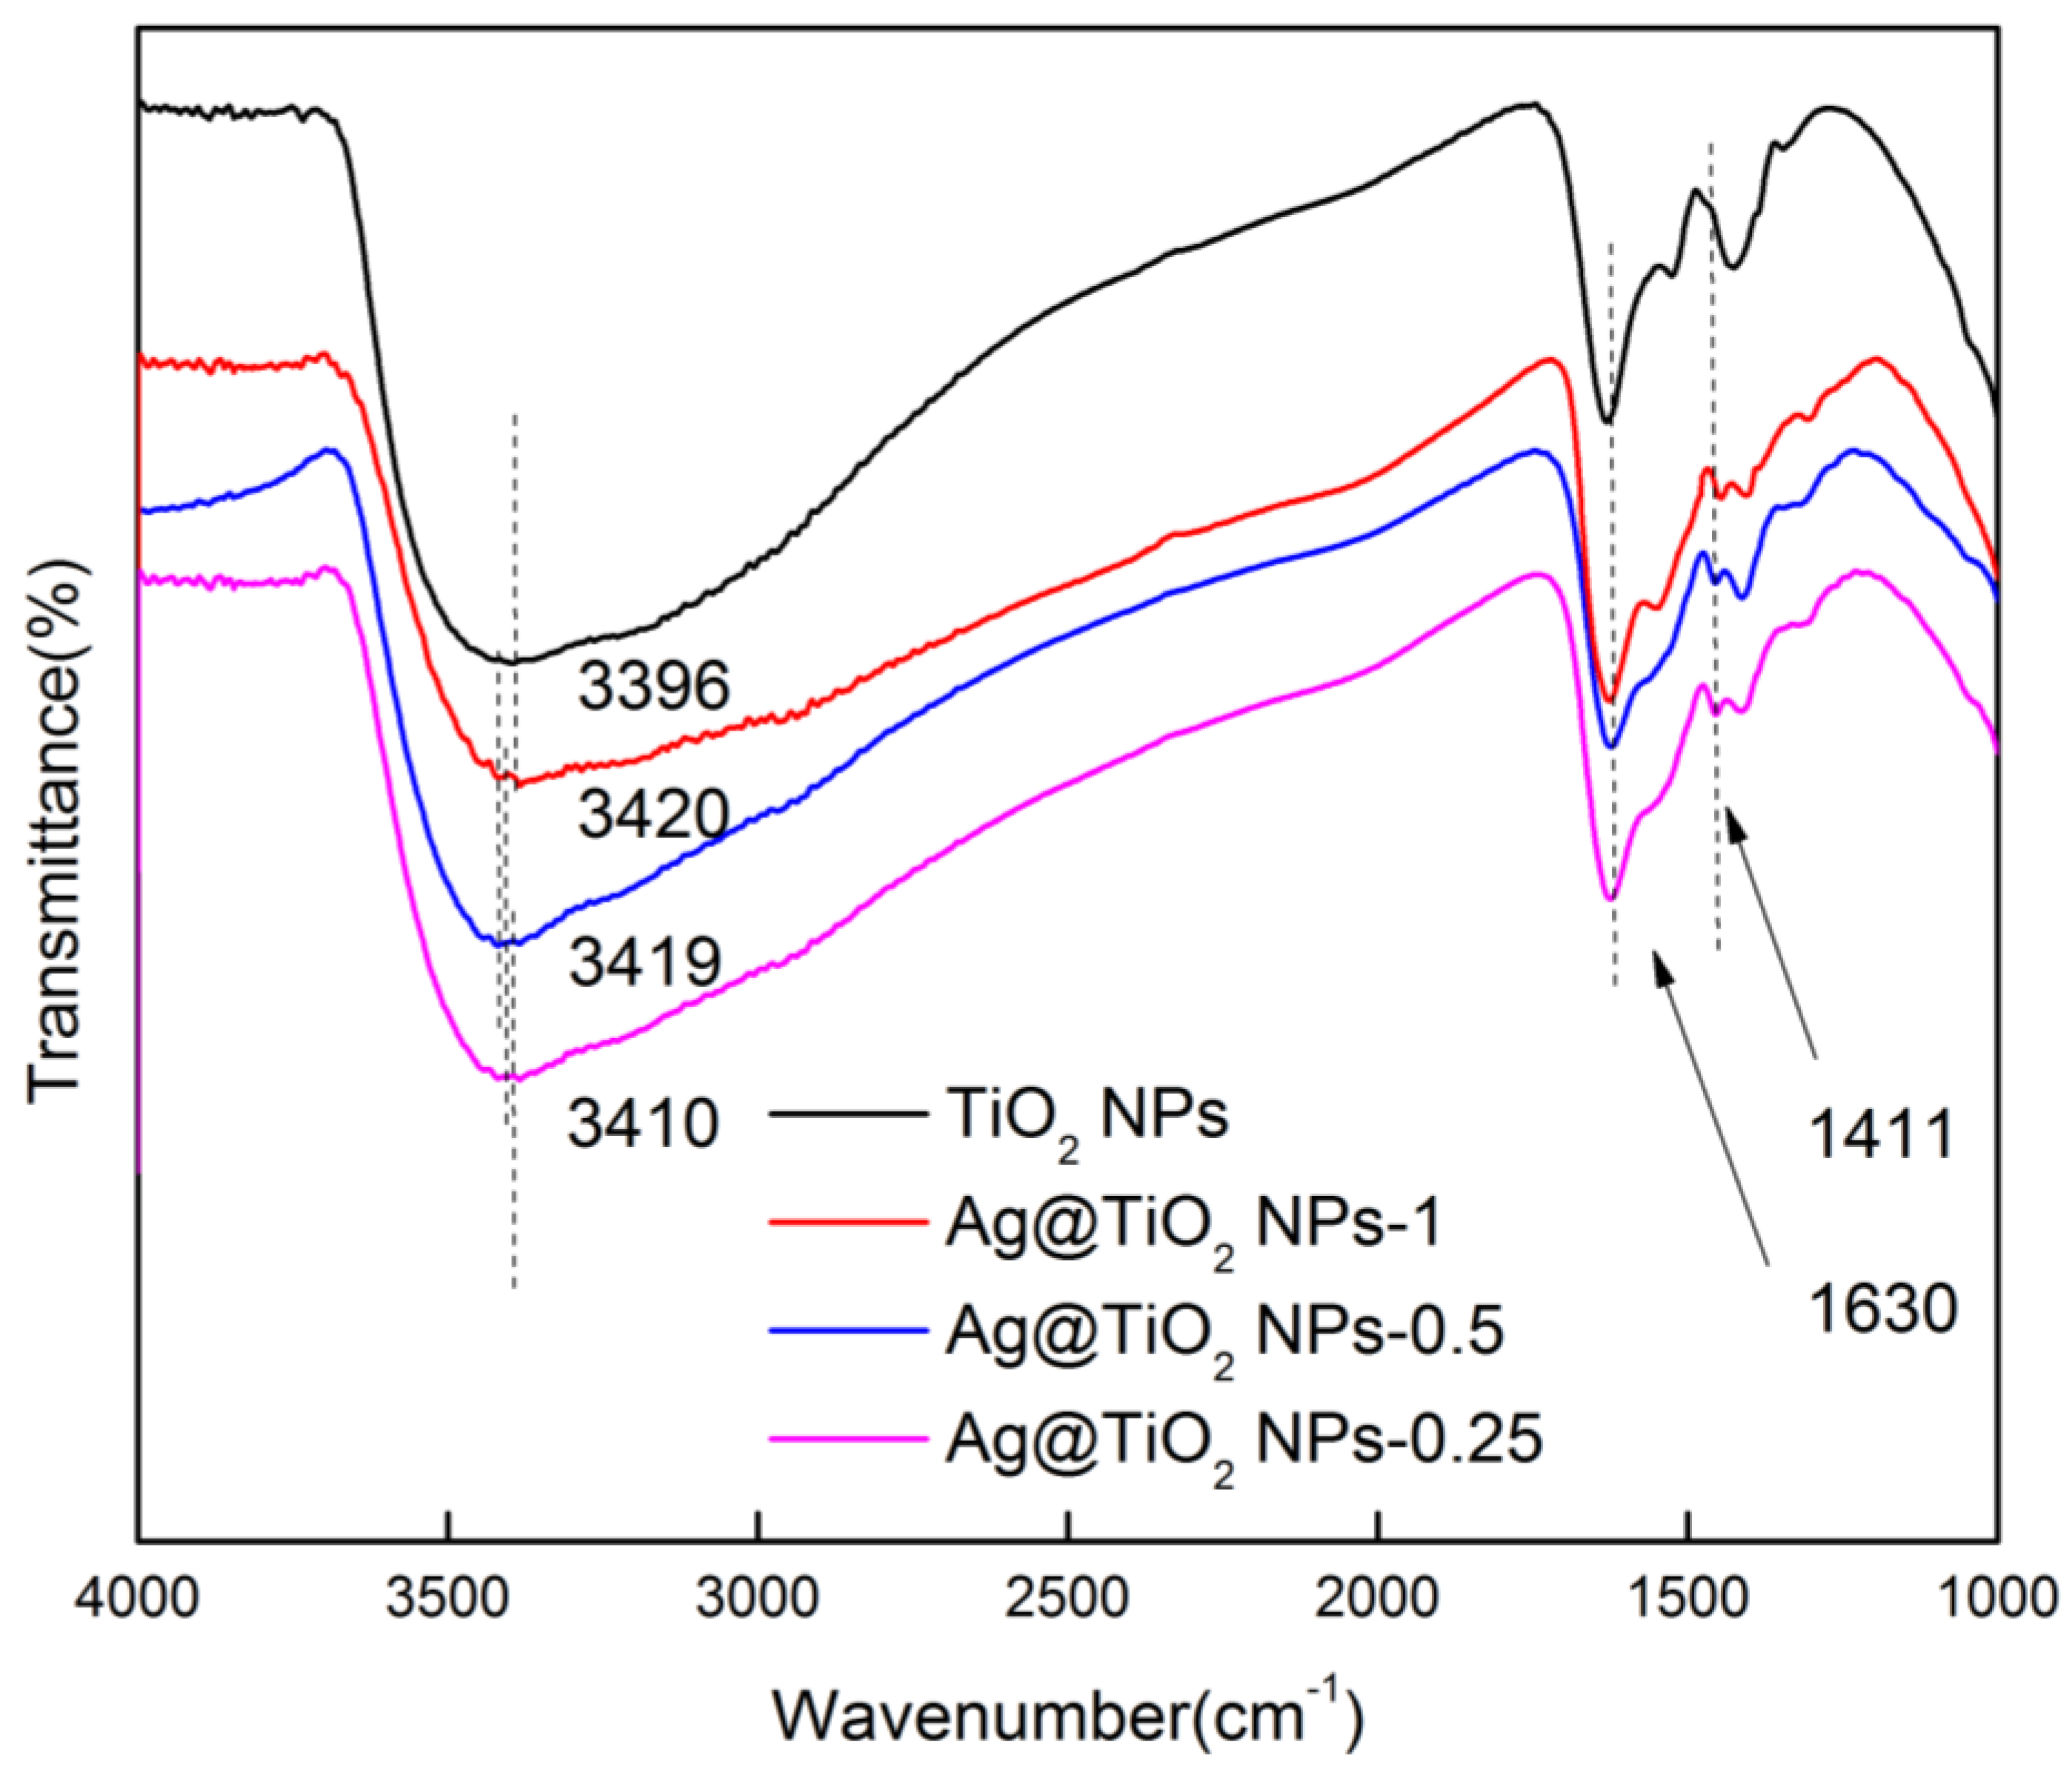
Figure 5 shows the FTIR spectrum of TiO2 NPs and Ag@TiO2 NPs catalysts. It shows that the strong absorption peak of TiO2 NPs and Ag@TiO2 NPs at 3396, 3410, 3419 and 3420 cm−1 have similar behavior, which is likely due to hydrogen bonded surface hydroxyl groups and OH of adsorbed water molecules [37,38,39,40]. In addition, the bending vibration peak of the O–H bond can be clearly observed around 1630 cm−1. The signal at 1411 cm−1, a narrow peak of the alcohol O–H bond bending vibration also appears, which is due to the addition of PNP ethanol solution [41].

3.2. Photocatalytic Activity of Ag@TiO2 NPs

Photocatalytic ability is a vital factor in evaluating photocatalysts. Figure S2 shows the UV–Vis diffuse reflectance spectroscopy. The initial absorption edge of pure TiO2 NPs is estimated to be 380 nm with a strong light absorption in the ultraviolet area. The modifications of the Ag NPs can enhance the photocatalytic activity under ultraviolet light, as well as Visible light. With regard to the Ag@TiO2 samples with different loading amounts, compared to that of pure TiO2 NPs, it can be observed that the absorption edges show a slight red shift which also enhances its Visible light photocatalytic activity to some extent [42,43,44,45]. Particularly, Ag@TiO2 NPs-0.5 has the strongest light absorption among these catalysts. This is mainly owing to the suitable content deposition of Ag NPs, which can effectively respond to Visible light caused by plasmon resonance effect and suppress the recombination of electron/hole pairs in order to promote the transfer and transport of photogenerated carriers. However, the excessive number of Ag nanoparticles leads to aggregating together, inhibiting the absorption of light, and providing an active site for the recombination of electron/hole pairs, thus, the light absorption ability is lowered.
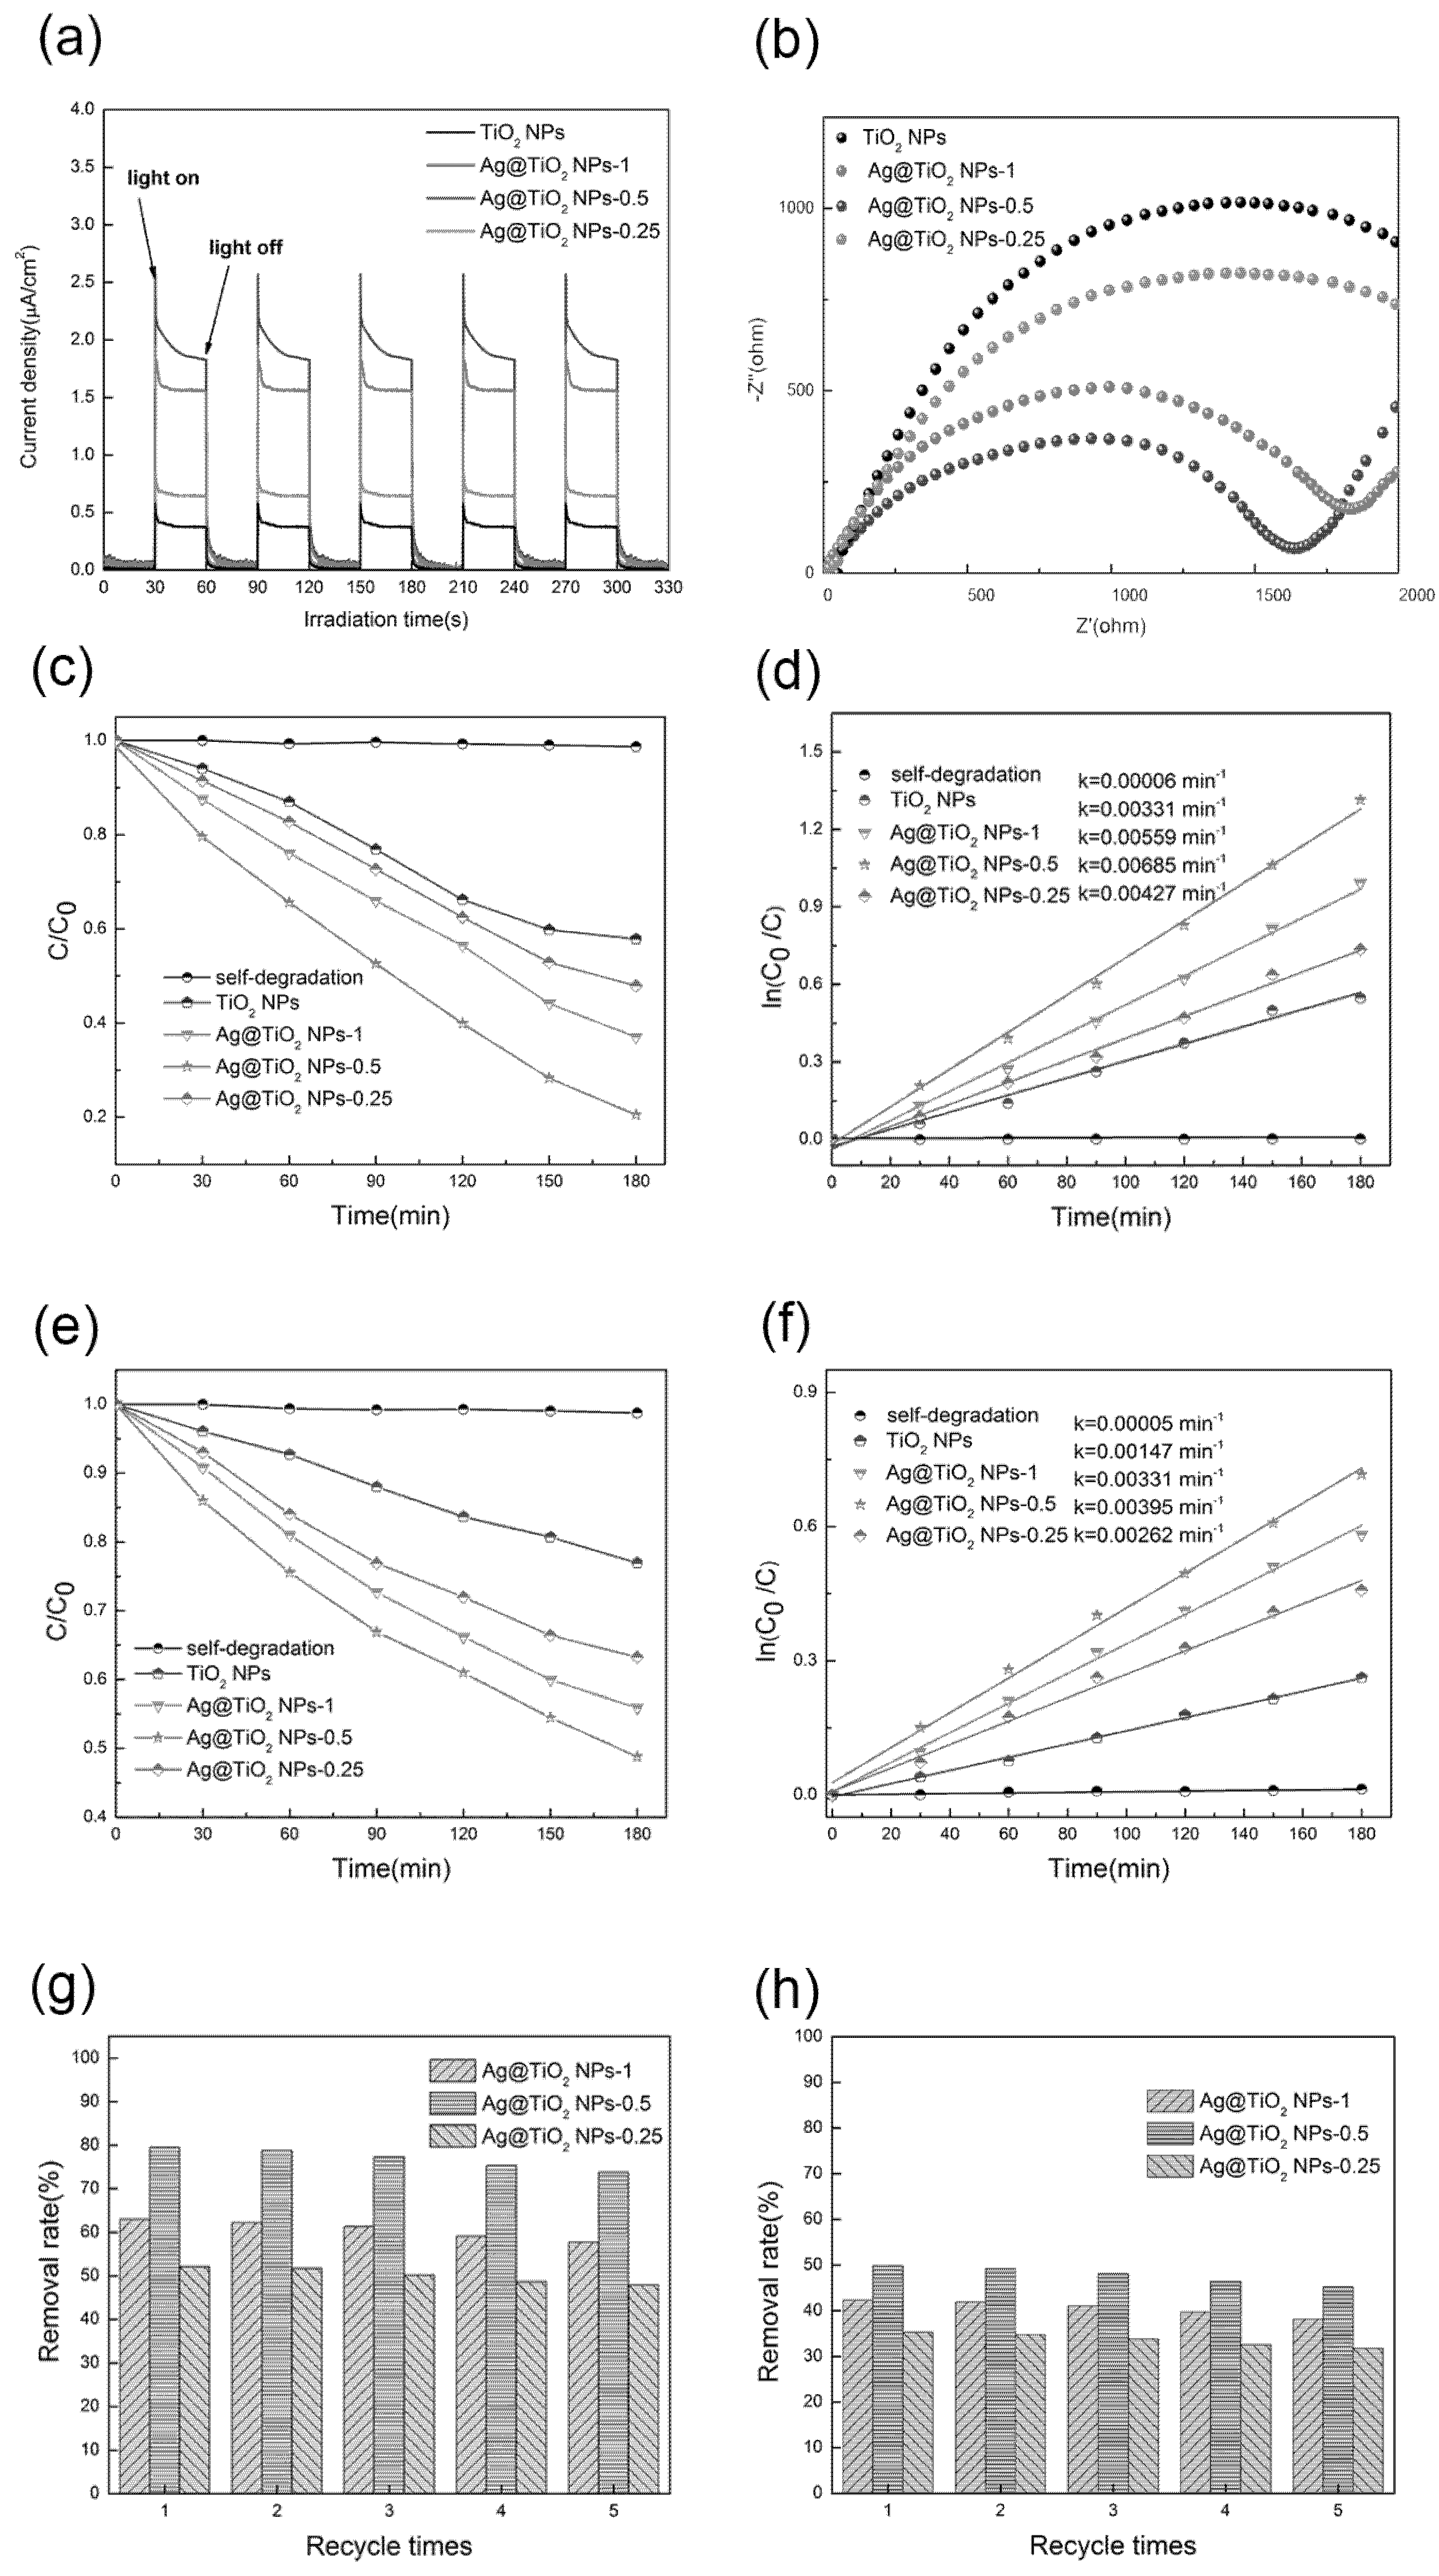
Photocurrent measurement was carried out to evaluate the electron–hole recombination in the as-prepared samples (Figure 6a), where the photocurrent intensity remained steady and reproducible over several intermittent on-off cycle experiments. Apparently, the Ag@TiO2 NPs-0.5 have the strongest photocurrent response which is ~4 times higher than that of pure TiO2 NPs, suggesting that the Ag@TiO2 NPs-0.5 have more effective charges separation and thus inhibit the recombination of electrons and holes under Visible light irradiation [46,47]. Moreover, electrochemical impedance spectra (EIS) measurements were performed to elucidate the charges transfer process of the photogenerated charge carriers. It is generally known that the radius of the Nyquist circle is directly related to charge transfer resistance, with a smaller semicircle radius corresponding to easier electron transfer. From Figure 6b, the radius of the arc in the EIS spectrum of Ag@TiO2 NPs-0.5 is smaller than that of TiO2 NPs and Ag@TiO2 NPs, indicating that highly efficient interfacial charges transfers occur in Ag@TiO2 NPs-0.5.
The photocatalytic abilities of Ag@TiO2 NPs samples were assessed through the degradation of MO. To rule out the interference of MO self-degradation, we performed a self-degradation test on MO. In the condition of no photocatalyst and irradiation for 180 min, nearly no degradation of MO was found, which indicates that MO dye is suitable as a targeted pollutant and available to assess the catalytic ability of the catalyst owing to its steady structure. Figure 6c shows the photodegradation efficiencies after the UV light irradiating for 3 h. The photodegradation efficiency decreases in the order below:
Ag@TiO2 NPs-0.5 > Ag@TiO2 NPs-1 > Ag@TiO2 NPs-0.25 > TiO2 NPs.
The MO photodegradation efficiencies are estimated to be 79.49%, 62.98%, 52.05% and 42.14%, respectively. Clearly, as the molar ratio of Ag increases in a certain range, the degradation of the sample also increases, which implies that Ag plays an important role in photocatalytic degradation. Studies have shown that the photodegradation process of MO conforms to the model of Langmuir–Hinshelwood first-order reaction kinetics. Therefore, the reaction rate constant could be obtained by calculation through the following equation:
ln(C0/C) = k × t,
in which k and t express the rate constant (min−1) of photocatalytic degradation of MO and the irradiation time (min), respectively, while C0 as well as C represent the concentration of MO after adsorption equilibrium and reaction time, respectively. Figure 6d proposes the linear fit of the photocatalytic degradation time against ln(C0/C). It is worth noting that the catalytic reaction rate of Ag@TiO2 NPs-0.5 is 2.7 times higher than TiO2 NPs, which exhibits the optimum catalytic performance among photocatalysts above [48].
The photodegradation efficiencies under Visible light irradiation for 3 h are shown in Figure 6e, which has similar behavior to the catalysis under UV conditions. Ag@TiO2 NPs-0.5 shows the strongest photocatalytic effect, and 50% of MO is decomposed after 180 min irradiation. To better compare the photocatalytic performance of these samples, the reaction kinetics of MO degradation is also investigated in Figure 6f. Obviously, Ag@TiO2 NPs-0.5 has the maximum k value of 0.00395 min−1, which is almost 2.6 times as high as that of TiO2 NPs.
In addition, the UV-absorption spectrum of the Ag@TiO2 NPs-0.5 suspension was recorded during the process of photocatalytic degradation. As the UV light irradiation time increases, it is apparent that the MO absorption band intensity decreases gradually. As shown in Figure S3a, after 60 min, the band intensity decreases rapidly with time and has been levelled off after 150 min. According to previous experiments, the chromophoric group of MO is the azo group (–N=N–), which corresponds to the wavelength of 463 nm [49]. The absorption maximum of band intensity at 463 nm was measured to estimate the concentration of MO in the solution and the catalytic effect can be visually observed. The corresponding color changes using Ag@TiO2 NPs-0.5 are also depicted in the Figure S3b. Moreover, a total organic carbon (TOC) analysis was performed under UV and Visible light condition to further confirm the degree of oxidation (Figure S4). Through the measurement of TOC analyzer, the mineralization rate of MO over the Ag@TiO2 NPs-0.5 can be up to 72.32% under UV light and 47.08% under Visible light irradiation. Compared with the photocatalytic degradation curves of TiO2 NPs and Ag@TiO2 NPs samples (Figure 6c,e), the TOC degradation efficiency of MO is relatively lower than the degradation rates, which proves that MO is decomposed into CO2 and H2O, accompanied with the formation of a certain intermediates in the process of photocatalytic degradation [50,51].
The stability and repeatability of the catalyst are of decisive significance in practical applications. In order to get insights into the reusability, the recycling capability of the photocatalyst is carried out with the Ag@TiO2 NPs samples. In our test, the nanocomposite photocatalysts of MO were collected by centrifugation and then replaced into the same concentration of MO solution after each photodegradation. As displayed in Figure 6g,h, the removal rate after five consecutive runs is only slightly changed and on the 5th regeneration cycle, the degradation efficiency of the MO under UV light is higher than 90% of the initial amount, as well as under the Visible light condition [52].
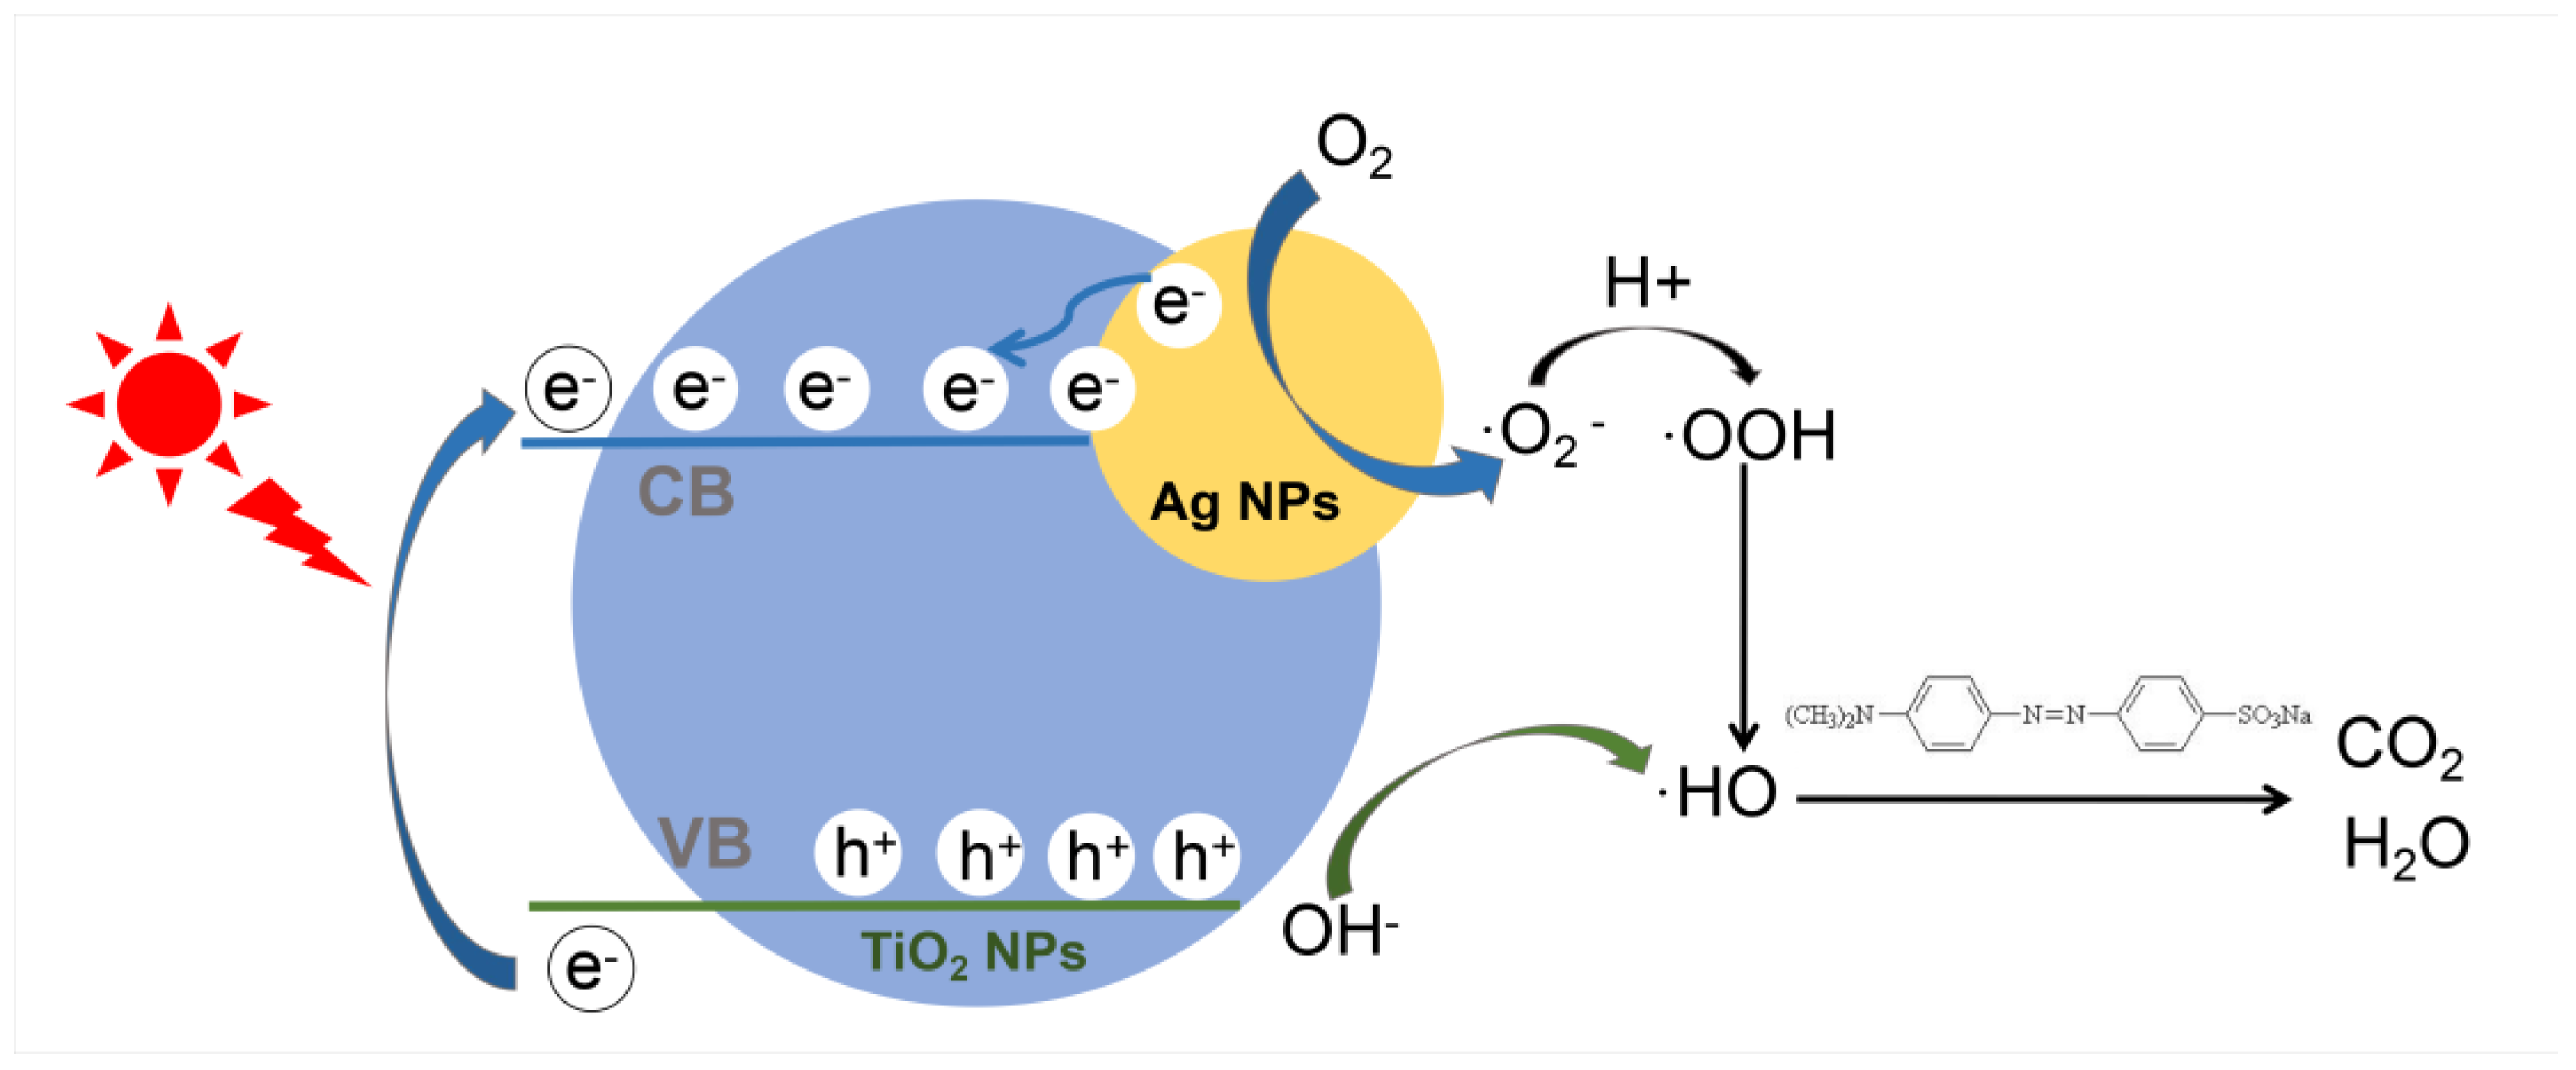
It can be seen in Scheme 2 that a credible approach to enhance photocatalytic activity is proposed based on experimental analysis and discussion. On the one hand, Ag deposited NPs, a Schottky barrier has appeared at the interface between metal and semiconductor in UV light as a result of the lower Fermi level of Ag, and then the photoinduced electrons are transferred from the CB of TiO2 to the Ag nanoparticles, promoting electron/hole pairs to separate [53,54]. What is more, the lifetimes of the charge carriers are increased, and the photocatalytic activity is improved because of the separation of photogenerated electrons and holes in this process. On the other hand, caused by the surface plasmon resonance effect, Ag nanoparticles are easily excited in the condition of being exposed to Visible light, which produces the large number of electrons on the surface. These electrons are transferred to the CB to enhance the absorbance value of TiO2 in the Visible region [55,56]. During the photocatalytic process, the electrons accumulated on the TiO2 react with the oxygen molecules existed on the surface or dissolved in the water, and are reduced to the activated superoxide anion radical∙O2, which can remove organic pollutants or further generate oxides through a series of reactions with H+. Meanwhile, holes can oxidize -OH or H2O to strong oxidizing ∙OH radicals. Finally, strong oxidizing radicals ∙OH will oxidize MO to form CO2 as well as a small number of partially oxidized intermediates [57,58].

4. Conclusions

In this work, a composite photocatalyst of TiO2 NPs decorated with Ag NPs was prepared by the method of one-step synthesis, and the mass moral of PNP is also an important part in the dispersion and size of the growing particles in the hydrothermal reaction. The results indicate that Ag@TiO2 NPs-0.5 shows the highest level of degradation efficiency, the mineralization rate of MO and shows the significant absorption range of Visible light. Beyond that, the Ag@TiO2 NPs exhibit outstanding recyclability and retain over 90% of the original catalytic level for MO after five cycles of recycling. Therefore, there is a broad developing prospect in this work of photocatalytic hydrogen production, solar cells, sensors, rechargeable electrodes and exhaust gas treatment.

Supplementary Materials

The following are available online at https://www.mdpi.com/2079-4991/8/12/1032/s1; Figure S1: Ag 3d high resolution spectra of Ag@TiO2 NPs-1 (a) and Ag@TiO2 NPs-0.25 (b); Figure S2. Optical absorption spectroscopy; Figure S3: UV absorption spectrum during MO degrade process under UV light; Figure S4: Mineralization rates of MO by the samples under UV and Visible light irradiation. Samples 1–4 denote pure TiO2 NPs, Ag@TiO2 NPs-0.5, Ag@TiO2 NPs-0.25 and Ag@TiO2 NPs-1.

Author Contributions

Y.Z., D.Z. and Y.C. designed and conceived of the experiments; Y.Z. and F.F. performed the experiments; Y.L. and Y.Z. wrote the manuscript and analyzed the data.

Funding

The authors are grateful for the financial support by the National Natural Science Foundation of China (No. 51403141).

Acknowledgments

This research testing was supported by the National Engineering Laboratory for Modern Silk of China.

Conflicts of Interest

The authors declare no conflicts of interest.

References

  1. Wang, R.; Hashimot, K.; Fujishima, A.; Chikuni, M.; Kojima, E.; Kitamura, A.; Shimohigoshi, M.; Watanabe, T. Light-induced amphiphilic surfaces. Nature 1997, 388, 431–432. [Google Scholar] [CrossRef]
  2. Xu, X.; Randorn, C.; Efstathiou, P.; Irvine, J.T. A red metallic oxide photocatalyst. Nat. Mater. 2012, 11, 595–598. [Google Scholar] [CrossRef] [PubMed]
  3. Arul, N.S.; Mangalaraj, D.; Chen, P.C.; Ponpandian, N.; Meena, P.; Masuda, Y. Enhanced photocatalytic activity of cobalt-doped CeO2, nanorods. J. Sol-Gel Sci. Technol. 2012, 64, 515–523. [Google Scholar] [CrossRef]
  4. Kansal, S.K.; Kundu, P.; Sood, S.; Lamba, R.; Umar, A.; Mehta, S.K. Photocatalytic degradation of the antibiotic levofloxacin using highly crystalline TiO2 nanoparticles. New J. Chem. 2014, 38, 3220–3226. [Google Scholar] [CrossRef]
  5. Chan, S.C.; Barteau, M.A. Preparation of Highly Uniform Ag/TiO2 and Au/TiO2 Supported Nanoparticle Catalysts by Photodeposition. Langmuir 2005, 21, 5588–5595. [Google Scholar] [CrossRef] [PubMed]
  6. Pumera, M.; Ambrosi, A.; Bonanni, A.; Chng, E.L.K.; Poh, H.L. Graphene for electrochemical sensing and biosensing. Trac-Trends Anal. Chem. 2010, 29, 954–965. [Google Scholar] [CrossRef]
  7. Shen, X.; Zhu, L.; Liu, G.; Yu, H.; Tang, H. Enhanced Photocatalytic Degradation and Selective Removal of Nitrophenols by Using Surface Molecular Imprinted Titania. Environ. Sci. Technol. 2008, 42, 1687–1692. [Google Scholar] [CrossRef] [PubMed]
  8. Shao, Y.; Wang, J.; Wu, H.; Liu, J.; Aksay, I.A.; Lin, Y. Graphene Based Electrochemical Sensors and Biosensors: A Review. Electroanalysis 2010, 22, 1027–1036. [Google Scholar] [CrossRef] [Green Version]
  9. Wang, M.; Hu, Y.; Han, J.; Guo, R.; Xiong, H.; Yin, Y. TiO2/NiO hybrid shells: P-n junction photocatalysts with enhanced activity under visible light. J. Mater. Chem. A 2015, 3, 20727–20735. [Google Scholar] [CrossRef]
  10. An, H.; Park, S.Y.; Huh, J.Y.; Kim, H.; Lee, Y.C.; Lee, Y.B.; Hong, Y.C.; Lee, H.U. Nanoporous hydrogenated TiO2 photocatalysts generated by underwater discharge plasma treatment for solar photocatalytic applications. Appl. Catal. B 2017, 211, 126–136. [Google Scholar] [CrossRef]
  11. Shao, J.; Sheng, W.; Wang, M.; Li, S.; Chen, J.; Zhang, Y.; Cao, S. In situ synthesis of carbon-doped TiO2 single-crystal nanorods with a remarkably photocatalytic efficiency. Appl. Catal. B 2017, 209, 311–319. [Google Scholar] [CrossRef]
  12. Chai, X.; Zhang, H.; Cheng, C. 3D FTO inverse opals@hematite@TiO2 hierarchically structured photoanode for photoelectrochemical water splitting. Semicond Sci. Technol. 2017, 32, 4003. [Google Scholar] [CrossRef]
  13. Monfort, O.; Raptis, D.; Satrapinskyy, L.; Roch, T.; Plesch, G.; Lianos, P. Production of hydrogen by water splitting in a photoelectrochemical cell using a BiVO4/TiO2 layered photoanode. Electrochim. Acta 2017, 251, 244–249. [Google Scholar] [CrossRef]
  14. Chen, Y.; Tang, Y.; Luo, S.; Liu, C.; Li, Y. TiO2 nanotube arrays co-loaded with Au nanoparticles and reduced graphene oxide: Facile synthesis and promising photocatalytic application. J. Alloys Compd. 2013, 578, 242–248. [Google Scholar] [CrossRef]
  15. Green, I.X.; Tang, W.; Neurock, M.; Yates, J.T. Localized partial oxidation of acetic acid at the dual perimeter sites of the Au/TiO2 catalyst-formation of gold ketenylidene. J. Am. Chem. Soc. 2012, 134, 13569–13572. [Google Scholar] [CrossRef] [PubMed]
  16. Pandikumar, A.; Sivaranjani, K.; Gopinath, C.S.; Ramaraj, R. Aminosilicate sol-gel stabilized N-doped TiO2-Au nanocomposite materials and their potential environmental remediation applications. RSC Adv. 2013, 3, 13390–13398. [Google Scholar] [CrossRef]
  17. Yu, Y.; Wen, W.; Qian, X.; Liu, J.; Wu, J. UV and visible light photocatalytic activity of Au/TiO2 nanoforests with Anatase/Rutile phase junctions and controlled Au locations. Sci. Rep. 2017, 7, 41253. [Google Scholar] [CrossRef] [PubMed]
  18. Xiang, X.; Yu, Y.; Wen, W.; Wu, J. Construction of hierarchical Ag@TiO2@ZnO nanowires with high photocatalytic activity. New J. Chem. 2017, 42, 265–271. [Google Scholar] [CrossRef]
  19. Sun, T.; Liu, E.; Fan, J.; Hu, X.; Wu, F.; Hou, W.; Yang, Y.; Kang, L.; Hou, W.; Yang, Y.; et al. High photocatalytic activity of hydrogen production from water over Fe doped and Ag deposited anatase TiO2 catalyst synthesized by solvothermal method. Chem. Eng. J. 2013, 228, 896–906. [Google Scholar] [CrossRef]
  20. Yang, Y.; Liu, E.; Dai, H.; Kang, L.; Wu, H.; Fan, J.; Hu, X.; Liu, H. Photocatalytic activity of Ag-TiO2-graphene ternary nanocomposites and application in hydrogen evolution by water splitting. Int. J. Hydrogen Energy 2014, 39, 7664–7671. [Google Scholar] [CrossRef]
  21. Zhang, D.; Liu, X.; Li, J.; Xu, H.; Lin, H.; Chen, Y. Design and fabrication of a new class of nano hybrid materials based on reactive polymeric molecular cages. Langmuir 2013, 29, 11498–11505. [Google Scholar] [CrossRef] [PubMed]
  22. Zhang, D.; Xiong, J.; Li, C.; Zhang, Y.; Toh, G.W.; Lin, H.; Chen, Y. Synthesis of size tunable gold nanoparticles polymeric hybrid based on molecular nanocages. Micro Nano Lett. 2014, 9, 235–238. [Google Scholar] [CrossRef]
  23. Li, M.; Li, J.; Sun, H. Decolorizing of azo dye Reactive red 24 aqueous solution using exfoliated graphite and H2O2 under ultrasound irradiation. Ultrason. Sonochem. 2008, 15, 717–723. [Google Scholar] [CrossRef] [PubMed]
  24. Jung, H.Y.; Yeo, I.S.; Kim, H.C.; Ki, H.C.; Gu, H.B. Surface plasmon resonance effect of silver nanoparticles on a TiO2, electrode for dye-sensitized solar cells. Appl. Surf. Sci. 2017, 432, 266–271. [Google Scholar] [CrossRef]
  25. Fu, F.; Wang, F.; Li, T.; Jiao, C.; Zhang, Y.; Chen, Y. Synthesis of TiO2NWS@AuNPS Composite Catalyst for Methylene Blue Removal. Materials 2018, 11, 1022. [Google Scholar] [CrossRef] [PubMed]
  26. Li, J.; Liu, X.; Wang, X.; Wang, R. Controlling nanoparticle formation via sizable cages of supramolecular soft materials. Langmuir 2011, 27, 7820–7827. [Google Scholar] [CrossRef] [PubMed]
  27. Iwahori, K.; Takagi, R.; Kishimoto, N.; Yamashita, I. A size controlled synthesis of CuS nano-particles in the protein cage, apoferritin. Mater. Lett. 2011, 65, 3245–3247. [Google Scholar] [CrossRef]
  28. Adachi, M.; Murata, Y.; Takao, J.; Jiu, J.; Sakamoto, M.; Wang, F. Highly Efficient Dye-Sensitized Solar Cells with a Titania Thin-Film Electrode Composed of a Network Structure of Single-Crystal-like TiO2 Nanowires Made by the “Oriented Attachment” Mechanism. J. Am. Chem. Soc. 2004, 126, 14943–14949. [Google Scholar] [CrossRef]
  29. Wang, P.; Han, L.; Zhu, C.; Zhai, Y.; Dong, S. Aqueous-phase synthesis of Ag-TiO2-reduced graphene oxide and Pt-TiO2-reduced graphene oxide hybrid nanostructures and their catalytic properties. Nano Res. 2011, 4, 1153–1162. [Google Scholar] [CrossRef]
  30. An, T.; Yang, H.; Song, W.; Li, G.; Luo, H.; Cooper, W.J. Mechanistic Considerations for the Advanced Oxidation Treatment of Fluoroquinolone Pharmaceutical Compounds using TiO2 Heterogeneous Catalysis. J. Phys. Chem. A 2010, 114, 2569–2575. [Google Scholar] [CrossRef]
  31. Kulkarni, R.M.; Malladi, R.S.; Hanagadakar, M.S.; Doddamani, M.R.; Santhakumari, B.; Kulkarni, S.D. Ru-TiO2, semiconducting nanoparticles for the photo-catalytic degradation of bromothymol blue. J. Mater. Sci. Mater. Electron. 2016, 27, 1–10. [Google Scholar] [CrossRef]
  32. Leshuk, T.; Parviz, R.; Everett, P.; Krishnakumar, H.; Varin, R.A.; Gu, F. Photocatalytic activity of hydrogenated TiO2. ACS Appl. Mater. Interfaces 2013, 5, 1892–1895. [Google Scholar] [CrossRef]
  33. Yu, D.; Yu, X.; Wang, C.; Liu, X.; Xing, Y. Synthesis of Natural Cellulose-Templated TiO2/Ag Nanosponge Composites and Photocatalytic Properties. ACS Appl. Mater. Interfaces 2012, 4, 2781–2787. [Google Scholar] [CrossRef] [PubMed]
  34. Li, H.; Zeng, Y.; Huang, T.; Liu, M. Oxygen vacancies contained TiO2 spheres: Facile fabrication and enhanced ferromagnetism. J. Nanopart. Res. 2012, 14, 1030. [Google Scholar] [CrossRef]
  35. Xin, B.; Jing, L.; Ren, Z.; Wang, B.; Fu, H. Effects of simultaneously doped and deposited Ag on the photocatalytic activity and surface states of TiO2. J. Phys. Chem. B 2005, 109, 2805–2809. [Google Scholar] [CrossRef] [PubMed]
  36. Lin, D.; Wu, H.; Zhang, R.; Pan, W. Enhanced Photocatalysis of Electrospun Ag–ZnO Heterostructured Nanofibers. Chem Mater. 2009, 21, 3479–3484. [Google Scholar] [CrossRef]
  37. Mino, L.; Spoto, G.; Bordiga, S.; Zecchina, A. Particles Morphology and Surface Properties As Investigated by HRTEM, FTIR, and Periodic DFT Calculations: From Pyrogenic TiO2 (P25) to Nanoanatase. J. Phys. Chem. C 2012, 116, 17008–17018. [Google Scholar] [CrossRef]
  38. Mino, L.; Spoto, G.; Bordiga, S.; Zecchina, A. Rutile Surface Properties beyond the Single Crystal Approach: New Insights from the Experimental Investigation of Different Polycrystalline Samples and Periodic DFT Calculations. J. Phys. Chem. C 2013, 117, 11186–11196. [Google Scholar] [CrossRef]
  39. Mino, L.; Zecchina, A.; Martra, G.; Rossi, A.M.; Spoto, G. A surface science approach to TiO2 P25 photocatalysis: An in situ FTIR study of phenol photodegradation at controlled water coverages from sub-monolayer to multilayer. Appl. Catal. B-Environ. 2016, 196, 135–141. [Google Scholar] [CrossRef]
  40. Li, F.B.; Li, X.Z. The enhancement of photodegradation efficiency using Pt–TiO2 catalyst. Chemosphere 2002, 21, 1103–1111. [Google Scholar] [CrossRef]
  41. Colthup, N.B. Spectra-Structure Correlations in the Infra-Red Region. J. Opt. Soc. Am. 1950, 4, 421. [Google Scholar] [CrossRef]
  42. Reddy, D.A.; Lee, S.; Choi, J.; Park, S.; Ma, R.; Yang, H.; Kim, T.K. Green synthesis of AgI-reduced graphene oxide nanocomposites: Toward enhanced visible-light photocatalytic activity for organic dye removal. Appl. Surf. Sci. 2015, 341, 175–184. [Google Scholar] [CrossRef]
  43. Reddy, D.A.; Choi, J.; Lee, S.; Ma, R.; Kim, T.K. Green synthesis of AgI nanoparticle-functionalized reduced graphene oxide aerogels with enhanced catalytic performance and facile recycling. RSC Adv. 2015, 5, 67394–67404. [Google Scholar] [CrossRef]
  44. Choi, J.; Reddy, D.A.; Kim, T.K. Enhanced photocatalytic activity and anti-photocorrosion of AgI nanostructures by coupling with graphene-analogue boron nitride nanosheets. Ceram. Int. 2015, 41, 13793–13803. [Google Scholar] [CrossRef]
  45. Islam, M.J.; Reddy, D.A.; Ma, R.; Kim, Y.; Kim, T.K. Reduced-graphene-oxide-wrapped BiOI-AgI heterostructured nanocomposite as a high-performance photocatalyst for dye degradation under solar light irradiation. Solid State Sci. 2016, 61, 32–39. [Google Scholar] [CrossRef]
  46. Ma, R.; Islam, M.J.; Reddy, D.A.; Kim, T.K. Transformation of CeO2 into a mixed phase CeO2/Ce2O3 nanohybrid by liquid phase pulsed laser ablation for enhanced photocatalytic activity through Z-scheme pattern. Ceram. Int. 2016, 42, 18495–18502. [Google Scholar] [CrossRef]
  47. Lee, S.; Reddy, D.A.; Kim, T.K. Well-wrapped reduced graphene oxide nanosheets on Nb3O7(OH) nanostructures as good electron collectors and transporters for efficient photocatalytic degradation of rhodamine B and phenol. RSC Adv. 2016, 6, 37180–37188. [Google Scholar] [CrossRef]
  48. Reddy, D.A.; Reddy, D.A.; Ma, R.; Choi, M.Y.; Kim, T.K. Reduced graphene oxide wrapped ZnS–Ag2S ternary composites synthesized via hydrothermal method: Applications in photocatalyst degradation of organic pollutants. Appl. Surf. Sci. 2015, 324, 725–735. [Google Scholar] [CrossRef]
  49. Sun, C.; Xu, Q.; Xie, Y.; Ling, Y.; Hou, Y. Designed synthesis of anatase-TiO2 (B) biphase nanowires/ZnO nanoparticles heterojunction for enhanced photocatalysis. J. Mater. Chem. A 2018, 6, 8289–8298. [Google Scholar] [CrossRef]
  50. Islam, M.J.; Kim, H.K.; Reddy, D.A.; Kim, Y.; Ma, R.; Baek, H.; Kim, J.; Kim, T.K. Hierarchical BiOI nanostructures supported on a metal organic framework as efficient photocatalysts for degradation of organic pollutants in water. Dalton Trans. 2017, 46, 6013–6023. [Google Scholar] [CrossRef]
  51. Reddy, D.A.; Choi, J.; Lee, S.; Kim, T.K. Controlled synthesis of heterostructured Ag@AgI/ZnS microspheres with enhanced photocatalytic activity and selective separation of methylene blue from mixture dyes. J. Taiwan Inst. Chem. Eng. 2016, 66, 200–209. [Google Scholar] [CrossRef]
  52. Islam, M.J.; Reddy, D.A.; Han, N.S.; Choi, J.; Song, J.K.; Kim, T.K. An oxygen-vacancy rich 3D novel hierarchical MoS2/BiOI/AgI ternary nanocomposite: Enhanced photocatalytic activity through photogenerated electron shuttling in a Z-scheme manner. Phys. Chem. Chem. Phys. 2016, 18, 24984–24993. [Google Scholar] [CrossRef]
  53. Arshadi, M.; Mousavinia, F.; Amiri, M.J.; Faraji, A.R. Adsorption of methyl orange and salicylic acid on a nano-transition metal composite: Kinetics, thermodynamic and electrochemical studies. J. Colloid Interface Sci. 2016, 483, 118–131. [Google Scholar] [CrossRef] [PubMed]
  54. Islam, M.J.; Reddy, D.A.; Choi, J.; Kim, T.K. Surface oxygen vacancy assisted electron transfer and shuttling for enhanced photocatalytic activity of a Z-scheme CeO2–AgI nanocomposite. RSC Adv. 2016, 6, 19341–19350. [Google Scholar] [CrossRef]
  55. Liu, X.; Xing, Z.; Zhang, Y.; Li, Z.; Wu, X.; Tan, S.; Yu, X.; Zhu, Q.; Zhou, W. Fabrication of 3D flower-like black N-TiO2x@MoS2 for unprecedented-high visible-light-driven photocatalytic performance. Appl. Catal. B-Environ. 2017, 201, 119–127. [Google Scholar] [CrossRef]
  56. Ma, J.; Guo, S.; Guo, X.; Ge, H. A mild synthetic route to Fe3O4@TiO2-Au composites: Preparation, characterization and photocatalytic activity. Appl. Surf. Sci. 2015, 353, 1117–1125. [Google Scholar] [CrossRef]
  57. Choi, J.; Reddy, D.A.; Islam, M.J.; Ma, R.; Kim, T.K. Self-assembly of CeO2 nanostructures/reduced graphene oxide composite aerogels for efficient photocatalytic degradation of organic pollutants in water. J. Alloys Compd. 2016, 688, 527–536. [Google Scholar] [CrossRef]
  58. Yang, B.; He, D.; Wang, W.; Zhuo, Z.; Wang, Y. Gold-plasmon enhanced photocatalytic performance of anatase titania nanotubes under visible-light irradiation. Mater. Res. Bull. 2016, 74, 278–283. [Google Scholar] [CrossRef]
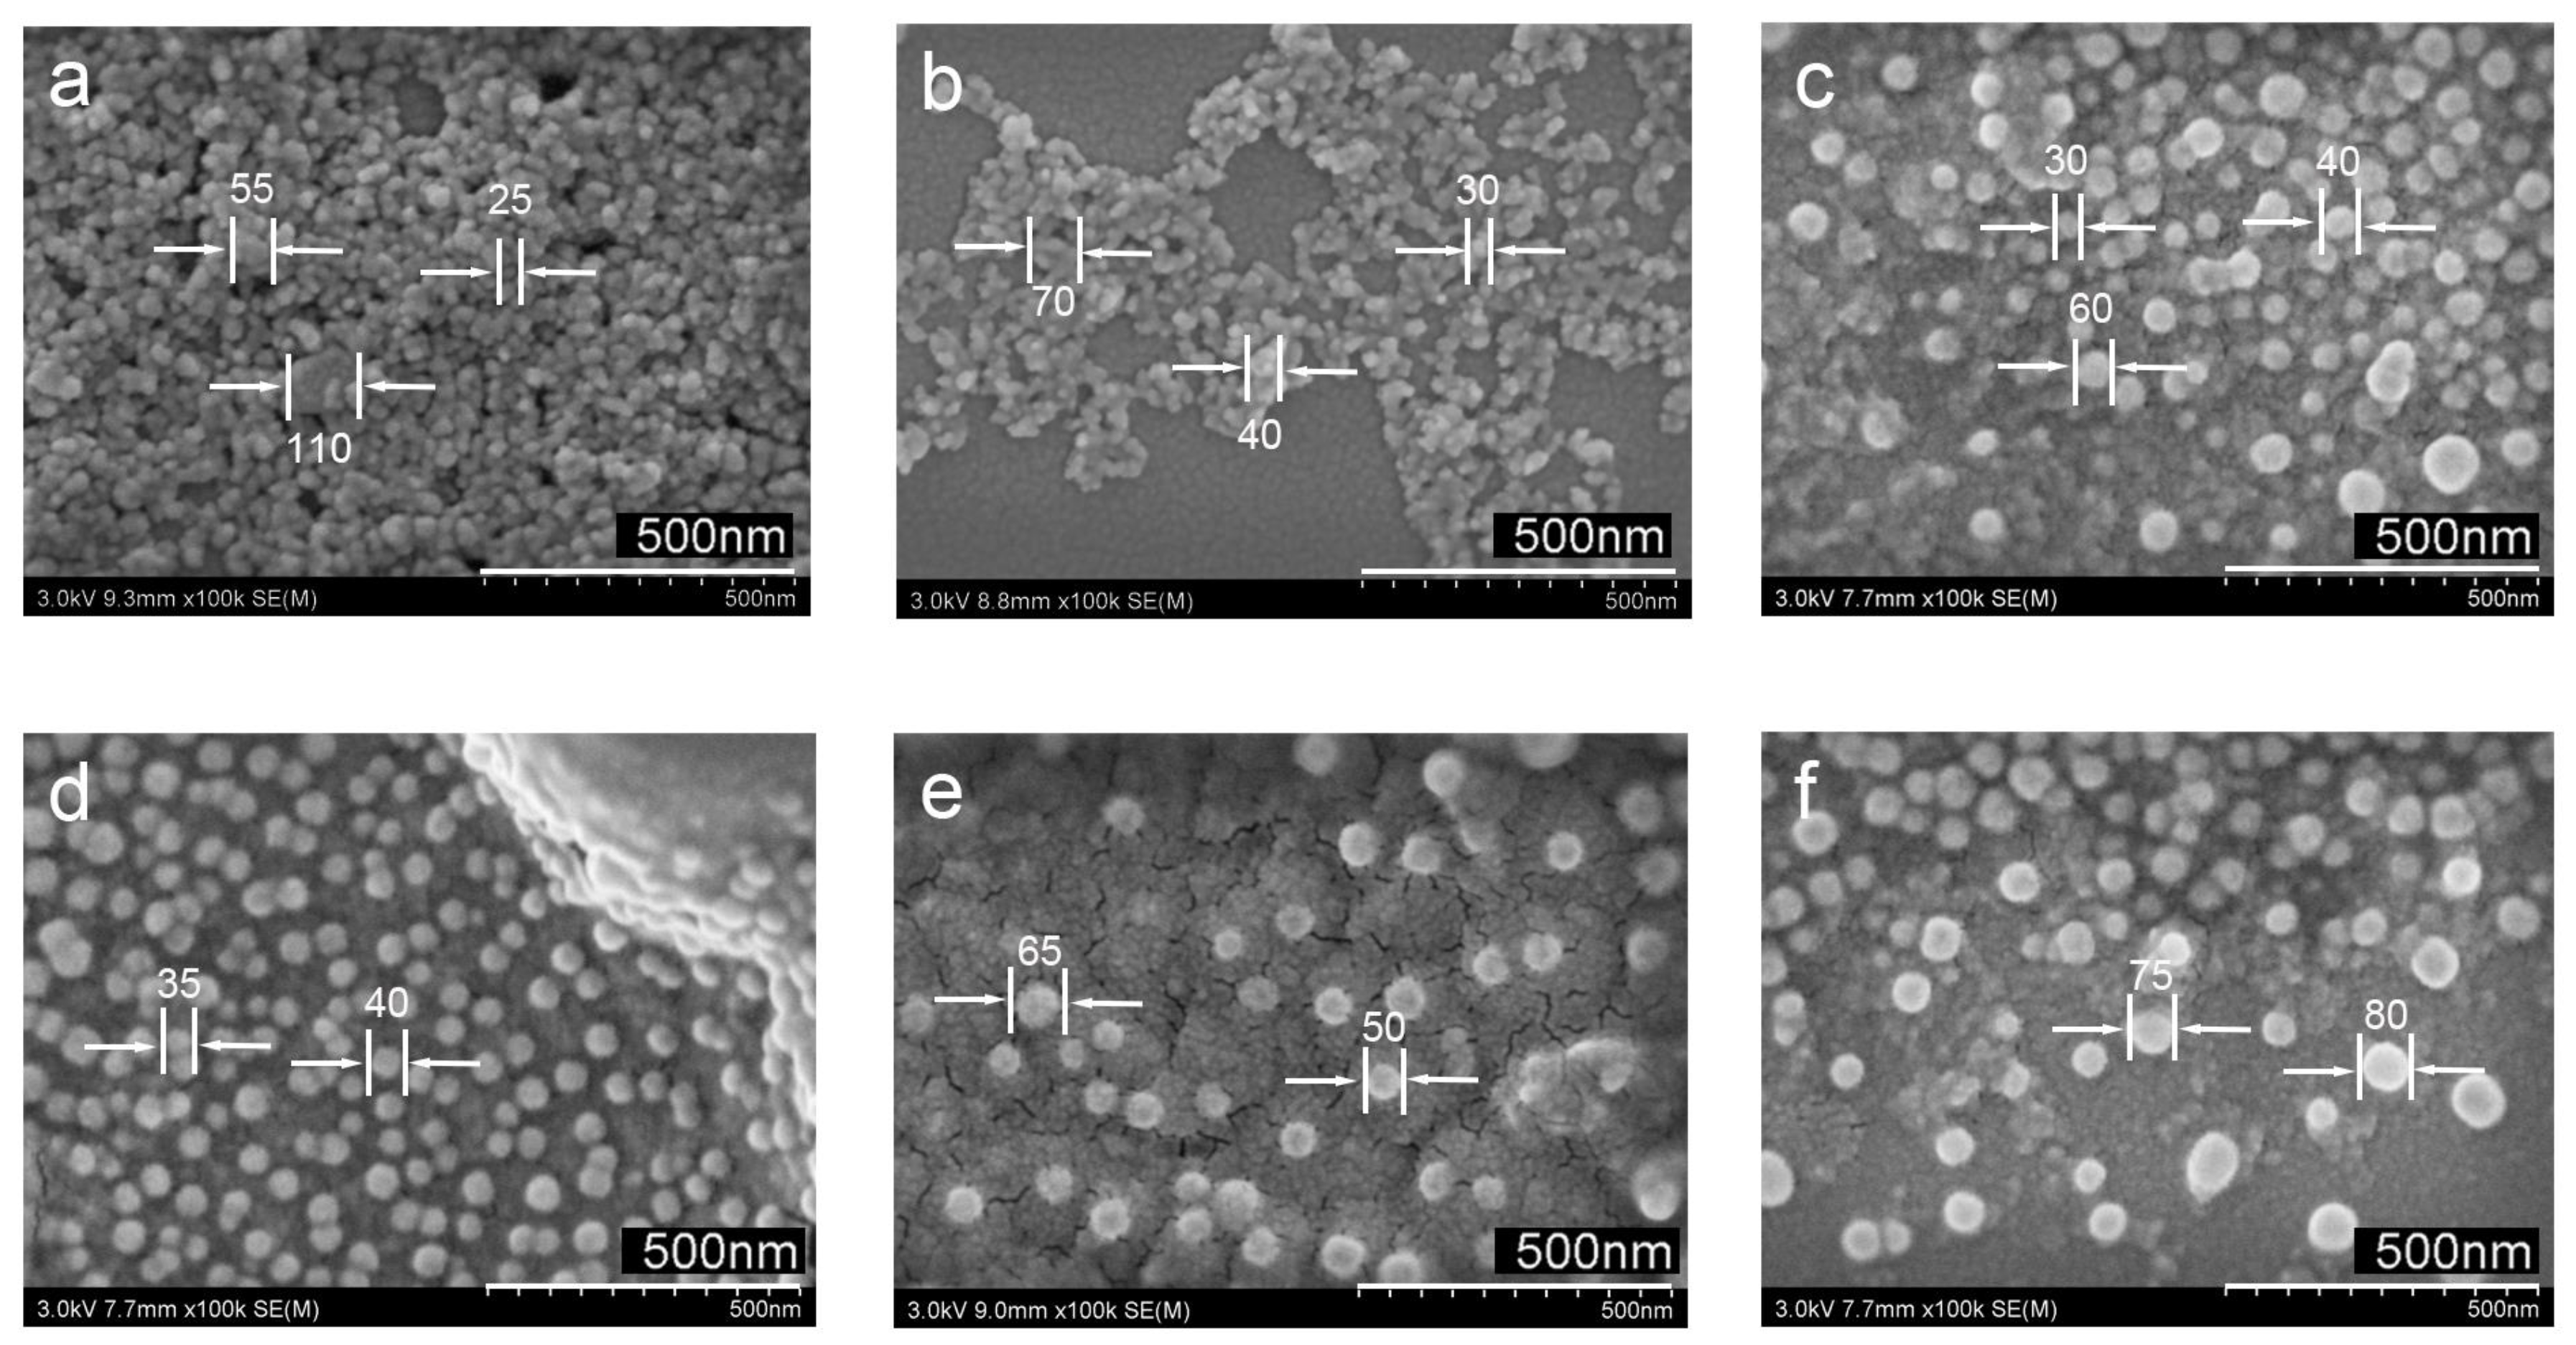
Figure 1. SEM images of TiO2 nanoparticles (NPs) with different molars of polyamide network polymers (PNP): 0 mol (a), 0.25 mol (b), 0.5 mol (c), 1 mol (d), 2 mol (e) and 3.125 mol (f), respectively.
Nanomaterials 08 01032 g001
Scheme 1. Procedure for the synthesis of Ag@TiO2 NPs.
Nanomaterials 08 01032 sch001
Figure 2. Transmission electron microscopy with EDS capabilities (TEM) image of the pure TiO2 NPs (a) and Ag@TiO2 NPs-0.5 (b); selected area electron diffraction (SAED) image of Ag@TiO2 NPs-0.5 (c); high-resolution electron microscopy (HRTEM) image taken from TiO2 NPs (d) and the corresponding fast Fourier transform (FFT) mode; HRTEM image taken from Ag NPs (e) and the corresponding FFT mode; EDS of Ag@TiO2 NPs-0.5 (f).
Nanomaterials 08 01032 g002
Figure 3. X-ray diffraction (XRD) patterns of pure TiO2 NPs, Ag@TiO2 NPs with different molar ratios of 0.25%, 0.5% and 1%.
Nanomaterials 08 01032 g003
Figure 4. XPS spectrum of TiO2 NPs and Ag@TiO2 NPs-0.5 (a); high resolution spectra of Ti 2p (b); Ag 3d (c); Ti 2p of TiO2 NPs and Ag@TiO2 NPs-0.5 (d).
Nanomaterials 08 01032 g004
Figure 5. Fourier transform infrared spectra (FTIR) spectra of pure TiO2 NPs and Ag@TiO2 NPs.
Nanomaterials 08 01032 g005
Figure 6. Photocurrent responses spectroscopy (a) and electrochemical impedance spectroscopy (EIS) (b) of the TiO2 NPs and Ag@TiO2 NPs samples; Methyl Orange (MO) photocatalytic degradation curves of the TiO2 NPs and Ag@TiO2 NPs samples under UV light (c); MO photocatalytic degradation Kinetic fit of the TiO2 NPs and Ag@TiO2 NPs samples under UV light (d); MO photocatalytic degradation curves of the TiO2 NPs and Ag@TiO2 NPs samples under Visible light (e); MO photocatalytic degradation Kinetic fit of the TiO2 NPs and Ag@TiO2 NPs samples under Visible light (f); Cycling performance of Ag@TiO2 NPs samples for MO degradation under UV light (g); Cycling performance of Ag@TiO2 NPs samples for MO degradation under Visible light (h).
Nanomaterials 08 01032 g006
Scheme 2. Schematic diagram of electron transfer in Ag@TiO2 NPs and degradation mechanism of MO.
Nanomaterials 08 01032 sch002