Article

Porous Silicon Photonic Crystals Coated with Ag Nanoparticles as Efficient Substrates for Detecting Trace Explosives Using SERS

Key Laboratory of Energy Materials Chemistry, Ministry of Education, Key Laboratory of Advanced Functional Materials, Autonomous Region, Institute of Applied Chemistry, Xinjiang University, Urumqi 830046, Xinjiang, China
*
Author to whom correspondence should be addressed.
Nanomaterials 2018, 8(11), 872; https://doi.org/10.3390/nano8110872
Submission received: 29 September 2018 / Revised: 13 October 2018 / Accepted: 19 October 2018 / Published: 23 October 2018

Abstract

:
Picric acid (PA) is an organic substance widely used in industry and military, which poses a great threat to the environment and security due to its unstable, toxic, and explosive properties. Trace detection of PA is also a challenging task because of its highly acidic and anionic character. In this work, silver nanoparticles (AgNPs)-decorated porous silicon photonic crystals (PS PCs) were controllably prepared as surface-enhanced Raman scattering (SERS) substrates using the immersion plating solution. PA and Rhodamine 6G dye (R6G) were used as the analyte to explore the detection performance. As compared with single layer porous silicon, the enhancement factor of PS PCs substrates is increased to 3.58 times at the concentration of 10−6 mol/L (R6G). This additional enhancement was greatly beneficial to the trace-amount-detection of target molecules. Under the optimized assay condition, the platform shows a distinguished sensitivity with the limit of detection of PA as low as 10−8 mol/L, the linear range from 10−4 to 10−7 mol/L, and a decent reproducibility with a relative standard deviation (RSD) of ca. 8%. These results show that the AgNPs-modified PS PCs substrates could also find further applications in biomedical and environmental sensing.

1. Introduction

In recent years, ultra-sensitive detection of trace amounts of explosive chemicals has attracted widespread research attention due to the importance of these chemicals in many practical applications, including terrorist attacks, homeland security, and environmental protection [1,2,3,4,5]. Most explosives have low room-temperature vapor pressure; for example, the saturated vapor pressure of 2,4,6-trinitrotoluene (TNT), 2,4-dinitrotoluene (DNT), and picric acid (PA) are 9, 411, and 0.97 ppb, respectively [6]. Therefore, it is difficult to detect explosives quickly and accurately using gas sensors. Ion mobility spectrometry technology has distinct advantages in detecting volatile compounds and is often used to detect trace amounts of some explosives quickly and accurately [7]. Nevertheless, the poor selectivity and poor quantitative analysis hinder further applications of this technology. There has been a consequent demand for a simple, selective, and sensitive quantitative analysis method for the detection of trace explosives [8]. Surface-enhanced Raman spectroscopy (SERS), as a powerful chemical and biological analytical technique, has received much attention from researchers owing to its high surface sensitivity and molecular specificity [9,10]. Some researchers have used this technology to detect trace explosives [11,12,13,14].
Over the last few decades, owing to its unique optical and physical characteristics, porous Si has been widely used as sensors, such as biological sensors [15], electrochemical sensors [16], and optical sensors [17,18]. Among these, SERS-based sensors have received much attention from researchers [18,19,20]. The Raman enhancement effect in these sensors, which depends largely on the type and morphology of SERS substrate, can be attributed to electromagnetic (EM) and chemical mechanisms (CM) [21]. At some sites on a molecule, which can be referred to as “hotspots”, the local electric field becomes very strong; this leads to strong Raman signals from the molecules at these spots. Both the morphology and the substrate materials significantly influence the SERS effect. Noble metals, such as Au and Ag, even Au and Ag alloys, are the most widely used materials in this regard. On the other hand, many researchers have improved upon and optimized the substrate structure to obtain more and stronger electromagnetic hotspots by using sharp edges or tips and porous nanoparticles of these noble metals [3,22]. For example, porous Si coated with Au/Ag nanoparticles has been reported to obtain excellent SERS performance [1,19]. However, most researchers focus on the main SERS effect of single-layer porous Si structures; on the other hand, sensors based on the SERS effect of porous Si photonic crystals are still rarely reported. Particularly, to the best of our knowledge, the application of these sensors in explosives detection has not yet been reported. The photonic crystal structure can enhance the SERS effect of the analyte [23,24]. Unfortunately, most SERS-based sensors are not compatible with existing integrated circuit technology; the preparation process is also more complex. This hinders further application of SERS-based sensors. Porous Si is a sponge-like silicon material with very large specific surface areas, which is often prepared by anodic electrochemical etching. In recent years, porous Si has been widely used in many applications because of its excellent photoelectric properties and chemical properties, such as biological sensors [17,25], solar cell [26], biomedical devices [27], and catalysis [28]. The porosity of the material is controlled by varying the anodization current density, and the pore length is controlled by varying the time of etching for a certain etchant at constant temperature [29]. The pore diameter and surface morphology can also be tuned by varying the etching parameters and the Si wafer type. Thus, the preparation of porous silicon by anodic electrochemical etching is simple, and the repeatability of the process is very good [30]. Thus, this method is very suitable for the preparation of porous Si photonic crystals (PS PCs).
In this study, the porous Si photonic crystals modified by Ag nanoparticles (AgNPs) as a SERS substrate were designed for qualitative identification and quantitative determination of trace amounts of R6G and PA explosives by the SERS method (Scheme 1). Porous Si photonic crystals were obtained by an anodic electrochemical etching method. AgNPs were prepared on PS PCs by a simple, controllable immersion plating technique. Compared with single-layer porous Si, the enhancement factor of the PS PC substrate is increased 3.58 times at the R6G concentration of 10−6 M. This enhancement was greatly beneficial for the trace-amount-detection of target molecules. Under optimal conditions, the observed detection limit of the explosive PA was estimated to be as low as 10−8 mol/L. Moreover, a satisfying linear relationship (R2 = 0.9667) in the concentration range between 1.0 × 10 −7 and 1.0 × 10⁻⁴ mol/L was obtained.

2. Materials and Methods

2.1. Materials and Reagents

AgNO3 (99.8%), hydrofluoric acid, PA, and alcohol were purchased from Sinopharm Chemical Reagent Co., Ltd. (Shanghai, China) Rhodamine 6G was purchased from Shanghai Aladdin Bio-Chem Technology Co., Ltd. (Shanghai, China) Monocrystalline Si was purchased from the Tianjin Institute of Semiconductor Technology (Tianjin, China). All the chemicals were of analytical grade and were used without further purification. Wahaha pure water (deionized water) (TDS ≈ 0) was used for all the preparations.

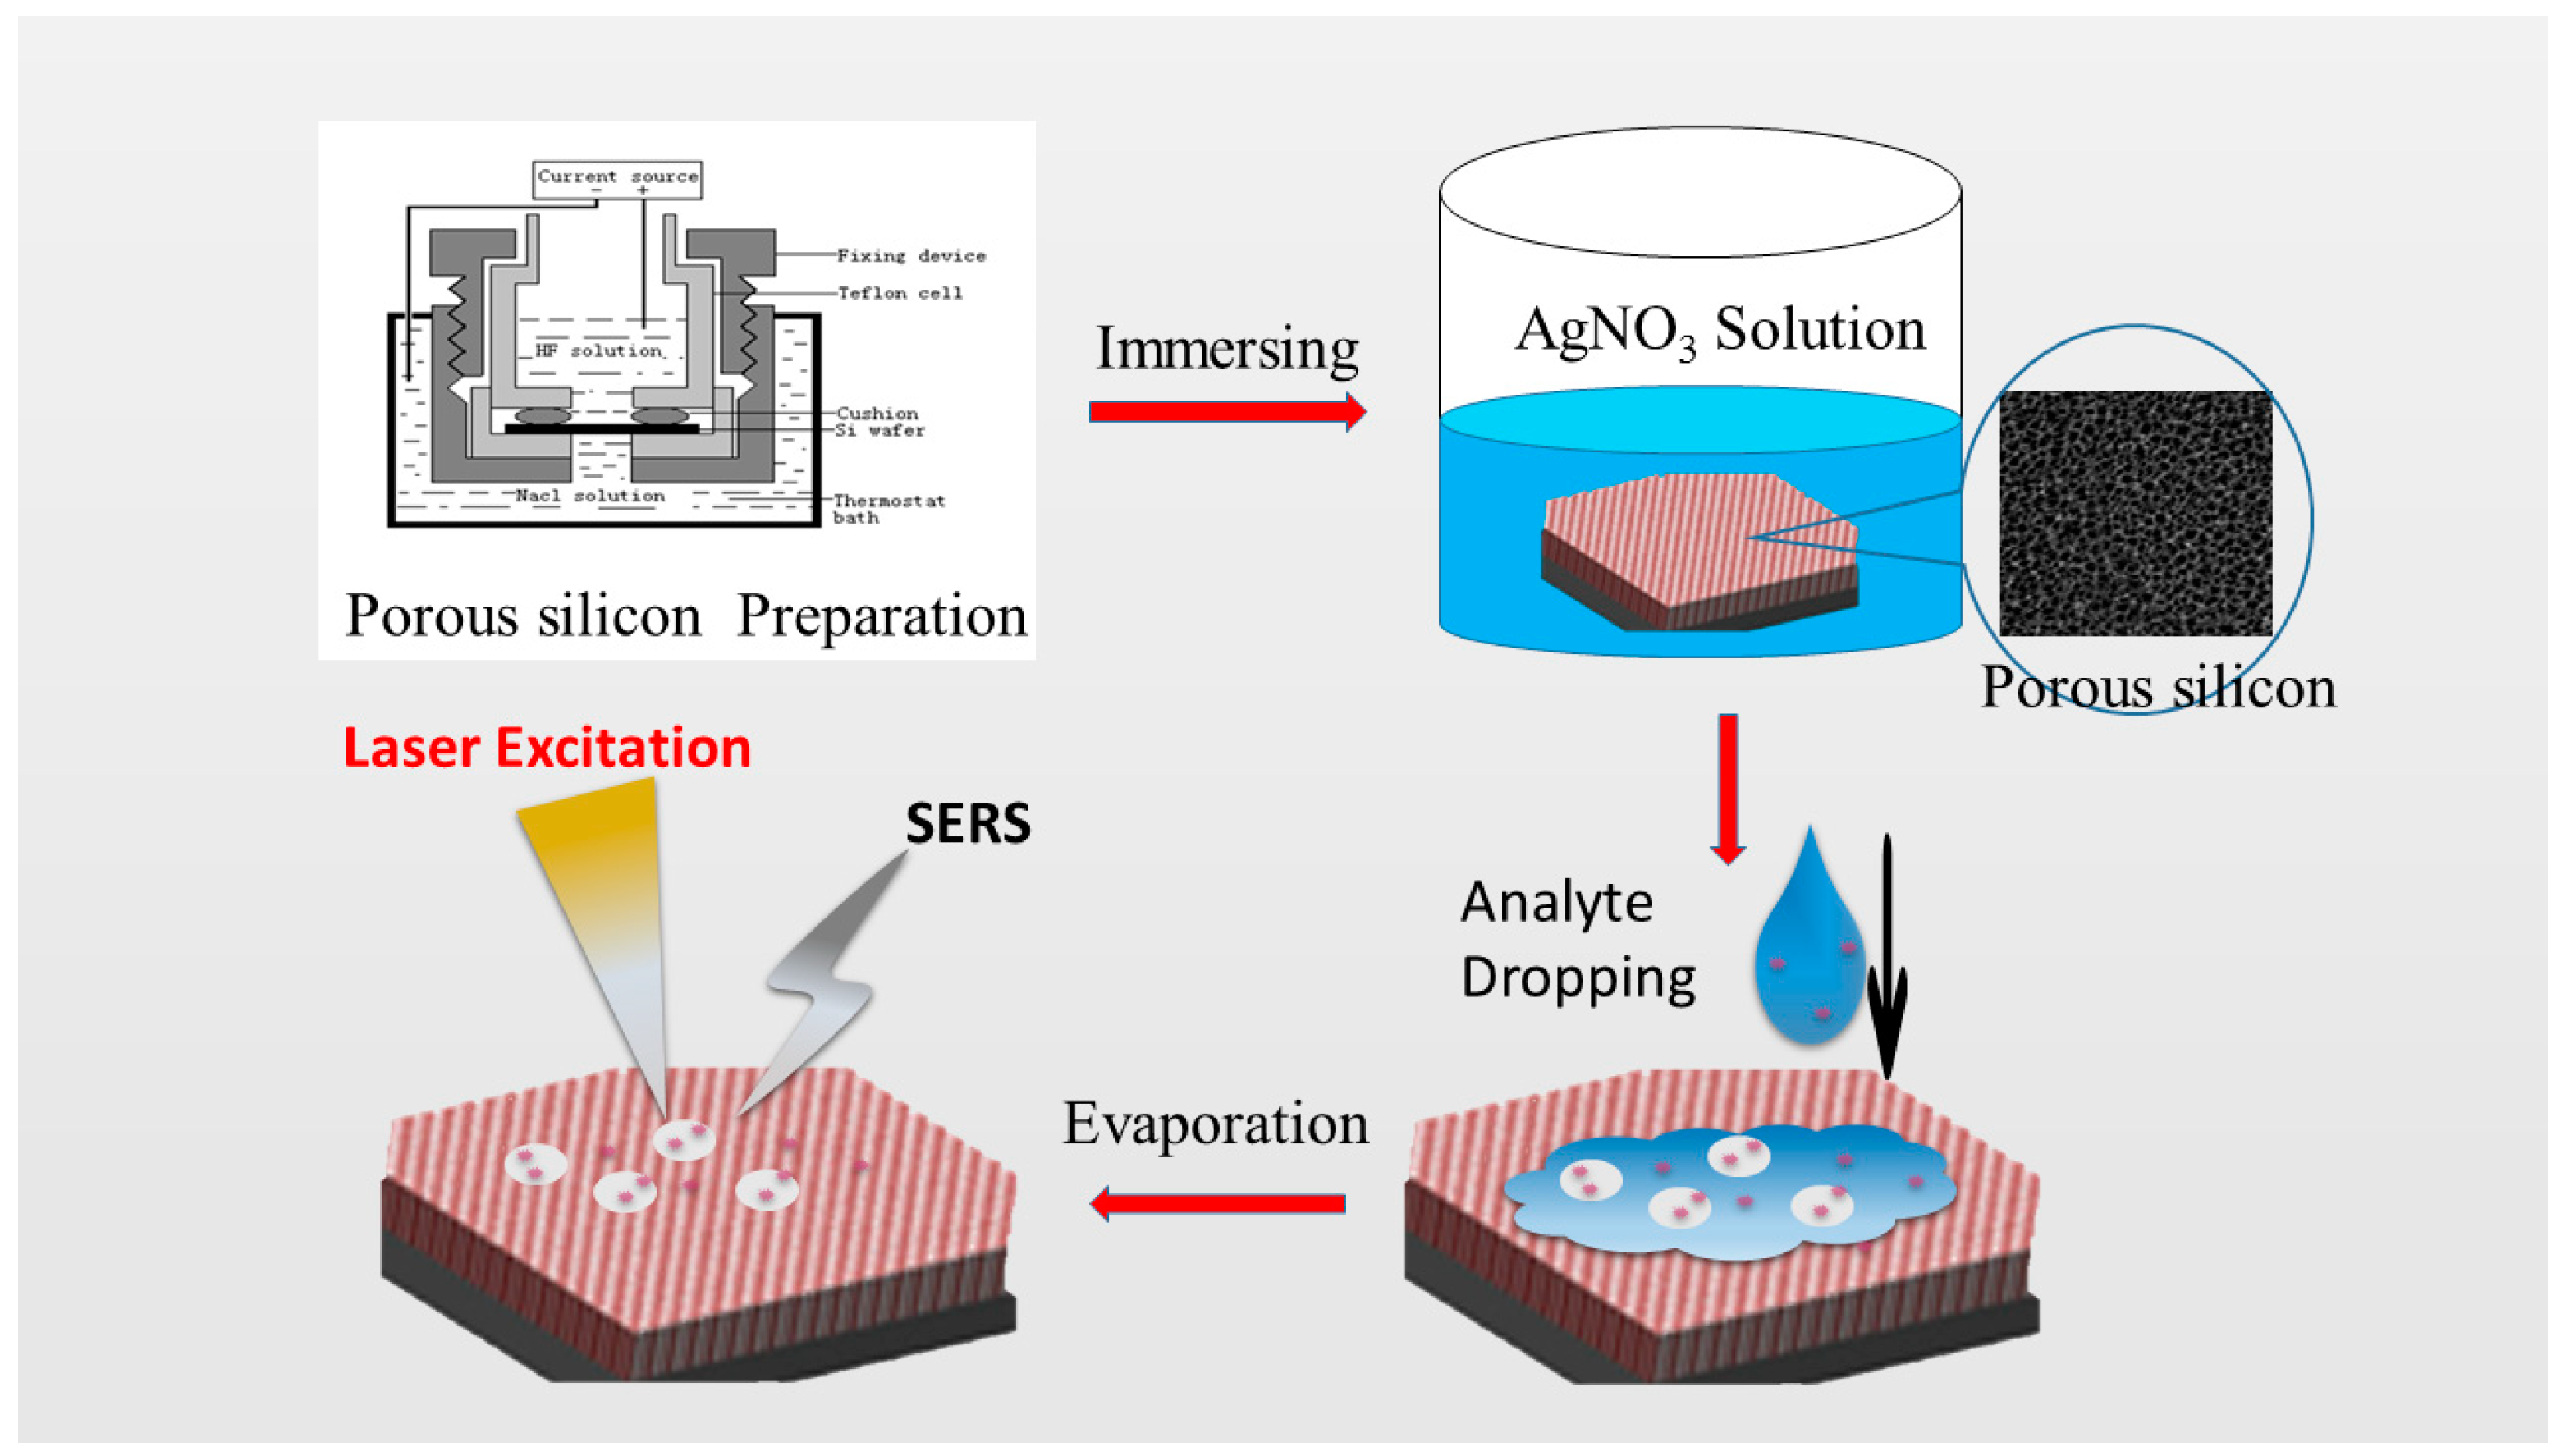
2.2. Preparation of Porous Silicon Photonic Crystals

The highly-doped crystalline silicon (c-Si) p-type wafers with a resistivity of 0.02 to 0.06 Ω·cm were first cleaned ultrasonically several times in ternate baths of alcohol and acetone, before being dried in a nitrogen environment. Porous Si was prepared using an anodic electrochemical etching method, as reported in our previous papers [31]. In brief, the process was conducted in a homemade double cell etch tank, as illustrated in Scheme 1. The electrolyte was a mixture of aqueous HF (48% by weight) and alcohol (99.7% by volume) in a concentration ratio of 1:1. Current densities of 230 mA/cm2 for 1 s and 130 mA/cm2 for 1.5 s were applied alternately for the fabrication of multilayer porous silicon. The total etching time was 12 cycles. After etching, the samples were repeatedly washed with pure alcohol and distilled water immediately. Then, the porous Si samples were placed in an alcohol solution for subsequent use.

2.3. In Situ Synthesis of Silver Nanoparticles on Porous Silicon Photonic Crystals

Ag deposition on the PS PC samples was performed by using an immersion plating solution. Due to the abundant Si–H bonds on the porous silicon surface, Ag+ ions can be easily reduced to AgNPs. Thus, the AgNPs obtained without any chemical contamination present a great advantage due to the simplicity of operation and the fact that no toxic chemical reagents are introduced. Therefore, the immersion plating method is a simple, popular way to produce AgNPs on a substrate. Since the thickness of AgNPs can be adjusted by setting the immersion plating time, the longer the immersing time, the greater the yield of AgNPs is. AgNP arrays were prepared by using immersion plating solutions, according to the procedure reported by Zeiri et al. [32]. In brief, the 1 mM AgNO3 precursor solution was prepared in an alcohol solvent. The PS PC samples were completely immersed in the AgNO3 solution and then dried in air. In this study, five types of samples were obtained at five different immersion plating times: 30, 45, 60, 75, and 90 s. The AgNP-decorated PS PCs were washed with Wahaha pure water before SERS applications.

2.4. Characterization

Morphological and structural investigations of PS PCs were respectively performed using a field-emission scanning electron microscope (FESEM, Hitachi S-4800, Hitachi, Tokyo, Japan) and a Bruker D8 Advance Diffraction diffractometer (Bruker AXS, Karlsruhe, Germany) in the 2θ range from 10° to 80°, with Cu Kα radiation (λ = 0.15405 nm) at 40 kV and 40 mA. The reflectance spectra of the PS PC samples were obtained at room temperature by using a Hitachi U-4100 spectrometer (Hitachi, Tokyo, Japan).

2.5. Raman Measurement

SERS spectra were obtained using a HORIBA micro-Raman spectrometer (HORIBA Jobin Yvon, Kyoto, Japan) equipped with 50-mW Nd:YAG laser of 532-nm light and He–Ne laser of 633-nm light as excitation radiation. Low laser power of 1 mW was used to avoid sample heating effects, and the laser spot focused on the sample surface was about 2 μm in diameter. The SERS spectra of R6G were accomplished with an excitation wavelength of 633 nm, while the SERS spectra of PA were accomplished with an excitation wavelength of 532 nm. The data acquisition time was 3 s for each accumulation. A drop of (10 µL) of the R6G or PA alcoholic solution (analyte) was pipetted out onto the PS PC substrate and was dispersed to a circular shape area ~0.5 cm2. The same sample preparation method was used for all concentrations of R6G and PA. The reproducibility was evaluated at 5 randomly chosen spots on the PS PC substrate. The Si–Si Raman peak of 521 cm−1 was used to calibrate the spectrometer.

3. Results and Discussion

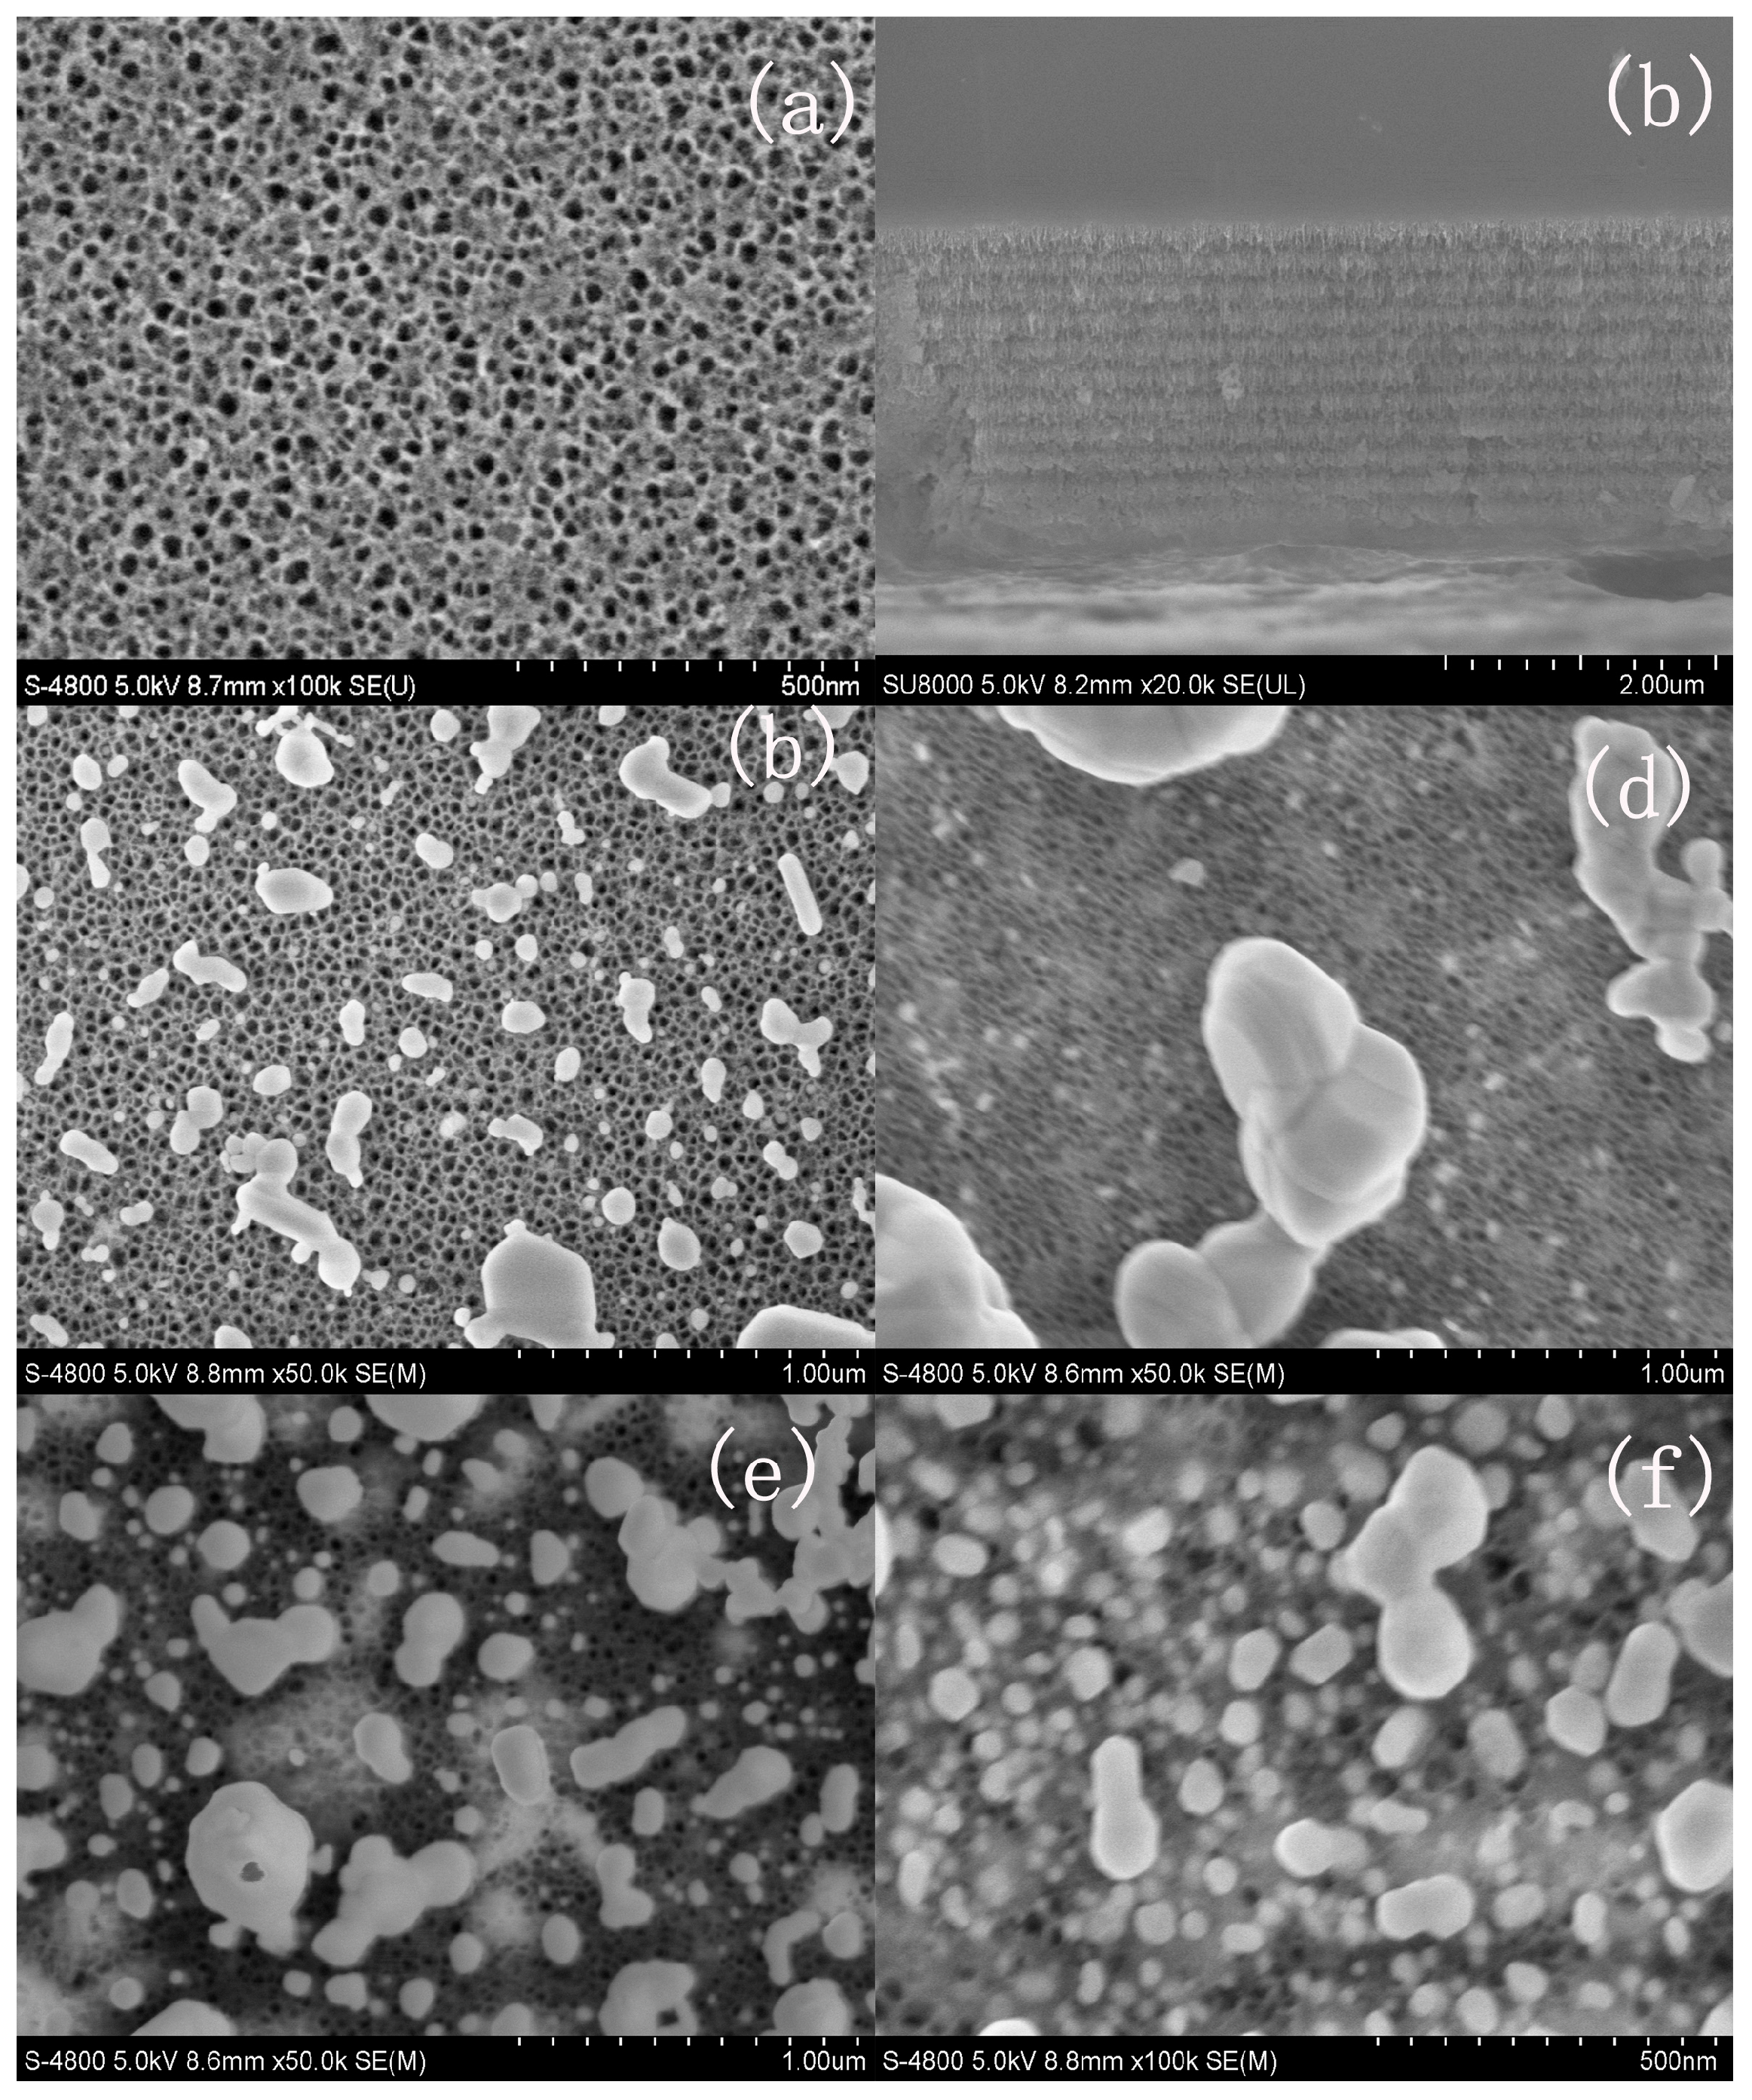
3.1. Structure and Morphological Characteristics

Figure 1 shows the SEM images of the surface and cross-section of the PS PCs. The surface structures of the freshly prepared PS PCs are shown in Figure 1a. Top-view observation revealed that the PS PCs have a uniform distribution of pores with a diameter of 20 to 50 nm, estimated from the SEM images. The cross-section SEM images, as shown in Figure 1b, showed the hierarchy of 12 cycles and that the thickness of porous Si was ~2 µm. The layers with high and low porosities were formed by anodic electrochemical etching using large and small current densities, respectively. Figure 1c–f shows the AgNP-decorated porous Si obtained with different soaking times (30–75 s). These images revealed that with increasing soaking time, the number of AgNPs increased and the gap between the nanoparticles reduced. After soaking for more than 75 s, many overlapping AgNPs were observed, as shown in Figure 1f.

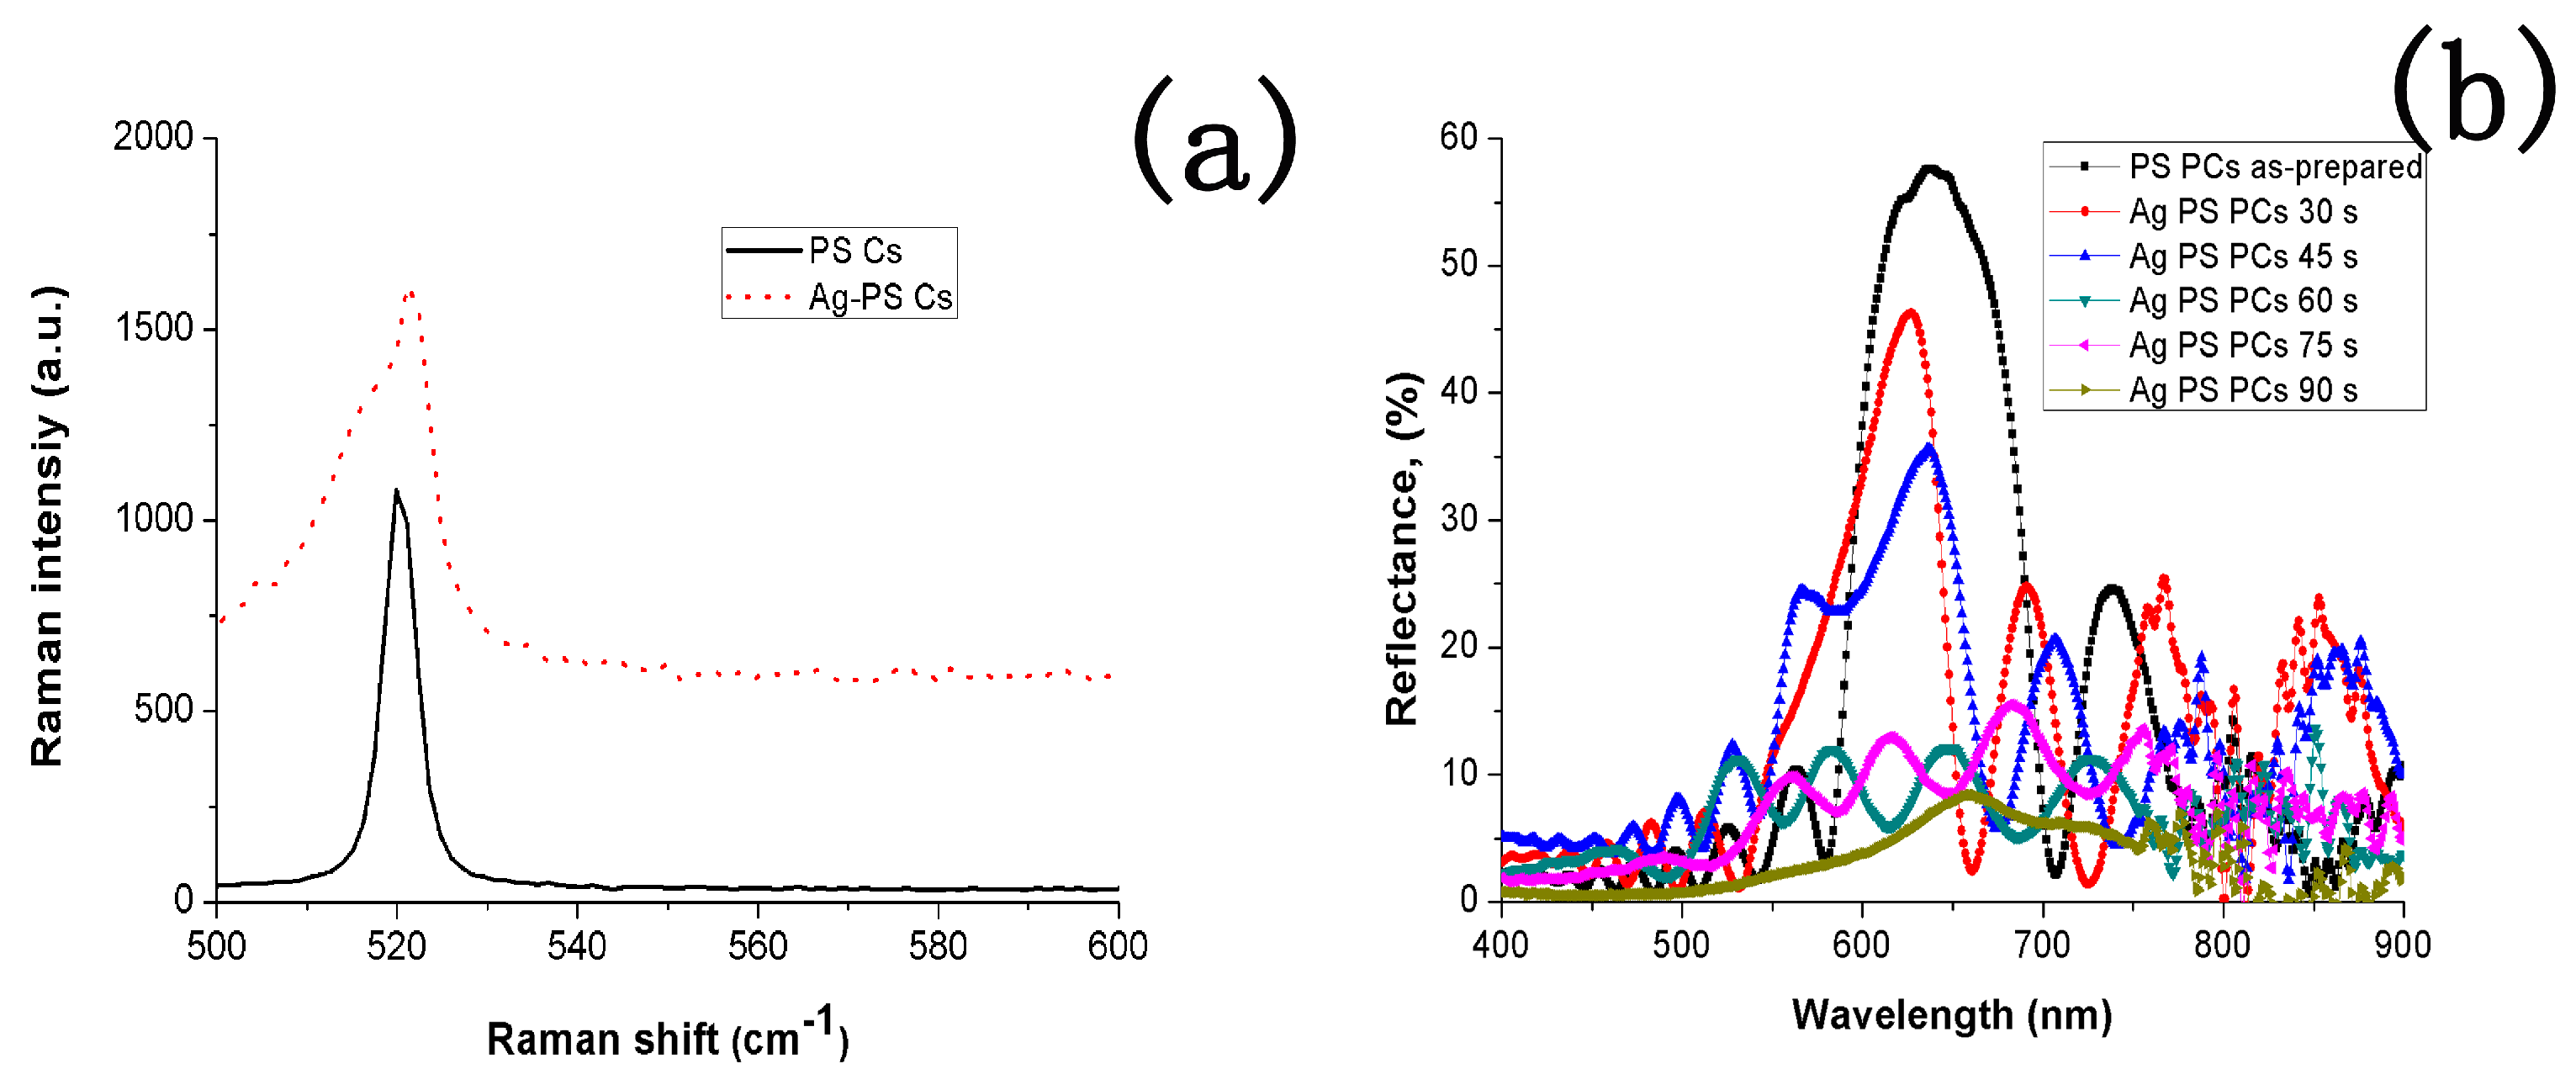
3.2. Reflectance and Raman Spectrum

Samples previously analyzed by FESEM were subjected to specular spectral reflectance measurements to check the optical response of the Ag-PS nanostructures. We have presented in Figure 2b the frequency evolution corresponding to Ag deposition time ranging from 30 to 90 s. With increasing Ag deposition time, the photonic bandgap gradually disappeared. This may be attributed to the increase in AgNP concentration and the surface becoming rougher. This observation also reveals the presence of penetration of the porous silicon. However, the existence of interference fringes was observed up to an Ag deposition time of 75 s. When the deposition time was 90 s, almost no interference effect was observed. These results are in good agreement with the SEM results. Figure 2a shows the Raman spectra of the PS PC samples with and without silver nanoparticles coating. It can be seen that both types of samples showed a Raman peak at 520 cm−1. The symmetrical Raman peak indicated almost no stress change in the as-prepared PS PCs. However, the AgNP-decorated samples show an asymmetry in the low-frequency side, compared to crystalline Si; this downshift of the phonon frequency was related to the width of the pores [20]. Redshift and broadening of absorption peaks were also observed. The shifts in absorption band and asymmetry can be attributed to a quantity-size effect and the surface effect [33], while the peak broadening was attributed to an increase in local temperature [34]. These results indicate that the local temperature is more likely to increase on AgNP-decorated porous Si.

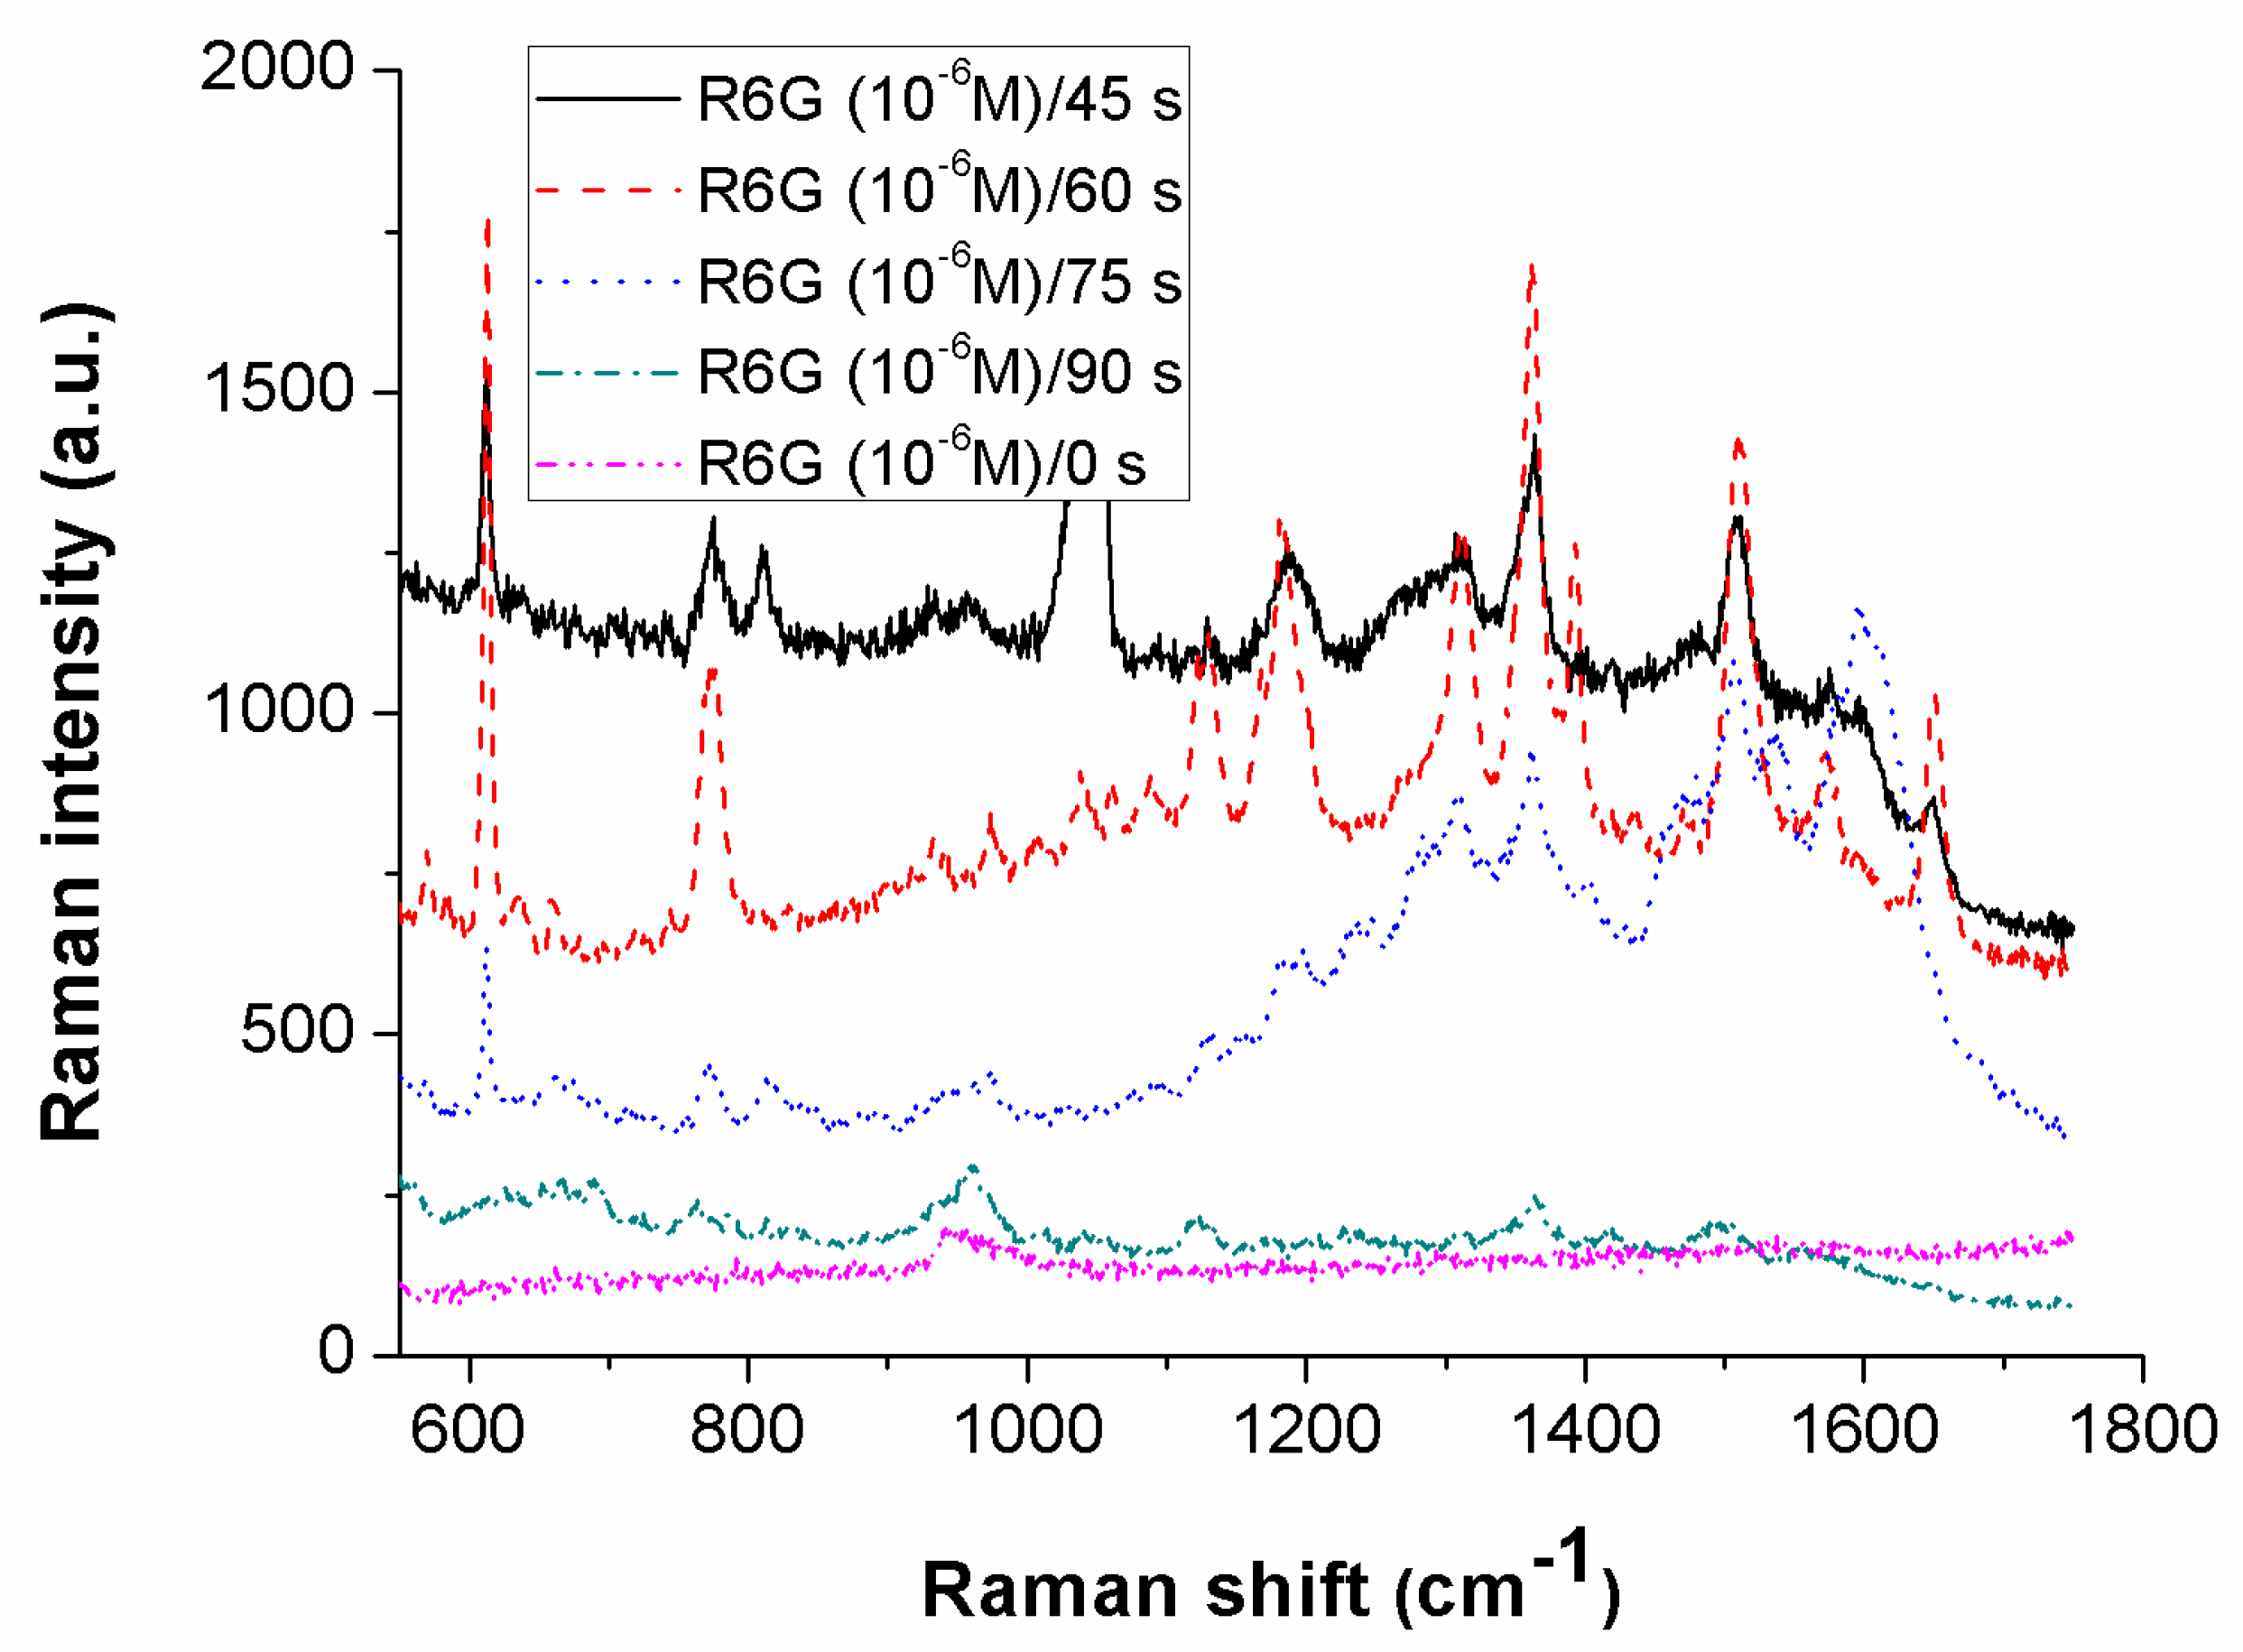
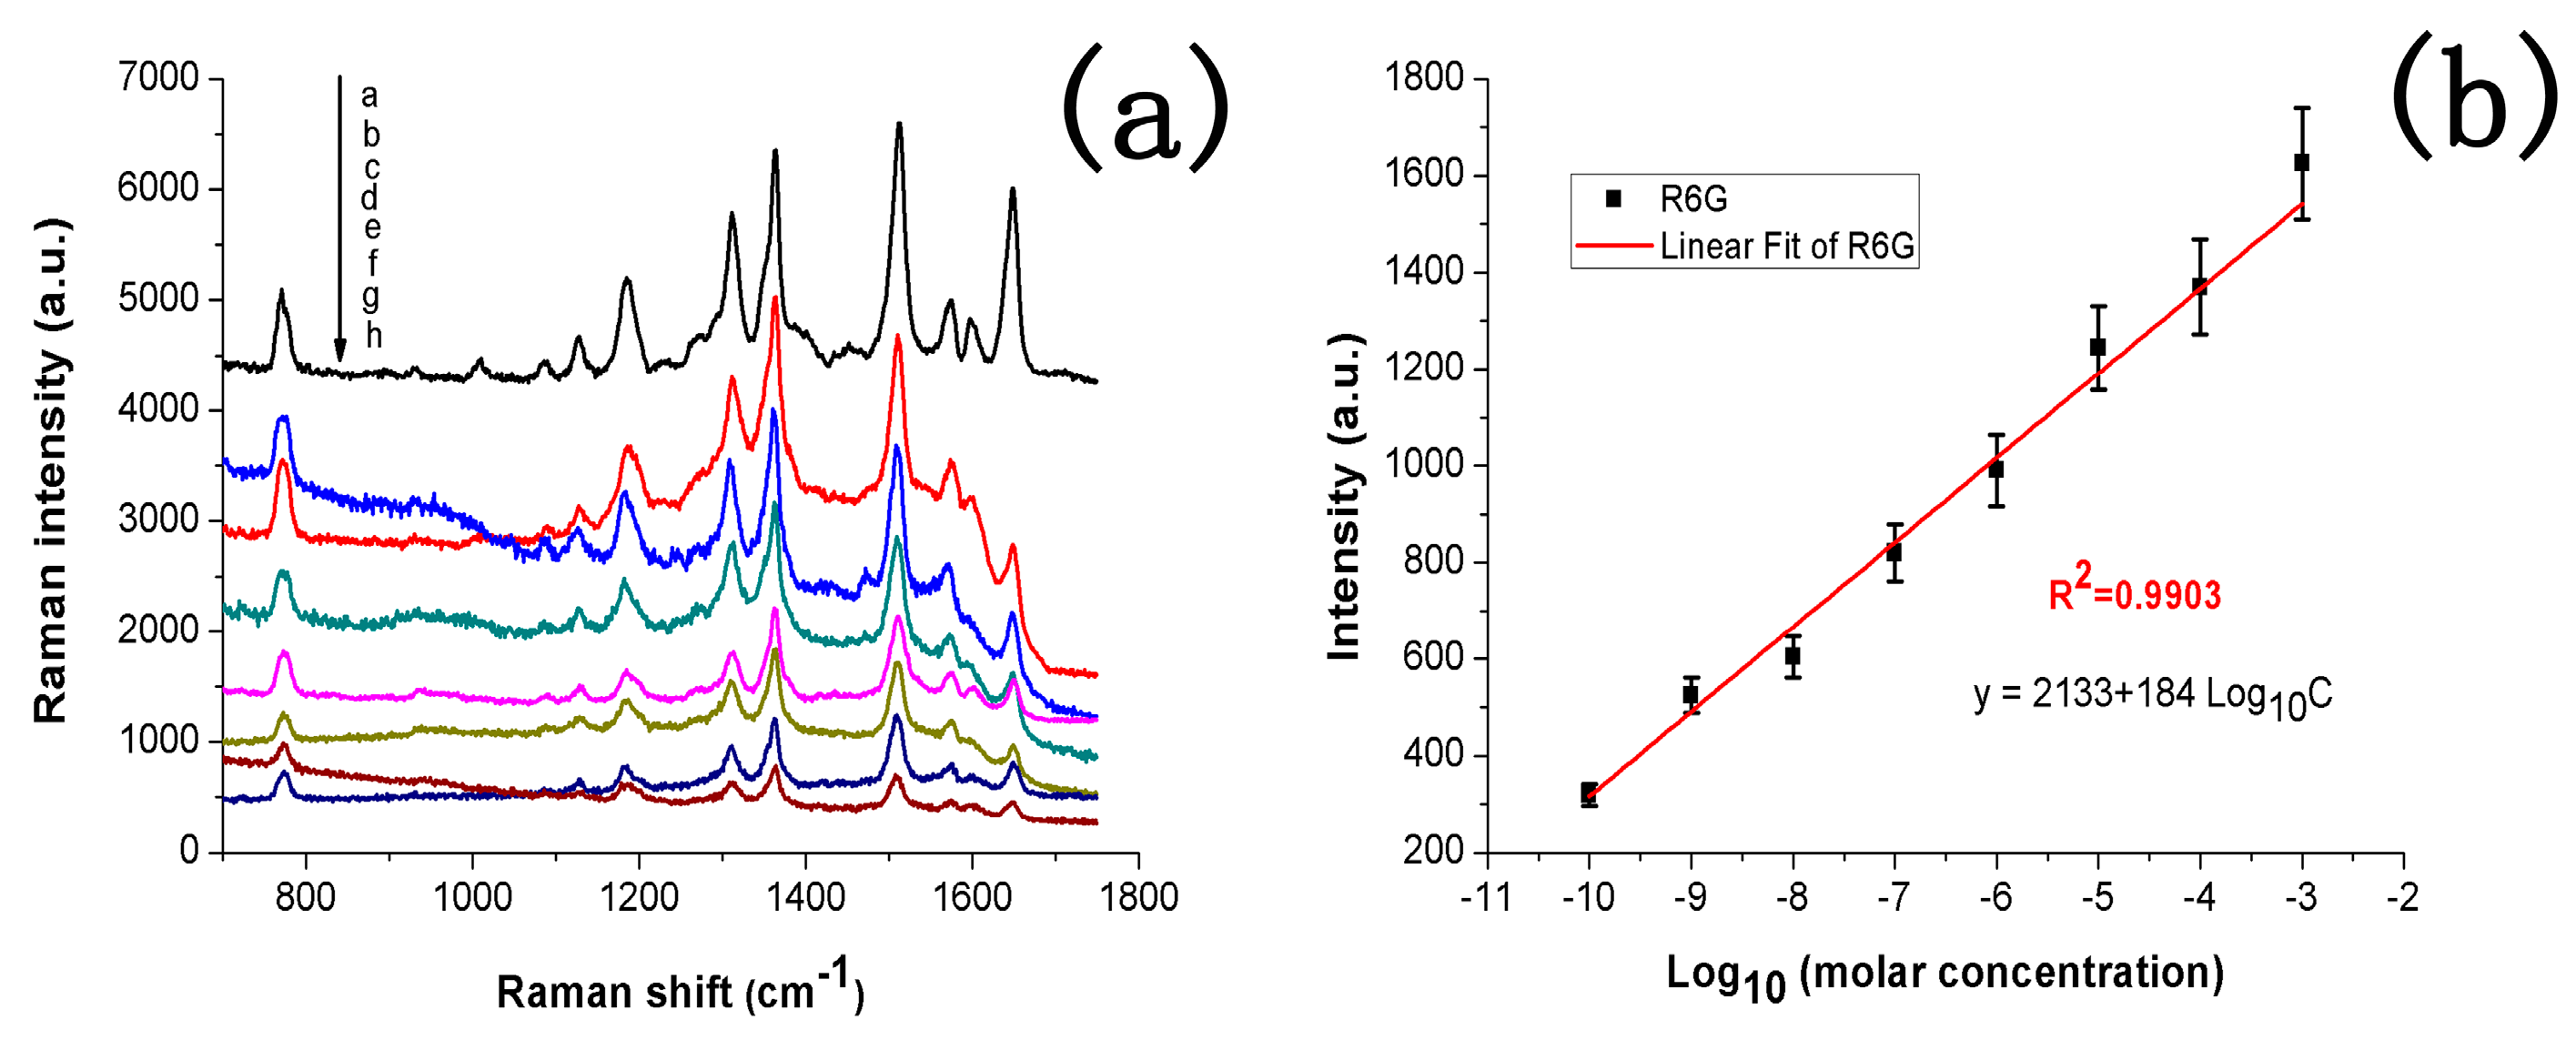
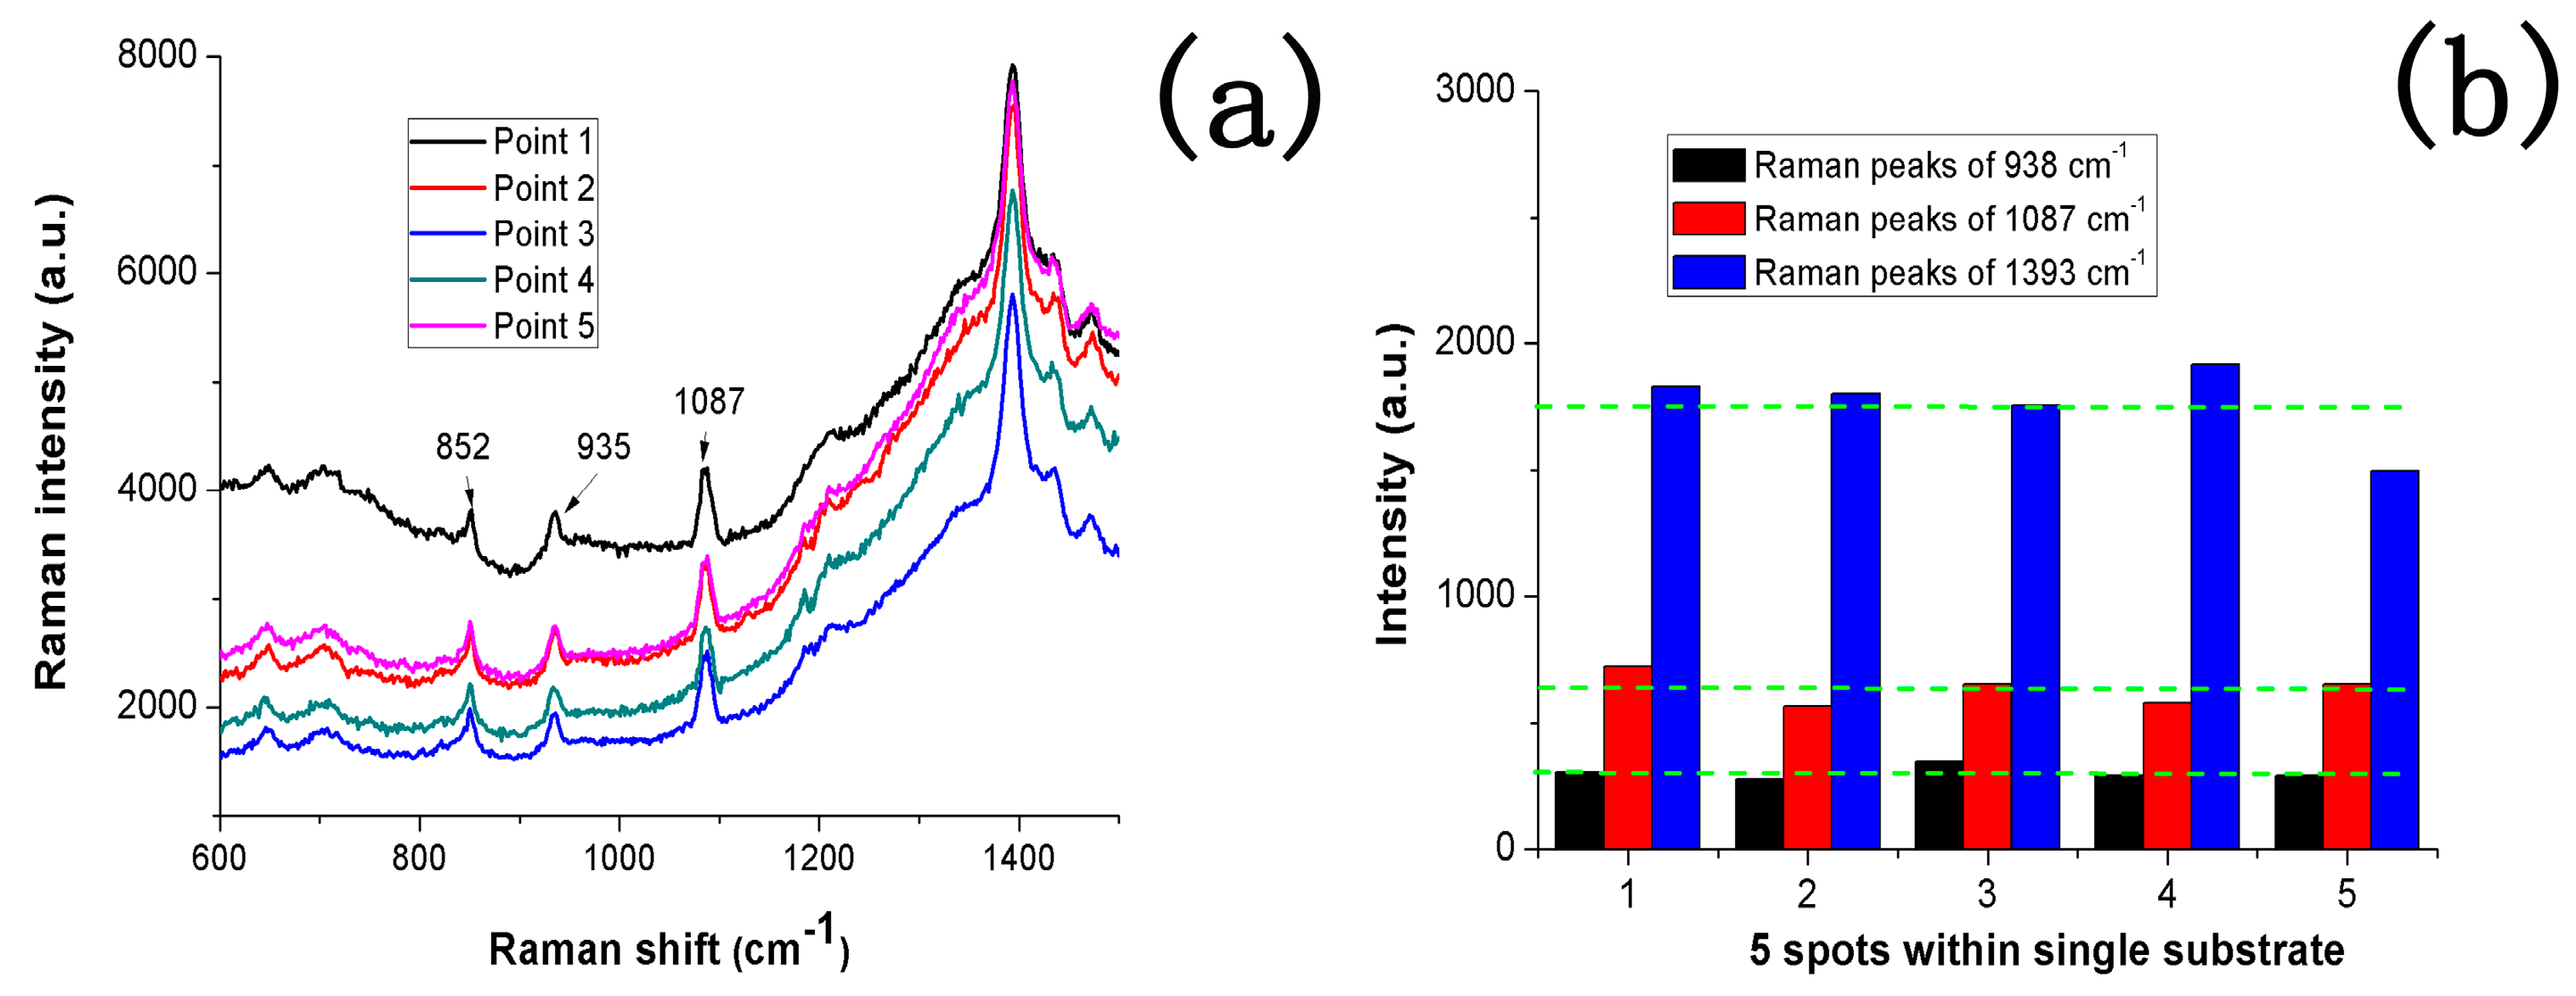
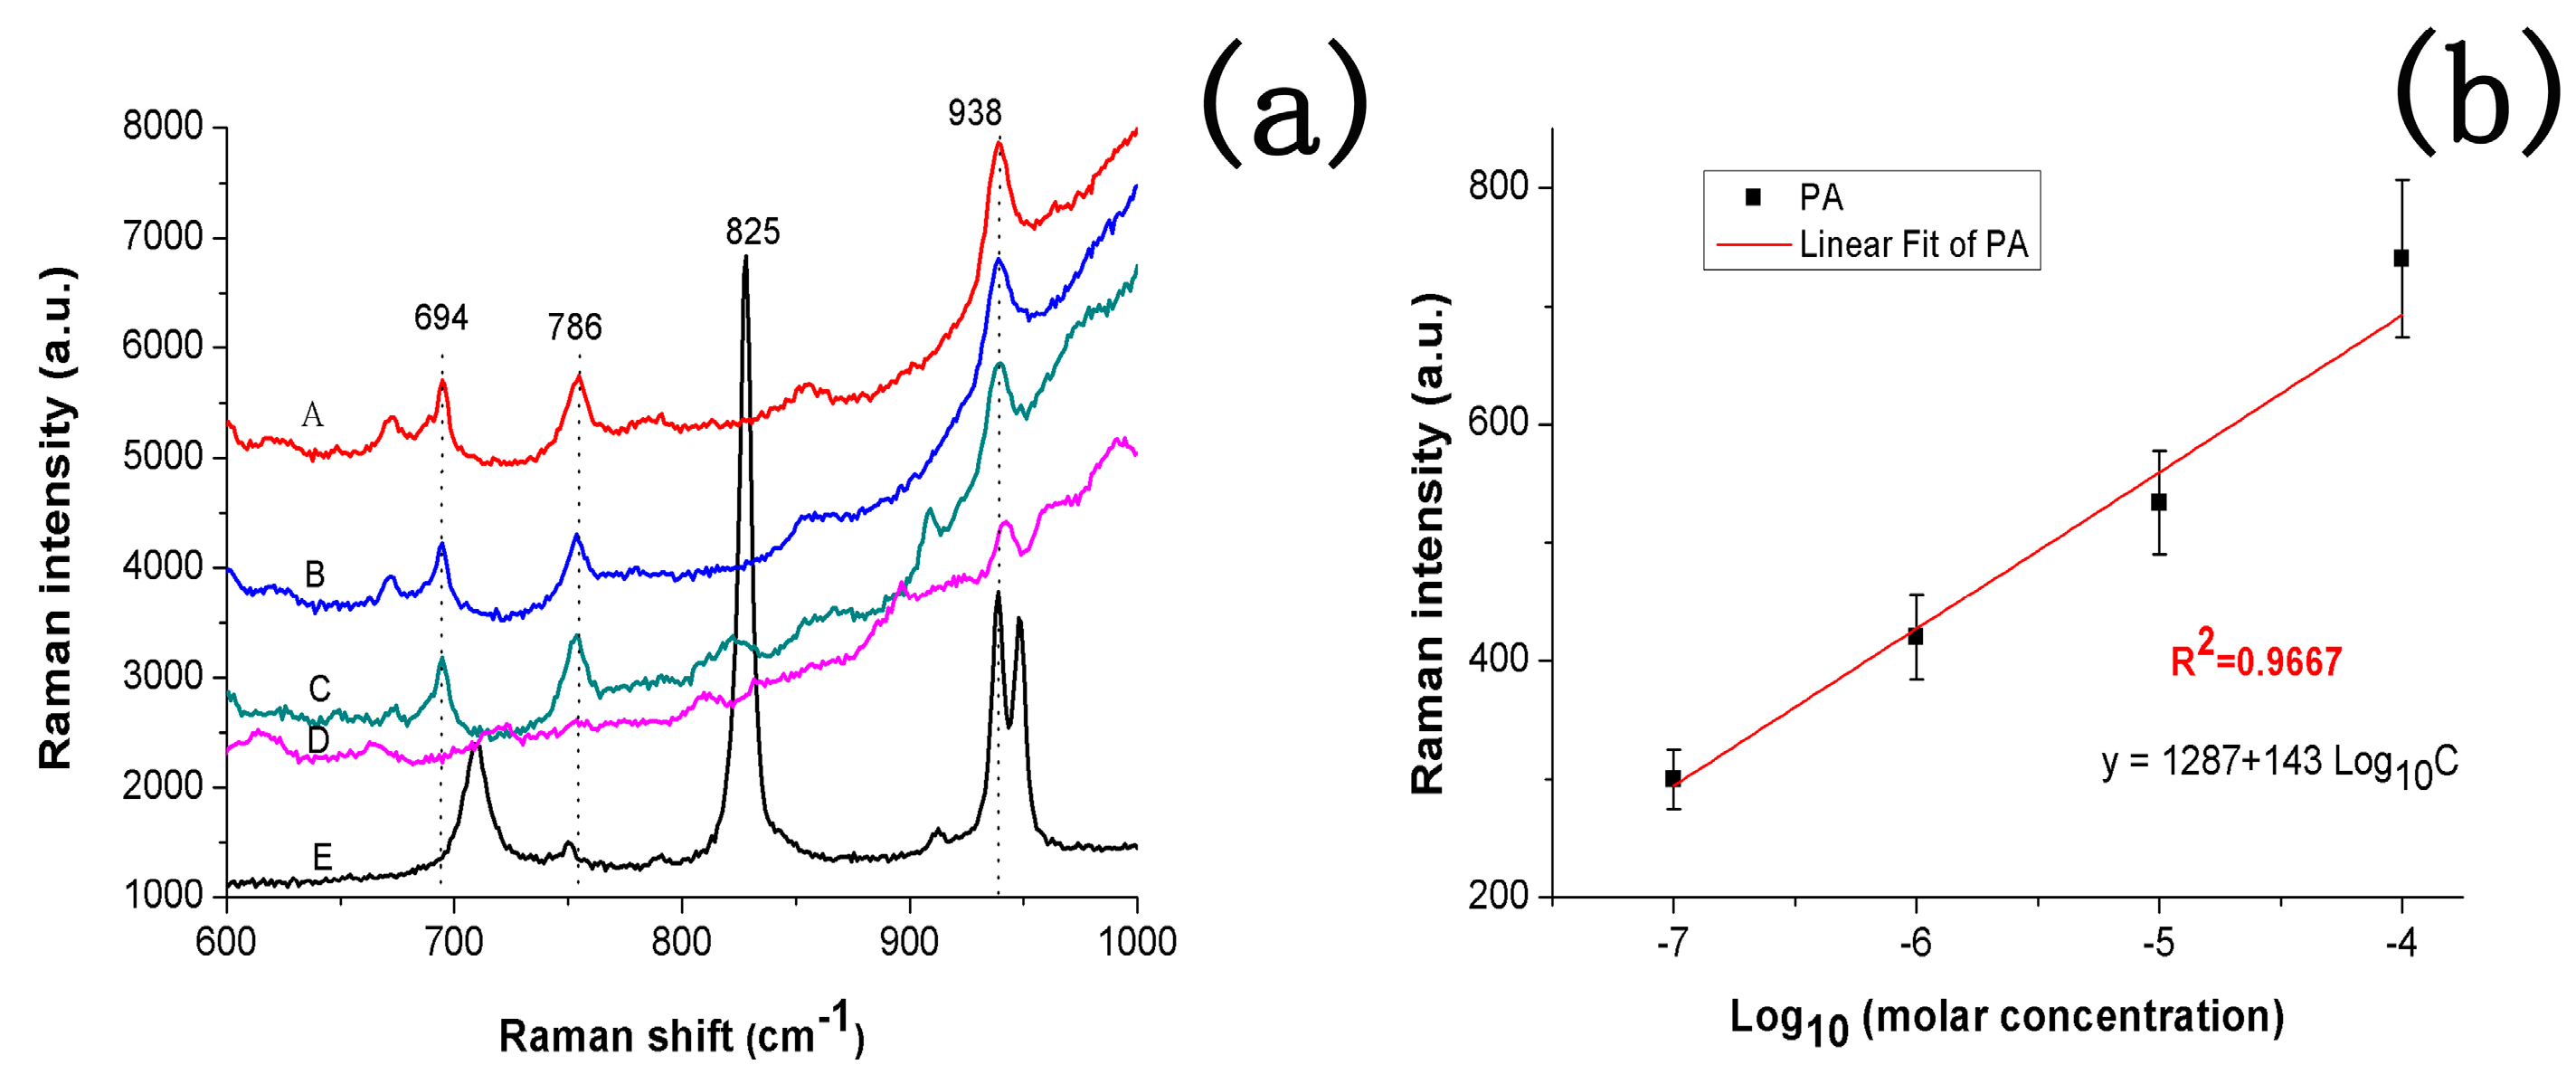
3.3. Raman Scattering

As is well known, SERS is a powerful fingerprint analytical technique to provide real-time onsite detection for biological and chemical sensing owing to its advantageous non-destructive and non-invasive nature [7]. Here, we use R6G and PA as Raman probes to investigate the SERS-active substrate, whose Raman-active modes are summarized in Table 1.
It is known that AgNP size depends on the deposition time. Thus, the optimal immersing time can be obtained experimentally. Figure 3 illustrates the comparative SERS intensities of R6G molecules (10−5 mol/L) obtained on PS PC samples. The typical bands of R6G were observed at 612, 772, 1087, 1127, 1189, 1312, 1363, 1509, and 1651 cm−1 in the first four cases, which were well indexed to the C–C in-plane bending in xanthene rings, C–H out-of-plane bending, C–H in-plane flexural stretching vibration, C–H out-of-plane vibration in xanthene rings, hybrid-mode associated with the NHC2H5 group and xanthene rings, and C–C ring stretching to xanthene rings, respectively [19,37]. When the deposition time/immersing time exceeded 90 s, it was difficult to observe the Raman peaks of R6G because the layer of AgNPs was too thick, which hindered the electromagnetic interaction between Si and AgNPs [38]. The SEM image, shown in Figure 1f, confirms this result. The results show that the sample prepared with an immersing time of 60 s has the largest Raman enhancement effect.
Figure 4 shows the SERS signals of R6G (concentration 10−3–10−10 mol/L) adsorbed on the AgNP-decorated PS PC samples, upon excitation at 633 nm. Although the Raman intensity largely decreased upon reducing the R6G solution concentration, the main characteristics of R6G molecules can be identified even when the solution concentration was as low as 10−10 mol/L. A 10-μL reference sample with 10−5 mol/L R6G deposited on a glass slide was measured. The constructive Raman band at 1512 cm−1 was selected to estimate the SERS enhancement factor (EF) based on the following Equation 1 [39]:
EF = (ISERS/NNR)/(INR/NSERS
where ISERS is the SERS intensity of R6G on PS PCs and INR is the normal Raman intensity of R6G at the same band. NNR and NSERS represent the corresponding numbers of molecules in the focused incident beam on the substrate, which can be estimated using a reported method [40]. In our experiments, the focus area of the laser beam is ~4 μm2. A 10-μL drop of R6G (10−5 mol/L) contains 6 × 10⁶ molecules. Thereby, the EF was calculated to be 4.3 × 10⁶. The EF for AgNPs decorated on monolayer porous silicon (PS) is 1.2 × 10⁶. SERS results demonstrated that nanoparticles with a molecular-dimension gap between the particles led to significant enhancement in Raman scattering of the linked molecules and nanoparticles. A linear dependence was observed between the logarithmic concentrations of R6G and the intensities of the fingerprint peaks (1512 cm−1), see Figure 4b, as per the following equation:
y =2133 +184lgC
where y is the peak intensity of the SERS spectra of R6G and C is the R6G concentration. Therefore, it can be concluded that AgNP-decorated PS PCs can be applied as sensitive SERS substrates for the quantitative detection of trace R6G. It can also be seen that the results show excellent linearity (R2 = 0.9903) over a wide concentration range.
The AgNP-decorated PS PC nanostructures were used as SERS substrates to explore their application in quantitative analysis of trace PA. As is well known, PA is a common explosive that is widely used in the manufacture of acid dyes, photographic drugs, explosives, and pesticides, etc. Thus, PA seriously pollutes the environment through water and soil [41]. Here, PA was used as the target analyte to effectively verify the performance of the PS PC substrate. A 10-μL solution of a particular concentration was drop-casted on the PS PC substrate. With regard to the significant issue of reproducibility, we first observed the uniformity of the substrate. Figure 5 shows that the SERS signals were all of comparable intensity, indicating that the PS PC substrates exhibited uniform SERS enhancements over their entire surface. For the intensities of the characteristic peaks at 938, 1087, and 1393 cm−1 of PA in these five spectra, which were obtained at randomly selected spots under identical experimental conditions, the relative standard deviations (RSD) were 8.16, 8.09, and 8.05%, respectively. This is probably due to the uniform coating of AgNPs on PS PC nanopore structures.
Figure 6a shows the SERS spectra for PA detection. The Raman intensity decreased upon reducing the PA concentration from 10−4 to 10−7 mol/L. The characteristic peaks, see Table 1, of PA at 786 cm−1, 938 cm−1 (ring breathing), and 1085 cm−1 (phenolic C–O stretching) were observed at all the concentrations tested. Compared with the Raman characteristic peaks of PA itself, the Raman peaks of the PS PC substrates showed some redshift, attributed to the stress on the contact surface between silicon and silver [42].
Figure 6b shows the plot of SERS intensity as a function of PA concentration (at 938 cm−1) against explosive concentration on a logarithm scale. A relatively good linear response was obtained at PA concentrations ranging from 10−4 to 10−7 mol/L. The linear regression equation was y = 1287 + 143lgC, with a correlation coefficient (R2) of 0.9667, where y is the intensity of the Raman peak at 938 cm−1 and C is the PA concentration. The standard deviation (SD) of the intercept is 85.66, and the SD of the slope is 15.26. The limit of detection of PA (S/N = 3) was 10−8 mol/L. Compared with the reported data summarized in Table 2, the results obtained herein indicated that PS PCs could be used as a potential substrate for SERS-quantitative detection.
This SERS platform showed high sensitivity, low detection limit, and wide linear range, which can be ascribed to the PS PC substrate. In general, SERS enhancement in the Raman signal from AgNP-decorated PS PCs is mainly correlated to the electromagnetic enhancement mechanism [43]. However, in this case, chemical enhancement may have played an important role in SERS enhancement. Porous Si is a new functional material with a sponge-like structure, based on nanocrystalline Si particles. Thus, this nano-dimensional semiconductor structure is very conducive to charge transfer between semiconductor nanoparticles and the target molecules [44]. The Si nanoparticles in the present AgNP-decorated PS PCs nanostructure may lead to enhanced electron charge transfer from the AgNPs to the target molecules, which in turn affect the SERS enhancement. For the PS PC nanostructure, the internal reflections in multilayers can enhance the Raman signals [45]. Compared to monolayer porous Si or glass substrate, PS PC substrates have an extraordinary scattering effect in response to the exciting light, and thus, it has a stronger photoelectric coupling effect. As shown in Figure 6, the AgNP-decorated PS PC substrates have a wider linear dynamic range (LDR) owing to them having a higher surface-to-volume ratio than porous silicon [46]. As is known, SERS intensity depends on hotspots. The high surface-to-volume ratio implied that the substrate has a larger surface area, which greatly increased the hotspot area and led to wide LDR.

4. Conclusions

In summary, we have presented new PS PC SERS substrates with a molecule concentrating effect by integrating AgNPs into the micropores of PS PCs. The AgNP-decorated PS PCs were prepared by an in-situ method by immersion in an AgNO3 solution. The experimental results showed that this substrate has a sufficiently high detection sensitivity for the easy detection of R6G at concentrations as low as 10−10 mol/L by a simple dipping method, and its enhancement factor reaches 1.2 × 10⁶ at the concentration of 10−6 mol/L. The detection of a biomolecule, e.g., PA, was also explored. A good linear response was obtained for PA concentrations ranging from 10−4 to 10−7 mol/L and the detection limit was as low as 10−8 mol/L. More importantly, the RSD values of the Raman signals were ~8%. Thus, the as-prepared nanostructures can be used to detect trace compounds with minimal analyte consumption using PS PC substrates.

Author Contributions

F.Z., Z.W., and J.G. searched for the sample processing regimens, SEM, spectroscopic, and SERS measurements. J.G. coordinated the project as a whole. F.Z. provided a preliminary version of the manuscript. D.J. analyzed all data, wrote the final version of the manuscript, and arranged all figures. All authors read and approved the final manuscript.

Funding

The research was financially supported by the National Natural Science Foundation of China (61864011, 21771157, U1703251).

Acknowledgments

The authors thank Master Yue Xiaxia and Dr. Tang Jun for providing numerous valuable discussions and guidance for Raman testing.

Conflicts of Interest

The authors declare no conflict of interest.

References

  1. Chen, N.; Ding, P.; Shi, Y.; Jin, T.; Su, Y.; Wang, H.; He, Y. Portable and Reliable Surface-Enhanced Raman Scattering Silicon Chip for Signal-on Detection of Trace Trinitrotoluene Explosive in Real Systems. Anal. Chem. 2017, 89, 5072–5078. [Google Scholar] [CrossRef] [PubMed]
  2. Li, Y.; Lu, R.; Shen, J.; Han, W.; Sun, X.; Li, J.; Wang, L. Electrospun Flexible Poly(Bisphenol a Carbonate) Nanofibers Decorated with Ag Nanoparticles as Effective 3D SERS Substrates for Trace TNT Detection. Analyst 2017, 142, 4756–4764. [Google Scholar] [CrossRef] [PubMed]
  3. Wang, C.; Liu, B.; Dou, X. Silver Nanotriangles-Loaded Filter Paper for Ultrasensitive SERS Detection Application Benefited by Interspacing of Sharp Edges. Sens. Actuators B Chem. 2016, 231, 357–364. [Google Scholar] [CrossRef]
  4. Cui, Y.; Jin, Y.; Chen, X.; Wu, J. Two-Dimensional Electrochemiluminescence on Porous Silicon Platform for Explosive Detection and Discrimination. ACS Sens. 2018, 3, 1439–1444. [Google Scholar] [CrossRef] [PubMed]
  5. Gou, Z.; Zuo, Y.; Tian, M.; Lin, W. Siloxane-Based Nanoporous Polymers with Narrow Pore-Size Distribution for Cell Imaging and Explosive Detection. ACS Appl. Mater. Interfaces 2018, 10, 28979–28991. [Google Scholar] [CrossRef] [PubMed]
  6. Mosier-Boss, P.A. Review of SERS Substrates for Chemical Sensing. Nanomaterials 2017, 7, 146. [Google Scholar] [CrossRef] [PubMed]
  7. Liu, Y.; Zhou, H.; Hu, Z.; Yu, G.; Yang, D.; Zhao, J. Label and Label-Free Based Surface-Enhanced Raman Scattering for Pathogen Bacteria Detection: A Review. Biosens. Bioelectron. 2017, 94, 131–140. [Google Scholar] [CrossRef] [PubMed]
  8. Hakonen, A.; Andersson, P.O.; Schmidt, M.S.; Rindzevicius, T.; Kall, M. Explosive and Chemical Threat Detection by Surface-Enhanced Raman Scattering: A Review. Anal. Chim. Acta 2015, 893, 1–13. [Google Scholar] [CrossRef] [PubMed]
  9. Kneipp, J.; Kneipp, H.; Kneipp, K. SERS—A Single-Molecule and Nanoscale Tool for Bioanalytics. Chem. Soc. Rev. 2008, 37, 1052–1560. [Google Scholar] [CrossRef] [PubMed]
  10. Sharma, B.; Frontiera, R.R.; Henry, A.I.; Ringe, E.; Van Duyne, R.P. SERS: Materials, Applications, and the Future. Mater. Today 2012, 15, 16–25. [Google Scholar] [CrossRef]
  11. Chou, A.; Jaatinen, E.; Buividas, R.; Seniutinas, G.; Juodkazis, S.; Izake, E.L.; Fredericks, P.M. SERS Substrate for Detection of Explosives. Nanoscale 2012, 4, 7419–7424. [Google Scholar] [CrossRef] [PubMed] [Green Version]
  12. Gu, H.X.; Xue, L.; Zhang, Y.H.; Zhang, Y.F.; Cao, L.Y. Functionalized Gold Nanoparticles Coated Polymer Spheres as SERS Substrate for the Detection of TNT Explosives. Adv. Mater. Res. 2014, 924, 366–370. [Google Scholar] [CrossRef]
  13. Byram, C.; Moram, S.S.B.; Shaik, A.K.; Soma, V.R. Versatile Gold Based SERS Substrates Fabricated by Ultrafast Laser Ablation for Sensing Picric Acid and Ammonium Nitrate. Chem. Phys. Lett. 2017, 685, 103–107. [Google Scholar] [CrossRef]
  14. Hakonen, A.; Wang, F.; Andersson, P.O.; Wingfors, H.; Rindzevicius, T.; Schmidt, M.S.; Soma, V.R.; Xu, S.; Li, Y.; Boisen, A.; et al. Hand-Held Femtogram Detection of Hazardous Picric Acid with Hydrophobic Ag Nanopillar SERS Substrates and Mechanism of Elasto-Capillarity. ACS Sens. 2017, 2, 198–202. [Google Scholar] [CrossRef] [PubMed]
  15. Myndrul, V.; Viter, R.; Savchuk, M.; Shpyrka, N.; Erts, D.; Jevdokimovs, D.; Silamikelis, V.; Smyntyna, V.; Ramanavicius, A.; Iatsunskyi, I. Porous Silicon Based Photoluminescence Immunosensor for Rapid and Highly-Sensitive Detection of Ochratoxin A. Biosens. Bioelectron. 2018, 102, 661–667. [Google Scholar] [CrossRef] [PubMed]
  16. Ensafi, A.A.; Rezaloo, F.; Rezaei, B. Department. Electrochemical Sensor Based on Porous Silicon/Silver Nanocomposite for the Determination of Hydrogen Peroxide. Sens. Actuators B Chem. 2016, 231, 239–244. [Google Scholar] [CrossRef]
  17. Li, Y.; Jia, Z.; Lv, G.; Wen, H.; Li, P.; Zhang, H.; Wang, J. Detection of Echinococcus Granulosus Antigen by a Quantum Dot/Porous Silicon Optical Biosensor. Biomed. Opt. Express 2017, 8, 3458–3469. [Google Scholar] [CrossRef] [PubMed]
  18. Wang, J.; Jia, Z.; Lv, C. Enhanced Raman Scattering in Porous Silicon Grating. Opt. Express 2018, 26, 6507–6518. [Google Scholar] [CrossRef] [PubMed]
  19. Dridi, H.; Haji, L.; Moadhen, A. Rough Sers Substrate Based on Gold Coated Porous Silicon Layer Prepared on the Silicon Backside Surface. Superlattices Microstruct. 2017, 104, 266–270. [Google Scholar] [CrossRef]
  20. Kalimuthu, V.; Rath, S. One-Step Synthesis of Au-Coated Porous Silicon as a Surface Enhanced Raman Scattering Substrate for Biomolecule Detection. Mater. Lett. 2017, 204, 115–119. [Google Scholar] [CrossRef]
  21. Qiu, C.; Zhou, H.; Yang, H.; Chen, M.; Guo, Y.; Sun, L. Investigation of N-Layer Graphenes as Substrates for Raman Enhancement of Crystal Violet. J. Phys. Chem. C 2011, 115, 10019–10025. [Google Scholar] [CrossRef]
  22. Zhang, T.; Sun, Y.; Hang, L.; Li, H.; Liu, G.; Zhang, X.; Lyu, X.; Cai, W.; Li, Y. Periodic Porous Alloyed Au-Ag Nanosphere Arrays and Their Highly Sensitive Sers Performance with Good Reproducibility and High Density of Hotspots. ACS Appl. Mater. Interfaces 2018, 10, 9792–9801. [Google Scholar] [CrossRef] [PubMed]
  23. Kong, X.; Xi, Y.; LeDuff, P.; Li, E.; Liu, Y.; Cheng, L.J.; Rorrer, G.L.; Tan, H.; Wang, A.X. Optofluidic Sensing from Inkjet-Printed Droplets: The Enormous Enhancement by Evaporation-Induced Spontaneous Flow on Photonic Crystal Biosilica. Nanoscale 2016, 8, 17285–17294. [Google Scholar] [CrossRef] [PubMed]
  24. Lin, S.; Zhu, W.; Jin, Y.; Crozier, K.B. Surface-Enhanced Raman Scattering with Ag Nanoparticles Optically Trapped by a Photonic Crystal Cavity. Nano Lett. 2013, 13, 559–563. [Google Scholar] [CrossRef] [PubMed]
  25. Tian, Z.Q.; Ren, B.; Wu, D.Y. Surface-Enhanced Raman Scattering: From Noble to Transition Metals and from Rough Surfaces to Ordered Nanostructures. J. Phys. Chem. B 2002, 106, 9463–9483. [Google Scholar] [CrossRef]
  26. Najar, A.; Charrier, J.; Pirasteh, P.; Sougrat, R. Ultra-Low Reflection Porous Silicon Nanowires for Solar Cell Applications. Opt. Express 2012, 20, 16861–16870. [Google Scholar] [CrossRef]
  27. Stewart, M.P.; Buriak, J.M. Chemical and Biological Applications of Porous Silicon Technology. Adv. Mater. 2000, 12, 859–869. [Google Scholar] [CrossRef]
  28. Sampath, S.; Maydannik, P.; Ivanova, T.; Shestakova, M.; Homola, T.; Bryukvin, A.; Sillanpaa, M.; Nagumothu, R.; Alagan, V. Efficient Solar Photocatalytic Activity of TiO2 Coated Nano-Porous Silicon by Atomic Layer Deposition. Superlattices Microstruct. 2016, 97, 155–166. [Google Scholar] [CrossRef]
  29. Severiano, F.; Gayou, V.L.; Garcia, G.; Macuil, R.D.; Gutierrez, H.M.; Nieto, G.; Diaz, T. In Situ Inclusion of Au Nanoparticles in Porous Silicon Structure. Appl. Phys. A 2017, 123, 83. [Google Scholar] [CrossRef]
  30. Zhang, X.G. Morphology and Formation Mechanisms of Porous Silicon. J. Electrochem. Soc. 2004, 151, C69–C80. [Google Scholar] [CrossRef]
  31. Zhong, F.; Jia, Z. Raman Scattering Study on Pristine and Oxidized N-Type Porous Silicon. Physica B Condens. Matter 2013, 411, 77–80. [Google Scholar] [CrossRef]
  32. Zeiri, L.; Rechav, K.; Porat, Z.E.; Zeiri, Y. Silver Nanoparticles Deposited on Porous Silicon as a Surface-Enhanced Raman Scattering (SERS) Active Substrate. Appl. Spectrosc. 2012, 66, 294–299. [Google Scholar] [CrossRef] [PubMed]
  33. Zhao, X.Y.; Wei, C.M.; Yang, L.; Chou, M.Y. Quantum Confinement and Electronic Properties of Silicon Nanowires. Phys. Rev. Lett. 2004, 92, 236805. [Google Scholar] [CrossRef] [PubMed]
  34. Piscanec, S.; Cantoro, M.; Ferrari, A.C.; Zapien, J.A.; Lifshitz, Y.; Lee, S.T.; Hofmann, S.; Robertson, J. Raman Spectroscopy of Silicon Nanowires. Phys. Rev. B 2003, 68, 241312. [Google Scholar] [CrossRef]
  35. Watanabe, H.; Hayazawa, N.; Inouye, Y.; Kawata, S. DFT Vibrational Calculations of Rhodamine 6G Adsorbed on Silver: Analysis of Tip-Enhanced Raman Spectroscopy. J. Phys. Chem. B 2005, 109, 5012–5020. [Google Scholar] [CrossRef] [PubMed]
  36. Hildebrandt, P.; Stockburger, M. Surface-Enhanced Resonance Raman Spectroscopy of Rhodamine 6G Adsorbed on Colloidal Silver. J. Phys. Chem. 1984, 88, 5935–5944. [Google Scholar] [CrossRef]
  37. Virga, A.; Rivolo, P.; Frascella, F.; Angelini, A.; Descrovi, E.; Geobaldo, F.; Giorgis, F. Silver Nanoparticles on Porous Silicon: Approaching Single Molecule Detection in Resonant Sers Regime. J. Phys. Chem. C 2013, 117, 20139–20145. [Google Scholar] [CrossRef]
  38. Lu, G.; Wang, G.; Li, H. Effect of Nanostructured Silicon on Surface Enhanced Raman Scattering. RSC Adv. 2018, 8, 6629–6633. [Google Scholar] [CrossRef]
  39. Zhu, X.Y.; Wang, A.J.; Chen, S.S.; Luo, X. Feng, J.J Facile Synthesis of AgPt@Ag Core-Shell Nanoparticles as Highly Active Surface-Enhanced Raman Scattering Substrates. Sens. Actuators B Chem. 2018, 260, 945–952. [Google Scholar] [CrossRef]
  40. Shaik, U.P.; Hamad, S.; Ahamad Mohiddon, M.; Soma, V.R.; Ghanashyam Krishna, M. Morphologically Manipulated Ag/ZnO Nanostructures as Surface Enhanced Raman Scattering Probes for Explosives Detection. J. Appl. Phys. 2016, 119, 093103. [Google Scholar] [CrossRef]
  41. Jamil, A.K.; Izake, E.L.; Sivanesan, A.; Fredericks, P.M. Rapid Detection of Tnt in Aqueous Media by Selective Label Free Surface Enhanced Raman Spectroscopy. Talanta 2015, 134, 732–738. [Google Scholar] [CrossRef] [PubMed]
  42. Kosovic, M.; Balarin, M.; Ivanda, M.; Derek, V.; Marcius, M.; Ristic, M.; Gamulin, O. Porous Silicon Covered with Silver Nanoparticles as Surface-Enhanced Raman Scattering (SERS) Substrate for Ultra-Low Concentration Detection. Appl. Spectrosc. 2015, 69, 1417–1424. [Google Scholar] [CrossRef] [PubMed]
  43. Novara, C.; Dalla Marta, S.; Virga, A.; Lamberti, A.; Angelini, A.; Chiado, A.; Rivolo, P.; Geobaldo, F.; Sergo, V.; Bonifacio, A.; et al. SERS-Active Ag Nanoparticles on Porous Silicon and Pdms Substrates: A Comparative Study of Uniformity and Raman Efficiency. J. Phys. Chem. C 2016, 120, 16946–16953. [Google Scholar] [CrossRef]
  44. Lai, Y.C.; Ho, H.C.; Shih, B.W.; Tsai, F.Y.; Hsueh, C.H. High Performance and Reusable Sers Substrates Using Ag/ZnO Heterostructure on Periodic Silicon Nanotube Substrate. Appl. Surf. Sci. 2018, 439, 852–858. [Google Scholar] [CrossRef]
  45. Alessandri, I. Enhancing Raman Scattering without Plasmons: Unprecedented Sensitivity Achieved by TiO2 Shell-Based Resonators. J. Am. Chem. Soc. 2013, 135, 5541–5544. [Google Scholar] [CrossRef] [PubMed]
  46. Liu, B.; Ni, H.; Zhang, D.; Wang, D.; Fu, D.; Chen, H.; Gu, Z.; Zhao, X. Ultrasensitive Detection of Protein with Wide Linear Dynamic Range Based on Core-Shell Sers Nanotags and Photonic Crystal Beads. ACS Sens. 2017, 2, 1035–1043. [Google Scholar] [CrossRef] [PubMed]
Scheme 1. Schematic fabrication of silver nanoparticles incorporated porous silicon photonic crystals (PS PCs) for surface-enhanced Raman scattering (SERS).
Nanomaterials 08 00872 sch001
Figure 1. Scanning electron microscope (SEM) images of PS PC substrates (a) top view of porous silicon; (b) cross-section view of porous silicon; (cf) surface topographies of silver nanoparticles (AgNP)-decorated porous Si with immersing times of 30, 45, 60, and 75 s, respectively.
Nanomaterials 08 00872 g001
Figure 2. (a) Raman pattern and (b) reflectance spectra of AgNP-decorated PS PC samples with different Ag deposition times. The image shows the behavior of the reflectance spectrum of the PS PC samples with and without Ag nanoparticles.
Nanomaterials 08 00872 g002
Figure 3. SERS spectra of R6G molecules (10−5 mol/L) on AgNP-decorated PS with different immersing times.
Nanomaterials 08 00872 g003
Figure 4. (a) SERS signals of R6G, at different concentrations ranging from 10−3 to 10−10 mol/L, absorbed on AgNP-decorated PS PC samples. (b) Corresponding linear fitting of Raman intensity at 1512 cm1 with logarithmic R6G concentration. Error bars present the standard deviation obtained from three independent measurements. (λexcitation 633 nm, acquisition time 3 s, laser power 1 mW).
Nanomaterials 08 00872 g004
Figure 5. (a) SERS spectra of PA (10−5 mol/L) adsorbed on AgNP-decorated PS PC substrate, obtained from five random spots; (b) The transverse dash line shows the average SERS intensity of the five random spots within single substrate.
Nanomaterials 08 00872 g005
Figure 6. (a) SERS signals of PA adsorbed at different concentrations on AgNP-decorated PS PC substrates: (A) 10−4 mol/L, (B) 10−5 mol/L, (C) 10−6 mol/L, (D) 10−7 mol/L, (E) solid PA and (b) the relationship between the Raman intensity (938 cm−1) and PA concentrations.
Nanomaterials 08 00872 g006
Table 1. Assignment of vibrational modes in SERS Spectra of Rhodamine 6G dye (R6G) and picric acid (PA).
PA Raman Shift (cm−1)Assignment [3]R6G Raman Shift (cm−1)Assignment [35,36]
825C–H bending612C−C ring in-plane bending in xanthene/phenyl rings
938ring breathing772C−H out-of-plane bending
1088phenolic C–O stretching797hybrid mode (xanthene/phenyl rings and NHC2H5 group)
1330C–C stretching1127C−H in-plane bending in xanthene/phenyl rings
1335NO2 symmetric stretching1187C−H in-plane bending in xanthene ring
1564C–NO2 asymmetric stretching1204hybrid mode (xanthene/phenyl rings)
1275C−O−C stretching in COOC2H5 group on phenyl ring
1312hybrid mode (xanthene/phenyl rings and NHC2H5 group)
1363C−C stretching in xanthene ring
1449C−N stretching in NHC2H5
1509C−C stretching in xanthene ring
1575C−C stretching in phenyl ring
1595hybrid mode (phenyl ring with COOC2H5
1651C−C stretching in xanthene ring
Table 2. Summary of reported detection limits obtained using SERS technique for PA sensing.
SubstrateDetection Limit (mol/L)Ref.
Positively charged silver nanoparticles2.5 × 10−5[11]
Versatile gold-based SERS substrates10−6[13]
Ag nanotriangles-loaded filter paper10−6[3]
Ag nanoparticles-loaded porous silicon10−8This work

