Article

Synthesis, Characterization, and Biological Evaluation of Nanostructured Hydroxyapatite with Different Dimensions

1
Tianjin Key Laboratory of Composite and Functional Materials, School of Materials Science and Engineering, Tianjin University, Tianjin 300072, China
2
School of Laboratory Medicine, Tianjin Medical University, Tianjin 300072, China
3
Department of Spinal Surgery, Liuzhou Worker’s Hospital, Liuzhou 545001, China
4
School of Materials Science and Engineering, Tianjin University, 92 Weijin Road, Tianjin 300072, China
*
Authors to whom correspondence should be addressed.
Nanomaterials 2017, 7(2), 38; https://doi.org/10.3390/nano7020038
Submission received: 15 December 2016 / Revised: 25 January 2017 / Accepted: 29 January 2017 / Published: 15 February 2017
(This article belongs to the Special Issue Cytotoxicity of Nanoparticles)

Abstract

:
Nanosized hydroxyapatite (HA) is a promising candidate for a substitute for apatite in bone in biomedical applications. Furthermore, due to its excellent bone bioactivity, nanosized strontium-substituted HA (SrHA) has aroused intensive interest. However, the size effects of these nanoparticles on cellular bioactivity should be considered. In this study, nanosized HA and SrHA with different dimensions and crystallization were synthesized by hydrothermal methods. The phase, crystallization and chemical composition were analyzed by X-ray diffraction (XRD) and Fourier transform infrared spectroscopy (FT-IR), respectively. The morphology was observed under field emission scanning electron microscopy (FE-SEM) and transmission electron microscopy (TEM). The degradation behaviors of the samples were monitored by determining the ions release profile with inductively coupled plasma mass spectrometry (ICP-MS). The releasing behavior of Ca2+ and Sr2+ showed that the degradation rate was proportional to the specific surface area and inversely proportional to crystallization. The in vitro experiment evaluated by MG63 cells showed that SrHA nanorods with a length greater than 100 nm had the best biological performance both in cell proliferation and differentiation (* p < 0.05 compared with HA-1 and SrHA-1; * p < 0.01 compared with HA-2). In addition, HA nanoparticles with a lower aspect ratio had better bioactivity than higher ones (* p < 0.05). This study demonstrated that nanosized HA and SrHA with subtle differences (including dimensions, crystallization, specific surface area, and degradation rate) could affect the cellular growth and thus might have an impact on bone growth in vivo. This work provides a view of the role of nano-HAs as ideal biocompatible materials in future clinical applications.

Graphical Abstract

1. Introduction

Due to its good biocompatibility, bioactivity, and osteoconductivity with human body constituents, hydroxyapatite (HA, Ca10(PO4)6(OH)2), which is the main inorganic constituent of human bones and teeth, has been widely used in biomedical applications, such as tissue engineering systems [1], replacements for bony and periodontal defects [2], bioactive coating on metallic osseous implants [3], and dental materials [4]. Many clinical studies have successfully proved that HA shows good performance in terms of osseous ingrowth [5,6,7]. Among the various HA structures, nanosized HA, which has a high surface activity and an ultrafine structure, similar to the mineral found in hard tissues [8], has been the most promising material for a variety of biomedical applications [9,10]. Many studies have shown that nanosized HA exhibits enhanced resorbability and higher bioactivity than micron-sized HA [11,12,13]. In addition, nanosized HA shows improved densification and sinterability due to its high surface energy [14,15]. Moreover, studies have shown that nanosized HA possesses a significant capability of improving osteogenesis-related cell proliferation and differentiation [16,17]. Therefore, nanosized HAs have aroused intensive interest, and great efforts have been made to study their synthesis, structure, and properties [11,18].
Native bone tissue is a composite composed of calcium phosphate (CaP) salts and a collagen fiber matrix and contains various cations, such as Si4+, Mg2+, and Zn2+ [15,19,20]. Hence, introducing extrinsic cations into the HA lattice is an effective method commonly used to improve its biological performance [21]. Strontium (Sr) is a trace element of the human body, of which 98% can be found in the skeleton. Many studies have proved that Sr not only enhances the proliferation of osteogenesis-related cells and bone matrix synthesis but also reduces the osteoclast activity [22,23,24]. Sr has also been shown to stimulate bone formation and decrease bone resorption in both animal studies and clinical trials [25,26]. For these reasons, Sr-substituted HA (SrHA) has attracted considerable interest from researchers and clinicians. However, to the best of our knowledge, the effect of morphology on the bioactivity of HA and SrHA is not yet known. Shi et al. found that HA nanoparticles with diameters of ~20 nm were better than those of ~80 nm in terms of the promotion of cell growth [27]. Another study by Mohandes et al. showed that the bioactivity of the one-dimensional HA nanostructures is greater than that of the zero-dimensional HA nanostructures [28]. Consider that the dimensions of apatite crystals in natural bone are stable, approximately ~50 × 25 × 2 nm [29]. Therefore, it is necessary to research the biological properties of nanosized HA and SrHA with subtle differences in dimensions.

2. Results

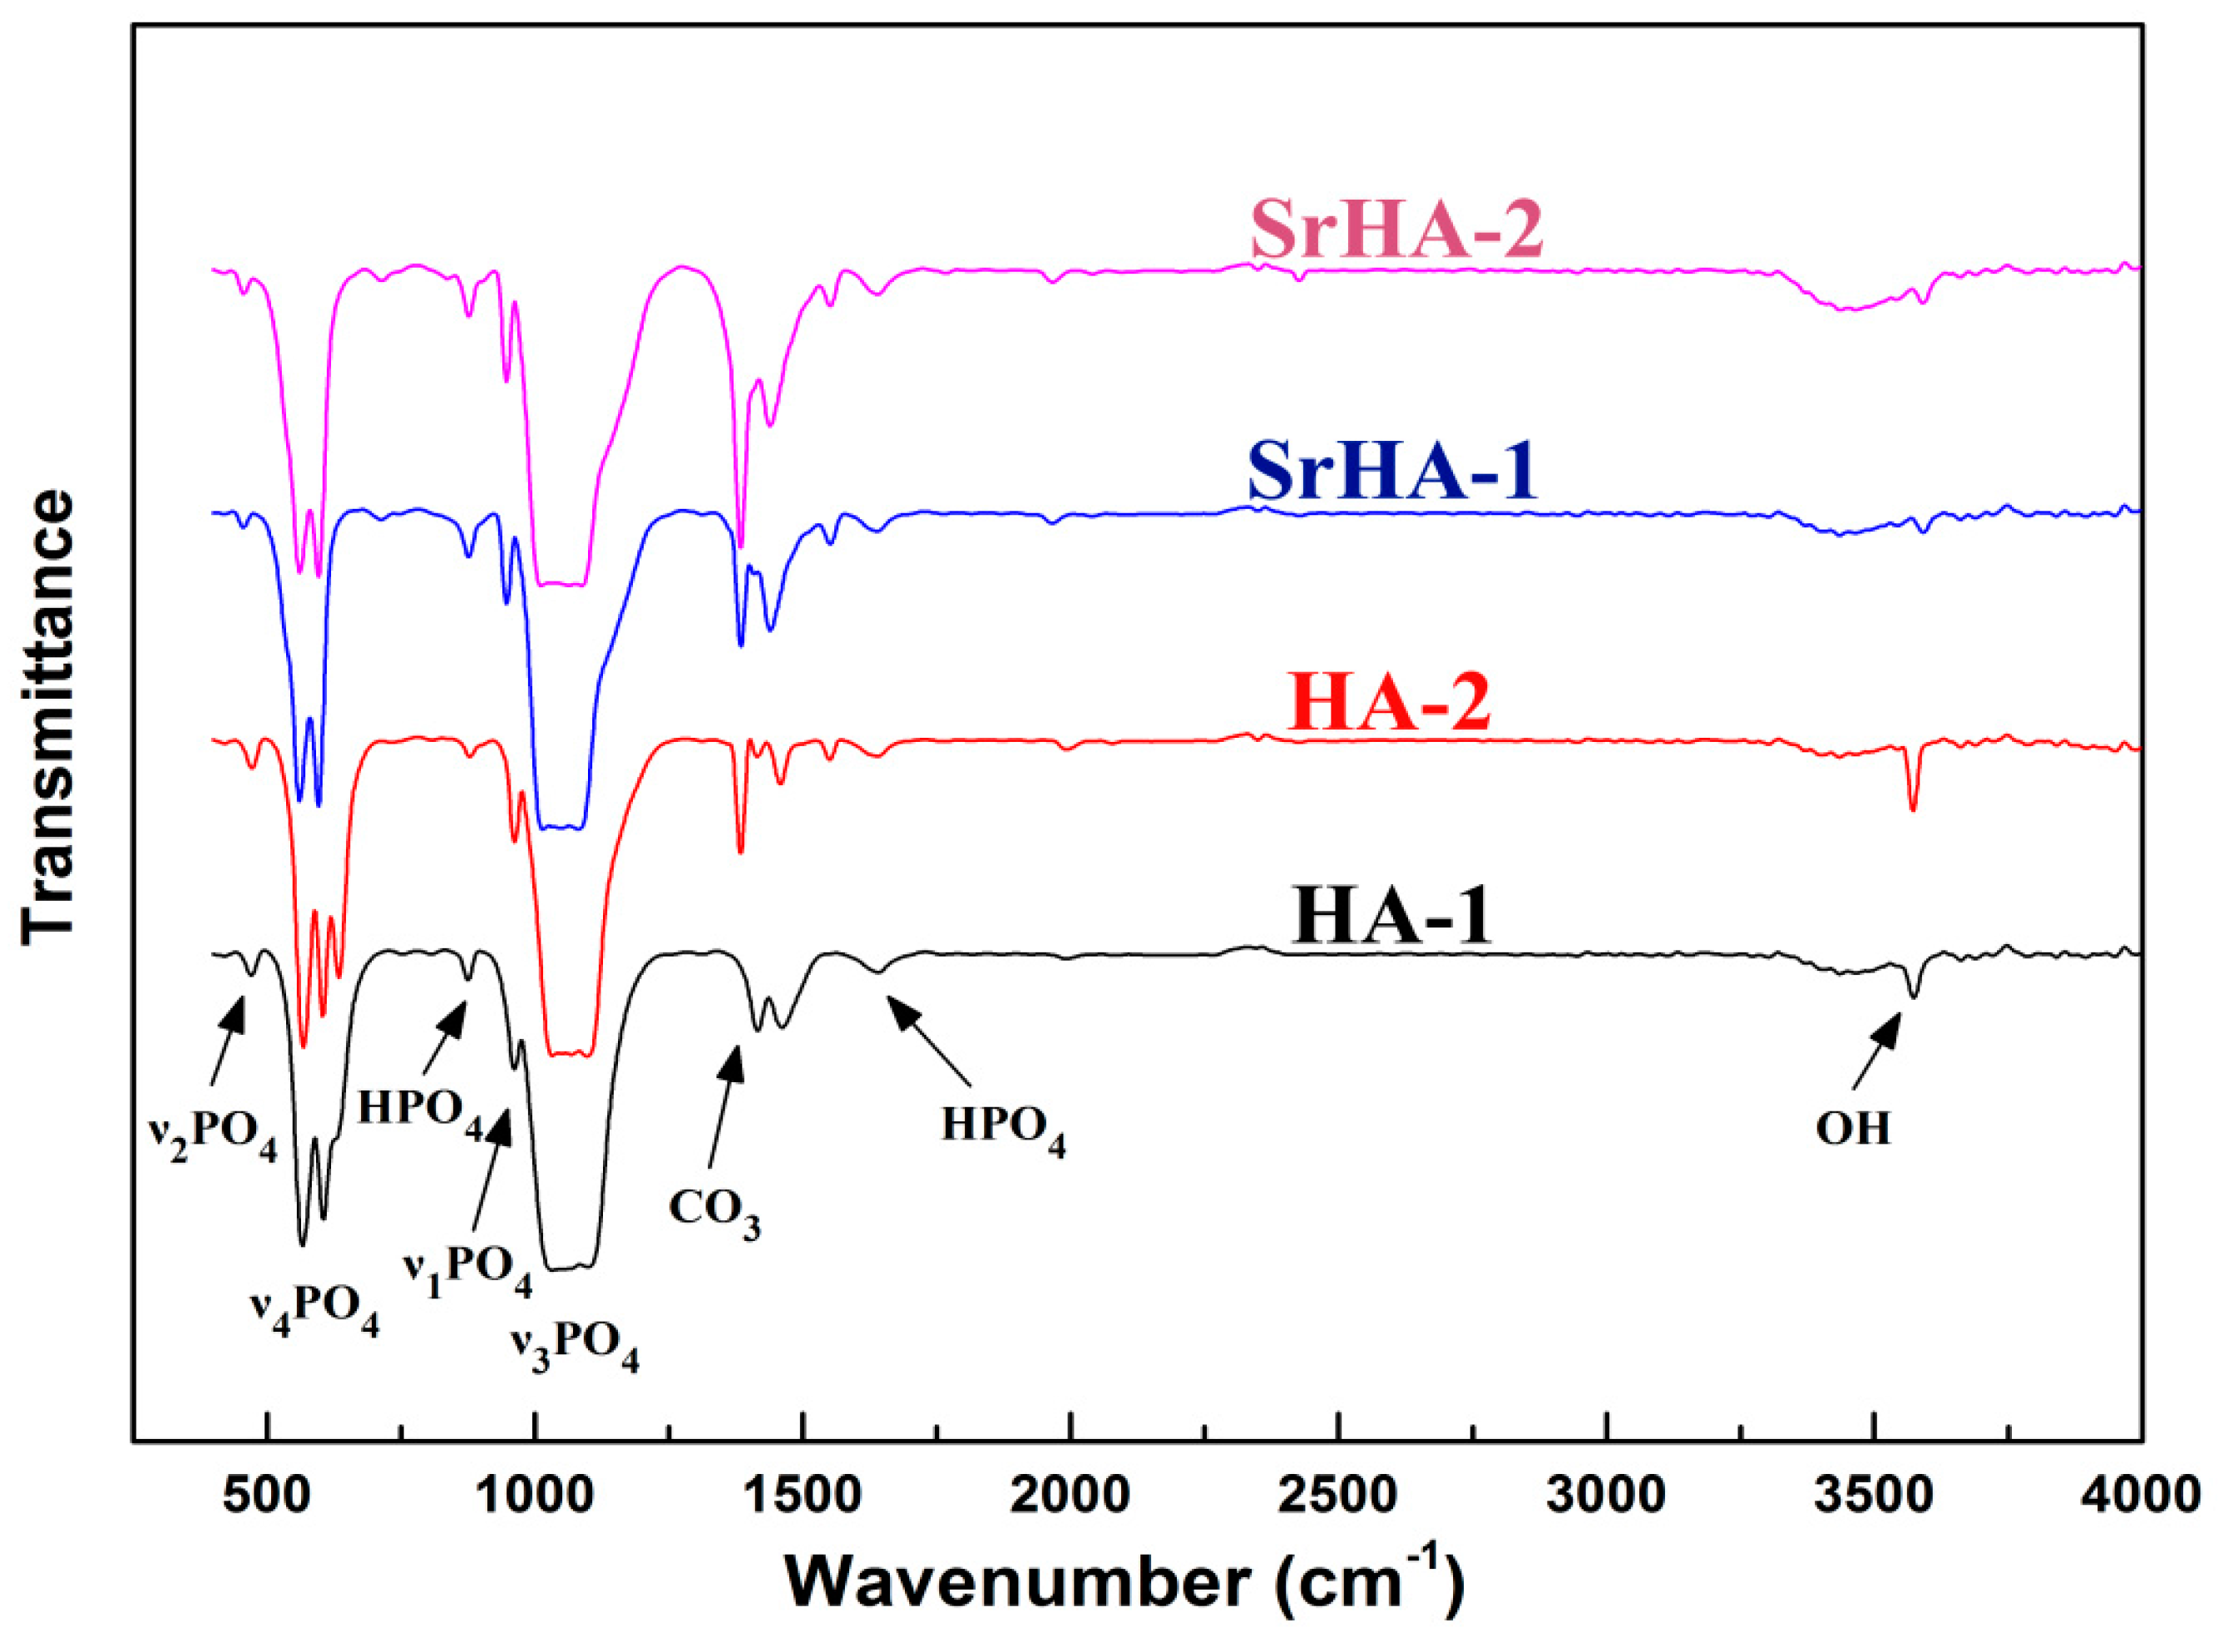
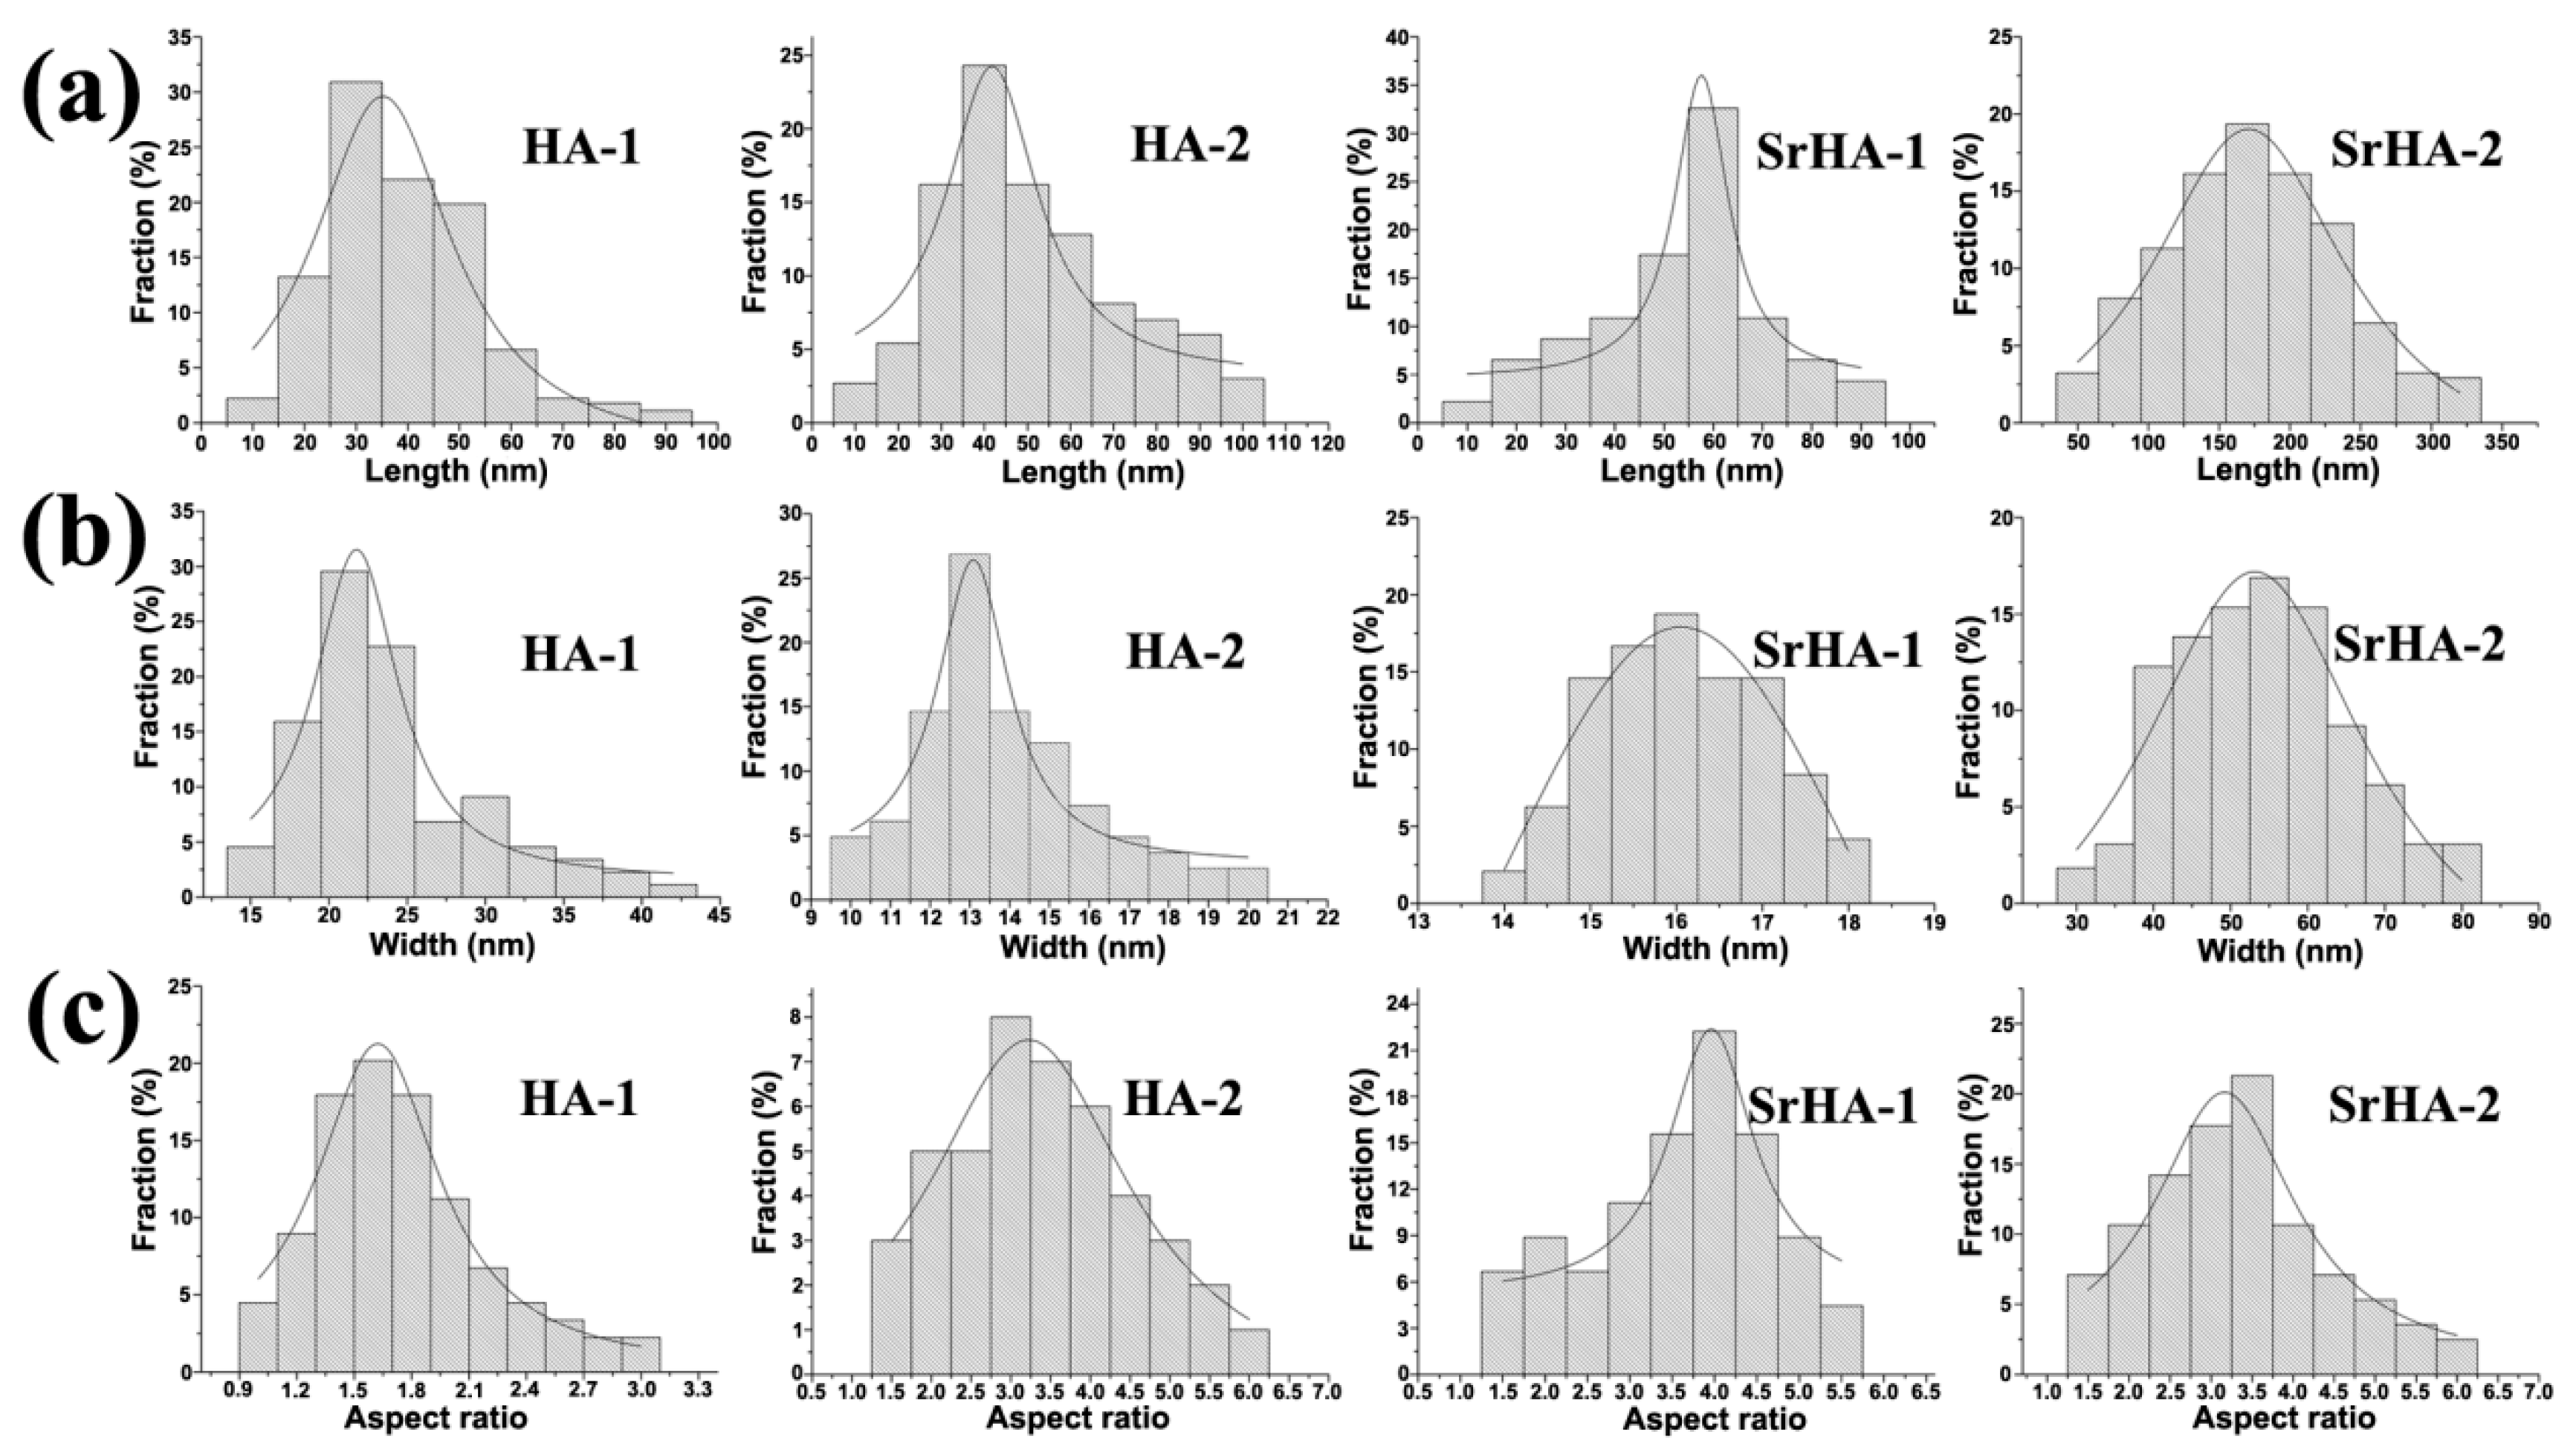
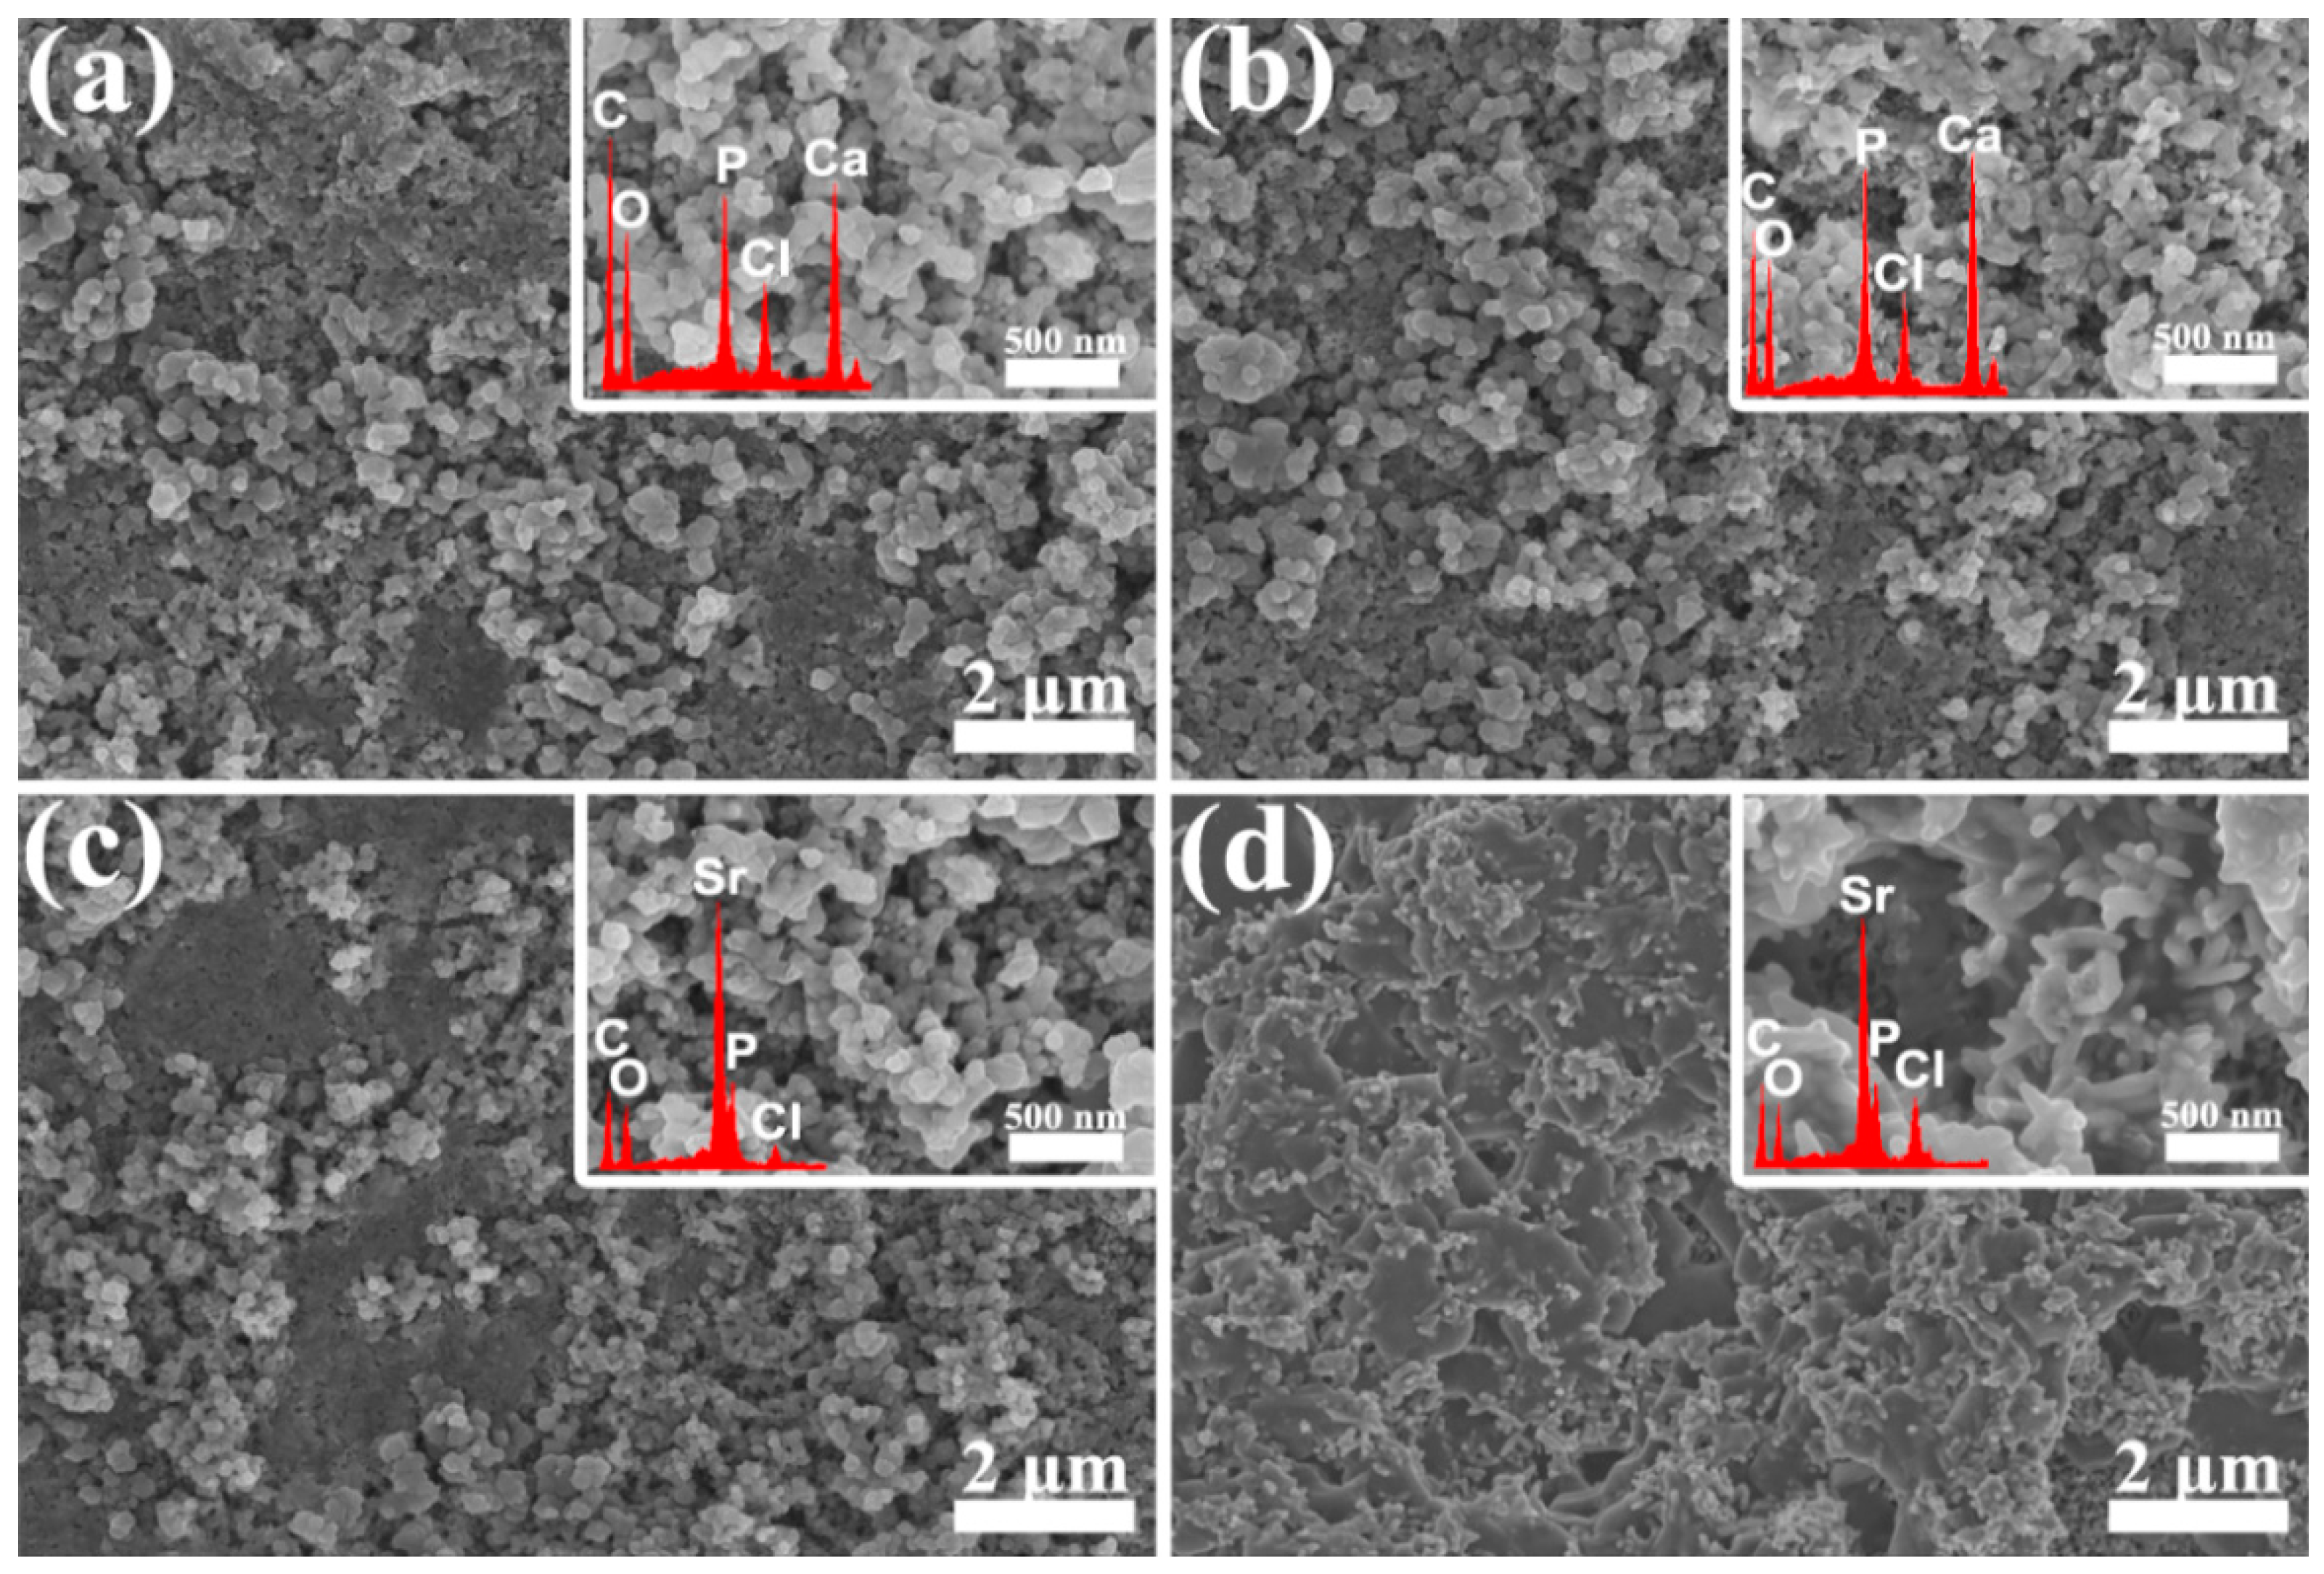
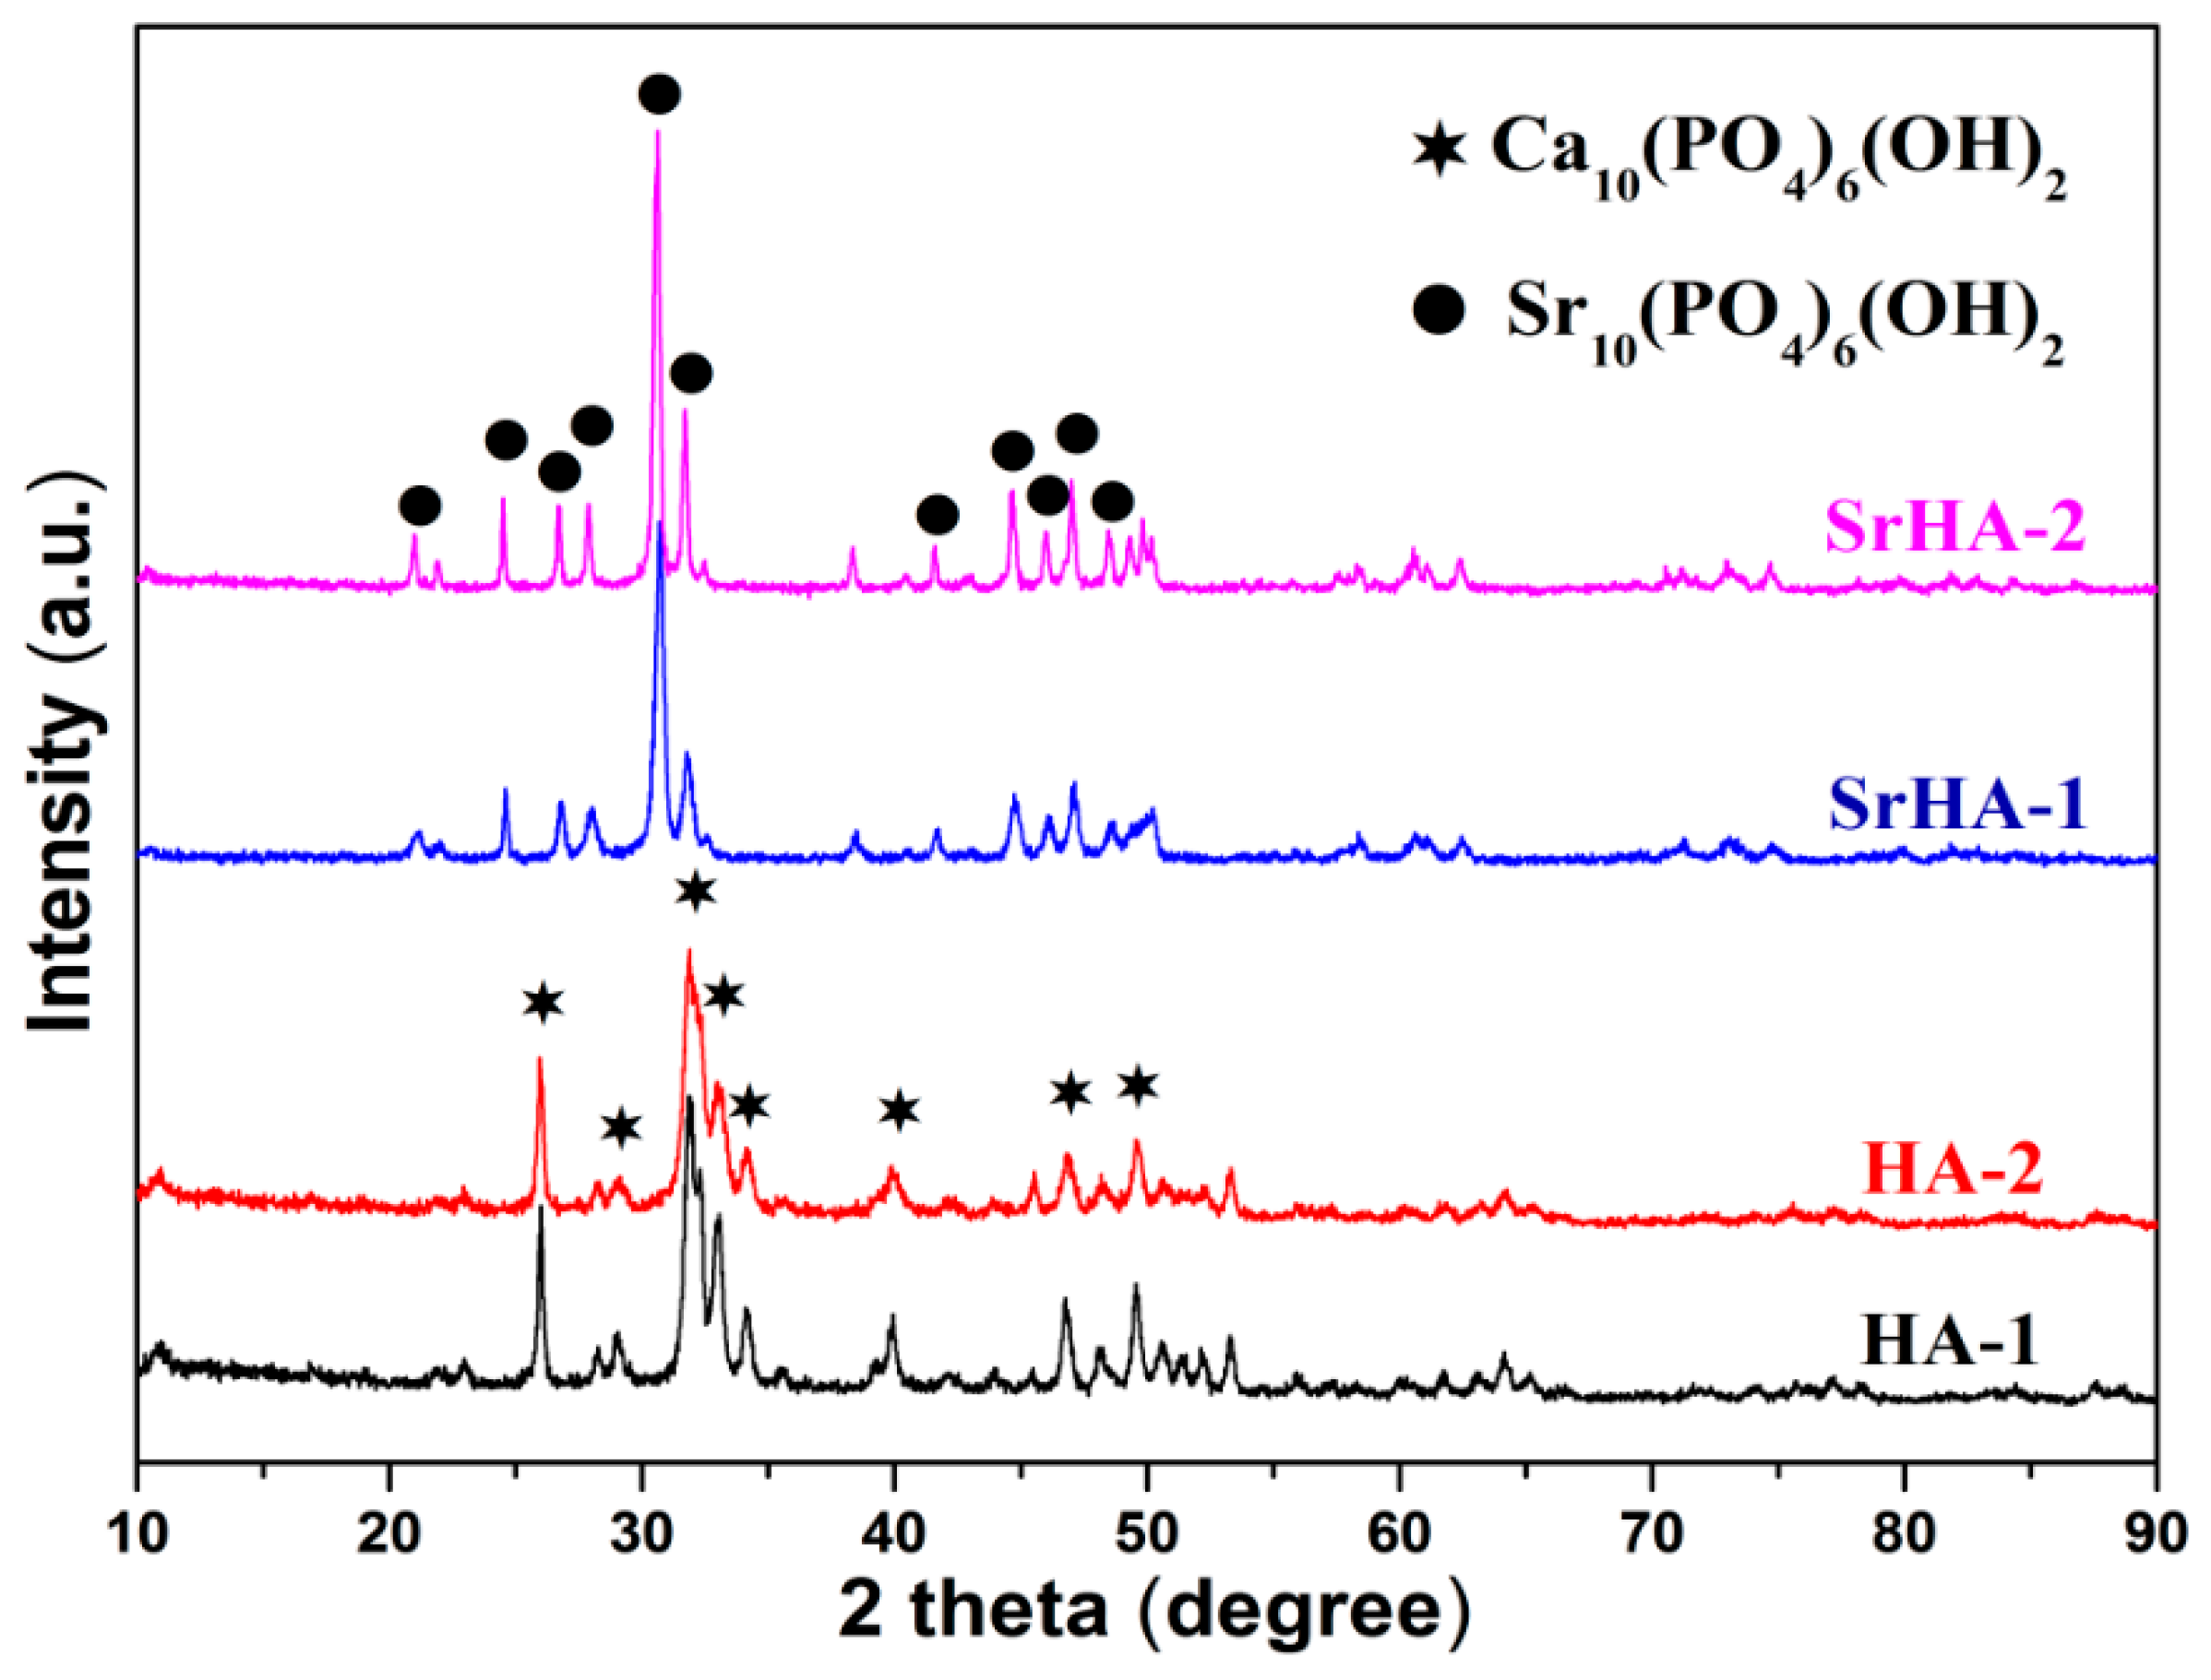
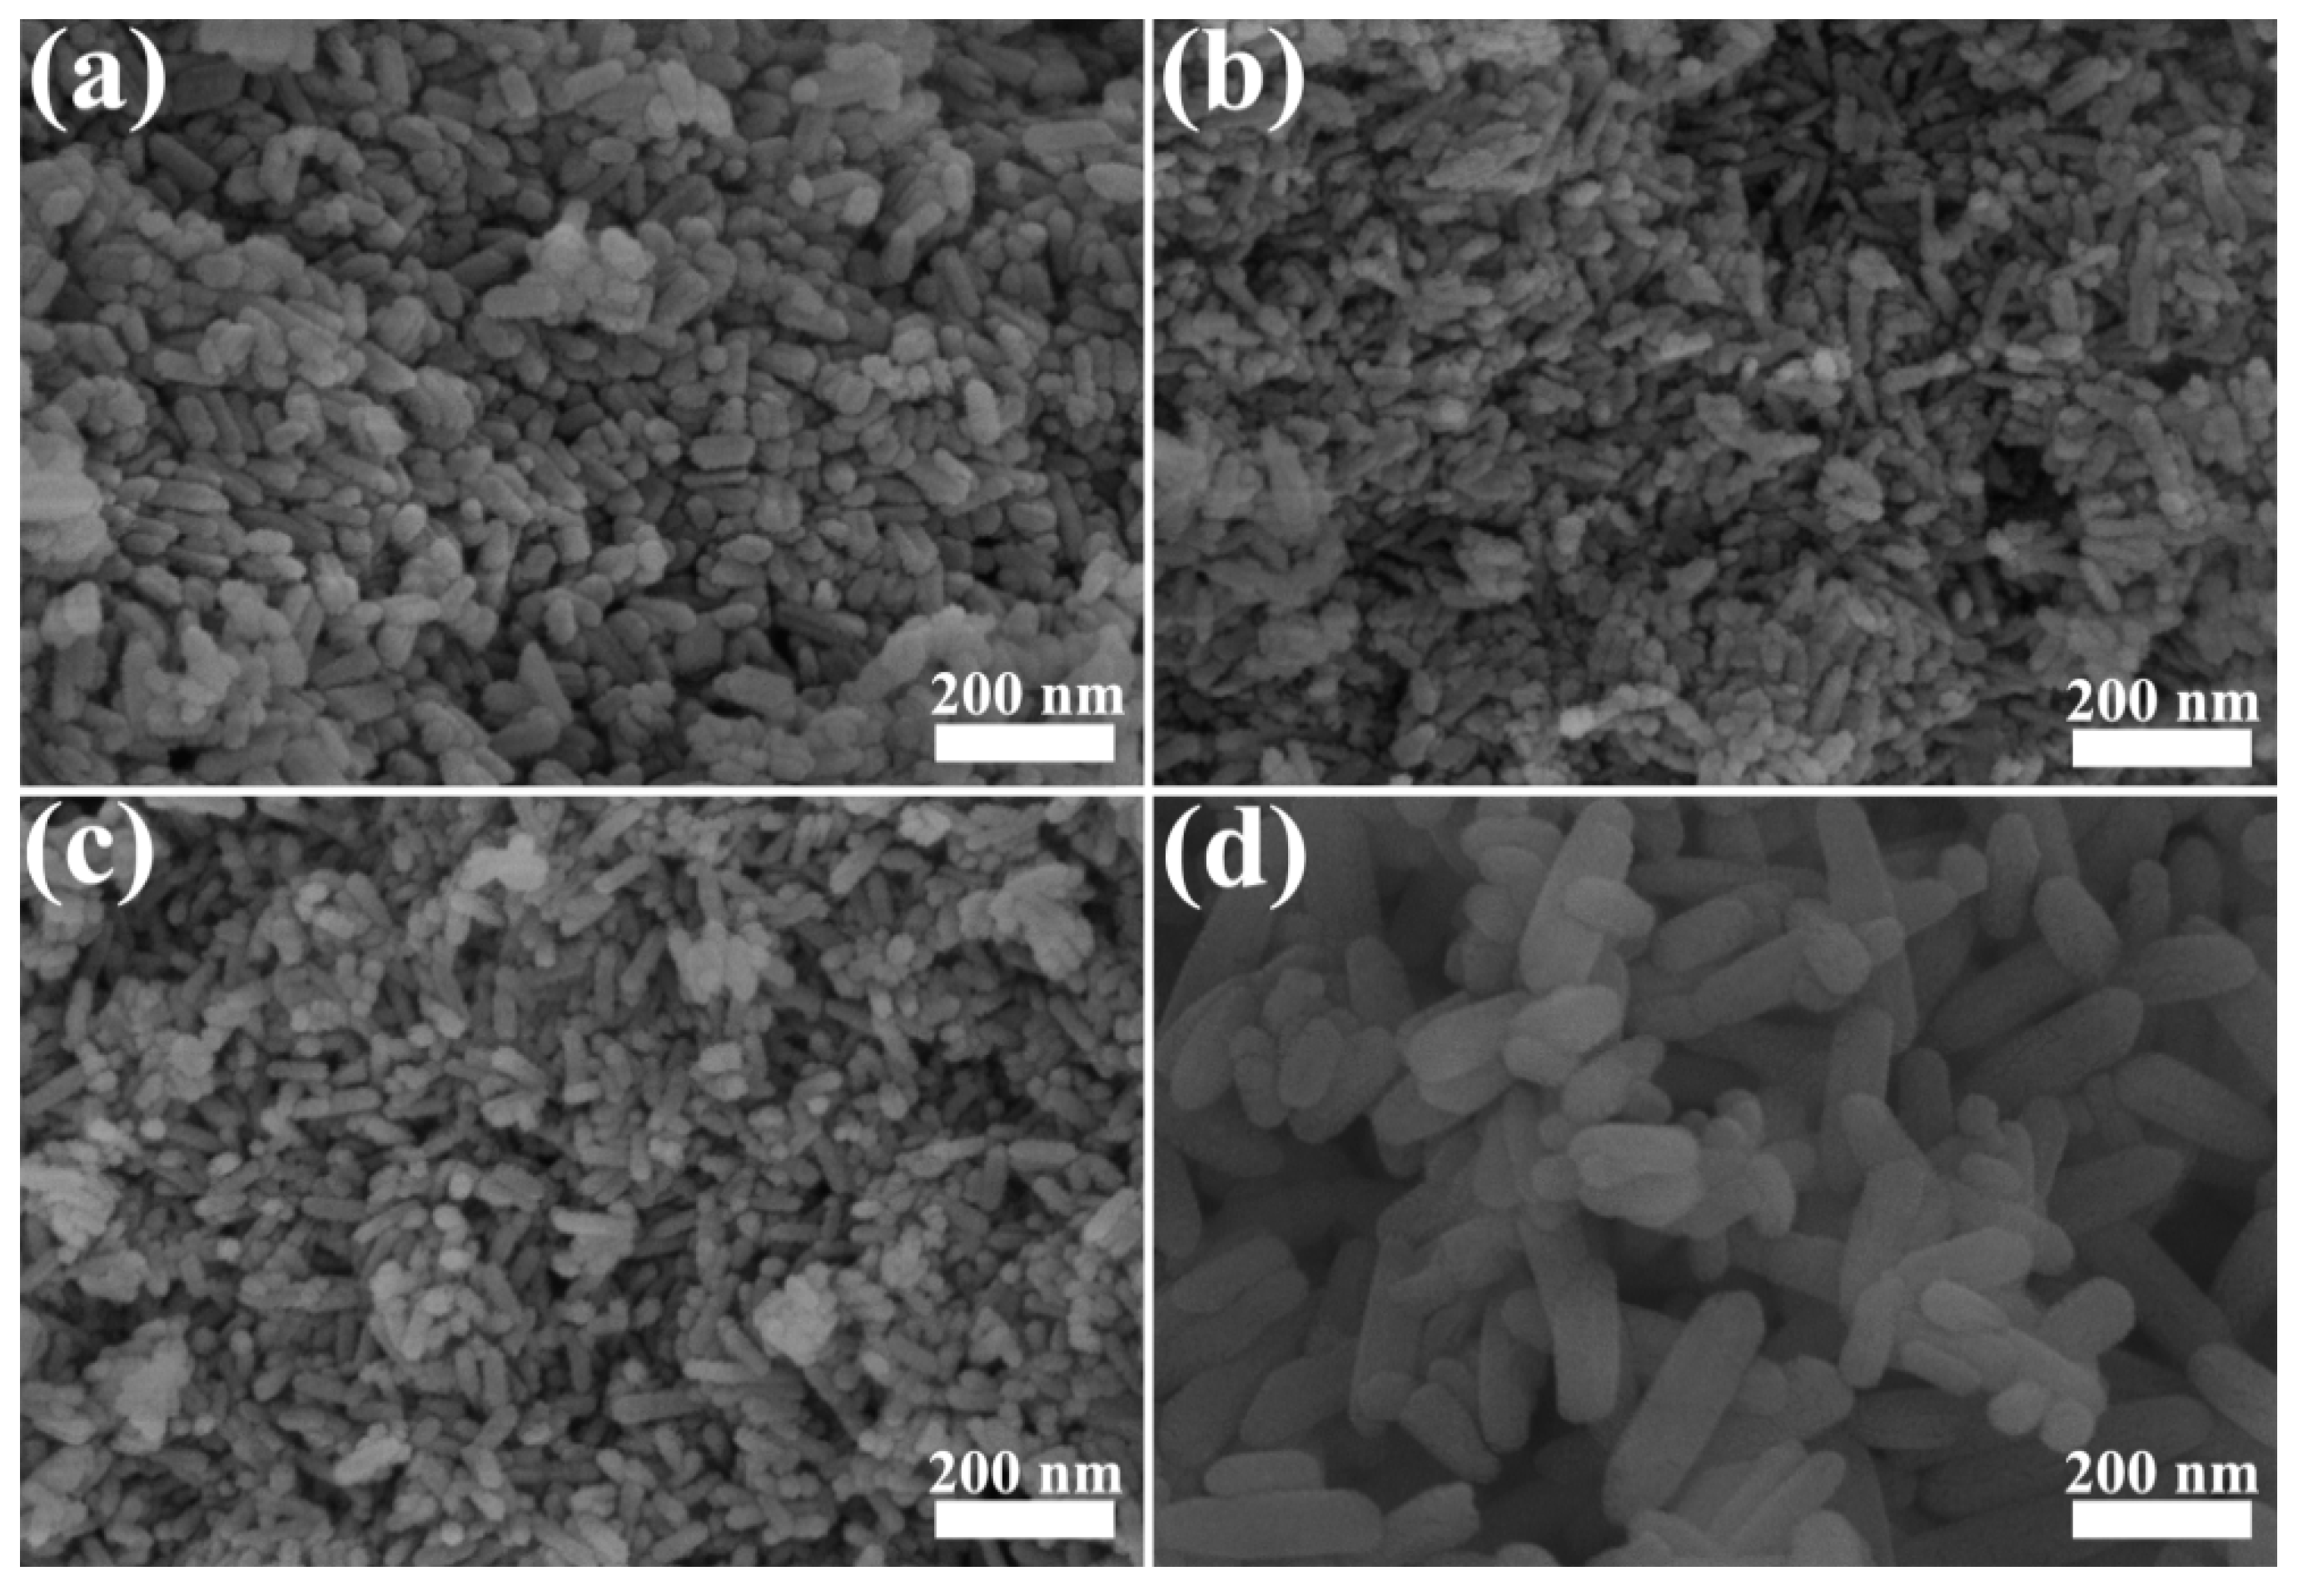
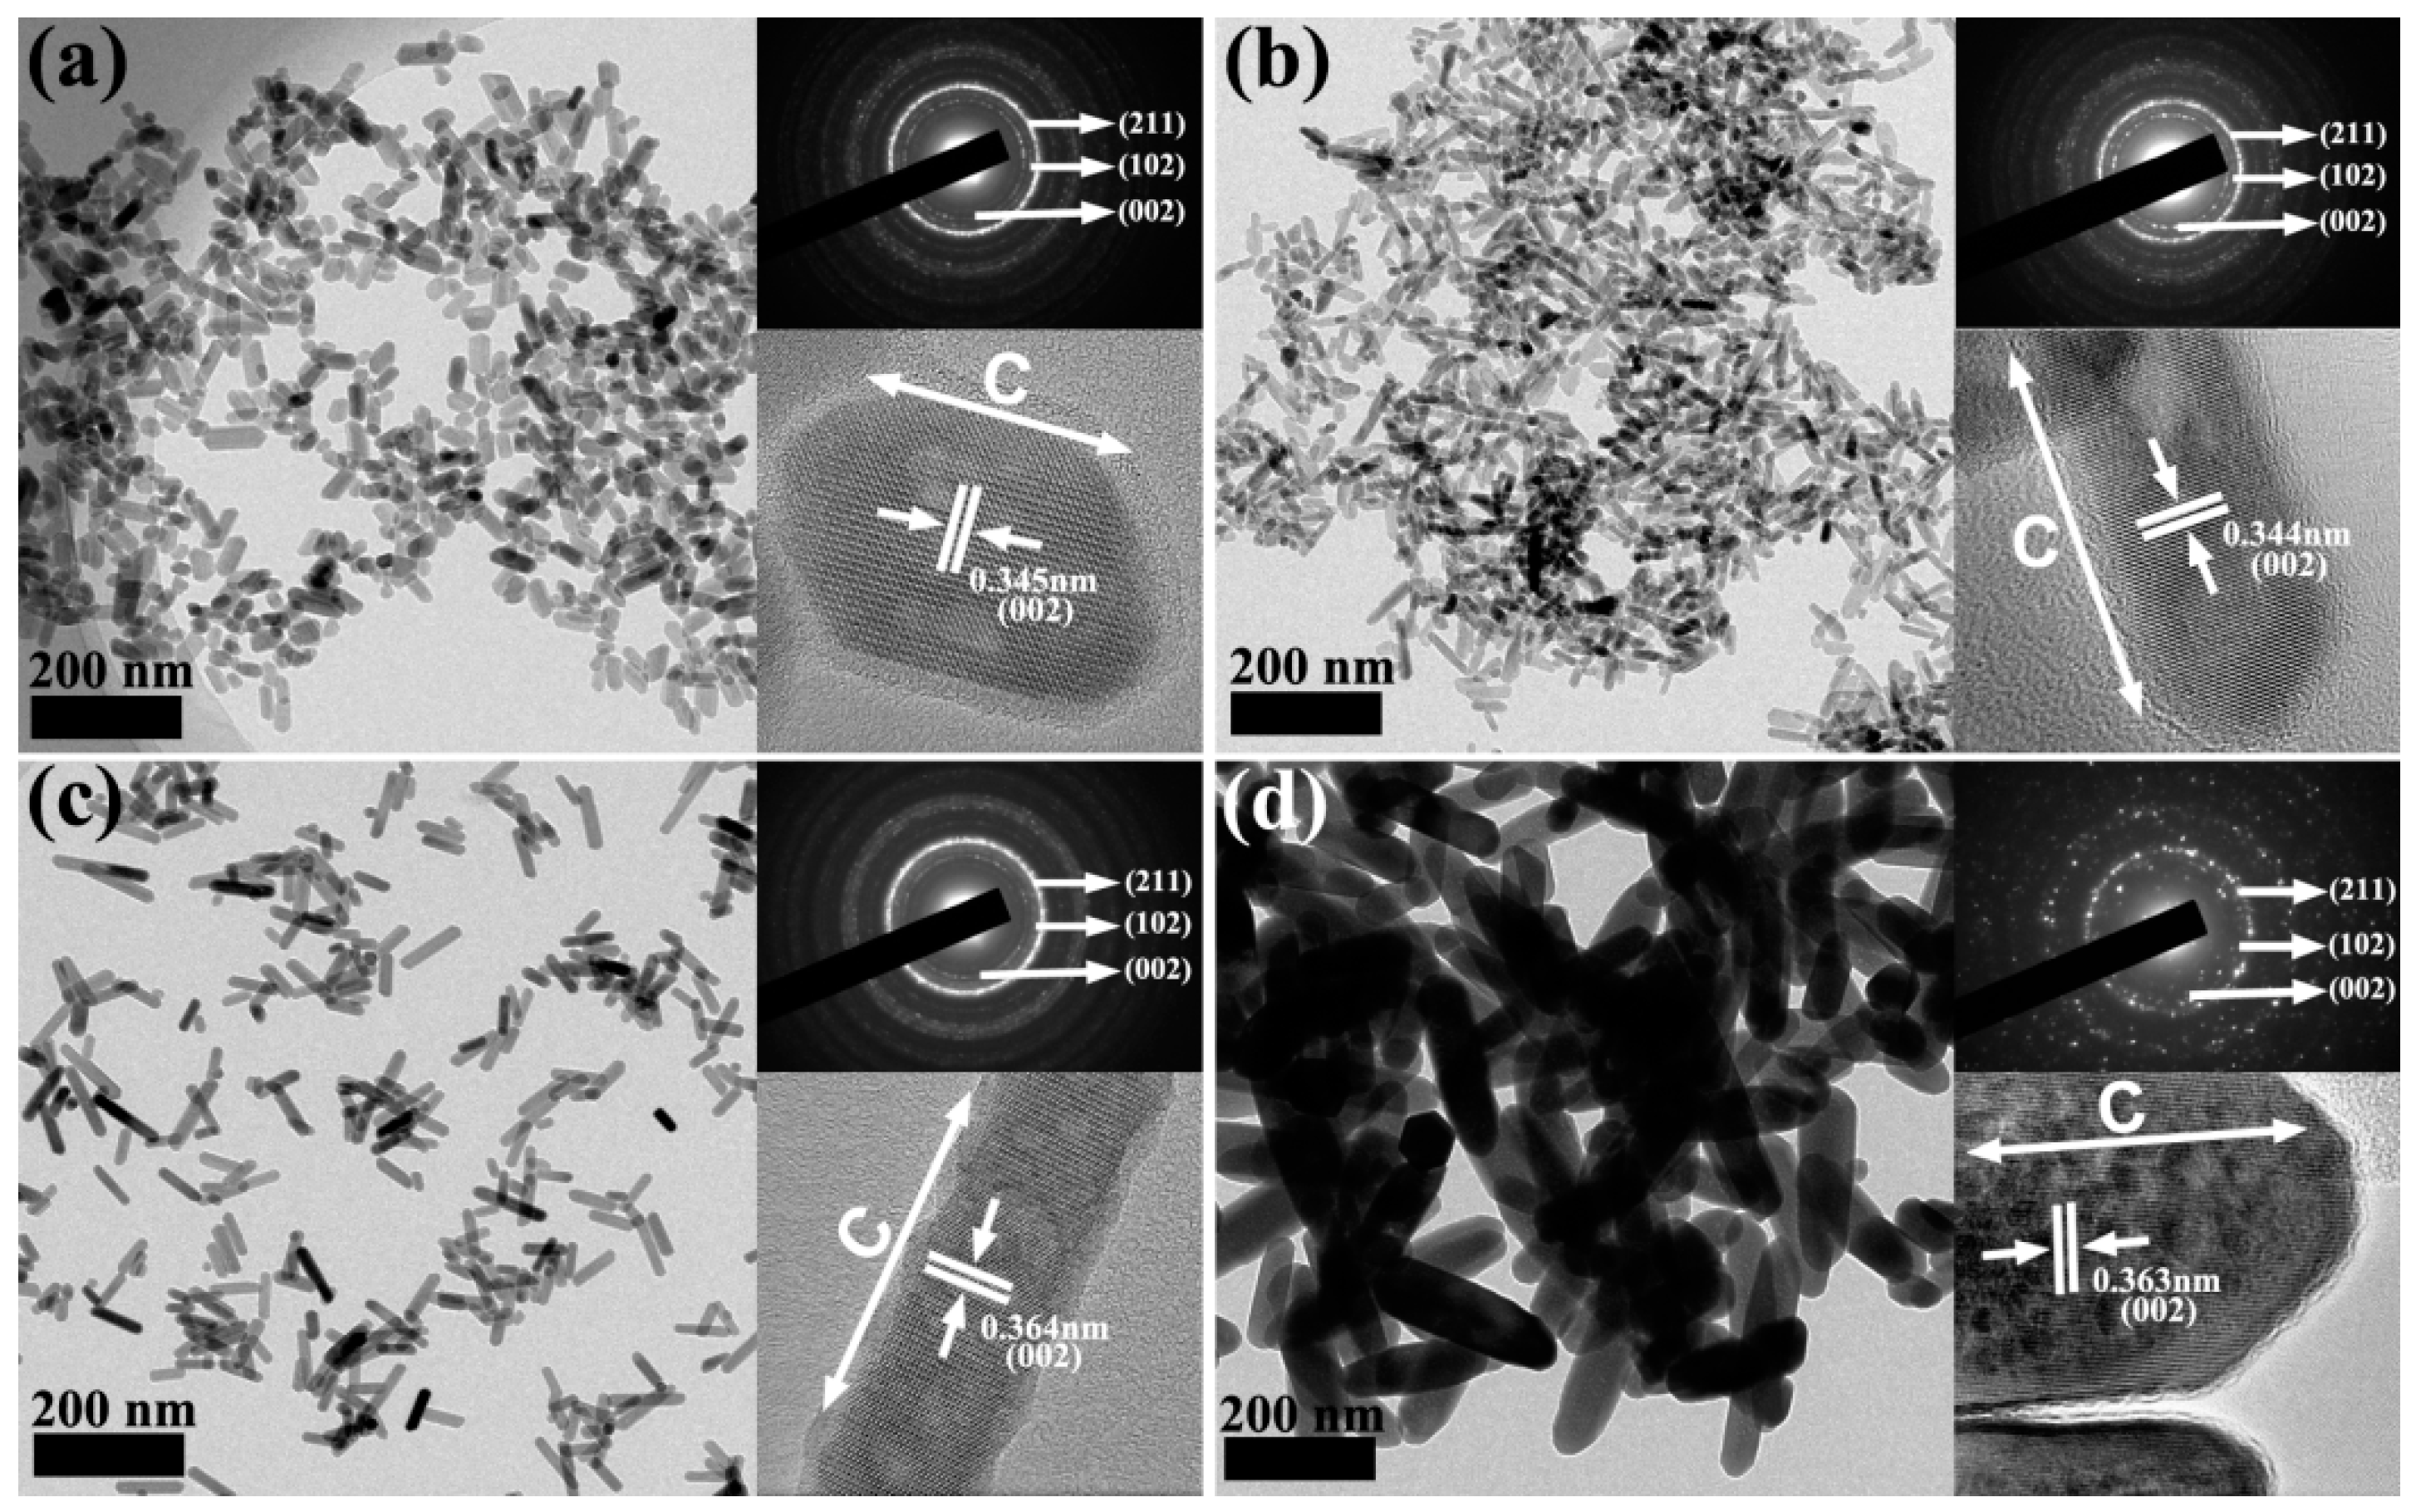
2.1. Results of Sample Characterization

The typical XRD patterns of all synthesized samples are shown in Figure 1. The patterns indicated that the main phase for HA-1 and HA-2 was Ca10(PO4)6(OH)2 (JCPDS03-0747). Meanwhile, the main phase for SrHA-1 and SrHA-2 was Sr10(PO4)6(OH)2 (JCPDS12-0361). It was also revealed that SrHA-1 and SrHA-2 exhibited sharp diffraction peaks, especially for SrHA-2, indicating a high crystallinity. There were no significant differences between HA-1 and HA-2 with respect to the diffraction peaks. The crystallinity results calculated by Equation (1) indicated that SrHA-2 had the highest degree of crystallization (83.7%); it was 71.9% for SrHA-1. The crystallization degree of both SrHA-2 and SrHA-1 was significantly higher than that of HA-1 (55.4%, p < 0.01) and HA-2 (35.6%, p < 0.01), as shown in Table 1.
Figure 2 shows the FT-IR spectra of the prepared samples. The absorption bands at 1000–1100(υ3), 963(υ1), 577–603(υ4), and 472(υ2) detected in the spectrum, which were attributed to the phosphate (PO43−) characteristic absorption, were present in all the spectra for the synthesized samples. The absorption band at 1640 cm−1 was attributed to hydrogen phosphate, HPO42−. The absorption band at 1390 cm−1, which was derived from the vibration of the CO32− group, was owing to carbonated hydroxyapatite. The carbonated hydroxyapatite was derived from the reaction of the PO43− group and CO2 in the air. The absorption band at 3570 cm−1 was assigned to the characteristic OH vibrations (stretching frequency) of HA. The carbonate absorption intensity was strengthened by the incorporation of Sr (SrHA).
SEM and TEM were used to study the morphology of the prepared samples, as shown in Figure 3 and Figure 4. The SEM images showed that the morphologies of HA-1, HA-2, and SrHA-1 were nanoparticles (less than 100 nm, Figure 3a–c), while SrHA-2 was a nanorod larger than the other three (Figure 3d). This was further confirmed by the TEM (Figure 4). Meanwhile, SAED and HRTEM patterns demonstrated that all samples had good crystallinity, which was in agreement with the results of XRD.
For the sake of comparison, the distribution of length, width, and aspect ratio of the samples were manually measured, as shown in Figure 5. It was evident that the length of SrHA-2 (approximately 100–300 nm) was higher than that of the other three (lower than 100 nm). Meanwhile, SrHA-2 had the largest width (40–80 nm); HA-1 took the second place (15–40 nm), and HA-2 and SrHA-1 were the smallest (10–20 nm). In addition, HA-2, SrHA-1, and SrHA-2 had a similar aspect ratio (1.5–6.0), while it ranged from 1.0 to 3.0 for HA-1. These results indicated that both the length and width of SrHA-2 are significantly larger than those of the other three (p < 0.01). HA-2, SrHA-1, and SrHA-2 showed a similar aspect ratio, which was significantly bigger than that of HA-1 (p < 0.01). The BET analysis showed that the specific surface area of HA-2 was the biggest (92 ± 8 m2/g) and significantly higher than the other three (p < 0.01). Meanwhile, SrHA-2 was the smallest (38 ± 4 m2/g). In addition, it was 57 ± 6 and 45 ± 5 m2/g for HA-1 and SrHA-1, respectively, as shown in Table 1.
In order to investigate the effect of the samples on cellular bioactivity, Ti-based nanoparticle coatings were prepared, as shown in Figure 6. Based on SEM observations, all coatings had uniform surface structures. Meanwhile, the SrHA-2 coating showed a nanorod morphology, which was different from the other three (nanoparticles), as shown in the inset.

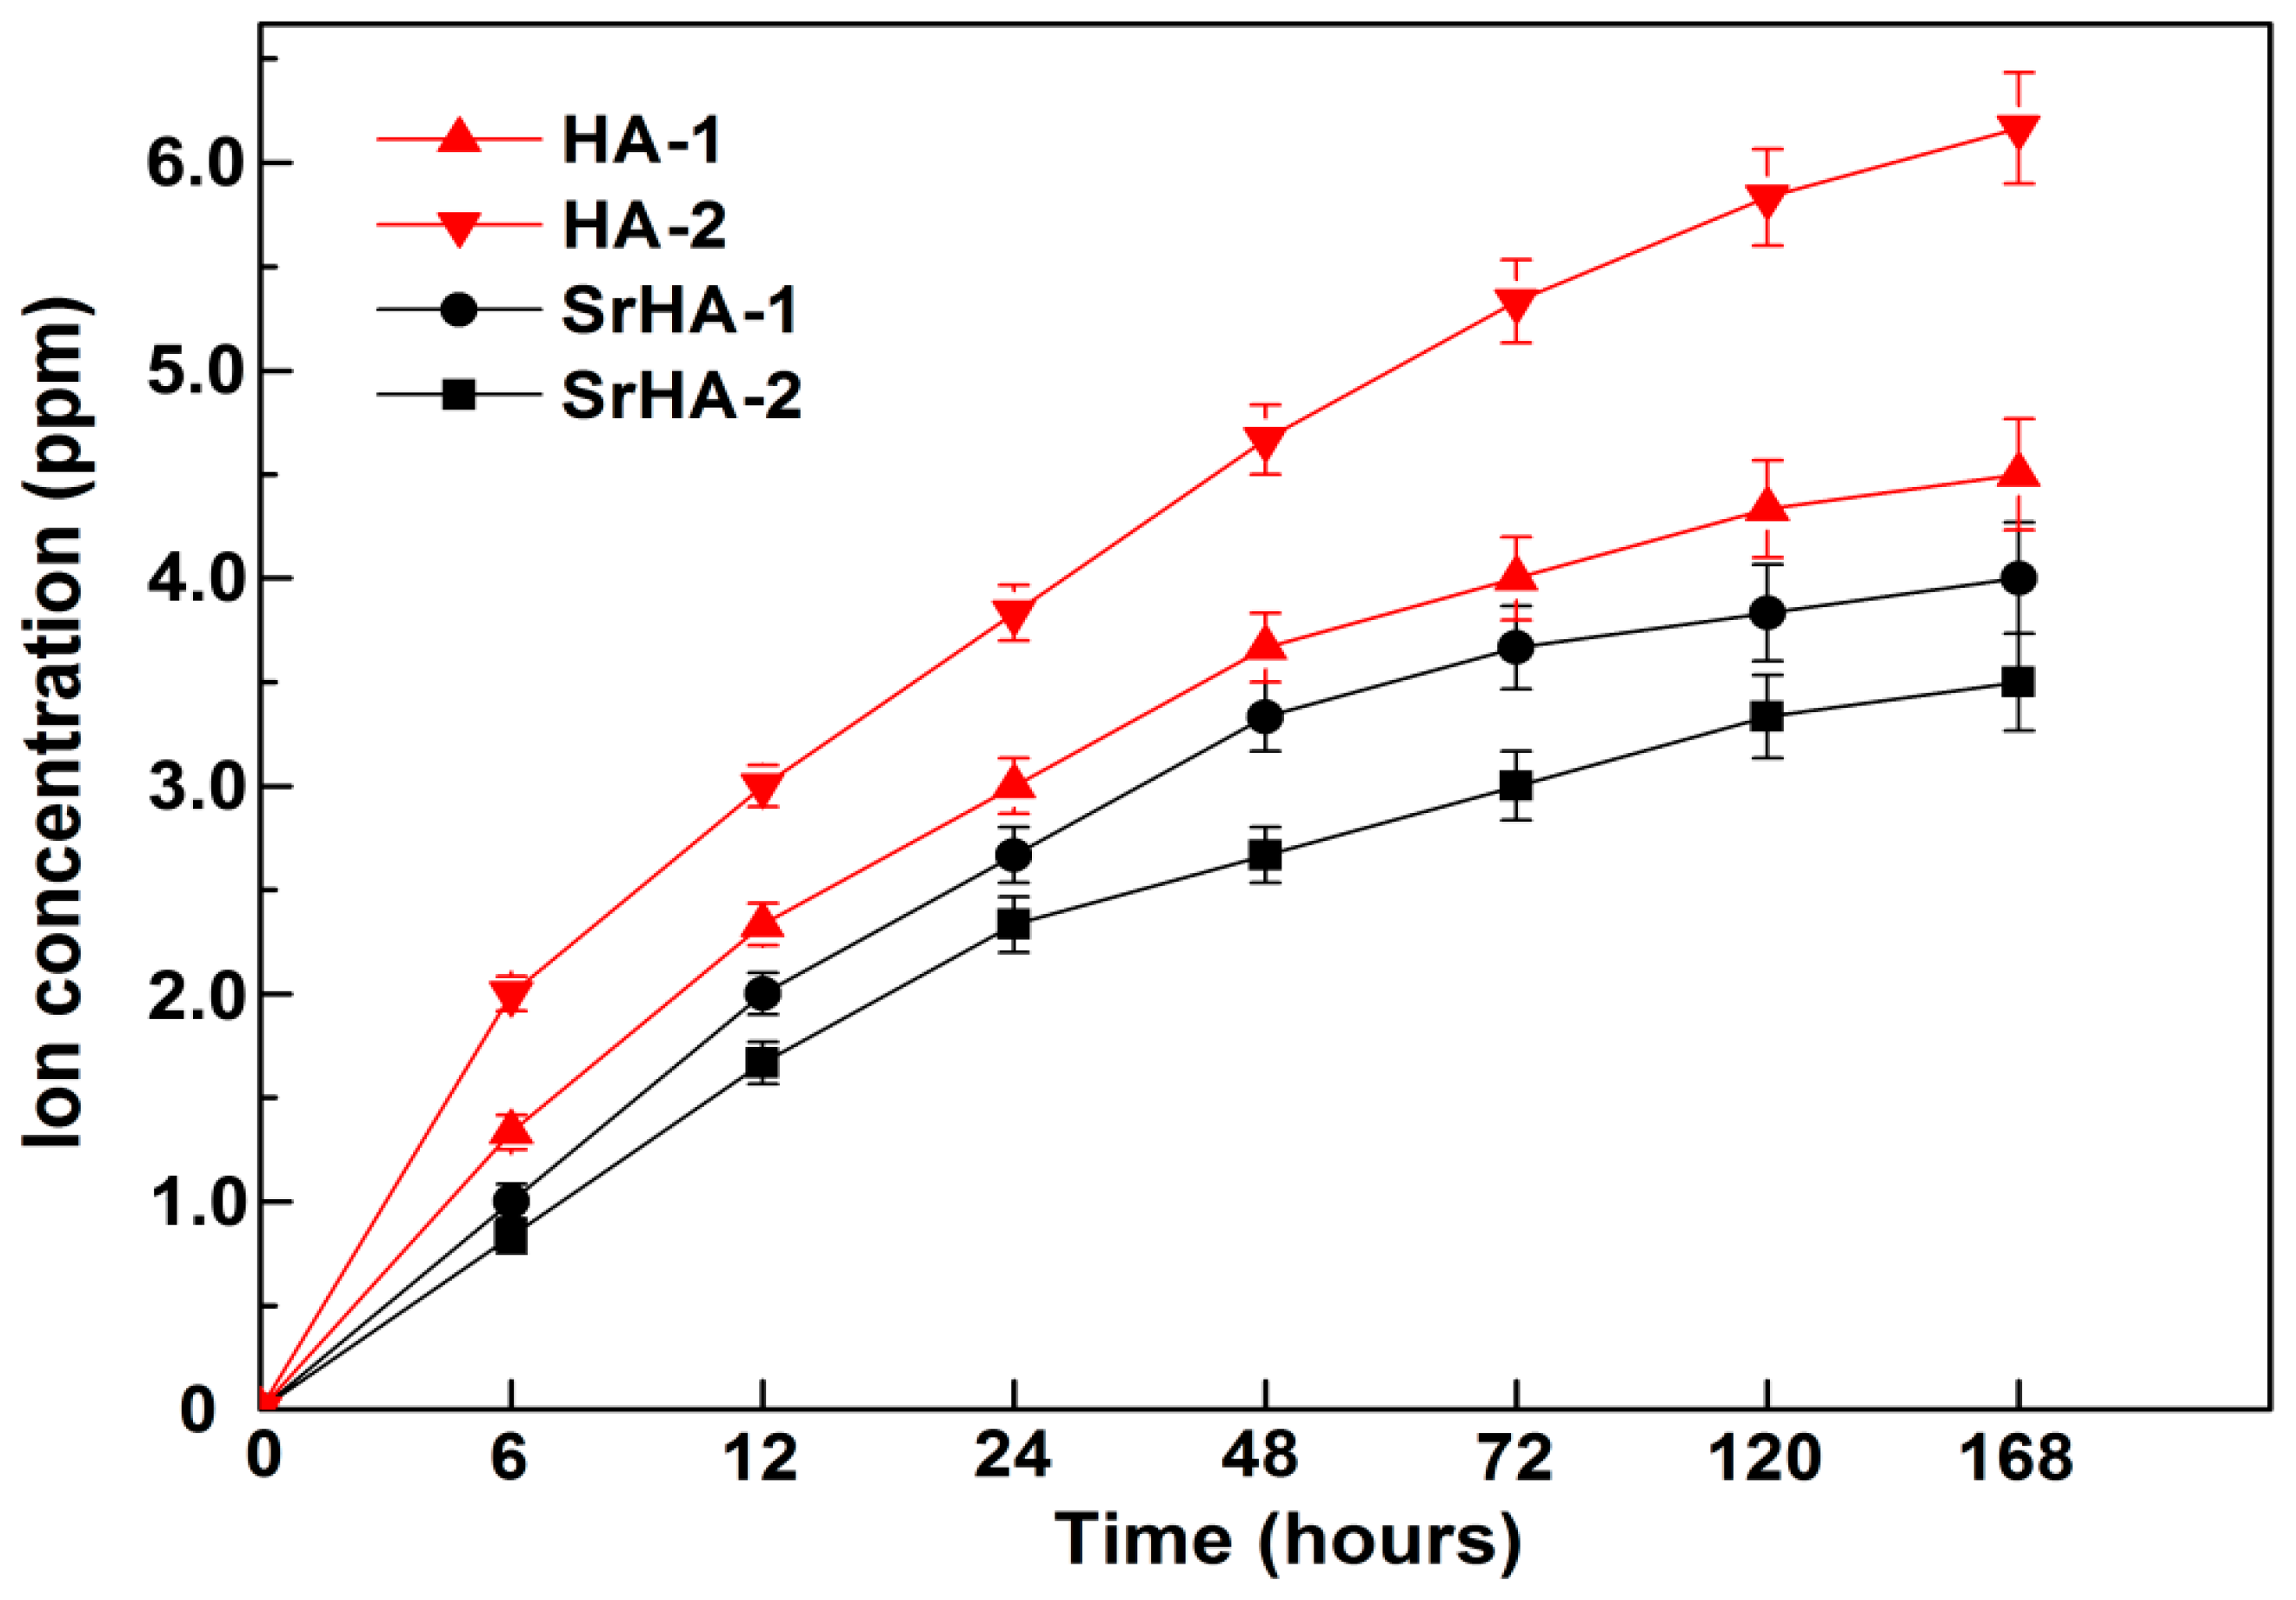
2.2. Ion Release Property

The Ca and Sr release kinetics are measured over the course of seven days, as shown in Figure 7. It is evident that the releasing rates of all samples are rapid in the early stages and slow over time. Meanwhile, the released Ca amounts of HA-1 are significantly higher than those of HA-2 during the whole process (p < 0.01). In addition, SrHA-2 shows a slower releasing rate than SrHA-1 (not significant).

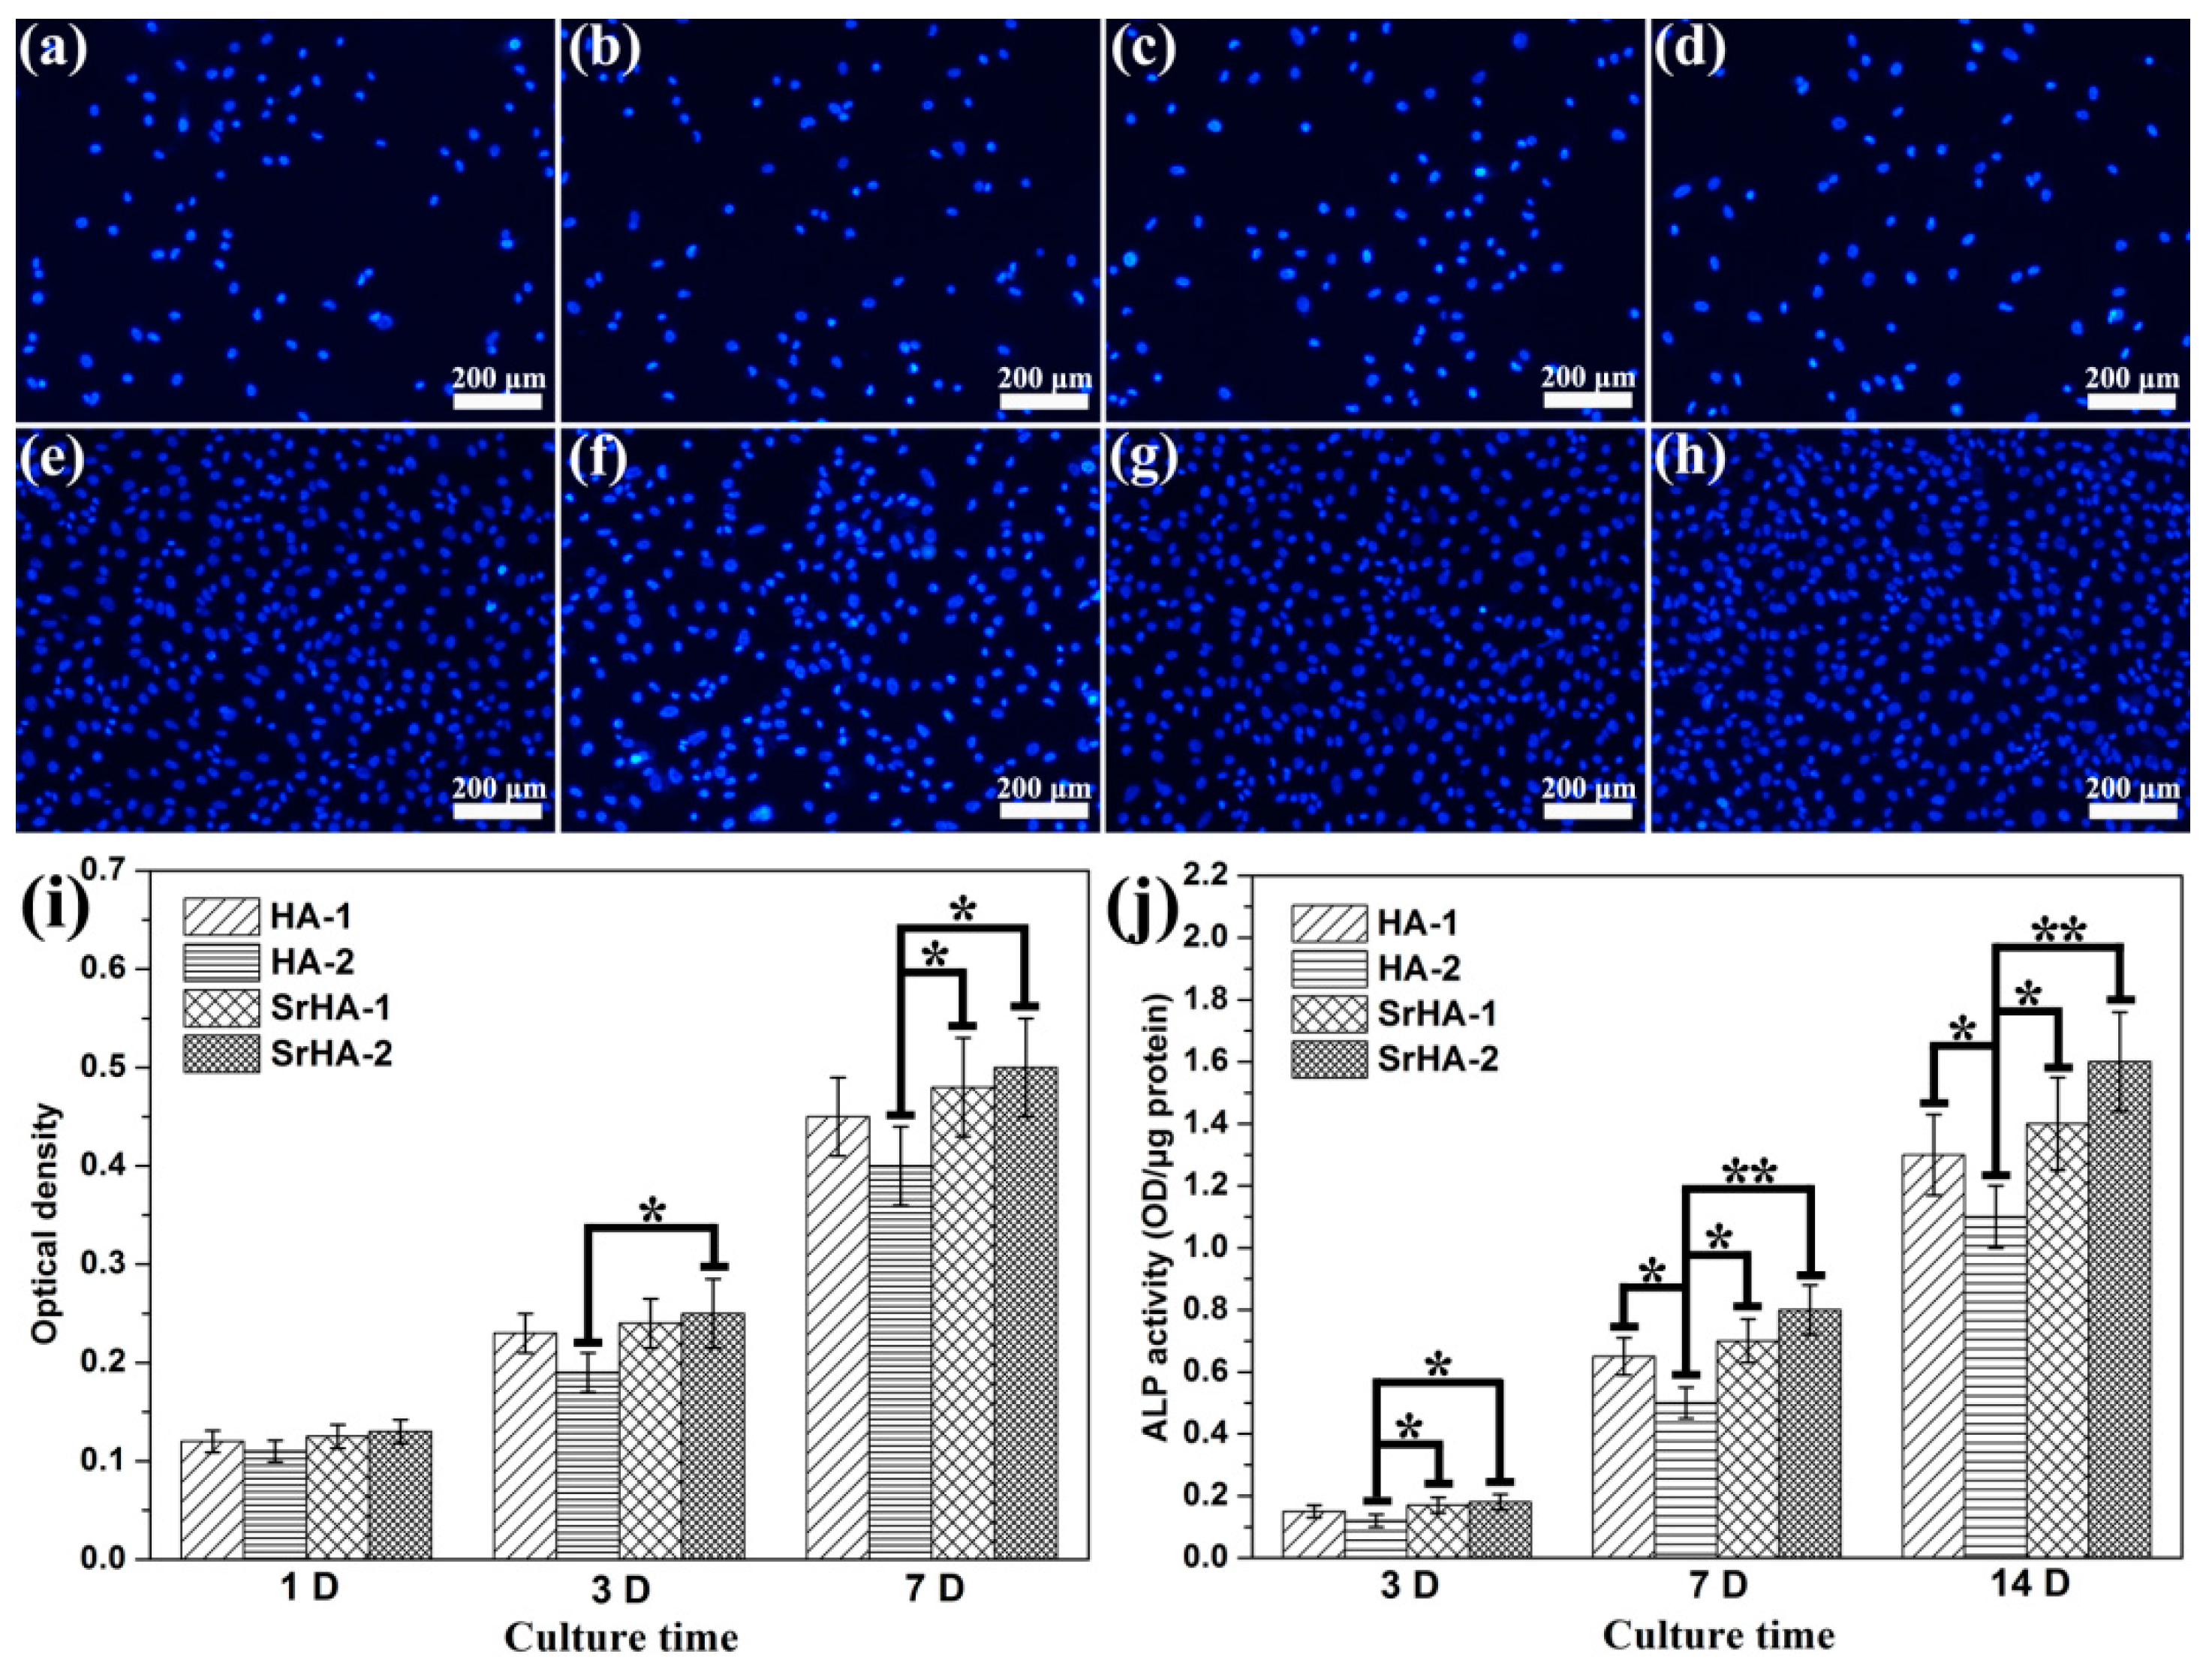
2.3. Cell Adhesion, Proliferation, and Alkaline Phosphatase Activity

Cell adhesion and distribution after one and three days of incubation, respectively, are shown in Figure 8a–h. There is no obvious difference between all samples after culturing for one day. However, after three days’ culture, HA-2 had the lowest cell density. This was confirmed by the MTT analysis (Figure 8i). After three or seven days’ culturing, the cell proliferation on SrHA-2 was significantly higher than that of HA-2. The results from the ALP activity test indicate that MG63 cells cultured on the HA-2 samples have a significantly lower ALP activity than that of other samples (Figure 8j). Moreover, MG63 cells cultured on the SrHA-2 samples show higher ALP activity than those on HA-1 and SrHA-1 (not significant).

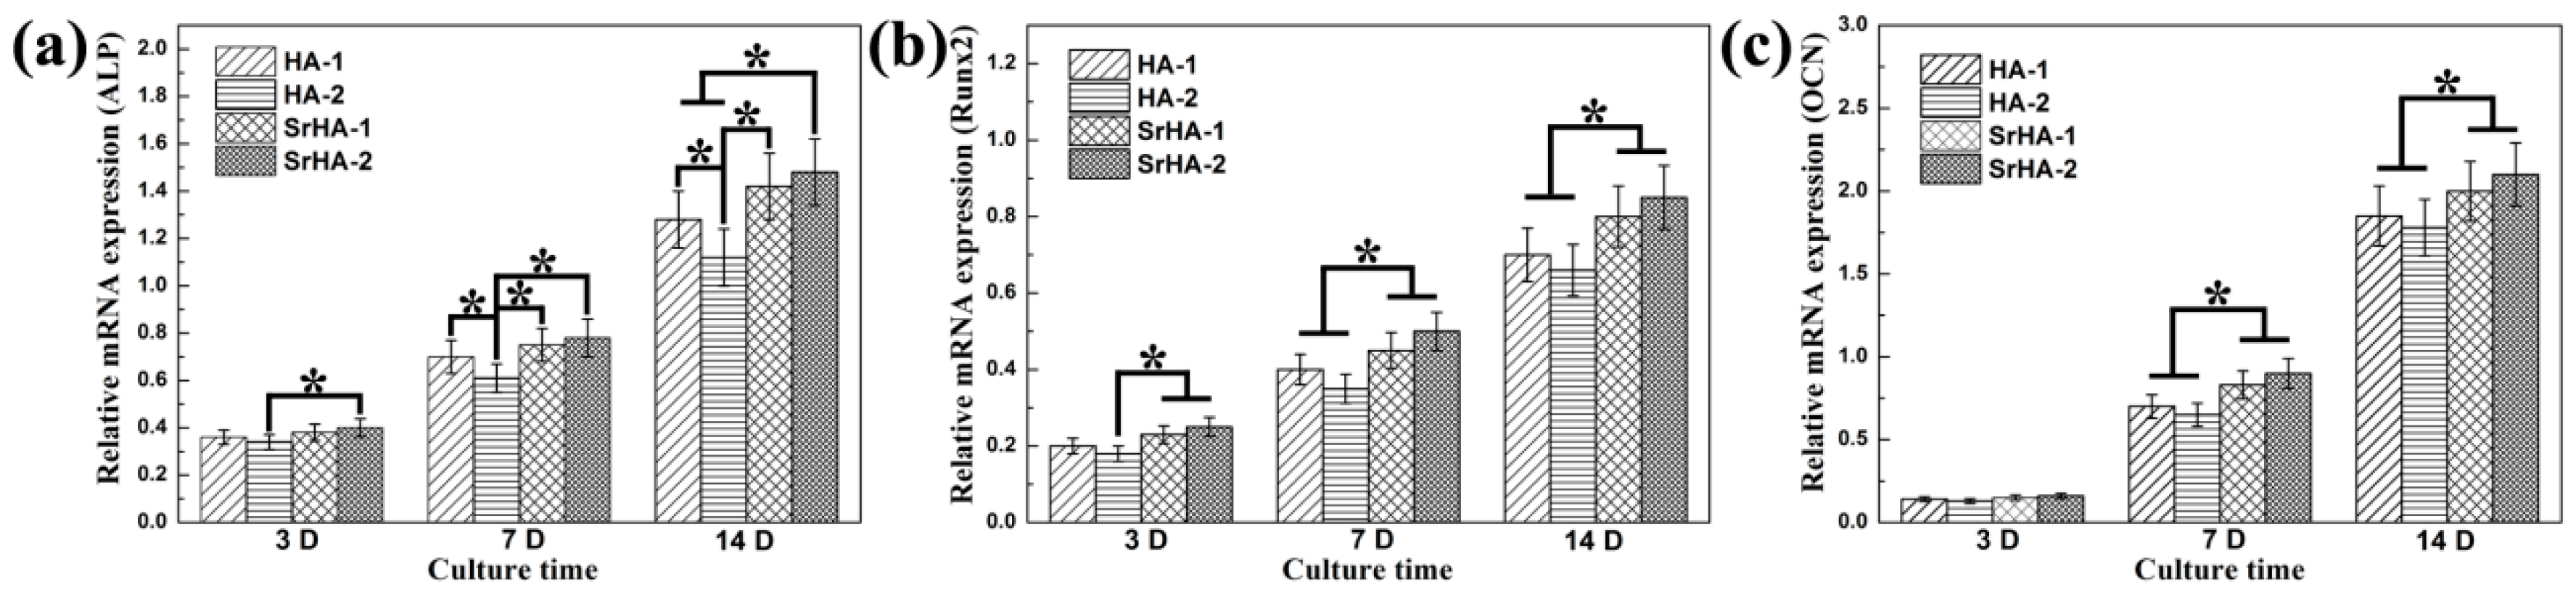
2.4. Osteogenesis-Related Gene Expressions

The expressions of osteogenesis-related genes, including ALP, Runx2, and OCN, in cells cultured on different samples for three, seven, and 14 days are quantified by real-time PCR and the results are shown in Figure 9a–c. The gene expressions of ALP, Runx2, and OCN on SrHA-2 are the highest among the four groups at any time point. Meanwhile, the gene expressions of ALP, Runx2, and OCN on HA-2 are lower than those of HA-1 (not significant except for ALP). In addition, the gene expressions on SrHA are higher than those on HA.

3. Discussion

In this study, four different nanosized HA and SrHA were prepared. The results showed that the aspect ratio of the HA prepared by Ca(NO3)2 was lower than that prepared by CaCl2. It has been proven that using complexing agents or surfactants can arrest HA crystal growth [30]. Here, it seems that the a-plane growth of the HA is inhibited by Cl, whereas the c-plane is inhibited by NO3. In addition, SrHA nanorods greater than 100 nm in length were prepared by furnace cooling (providing enough time for crystal growth).
The in vitro experiment showed that the biological performance of SrHA-2 (larger than 100 nm) is slightly better than that of SrHA-1 (but not significantly so). As is well known, SrHA possesses good biocompatibility. However, it would cause cytotoxicity after phagocytosis if the particle size was too small [31]. In the present study, SrHA-2 exhibited the largest size, which might make it unsuitable for filtrating cell membranes, thus, showing a better biological performance than that of SrHA-1. Meanwhile, SrHA-1 exhibited better cell proliferation and differentiation than HA-2. In this study, there were two main factors that might affect the biological performance: particle size and releasing ions. Due to the particle size of HA-2 being similar to that of SrHA-1, the difference could be attributed to the releasing ions of HA-2 and SrHA-1. The SrHA exhibited better cell proliferation and differentiation than HA, which could mainly be attributed to the release of Sr2+. Xin et al. found that nanotube arrays incorporated with Sr (without destroying the structure) could improve the biocompatibility and bioactivity [32]. In addition, HA-1 showed better bioactivity than HA-2. This can be explained in two ways. Firstly, the aspect ratio of HA-1 was lower than that of HA-2, which meant that HA-1 is close to spherical in shape. Zhao et al. found that sphere-like nano-HA was beneficial for filopodia protrusion, showing more favorable properties than rod-like HA for osteoblasts [33]. For another, HA-2 showed the fastest releasing rate of all samples, which could be attributed to its high specific surface area [34]. HA dissolving would release calcium ions into the cytoplasm. The proper Ca2+ concentrations favored osteoblast proliferation and differentiation [35]. However, increased Ca2+ concentrations might trigger apoptosis in osteoblasts [31,36]. Although there is no significant difference between HA-1 and HA-2 at the later stages, the biological differences caused by the nano-scale dimensions should be considered before clinical applications are attempted.
The current study evaluated the biological performance of nanostructured HA and SrHA with subtle differences in dimensions. The observations showed some evidence for the choice of apatite for orthopedic implant coating. However, there are some limitations and shortcomings that should be addressed in the future. Firstly, some minor soluble phases probably formed, such as brushite (being more soluble than HA), which might affect the Ca2+ ions’ release and thus the cell experimental results. Secondly, in this study, dopamine hydrochloride was used (as a binding agent) to fabricate the Ti-based HAP coatings. Hence, the coatings contained Cl and C, as shown in the EDS spectra (Figure 6). The existence of Cl and C might influence the biological performance of the coatings. Thirdly, as is well known, nanosized particles were prone to conglomerate, which might partly interfere with the experimental results. The cytocompatibility was evaluated by an MTT test with MG63, which is an osteosarcoma cell line. The results might be more convincing if some other osteblastic and stem cell lines were chosen and compared. Furthermore, the expressions of some osteogenic genes were determined by RT-PCR, which reflected changes in them at the RNA level. It would be much better if quantitative real-time PCR was applied or Western blot was performed to quantify the related genes at the protein level. Further study is needed to explore the mechanism of nanosized ceramics’ functions on cellular behavior.

4. Experimental

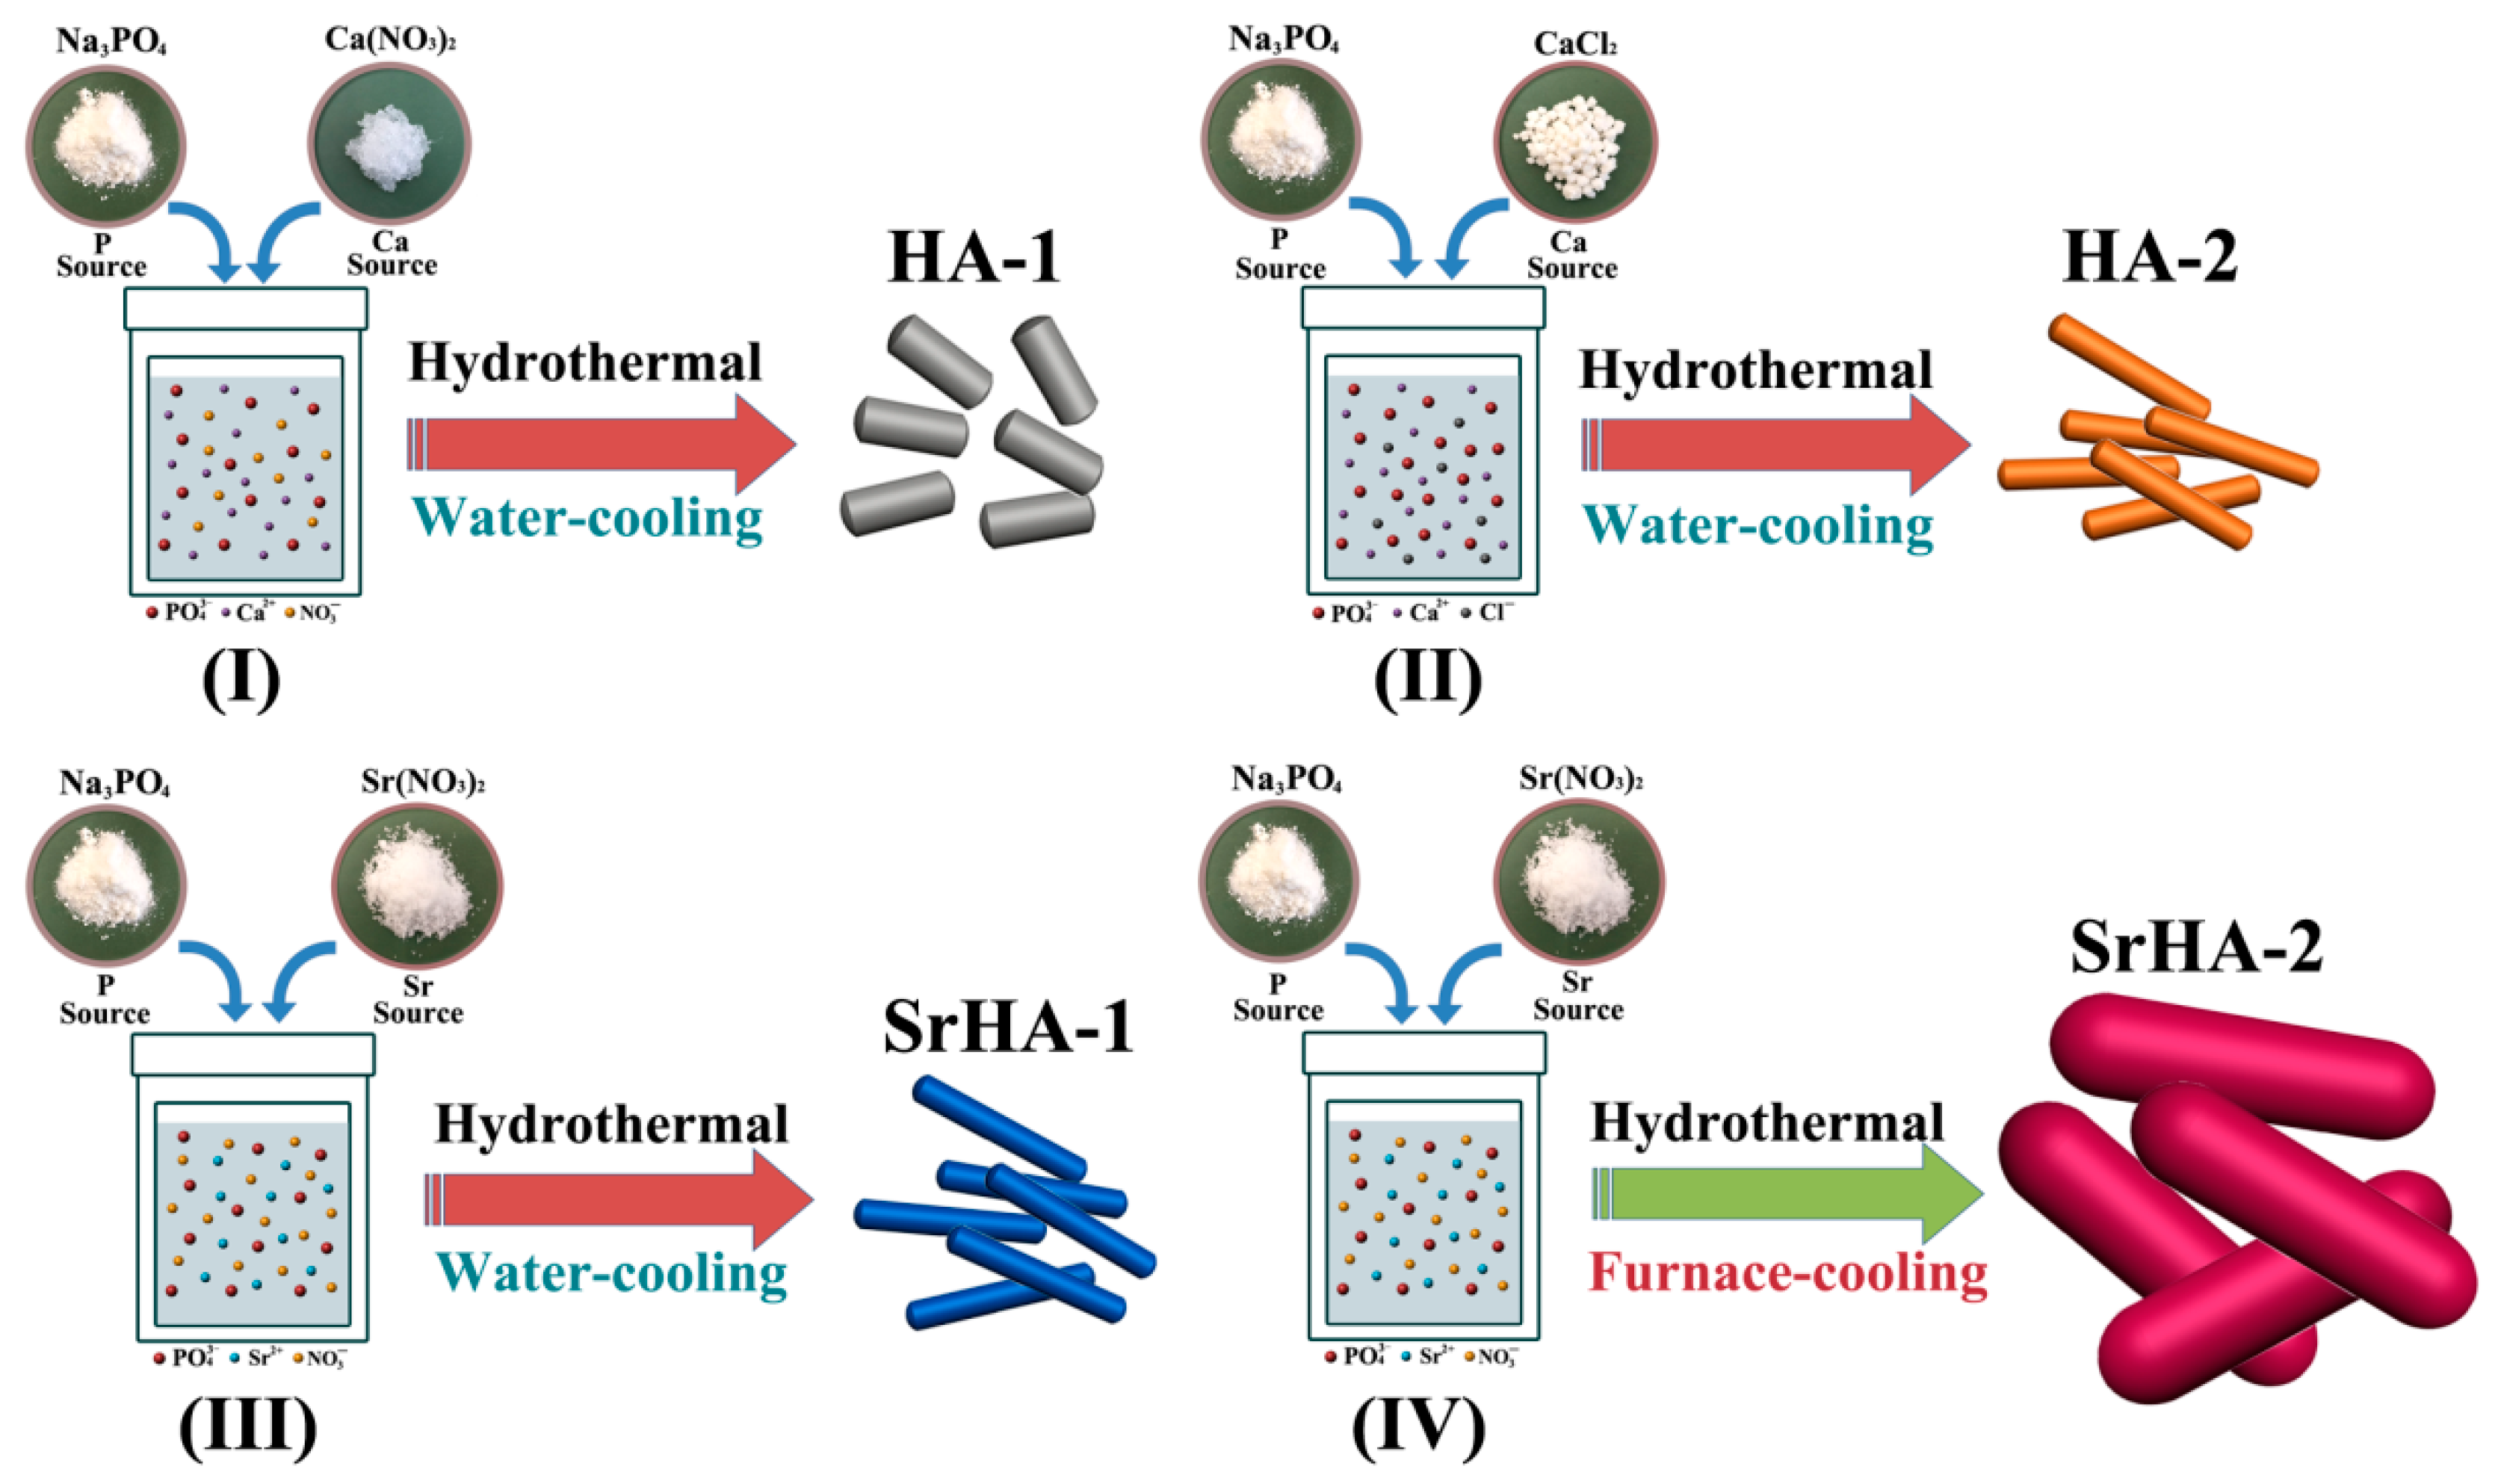
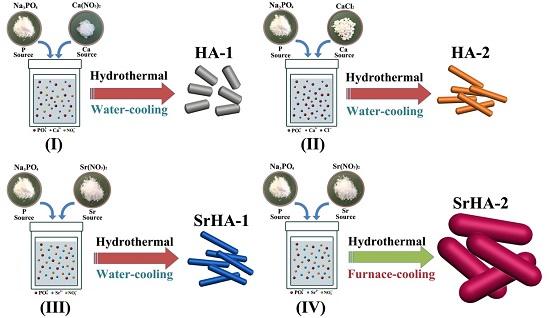
4.1. Preparation of Samples

All the samples were synthesized by a one-step hydrothermal method, as previously reported [37]. For sample HA-1, Ca(NO3)2 and Na3PO4 with a molar ratio of 10:6 were each dissolved in 80 mL of deionized water. Then, the Ca(NO3)2 solution was added dropwise into the Na3PO4 solution. After vigorous agitation for 10 min, the suspension was hydrothermally treated at 150 °C for 5 h and then water-cooled. For sample HA-2, the procedure was the same as for sample HA-1, but the Ca(NO3)2 was replaced by CaCl2. For sample SrHA-1, Ca(NO3)2 was replaced by Sr(NO3)2. For sample SrHA-2, Ca(NO3)2 was replaced by Sr(NO3)2 and water-cooling was replaced by furnace cooling. The precipitates were washed with deionized water and dehydrated absolute ethanol twice. Then, the product was placed in an oven and heated at 80 °C for 24 h for drying. Subsequently, the dried powder was manually ground with a corundum mortar (Scheme 1).

4.2. Characterization of the Samples

Phase analysis of the synthesized powders was conducted via X-ray powder diffraction (XRD) and X-ray photoelectron spectroscopy (XPS). The XRD patterns were provided by a Bruker D8 ADVANCE X-ray diffractometer (Karlsruhe, Baden-Württemberg, Germany) equipped with graphite-monochromatized Kα radiation (λ = 1.5418 Å). The diffractometer was operated at 40.0 kV and 30.0 mA with a 2θ range of 10–90° (step size, 0.02) and exposure of 50 s.
The crystallinity degree Xc, corresponding to the fraction of crystalline phase present in the examined volume, was evaluated by Equation (1) [38]:
X c     1     ( V 112 / 300 / I 300 )
where I300 is the intensity of (300) reflection and V112/300 is the intensity of the hollow between (112) and (300) reflections, which completely disappears in non-crystalline samples.
In order to examine the functional groups of the obtained powder, infrared spectra of all samples were obtained using an infrared Fourier-transform spectrometer (FT-IR, Bruker TENSOR 27, Karlsruhe, Germany) in the range of 4000–400 cm−1. The powder was ground with KBr to the proportion of 1/150 (by weight) and pressed to a wafer of 13 mm diameter using a hand press.
The powder morphology was observed via scanning and transmission electron microscopy (SEM; TEM). An accelerating voltage of 5 kV was chosen for SEM analysis and the micrographs were captured using secondary electrons collected with an in-lens detector. TEM images were acquired using a JEM-2100F microscope (Akishima, Tokyo, Japan) at 200 kV. High-resolution imaging (HRTEM) and selected-area electron diffraction (SAED) patterns were obtained.
The specific surface area of powders (m2/g) was determined by the Brunauer–Emmett–Teller (BET) method using a Surface Area Analyzer (TriStar 3000, Micromeretics, Norcross, GA, USA) after pre-preparation of samples by heating at 200 °C in a stream of N2 in excess of 24 h.
The dimensions of the synthesized particles, including long axis, short axis, and aspect ratio, were obtained by manual measurement of a representative sample (n > 500) by TEM.

4.3. Cell Experiments

4.3.1. Preparation of HA Coatings on Titanium

Dopamine-assisted immobilization of the synthesized samples onto Ti substrates was carried out, as reported previously [39]. In brief, 3-Hydroxytyramine hydrochloride (dopamine hydrochloride, Sigma Aldrich, Saint Louis, MO, USA) was dissolved in 10 mM Tris buffer (pH 8.5) to 2 mg/mL, while each sample was suspended in the same buffer to 2 mg/mL. Then, the two solutions were mixed (1:1) and 100 µL of the mixture was dropped onto polished Ti plates (10 mm × 10 mm × 1 mm) for 12 h. These modified Ti plates with HA and SrHA coatings were used for cell culture.

4.3.2. Ca2+ and Sr2+ Release

To examine the release behavior of Ca2+ and Sr2+ from the coatings, each specimen was immersed in 10 mL of phosphate-buffered saline (PBS) at 37 °C. The solution was refreshed at each time point for seven days. The PBS containing the released Ca2+ and Sr2+ was analyzed via inductively coupled plasma mass spectroscopy (ICP, VISTA-MPX).

4.3.3. Cell Seeding and Culture Conditions

All the samples (the aforementioned Ti plates) used in the cell culture experiments were first sterilized in an autoclave (at 121 °C for 1 h) and then inserted into 12-well polystyrene cell culture plates (TPP, Trasadingen, Switzerland; internal well diameter: 22.0 mm). Then they were seeded with human osteoblast-like MG 63 cells (European Collection of Cell Cultures, Salisbury, UK) and suspended in Dulbecco’s modified Eagle's minimum essential medium (DMEM; Sigma Aldrich, Cat. N° D5648) with 10% fetal bovine serum (FBS; Sebak GmbH, Aidenbach, Germany) and gentamicin (40 µg/mL, LEK, Ljubljana, Slovenia). Each well contained 36,000 cells (i.e., approximately 10,000 cells/cm2) and 2 mL of the medium. The cells were cultured for one, three, or seven days at 37 °C in a humidified air atmosphere containing 5% CO2.

4.3.4. Cell Distribution and Proliferation

MTT assay was performed to estimate the cell proliferation. MG-63 cells were seeded in a 12-well plate and incubated for one, three, or seven days. After the selected incubation periods, the samples were washed with phosphate-buffered saline (PBS) and transferred to a new 12-well plate. Then, 300 µL of the culture medium and 300 µL of MTT (3-[4,5-dimethylthiazol-3-yl]-2,5-diphenyl tetrazolium Bromide) reagent (5 mg/mL in PBS, Sigma Aldrich) were added to each well. After 4 h of incubation in a 5% CO2 incubator at 37 °C, the medium was replaced with 500 µL of dimethyl sulfoxide to dissolve formazan. The plate was shaken for 10 min, and then the solution in each well was transferred to a 96-well ELISA plate. The optical density (OD) of the dissolved solute was measured using an ELISA reader (Tecan, Salzburg, Austria) at 570 nm (n = 9 in each group). The common OD value of the blank group (n = 9) was subtracted from the OD value of each group at each time point. The blank group was treated with the same procedures and incubated for the same time as the above groups.
Representative fluorescence microscopy images of the MG63 cells were obtained to evaluate the cell adhesion and distribution. After seeding for one and three days, the samples were rinsed with PBS (Sigma Aldrich) and stained with Hoechst #33342, which stains the cell nuclei (excitation max., 346 nm; emission max., 460 nm; Sigma Aldrich; 5 µg/mL of PBS). This dye was applied for 2 h at room temperature. The microscopy images were acquired using an IX-51 microscope equipped with a digital camera (DP-70, Olympus, Tokyo, Japan).

4.3.5. Alkaline Phosphatase Activity

MG-63 cells were seeded in a 12-well plate (approximately 10000 cells/cm2) with 1 mL of the biomaterial extracts containing 10% fetal bovine serum. After culturing for three, seven, or 14 days, the cultural medium was carefully removed and the plates were gently washed twice with PBS. Then, 500 µL of 0.2% (v/v) Triton X-100 (Sigma Aldrich) was added to each well. After lysis in a 5% CO2 incubator for 2 h, the solutions were transferred to a micro-centrifuge tube and frozen at −80 °C for 2 h. Three freeze–thaw cycles were completed to homogenize the solutions. Then, 3 mL of Coomassie Brilliant Blue staining solution, 0.6 mL of cell lysis solution, and 0.4 mL of double distilled water were mixed and allowed to stand for 10 min. The OD value of the mixed solution was measured using an ELISA reader (Tecan, Salzburg, Austria) at 595 nm. The protein concentration of the cell lysis solution was calculated on the basis of a standard curve obtained using bovine serum albumin as a standard. Then, 100 µL of the cell lysis solution and 100 µL of 25 µg/mL p-nitrophenyl phosphate disodium salt (PNPP) were added into each well of a 96-well plate (eight wells in each group). After 30 min, 50 µL of 3 mol/L NaOH was added to terminate the reaction. In the blank group, 100 µL of 0.2% (v/v) Triton X-100, 100 µL of 25 µg/mL PNPP, and 50 µL of 3 mol/L NaOH were added. The OD values were measured at 405 nm. The OD per milligram of protein was calculated.

4.3.6. Osteogenesis-Related Gene Expression

The expressions of osteogenesis-related genes were evaluated on the basis of a real-time polymerase chain reaction (real-time PCR). The cells were seeded with 2 × 10⁴ cells/well and cultured for three, seven, or 14 days. The total RNA was isolated using the TRIzol reagent (Gibco). Here, 1 mg RNA from each sample was reverse transcribed into complementary DNA (cDNA) using the PrimeScript™ RT reagent kit (TaKaRa). The forward and reverse primers for the selected genes were the same as those described in [40]. The expressions of osteogenesis-related genes, including ALP, runt-related transcription factor 2 (Runx2), and osteocalcin (OCN), were quantified on the basis of real-time PCR (Bio-Rad iQ™5 multicolor real-time PCR detection system, Hercules, CA, USA) with SYBR® Premix Ex™ Taq II (TaKaRa, Dalian, China). Data analysis was carried out using the iQ™5 optical system software version 2.0 (Bio-Rad). The relative expression levels for each gene of interest were normalized to the level of the housekeeping gene GAPDH.

4.4. Statistical Analysis

At least three samples were employed for each analysis. All data were statistically analyzed using one-way ANOVA and Tukey’s post hoc comparison to evaluate statistically significant differences between the sample groups. The quantitative data was presented as mean ± standard deviation (SD). The value p ≤ 0.05 was considered significant. Dedicated software such as DigitalMicrograph 365 (for PC) (Gatan, Inc., Pleasanton, CA, USA) and MicroCall Origin (Pleasanton, CA, USA) were employed for image processing and mathematical data computation.

5. Conclusions

In this study, nanosized HA and SrHA with different dimensions were synthesized and their biological performance on osteoblast-like cells was evaluated. Our results demonstrate that nanosized HA and SrHA with subtle differences could affect the cellular growth. This work provides a view of the role of nano-HAs as ideal biocompatible materials in future clinical applications.

Acknowledgments

This work was financially supported by the National Natural Science Foundation of China (Grant No. 31370970), and the Tianjin Research Program of Application Foundation and Advanced Technology (Grant Nos. 13JCZDJC33300, and 14JCQNJC03100).

Author Contributions

Xianjin Yang and Zhenduo Cui designed experiments; Zhen Geng and Qin Yuan carried out experiments; Yanqin Liang and Xue Li analyzed experimental results. Shengli Zhu, Yunde Liu, Huijing Bao and Qianyu Huo analyzed data and developed analysis tools. Zhen Geng, Zhaoyang Li and Xianglong Zhuo wrote the manuscript.

Conflicts of Interest

The authors declare no conflict of interest.

References

  1. Lv, Q.; Nair, L.; Laurencin, C.T. Fabrication, characterization, and in vitro evaluation of poly(lactic acid glycolic acid)/nano-hydroxyapatite composite microsphere-based scaffolds for bone tissue engineering in rotating bioreactors. J. Biomed. Mater. Res. 2009, 91, 679–691. [Google Scholar] [CrossRef] [PubMed]
  2. Trombelli, L.; Simonelli, A.; Pramstraller, M.; Wikesjö, U.M.E.; Farina, R. Single flap approach with and without guided tissue regeneration and a hydroxyapatite biomaterial in the management of intraosseous periodontal defects. J. Periodontol. 2010, 81, 1256–1263. [Google Scholar] [CrossRef] [PubMed]
  3. Blackwood, D.; Seah, K. Electrochemical cathodic deposition of hydroxyapatite: improvements in adhesion and crystallinity. Mater. Sci. Eng. C 2009, 29, 1233–1238. [Google Scholar] [CrossRef]
  4. Liu, F.W.; Sun, B.; Jiang, X.Z.; Aldeyab, S.S.; Zhang, Q.H.; Zhu, M.F. Mechanical properties of dental resin/composite containing urchin-like hydroxyapatite. Dent. Mater. 2014, 30, 1358–1368. [Google Scholar] [CrossRef] [PubMed]
  5. Makela, K.T.; Eskelinen, A.; Pulkkinen, P.; Paavolainen, P.; Remes, V. Total hip arthroplasty for primary osteoarthritis in patients fifty-five years of age or older. An analysis of the Finnish arthroplasty registry. J. Bone Jt. Surg. Am. 2008, 90, 2160–2170. [Google Scholar] [CrossRef] [PubMed]
  6. Hayakawa, T.; Yoshinari, M.; Kiba, H.; Yamamoto, H.; Nemoto, K.; Jansen, J. Trabecular bone response to surface roughened and calcium phosphate (Ca-P) coated titanium implants. Biomaterials 2002, 23, 1025–1031. [Google Scholar] [CrossRef]
  7. Darimont, G.; Cloots, R.; Heinen, E.; Seidel, L.; Legrand, R. In vivo behaviour of hydroxyapatite coatings on titanium implants: A quantitative study in the rabbit. Biomaterials 2002, 23, 2569–2575. [Google Scholar] [CrossRef]
  8. Vallet-Regí, M.; González-Calbet, J.M. Calcium phosphates as substitution of bone tissues. Prog. Solid State Chem. 2004, 32, 1–31. [Google Scholar] [CrossRef]
  9. Huang, J.; Lin, Y.W.; Fu, X.W.; Best, S.M.; Brooks, R.A.; Rushton, N.; Bonfield, W. Development of nano-sized hydroxyapatite reinforced composites for tissue engineering scaffolds. J. Mater. Sci. Mater. Med. 2007, 18, 2151–2157. [Google Scholar] [CrossRef] [PubMed]
  10. Wu, X.H.; Wu, Z.Y.; Su, J.C.; Yan, Y.G.; Yu, B.Q.; Wei, J.; Zhao, L.M. Nano-hydroxyapatite promotes self-assembly of honeycomb pores in poly(l-lactide) films through breath-figure method and MC3T3-E1 cell functions. RSC Adv. 2015, 5, 6607–6616. [Google Scholar] [CrossRef]
  11. Wang, Y.; Liu, L.; Guo, S. Characterization of biodegradable and cytocompatible nano-hydroxyapatite/polycaprolactone porous scaffolds in degradation in vitro. Polym. Degrad. Stab. 2010, 95, 207–213. [Google Scholar] [CrossRef]
  12. Dorozhkin, S.V. Nanosized and nanocrystalline calcium orthophosphates. Acta Biomater. 2010, 6, 715–734. [Google Scholar] [CrossRef] [PubMed]
  13. Cai, Y.; Liu, Y.; Yan, W.; Hu, Q.; Tao, J.; Zhang, M.; Shi, Z.L.; Tang, R.K. Role of hydroxyapatite nanoparticle size in bone cell proliferation. J. Mater. Chem. 2007, 17, 3780–3787. [Google Scholar] [CrossRef]
  14. Eriksson, M.; Liu, Y.; Hu, J.; Gao, L.; Nygren, M.; Shen, Z. Transparent hydroxyapatite ceramics with nanograin structure prepared by high pressure spark plasma sintering at the minimized sintering temperature. J. Eur. Ceram. Soc. 2011, 31, 1533–1540. [Google Scholar] [CrossRef]
  15. Bianco, A.; Cacciotti, I.; Lombardi, M.; Montanaro, L. Si-substituted hydroxyapatite nanopowders: synthesis, thermal stability and sinterability. Mater. Res. Bull. 2009, 44, 345–354. [Google Scholar] [CrossRef]
  16. Rusu, V.M.; Ng, C.H.; Wilke, M.; Tiersch, B.; Fratzl, P.; Peter, M.G. Size-controlled hydroxyapatite nanoparticles as self-organized organic–inorganic composite materials. Biomaterials 2005, 26, 5414–5426. [Google Scholar] [CrossRef] [PubMed]
  17. Webster, T.J.; Ergun, C.; Doremus, R.H.; Siegel, R.W.; Bizios, R. Enhanced osteoclastlike cell functions on nanophase ceramics. Biomaterials 2001, 22, 1327–1333. [Google Scholar] [CrossRef]
  18. Phillips, M.J.; Darr, J.A.; Luklinska, Z.B.; Rehman, I. Synthesis and characterization of nano-biomaterials with potential osteological applications. J. Mater. Sci. Mater. Med. 2003, 14, 875–882. [Google Scholar] [CrossRef] [PubMed]
  19. Suchanek, W.L.; Byrappa, K.; Shuk, P.; Riman, R.E.; Janas, V.F.; TenHuisen, K.S. Preparation of magnesium-substituted hydroxyapatite powders by the mechanochemical–hydrothermal method. Biomaterials 2004, 25, 4647–4657. [Google Scholar] [CrossRef] [PubMed]
  20. Basha, R.Y.; Sampath, K.T.S.; Doble, M. Design of biocomposite materials for bone tissue regeneration. Mater. Sci. Eng. C 2015, 57, 452–463. [Google Scholar] [CrossRef] [PubMed]
  21. Kuang, G.M.; Yau, W.P.; Lam, W.M.; Wu, J.; Chiu, K.Y.; Lu, W.W.; Pan, H.B. An effective approach by a chelate reaction in optimizing the setting process of strontium-incorporated calcium phosphate bone cement. J. Biomed. Mater. Res. Part B: Appl. Biomater. 2012, 100, 778–787. [Google Scholar] [CrossRef] [PubMed]
  22. Gentleman, E.; Fredholm, Y.C.; Jell, G.; Lotfibakhshaiesh, N.; O’Donnell, M.D.; Hill, R.G.; Stevens, M.M. The effects of strontium-substituted bioactive glasses on osteoblasts and osteoclasts in vitro. Biomaterials 2010, 31, 3949–3956. [Google Scholar] [CrossRef] [PubMed] [Green Version]
  23. Schumacher, M.; Lode, A.; Helth, A.; Gelinsky, M. A novel strontium(II)-modified calcium phosphate bone cement stimulates human-bone-marrow-derived mesenchymal stem cell proliferation and osteogenic differentiation in vitro. Acta Biomater. 2013, 9, 9547–9557. [Google Scholar] [CrossRef] [PubMed]
  24. Braux, J.; Velard, F.; Guillaume, C.; Bouthors, S.; Jallot, E.; Nedelec, J.M.; Maquin, D.L.; Laquerrière, P. A new insight into the dissociating effect of strontium on bone resorption and formation. Acta Biomater. 2011, 7, 2593–2603. [Google Scholar] [CrossRef] [PubMed]
  25. Wong, K.L.; Wong, C.T.; Liu, W.C.; Pan, H.B.; Fong, M.K.; Lam, W.M.; Cheung, W.L.; Tang, W.M.; Chiu, K.Y.; Luk, K.D.K.; et al. Mechanical properties and in vitro response of strontium-containing hydroxyapatite/polyetheretherketone composites. Biomaterials 2009, 30, 3810–3817. [Google Scholar] [CrossRef] [PubMed]
  26. Busse, B.; Jobke, B.; Hahn, M.; Priemel, M.; Niecke, M.; Seitz, S.; Zustin, J.; Semler, J.; Amling, M. Effects of strontium ranelate administration on bisphosphonate-altered hydroxyapatite: Matrix incorporation of strontium is accompanied by changes in mineralization and microstructure. Acta Biomater. 2010, 6, 4513–4521. [Google Scholar] [CrossRef] [PubMed]
  27. Shi, Z.L.; Huang, X.; Cai, Y.R.; Tang, R.K.; Yang, D.S. Size effect of hydroxyapatite nanoparticles on proliferation and apoptosis of osteoblast-like cells. Acta Biomater. 2009, 5, 338–345. [Google Scholar] [CrossRef]
  28. Mohandes, F.; Salavati-Niasari, M. Influence of morphology on the in vitro bioactivity of hydroxyapatite nanostructures prepared by precipitation method. New J. Chem. 2014, 38, 4501–4509. [Google Scholar] [CrossRef]
  29. Mehdi, S.S.; Khorasani, M.T.; Ehsan, D.K.; Jamshidi, A. Synthesis methods for nanosized hydroxyapatite with diverse structures. Acta Biomater. 2013, 9, 7591–7621. [Google Scholar]
  30. Wang, A.; Liu, D.; Yin, H.; Wu, H.; Wada, Y.; Ren, M.; Jiang, T.S.; Cheng, X.N.; Xu, Y.Q. Size-controlled synthesis of hydroxyapatite nanorods by chemical precipitation in the presence of organic modifiers. Mater. Sci. Eng. C 2007, 27, 865–869. [Google Scholar] [CrossRef]
  31. Motskin, M.; Wright, D.M.; Muller, K.; Kyle, N.; Gard, T.G.; Porter, A.E.; Skepper, J.N. Hydroxyapatite nano and microparticles: Correlation of particle properties with cytotoxicity and biostability. Biomaterials 2009, 30, 3307–3317. [Google Scholar] [CrossRef] [PubMed]
  32. Xin, Y.C.; Jiang, J.; Huo, K.F.; Hu, T.; Chu, P.K. Bioactive SrTiO3 Nanotube Arrays: Strontium Delivery Platform on Ti-Based Osteoporotic Bone Implants. ACS Nano 2009, 3, 3228–3234. [Google Scholar] [CrossRef] [PubMed]
  33. Zhao, Y.; Zhang, Y.; Ning, F.; Guo, D.; Xu, Z. Synthesis and cellular biocompatibility of two kinds of HAP with different nanocrystal morphology. J. Biomed. Mater. Res. B 2007, 83, 121–126. [Google Scholar] [CrossRef] [PubMed]
  34. Dong, Z.; Li, Y.; Zou, Q. Degradation and biocompatibility of porous nanohydroxyapatite/polyurethane composite scaffold for bone tissue engineering. Appl. Surf. Sci. 2009, 255, 6087–6091. [Google Scholar] [CrossRef]
  35. Maeno, S.; Niki, Y.; Matsumoto, H.; Morioka, H.; Yatabe, T.; Funayama, A.; Toyama, Y.; Taguchi, T.; Tanaka, J. The effect of calcium ion concentration on osteoblast viability proliferation and differentiation in monolayer and 3D culture. Biomaterials 2005, 26, 4847–4855. [Google Scholar] [CrossRef] [PubMed]
  36. Saunders, R.; Szymczyk, K.H.; Shapiro, I.M.; Adams, C.S. Matrix regulation of skeletal cell apoptosis III: Mechanism of ion pairinduced apoptosis. J. Cell. Biochem. 2007, 100, 703–715. [Google Scholar] [CrossRef] [PubMed]
  37. Geng, Z.; Cui, Z.D.; Li, Z.Y.; Zhu, S.L.; Liang, Y.Q.; Lu, W.W.; Yang, X.J. Synthesis, characterization and the formation mechanism of magnesium- and strontium-substituted hydroxyapatite. J. Mater. Chem. B 2015, 3, 3738–3746. [Google Scholar] [CrossRef]
  38. Landi, E.; Tampieri, A.; Celotti, G.; Sprio, S. Densification behaviour and mechanisms of synthetic hydroxyapatites. J. Eur. Ceram. Soc. 2000, 20, 2377–2387. [Google Scholar] [CrossRef]
  39. Chien, C.Y.; Tsai, W.B. Poly(dopamine)-assisted immobilization of Arg-Gly-Asp peptides, hydroxyapatite, and bone morphogenic protein-2 on titanium to improve the osteogenesis of bone marrow stem cells. ACS Appl. Mater. Inter. 2013, 5, 6975–6983. [Google Scholar] [CrossRef] [PubMed]
  40. Zhao, L.; Mei, S.; Wang, W.; Chu, P.K.; Wu, Z.; Zhang, Y. The role of sterilization in the cytocompatibility of titania nanotubes. Biomaterials 2010, 31, 2055–2063. [Google Scholar] [CrossRef] [PubMed]
Figure 1. X-ray diffraction (XRD) patterns of the prepared samples. SrHAs exhibited sharper diffraction peaks than those of HAs, those indicating a higher crystallinity.
Nanomaterials 07 00038 g001
Figure 2. Fourier-transform infrared spectroscopy (FT-IR) spectra of the prepared powders. The main component of all samples is phosphate. SrHAs showed strengthened carbonate absorption intensity compared to HAs.
Nanomaterials 07 00038 g002
Figure 3. Scanning electron microscopy (SEM) images of the synthesized samples: (a) HA-1; (b) HA-2; (c) SrHA-1; and (d) SrHA-2. SrHA-2 exhibited a nanorod shape and had a larger size than the other three.
Nanomaterials 07 00038 g003
Figure 4. Transmission electron microscopy (TEM) and selected-area electron diffraction (SAED) patterns of the synthesized samples: (a) HA-1; (b) HA-2; (c) SrHA-1; and (d) SrHA-2.
Nanomaterials 07 00038 g004
Figure 5. (a) Length distribution of HA and SrHA; (b) Width distribution of HA and SrHA; (c) Aspect ratio distribution of HA and SrHA.
Nanomaterials 07 00038 g005
Figure 6. SEM morphology of synthesized coatings: (a) HA-1, (b) HA-2, (c) SrHA-1, and (d) SrHA-2. The SrHA-2 coating showed a nanorod morphology (inset), which was different from the other three (nanoparticles).
Nanomaterials 07 00038 g006
Figure 7. Cumulative Ca2+ (red line) and Sr2+ (black line) ion release as a function of time.
Nanomaterials 07 00038 g007
Figure 8. MG63 cell adhesion and distribution after one (ad) or three (eh) days of incubation. (a,e) HA-1, (b,f) HA-2, (c,g) SrHA-1, and (d,h) SrHA-2. (i) MG63 cell proliferation after one, three, and seven days of incubation measured by colorimetric MTT assay. (j) ALP activity of MG63 cells after three, seven, or 14 days of incubation. Statistically significant differences (* p < 0.05, ** p < 0.01).
Nanomaterials 07 00038 g008
Figure 9. Gene expressions of MG63 cells cultured on different samples after incubation for three, seven, or 14 days: (a) ALP; (b) Runx2; (c) OCN. Statistically significant differences (* p < 0.05).
Nanomaterials 07 00038 g009
Scheme 1. Nanostructured hydroxyapatite with different dimensions via different routes.
Nanomaterials 07 00038 sch001
Table 1. Crystallinity and specific surface area of the synthesized samples.
SamplesCrystallinitySpecific Surface Area (m2/g)
HA-155.457 ± 6
HA-235.692 ± 8
SrHA-171.945 ± 5
SrHA-283.738 ± 4

