Preparation and Characterization of Nanoparticles Made from Co-Incubation of SOD and Glucose


 ,
,
Abstract
:
1. Introduction
2. Results
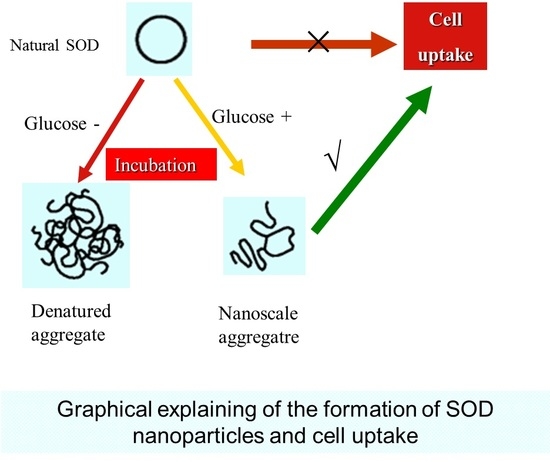
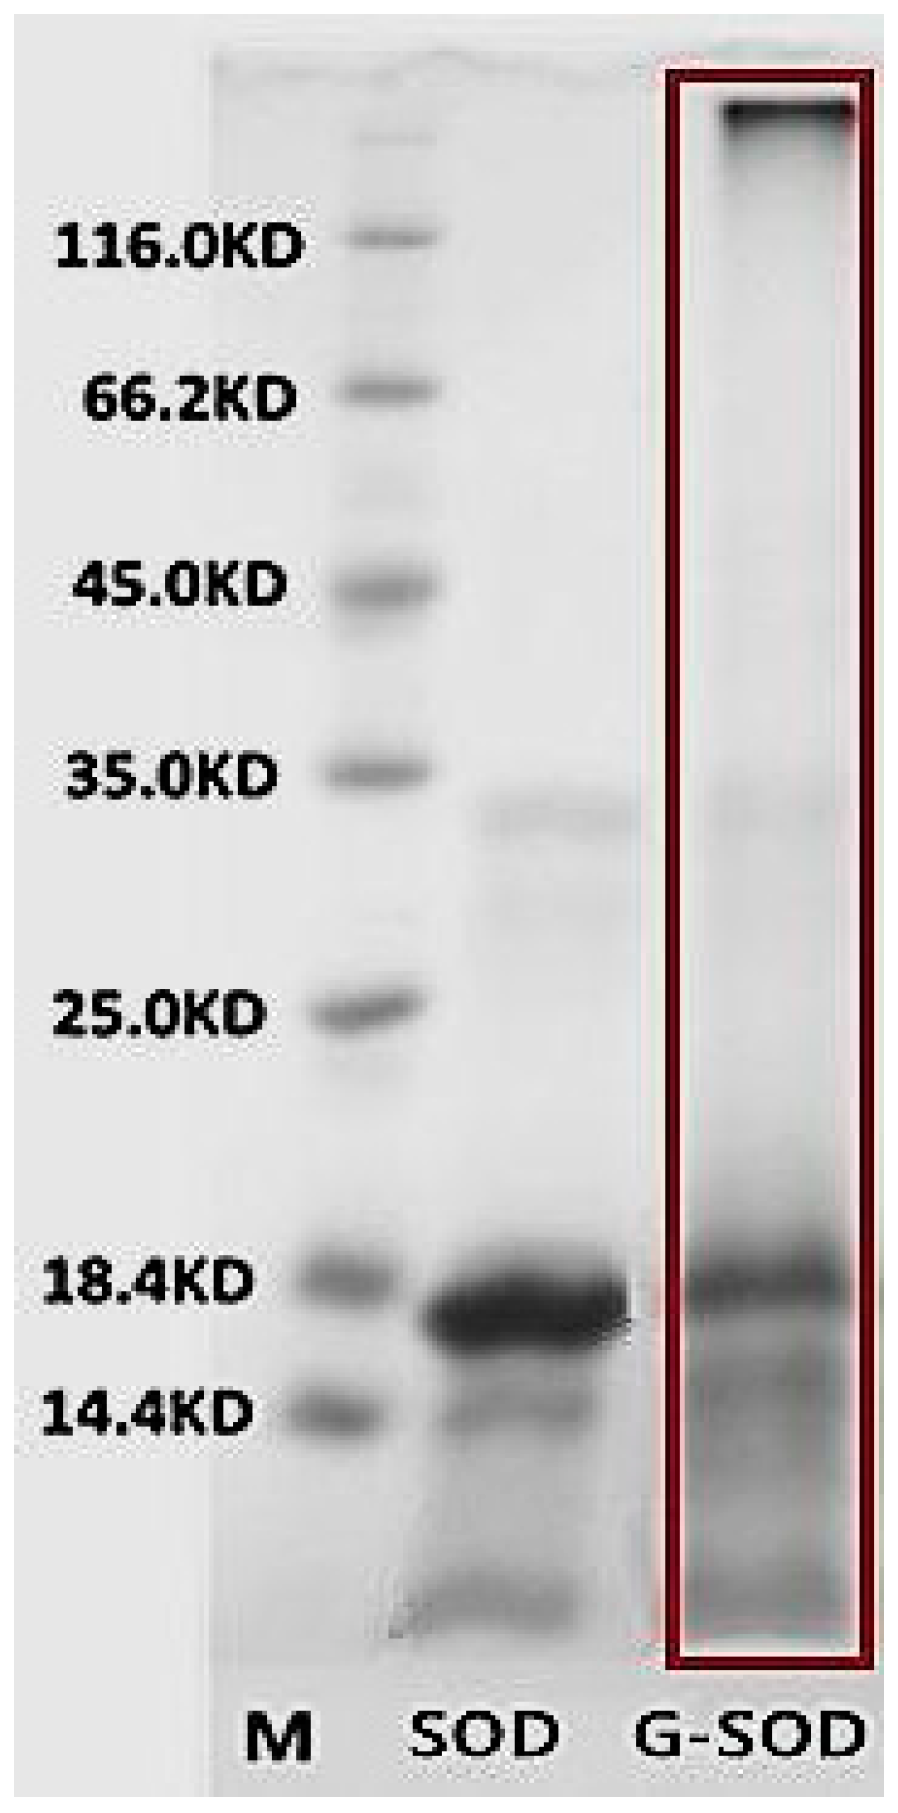
2.1. Confirmation of the Maillard Reaction
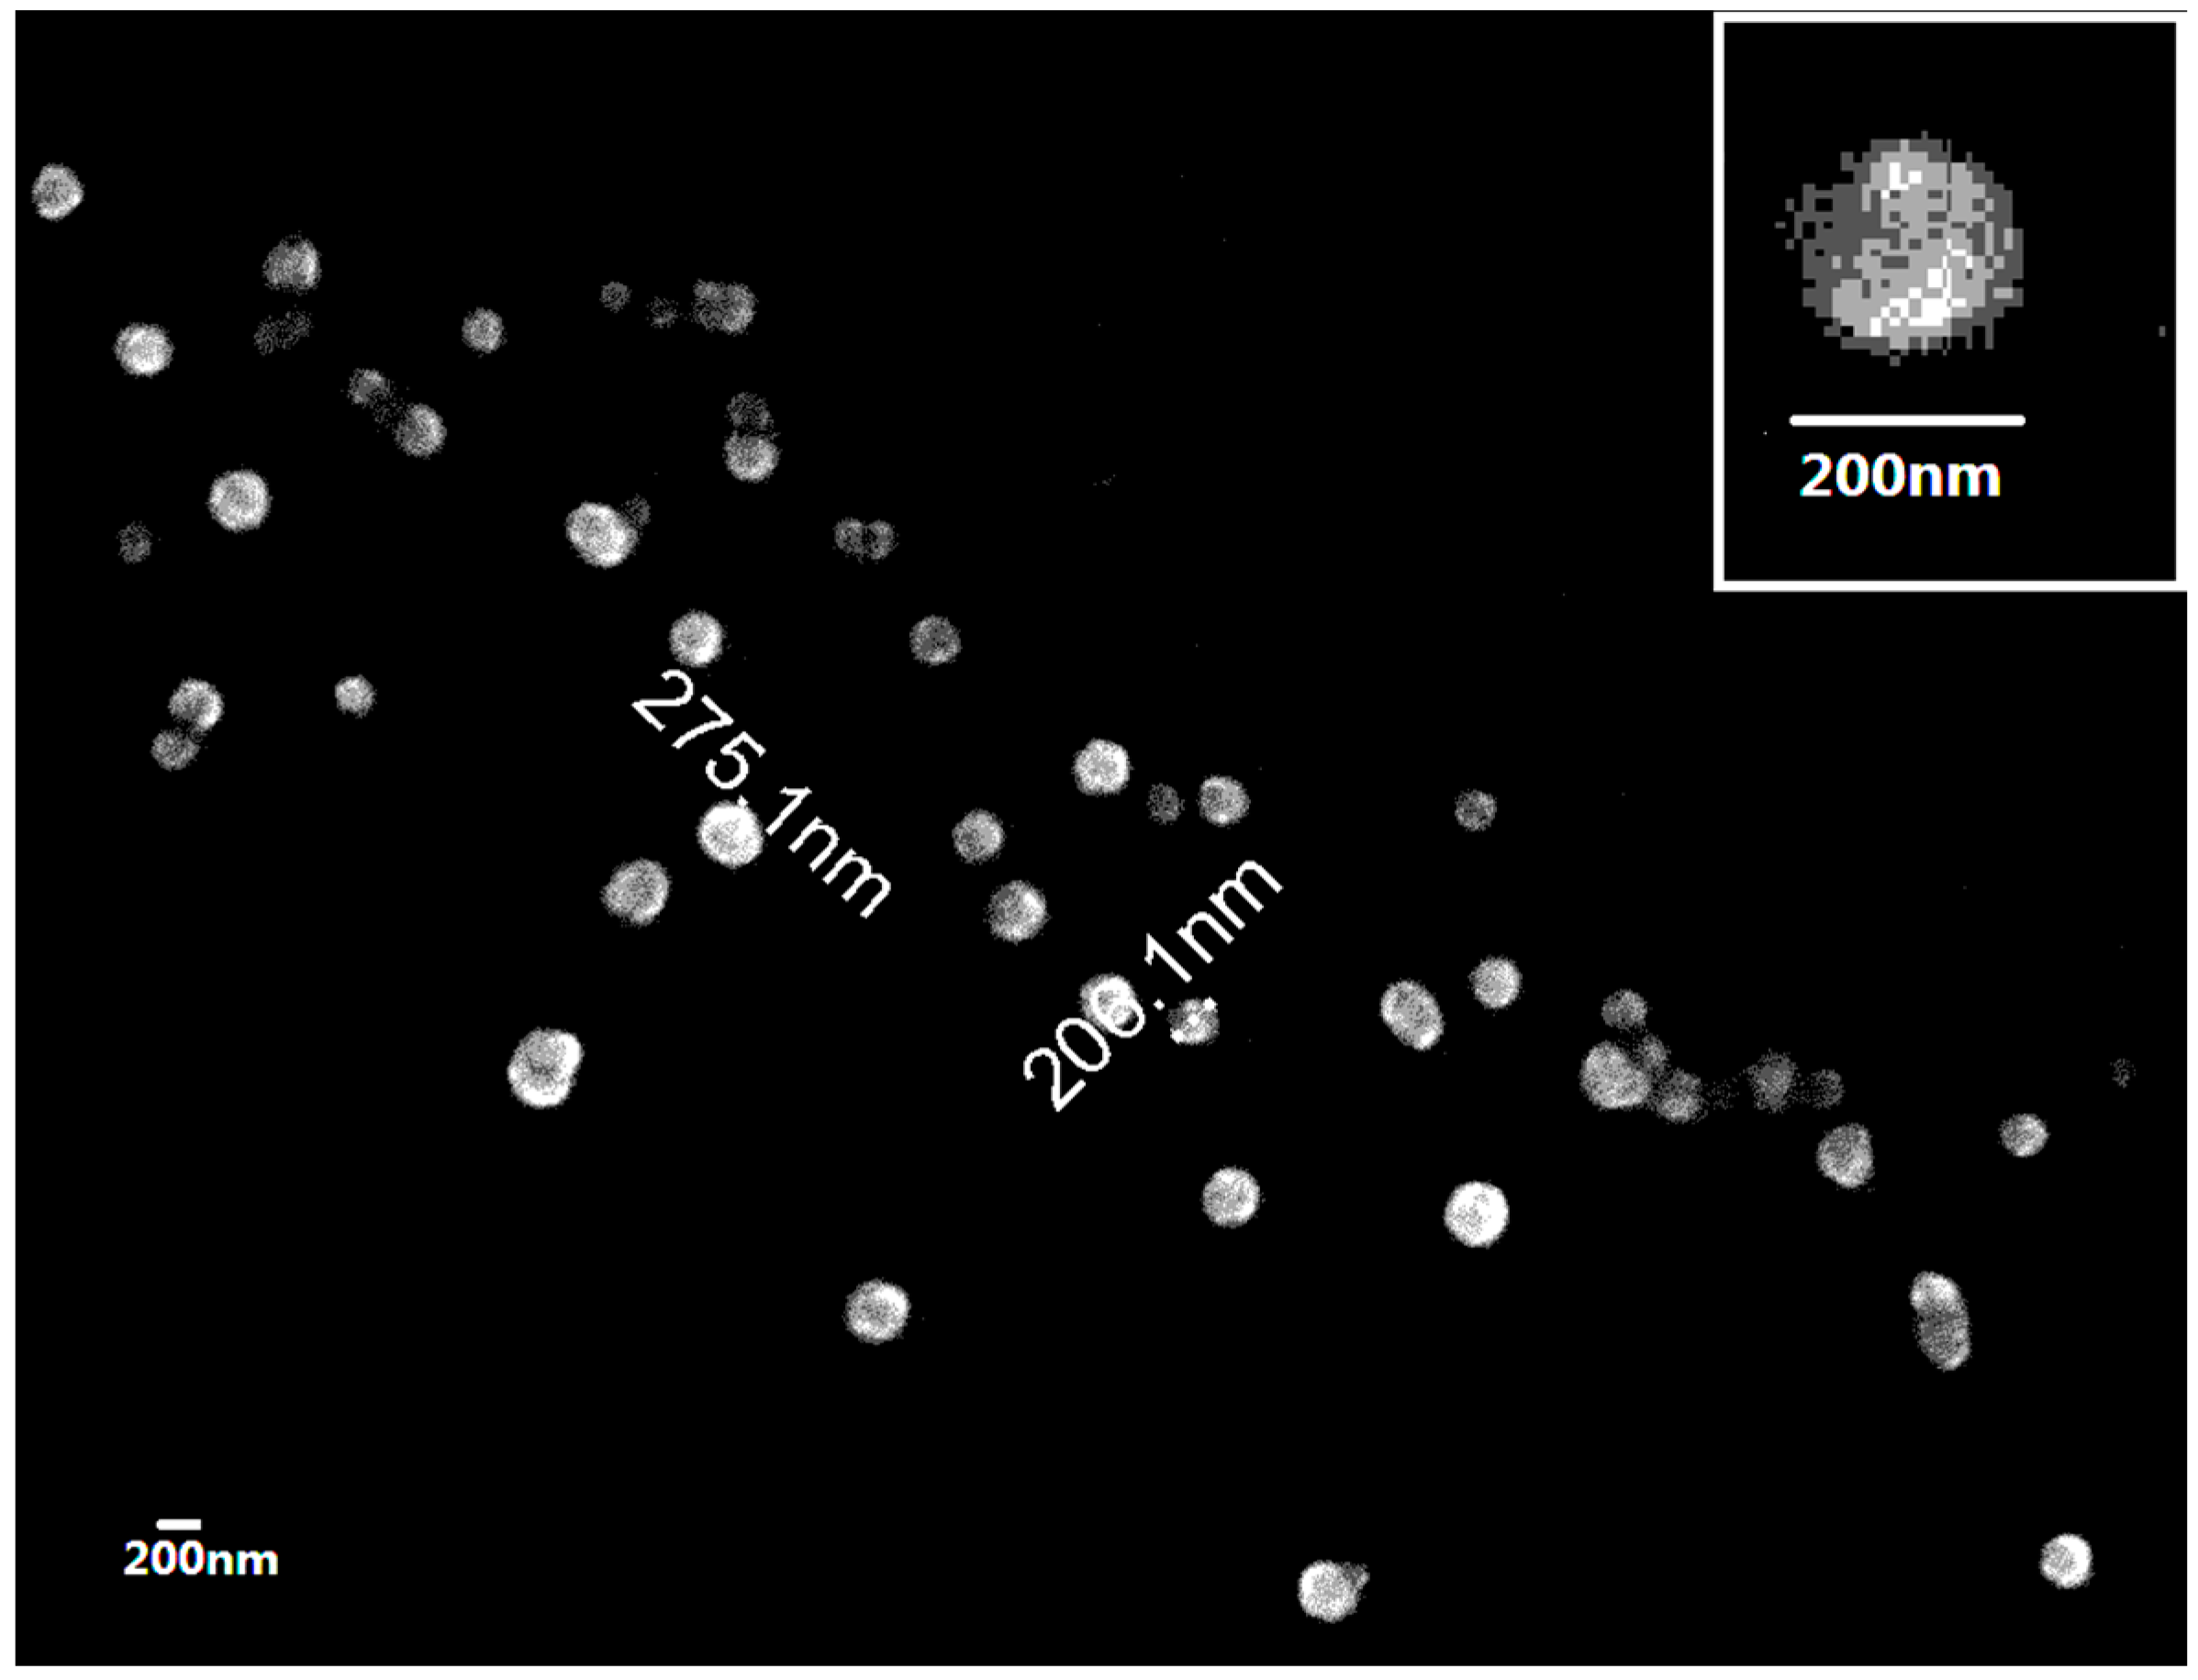
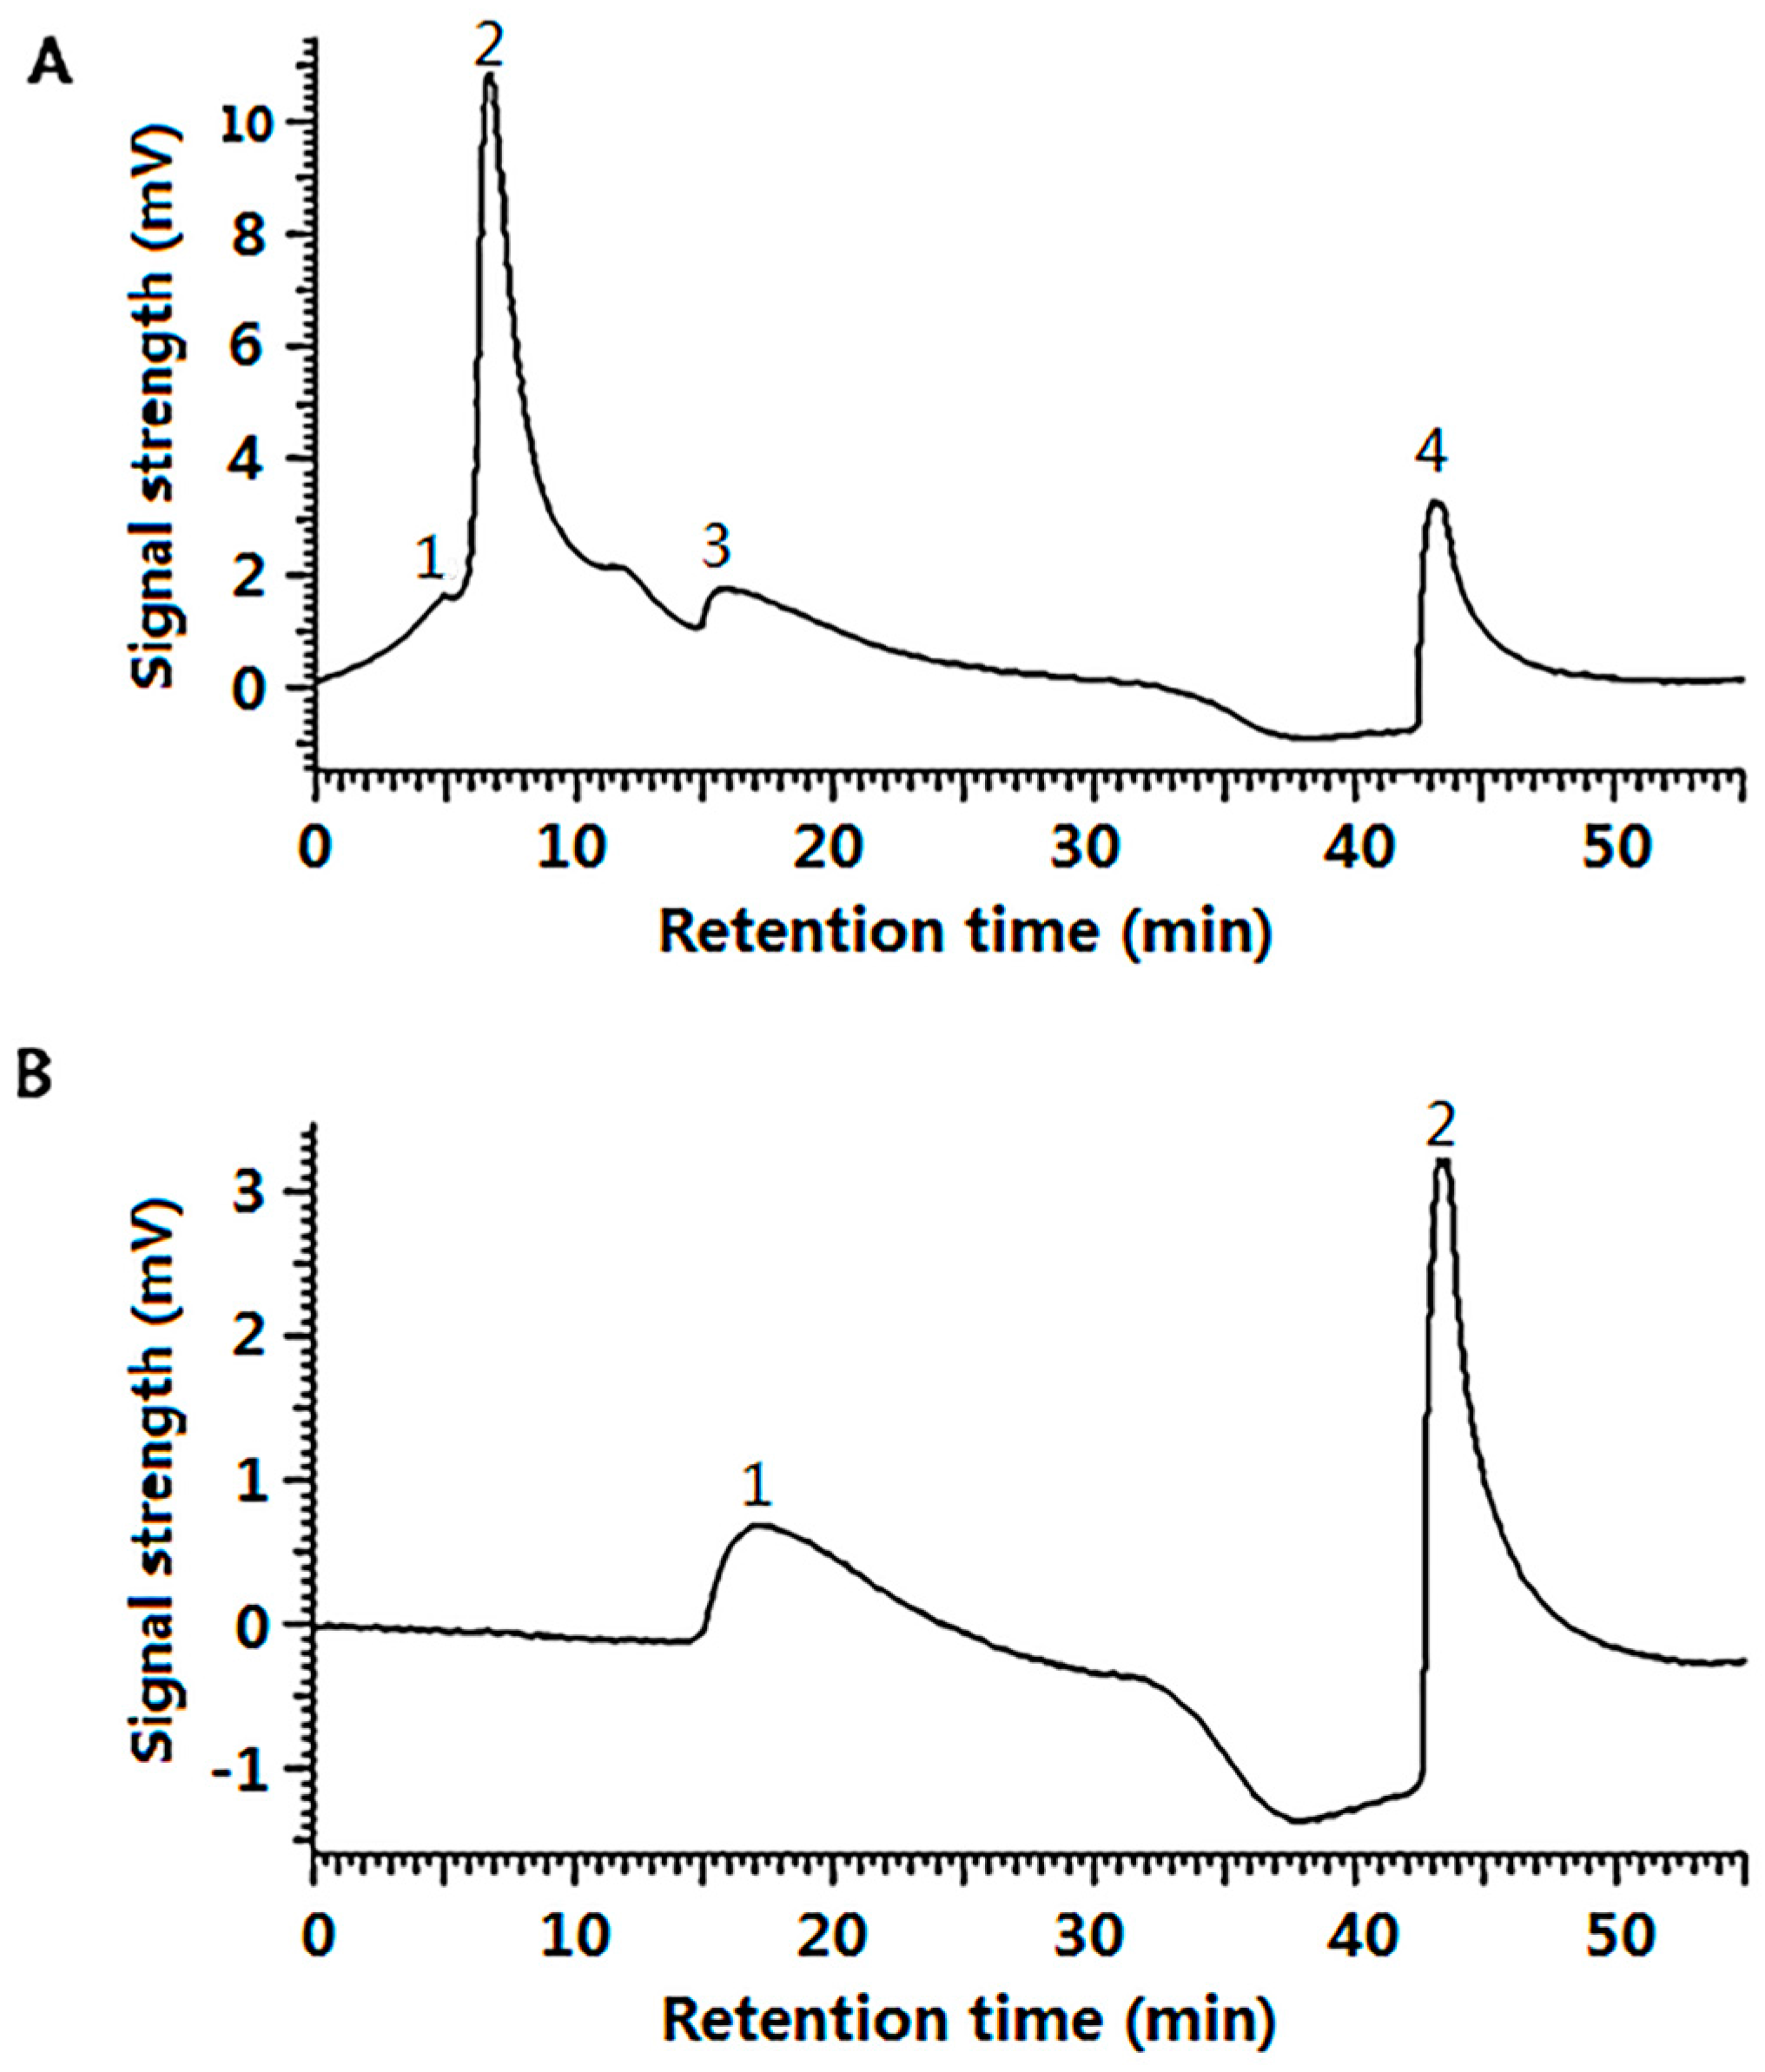
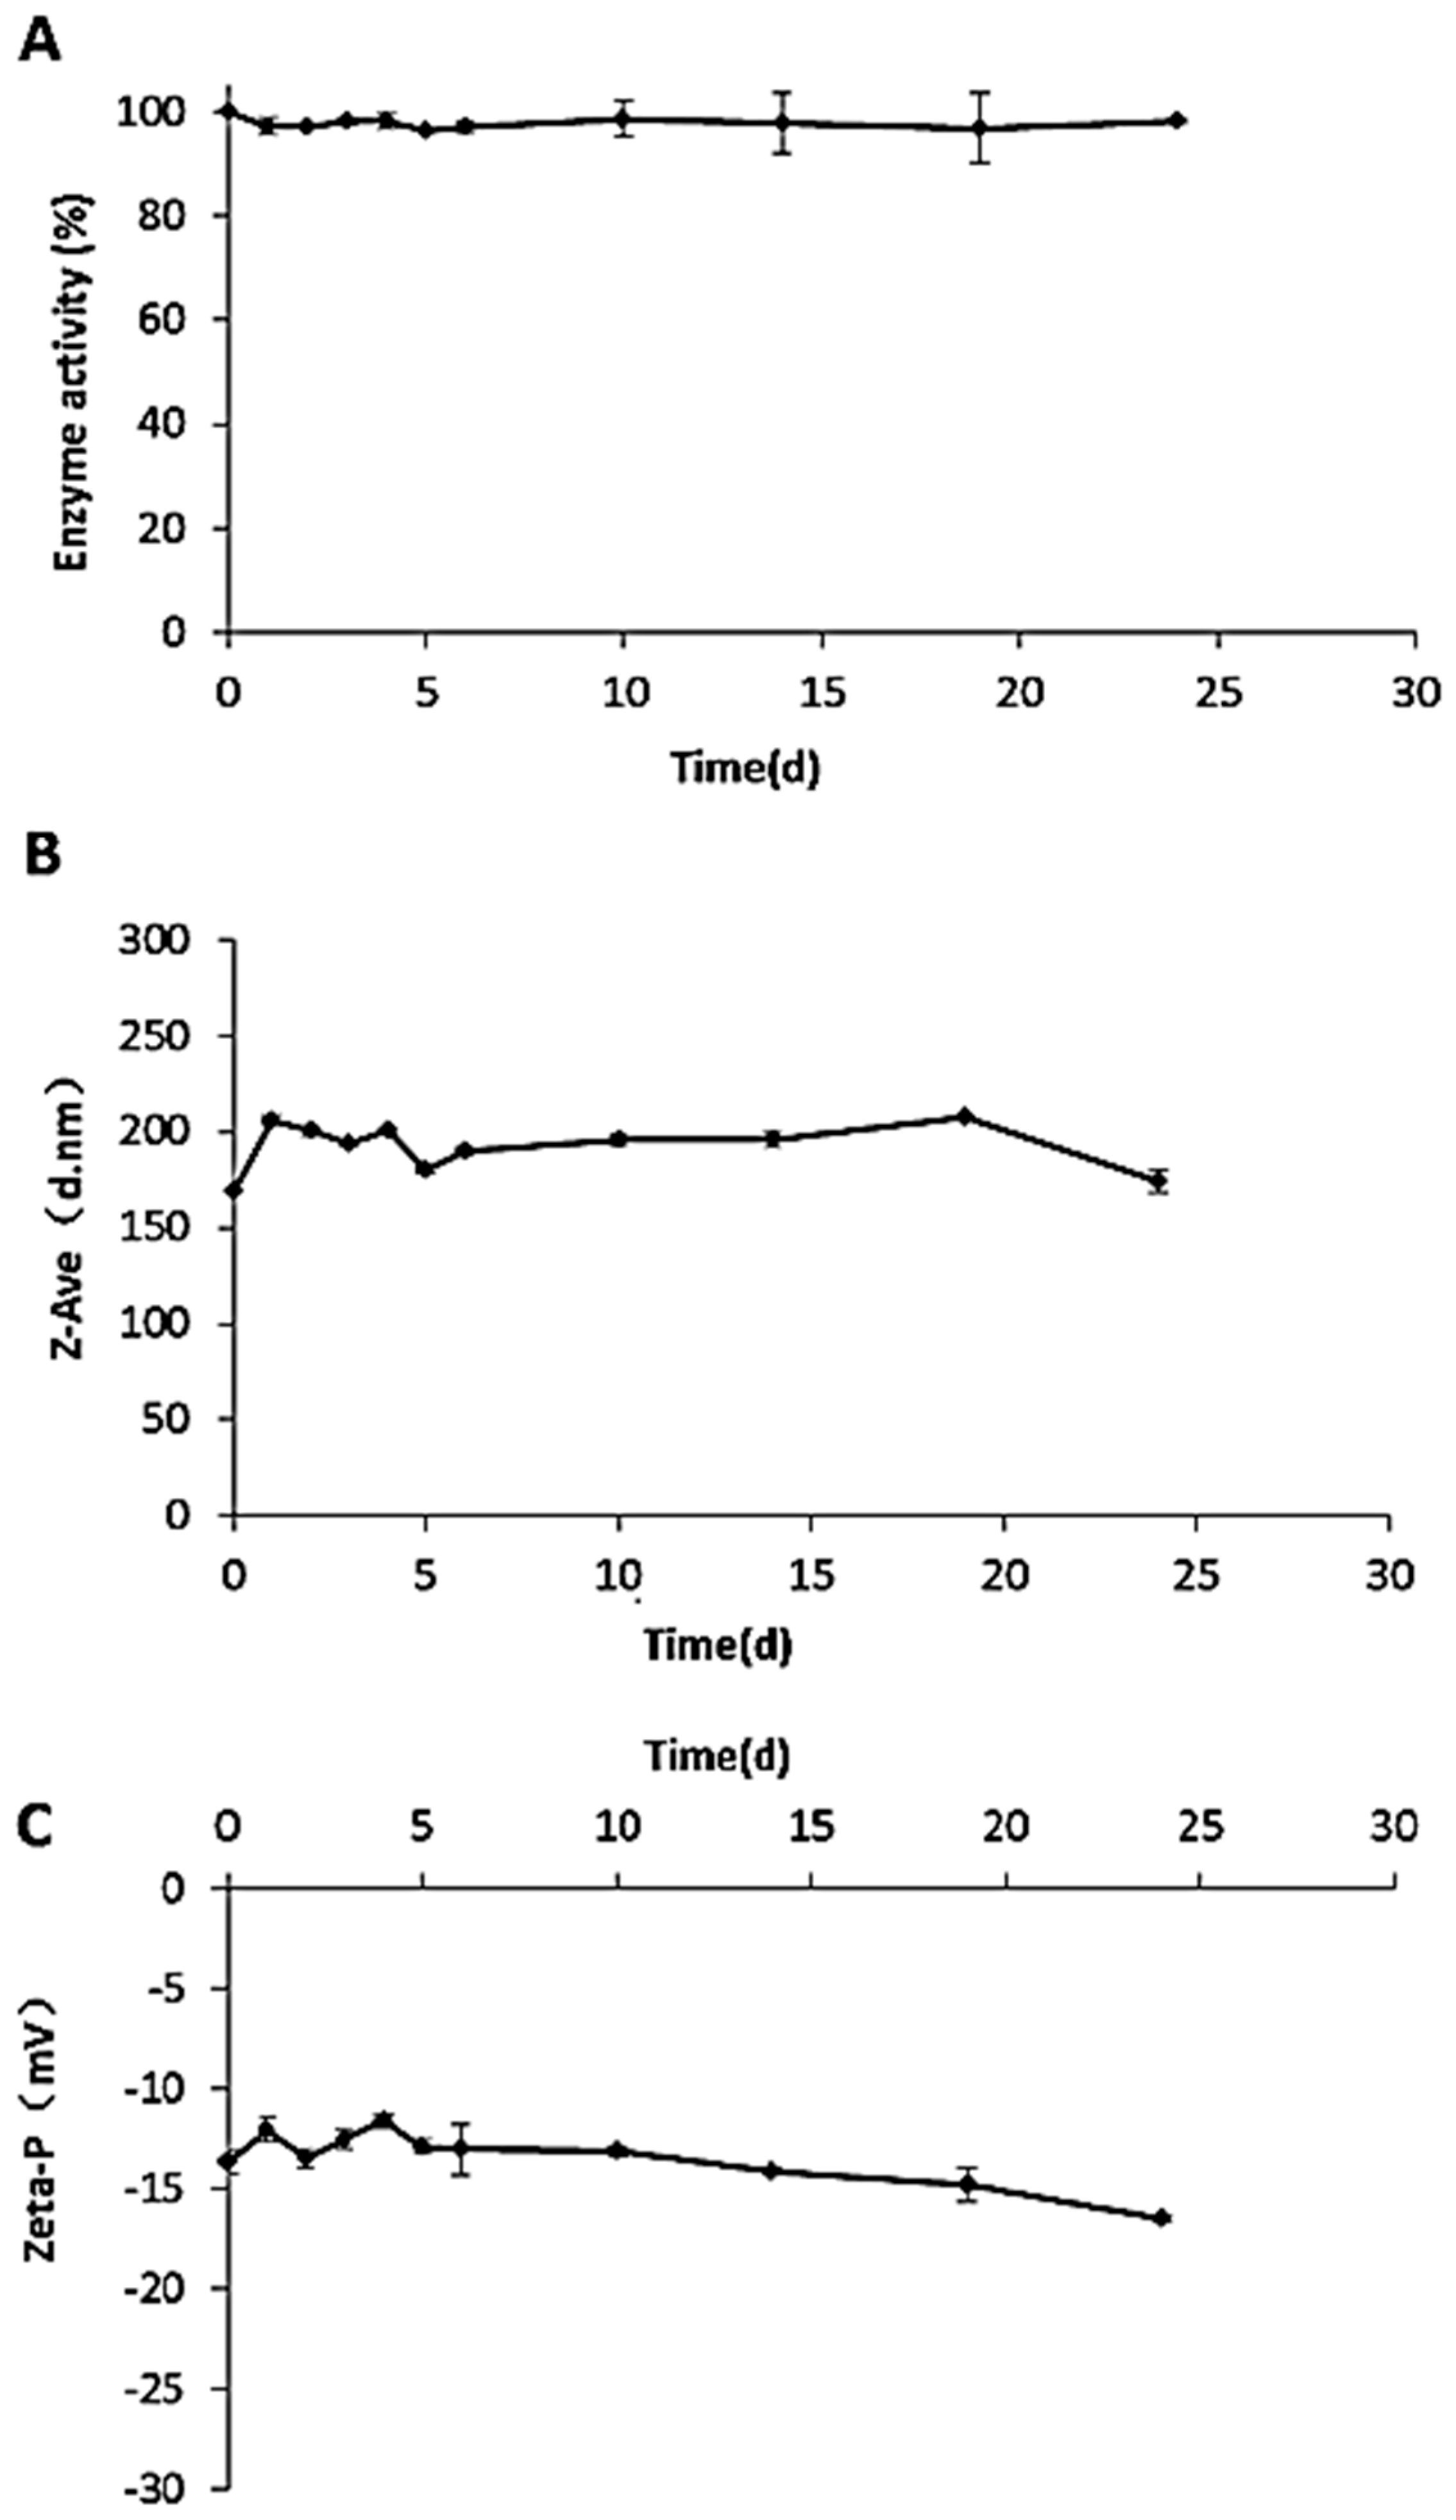
2.2. Preparation and Characterization of Cu/Zn SOD Nanoparticles
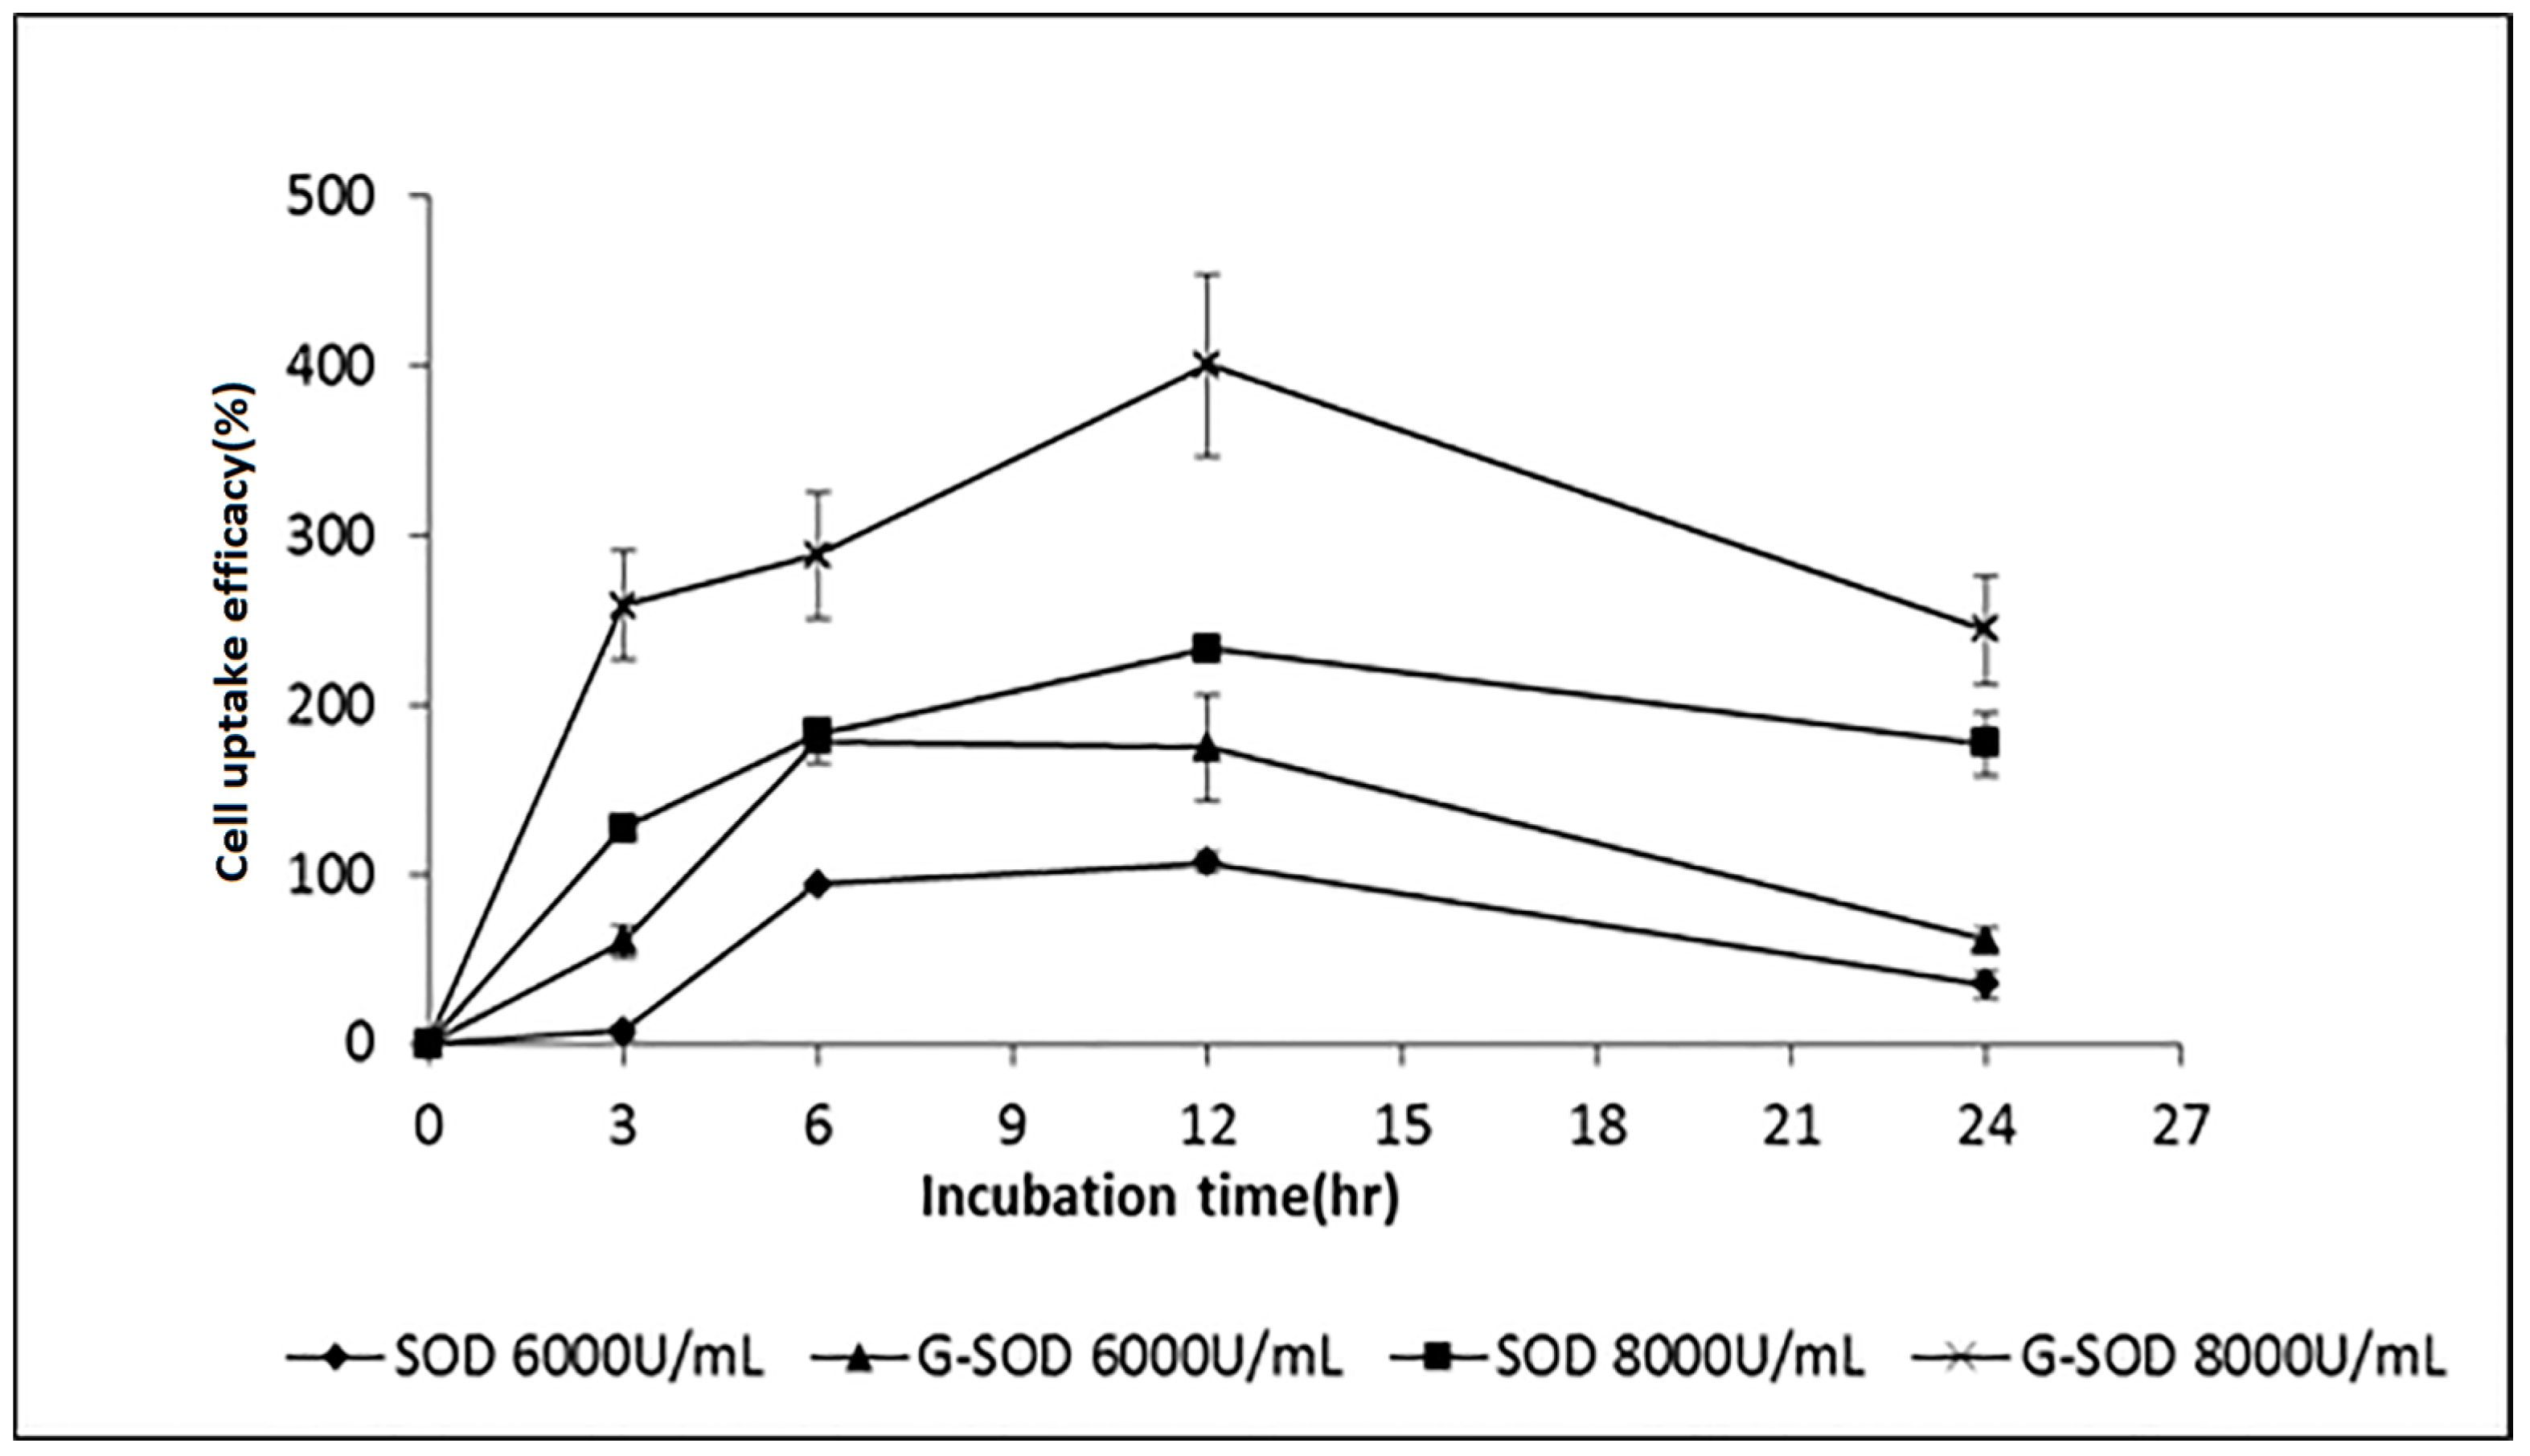
2.3. The Cell Uptake Efficacy of G-SOD
3. Discussion
4. Materials and Methods
4.1. Materials
4.2. Methods
4.2.1. Sample Preparation
4.2.2. Assay of Enzymatic Activity of SOD
4.2.3. Sodium Dodecyl Sulfate-Polyacrylamide Gel Electrophoresis (SDS-PAGE)
4.2.4. Observation of NP Morphology
4.2.5. Measurement of Size and Zeta Potential of Nanoparticles
4.2.6. Determination of the Concentration of Copper Ion
4.2.7. Optimization the Preparation of NPs by Response Surface Design
4.2.8. Gel Filtration Chromatography of G-SOD
4.2.9. Assay of Cell Uptake Efficacy of G-SOD
4.2.10. Stability in Storage
Acknowledgments
Author Contributions
Conflicts of Interest
References
- Segui, J.; Gironella, M.; Sans, M.; Granell, S.; Gil, F.; Gimeno, M.; Coronel, P.; Pique, J.M.; Panes, J. Superoxide dismutase ameliorates TNBS-induced colitis by reducing oxidative stress, adhesion molecule expression, and leukocyte recruitment into the inflamed intestine. J. Leukoc. Biol. 2004, 76, 537–544. [Google Scholar] [CrossRef] [PubMed]
- Mccord, J.M.; Edeas, M.A. SOD, oxidative stress and human pathologies: A brief history and a future vision. Biomed. Pharmacother. 2005, 59, 139–142. [Google Scholar] [CrossRef] [PubMed]
- Reddy, M.; Labhasetwar, V. Nanoparticle-mediated delivery of superoxide dismutase to the brain: An effective strategy to reduce ischemia-reperfusion injury. Faseb J. Off. Publ. Fed. Am. Soc. Exp. Biol. 2009, 23, 1384–1395. [Google Scholar] [CrossRef] [PubMed]
- Reddy, M.K.; Wu, L.; Kou, W.; Ghorpade, A.; Labhasetwar, V. Superoxide dismutase-loaded PLGA nanoparticles protect cultured human neurons under oxidative stress. Appl. Biochem. Biotechnol. 2008, 151, 565–577. [Google Scholar] [CrossRef] [PubMed]
- Hood, E.D.; Chorny, M.; Greineder, C.F.; Alferiev, I.; Levy, R.J.; Muzykantov, V.R. Endothelial targeting of nanocarriers loaded with antioxidant enzymes for protection against vascular oxidative stress and inflammation. Biomaterials 2014, 35, 3708–3715. [Google Scholar] [CrossRef] [PubMed]
- Kost, O.A.; Beznos, O.V.; Davydova, N.G.; Manickam, D.S.; Nikolskaya, I.I.; Guller, A.E.; Binevski, P.V.; Chesnokova, N.B.; Shekhter, A.B.; Klyachko, N.L.; et al. Superoxide Dismutase 1 Nanozyme for Treatment of Eye Inflammation. Oxid. Med. Cell. Longev. 2016, 2016, 5194239. [Google Scholar] [CrossRef] [PubMed]
- Karami, M.A.; Zadeh, B.S.M.; Koochak, M.; Moghimipur, E. Superoxide Dismutase-Loaded Solid Lipid Nanoparticles Prepared by Cold Homogenization Method: Characterization and Permeation Study Through Burned Rat Skin. Jundishapur J. Nat. Pharm. Prod. 2016, 11, e33968. [Google Scholar] [CrossRef]
- Lee, S.; Yang, S.C.; Heffernan, M.J.; Taylor, W.R.; Murthy, N. Polyketal microparticles: A new delivery vehicle for superoxide dismutase. Bioconjug. Chem. 2007, 18, 4–7. [Google Scholar] [CrossRef] [PubMed]
- Fiore, V.F.; Lofton, M.C.; Roser-Page, S.; Yang, S.C.; Roman, J.; Murthy, N.; Barker, T.H. Polyketal microparticles for therapeutic delivery to the lung. Biomaterials 2010, 31, 810–817. [Google Scholar] [CrossRef] [PubMed]
- Nakamura, S.; Ogawa, M.; Nakai, S.; Kato, A.; David, D.K. Antioxidant Activity of a Maillard-Type Phosvitin? Galactomannan Conjugate with Emulsifying Properties and Heat Stability. J. Agric. Food Chem. 1998, 46, 3958–3963. [Google Scholar] [CrossRef]
- Cai, L.; Qiu, D.; Liu, S.; Pan, J.; Yang, N.; Zhao, D.; Zhang, H.; Fu, T.; Miao, S. Effect of Coexisting Glucose on the Thermal Stability of Superoxide Dismutase. J. Chin. Inst. Food Sci. Technol. 2017, 17, 33–39. [Google Scholar]
- Pirestani, S.; Nasirpour, A.; Keramat, J.; Desobry, S. Preparation of chemically modified canola protein isolate with gum Arabic by means of Maillard reaction under wet-heating conditions. Carbohydr. Polym. 2017, 155, 201–207. [Google Scholar] [CrossRef] [PubMed]
- Yang, Z.; Zhang, C.; Ao, W.; Cai, Z.; Liu, S.; Rao, P. Purification of Recombinant Human Cu/Zn SOD Expressed in Pichia Yeast and Its Stability Characterization. J. Chin. Inst. Food Sci.Technol. 2011, 11, 108–113. [Google Scholar]
- Pan, J.; He, H.; Su, Y.; Zheng, G.; Wu, J.; Liu, S.; Rao, P. GST-TAT-SOD: Cell Permeable Bifunctional Antioxidant Enzyme—A Potential Selective Radioprotector. Oxid. Med. Cell. Longev. 2016, 2016, 5935080. [Google Scholar] [CrossRef] [PubMed]
- Zhao, D.; Cai, L.; Fu, T.; Zhang, H.; Liu, S.; Rao, P. Hypoglycemic effect of glycated SOD on alloxan-induced diabetic rats. J. Chin. Inst. Food Sci. Technol. 2016, in press. [Google Scholar]
- Zhao, D. Hypoglycemic Effect of Maillard Reaction Products of Superoxide Dismutase in Diabetic Rats. Master’s Thesis, Fuzhou University, Fuzhou, China, 2016. [Google Scholar]
- Hood, E.; Simone, E.; Wattamwar, P.; Dziubla, T.; Muzykantov, V. Nanocarriers for vascular delivery of antioxidants. Nanomedicine 2011, 6, 1257. [Google Scholar] [CrossRef] [PubMed]
- Guo, J.; Chen, Y.; Yuan, B.; Liu, S.; Rao, P. Effects of intracellular superoxide removal at acupoints with TAT-SOD on obesity. Free Radic. Biol. Med. 2011, 51, 2185–2189. [Google Scholar] [CrossRef] [PubMed]
- Elstner, E.F.; Heupel, A. Inhibition of nitrite formation from hydroxylammoniumchloride: A simple assay for superoxide dismutase. Anal. Biochem. 1976, 70, 616–620. [Google Scholar] [CrossRef]
- Zhang, C.; Bruins, M.E.; Yang, Z.Q.; Liu, S.T.; Rao, P.F. A new formula to calculate activity of superoxide dismutase in indirect assays. Anal. Biochem. 2016, 503, 65–67. [Google Scholar] [CrossRef] [PubMed]
- Laemmli, U.K. Cleavage of Structural Proteins during the Assembly of the Head of Bacteriophage T4. Nature 1970, 227, 680–685. [Google Scholar] [CrossRef] [PubMed]
- Fathollahipour, S.; Abouei Mehrizi, A.; Ghaee, A.; Koosha, M. Electrospinning of PVA/chitosan nanocomposite nanofibers containing gelatin nanoparticles as a dual drug delivery system. J. Biomed. Mater. Res. Part A 2015, 103, 3852–3862. [Google Scholar] [CrossRef] [PubMed]
- Khlebtsov, B.N.; Khlebtsov, N.G. On the measurement of gold nanoparticle sizes by the dynamic light scattering method. Colloid J. 2011, 73, 118–127. [Google Scholar] [CrossRef]
- Bhattacharjee, S. DLS and zeta potential—What they are and what they are not? J. Control. Release 2016, 235, 337–351. [Google Scholar] [CrossRef] [PubMed]
- Khan, N.; Jeong, I.S.; Hwang, I.M.; Kim, J.S.; Choi, S.H.; Nho, E.Y.; Choi, J.Y.; Park, K.S.; Kim, K.S. Analysis of minor and trace elements in milk and yogurts by inductively coupled plasma-mass spectrometry (ICP-MS). Food Chem. 2014, 147, 220–224. [Google Scholar] [CrossRef] [PubMed]
- Dandekar, D.V.; Jayaprakasha, G.K.; Patil, B.S. Hydrotropic extraction of bioactive limonin from sour orange (Citrus aurantium L.) seeds. Food Chem. 2008, 109, 515–520. [Google Scholar] [CrossRef]


| Factors | −1 | 0 | +1 |
|---|---|---|---|
| Ratio | 1 | 2 | 3 |
| Temperature (°C) | 60 | 75 | 90 |
| Time (min) | 30 | 45 | 60 |
| Number | Ratio | Temperature (°C) | Time (min) |
|---|---|---|---|
| 1 | 1 | 75 | 60 |
| 2 | 2 | 90 | 30 |
| 3 | 2 | 75 | 45 |
| 4 | 2 | 75 | 45 |
| 5 | 1 | 90 | 45 |
| 6 | 2 | 75 | 45 |
| 7 | 2 | 60 | 30 |
| 8 | 3 | 75 | 60 |
| 9 | 3 | 60 | 45 |
| 10 | 1 | 75 | 30 |
| 11 | 2 | 75 | 45 |
| 12 | 1 | 60 | 45 |
| 13 | 2 | 90 | 60 |
| 14 | 2 | 75 | 45 |
| 15 | 3 | 90 | 45 |
| 16 | 2 | 60 | 60 |
| 17 | 3 | 75 | 30 |
© 2017 by the authors. Licensee MDPI, Basel, Switzerland. This article is an open access article distributed under the terms and conditions of the Creative Commons Attribution (CC BY) license (http://creativecommons.org/licenses/by/4.0/).
Share and Cite
Cai, L.; Lin, C.; Yang, N.; Huang, Z.; Miao, S.; Chen, X.; Pan, J.; Rao, P.; Liu, S. Preparation and Characterization of Nanoparticles Made from Co-Incubation of SOD and Glucose. Nanomaterials 2017, 7, 458. https://doi.org/10.3390/nano7120458
Cai L, Lin C, Yang N, Huang Z, Miao S, Chen X, Pan J, Rao P, Liu S. Preparation and Characterization of Nanoparticles Made from Co-Incubation of SOD and Glucose. Nanomaterials. 2017; 7(12):458. https://doi.org/10.3390/nano7120458
Chicago/Turabian StyleCai, Liping, Chuntong Lin, Nannan Yang, Zhijie Huang, Song Miao, Xiaochao Chen, Jianru Pan, Pingfan Rao, and Shutao Liu. 2017. "Preparation and Characterization of Nanoparticles Made from Co-Incubation of SOD and Glucose" Nanomaterials 7, no. 12: 458. https://doi.org/10.3390/nano7120458
APA StyleCai, L., Lin, C., Yang, N., Huang, Z., Miao, S., Chen, X., Pan, J., Rao, P., & Liu, S. (2017). Preparation and Characterization of Nanoparticles Made from Co-Incubation of SOD and Glucose. Nanomaterials, 7(12), 458. https://doi.org/10.3390/nano7120458