Abstract
Developing solid state materials capable of generating homogeneous white light in an energy efficient and resource-sustainable way is central to the design of new and improved devices for various lighting applications. Most currently-used phosphors depend on strategically important rare earth elements, and rely on a multicomponent approach, which produces sub-optimal quality white light. Here, we report the design and preparation of a colloidal white-light emitting nanocrystal conjugate. This conjugate is obtained by linking colloidal Ga2O3 and II–VI nanocrystals in the solution phase with a short bifunctional organic molecule (thioglycolic acid). The two types of nanocrystals are electronically coupled by Förster resonance energy transfer owing to the short separation between Ga2O3 (energy donor) and core/shell CdSe/CdS (energy acceptor) nanocrystals, and the spectral overlap between the photoluminescence of the donor and the absorption of the acceptor. Using steady state and time-resolved photoluminescence spectroscopies, we quantified the contribution of the energy transfer to the photoluminescence spectral power distribution and the corresponding chromaticity of this nanocrystal conjugate. Quantitative understanding of this new system allows for tuning of the emission color and the design of quasi-single white light emitting inorganic phosphors without the use of rare-earth elements.
1. Introduction
Colloidal nanocrystals (NCs) offer a substantial promise for the design and fabrication of solid state structures and devices. Size-tunable electronic structure and optical properties render this class of materials attractive for various applications in photonics, optoelectronics, and sensors []. The size and shape of colloidal NCs can be controlled in situ by simply adjusting the synthesis conditions [], allowing for the exploitation of quantum confinement to manipulate their optical properties. Furthermore, colloidal NCs can be modified post-synthetically by functionalization and conjugation with organic or biomolecules [], or by forming a composite with polymers or other nanostructures [,]. This ability to combine solid state-like optical and mechanical properties of NCs with the opportunities for their chemical modifications in solution opens a number of possibilities to use them as building blocks in optical and photonic devices.
With increasing concerns about the global energy supply and sustainable use of natural resources, the search for new low-cost materials for energy efficient lighting has intensified in recent years []. The total amount of electrical energy used for lighting exceeds 20% at the global level, with residential and commercial sectors being responsible for the majority of lighting electricity consumption []. Light emitting diodes (LEDs) have emerged as a long-term alternative to traditional incandescent light bulbs, owing to their efficiency, durability, and reliability []. The most promising approach to white LEDs has been to combine GaN blue LED with remote phosphors, most notably yellow-emitting yttrium aluminum garnet doped with cerium (Ce:YAG) []. However, the adoption of such white LEDs for general lighting applications has been rather slow because of the high manufacturing cost, and non-optimal characteristics of light (low color rendering index and high correlated color temperature) []. The deficiencies of the spectral properties have been addressed by the addition of other rare earth element-based phosphors to augment the spectral density in the red part of the spectrum [,], further increasing the complexity and cost of the final devices and making it difficult to obtain homogeneous white light in a reproducible manner. Colloidal II–VI NCs with selected average sizes have also been used in combination with remote phosphors to generate “warm” white light [].
We have recently demonstrated the ability to produce white light and tune its chromaticity by conjugating transparent metal oxide NCs with organic fluorophores (dyes) emitting in the complementary spectral range [,]. The core of this phenomenon is a defect-based photoluminescence of these metal oxide NCs. In the case of colloidal γ-Ga2O3 NCs the emission is based on electron donor-acceptor pair (DAP) recombination []. It arises from the recombination of an electron trapped on an oxygen vacancy forming localized electron donor states with a hole trapped on a gallium–oxygen vacancy pair acting as an electron acceptor [,]. A range of distances between electron donor and acceptor sites, as well as coupling of the electronic transition with lattice phonons are likely reasons for significant broadening of this emission band [,]. Owing to the proximity of the NC surface-bound organic fluorophore to the DAP recombination sites, and the overlap of its absorption spectrum with the DAP photoluminescence (PL) band, the photoexcited Ga2O3 NCs can transfer the excitation energy to the conjugated dye molecules via the Förster resonance energy transfer (FRET) mechanism []. This approach has allowed us to obtain a hybrid nanoconjugate acting as a single white light-emitting fluorophore [,].
In this work, we demonstrate the design and preparation of new colloidal white light-emitting nanocomposite obtained by controlled conjugation of II–VI and γ-Ga2O3 NCs using a simple molecular linker. The ability to manipulate the PL spectra of CdSe/CdS (core/shell) NCs by changing the core size and/or shell thickness allows for fine tuning of the red side of the nanocomposite emission to generate white light with the desired chromaticity. The spectral overlap between the PL of the energy donor (Ga2O3 NCs) and the absorption of the energy acceptor (core/shell CdSe/CdS NCs) enables their electronic coupling by FRET. Using the PL quenching of the energy donor determined from the steady-state and time-resolved PL measurements, we quantified the contributions of the direct excitation and energy transfer to the emission of CdSe/CdS NCs. The nanocomposite demonstrated in this work represents an important step toward single-phased all-inorganic rare earth element-free white light-emitting phosphor.
2. Results and Discussion
The average size and morphology of colloidal Ga2O3 NCs used in this study were determined by transmission electron microscopy (TEM). The NCs are quasi-spherical and have an average diameter of ca. 5.5 nm (Figure 1a). The X-ray diffraction (XRD) pattern confirms that these NCs exhibit cubic crystal structure characteristic for the γ-Ga2O3 (Figure 1b). We chose CdSe/CdS core/shell NCs as a complementary solid-state emitter because they possess a strong size-tunable red emission, which could allow for the generation of white light when coupled with the Ga2O3 DAP PL. A typical TEM image of CdSe/CdS NCs is shown in Figure 1c. As-synthesized CdSe NC cores have an average size of ca. 2.2 nm, as determined from the band gap absorption energy []. From the comparison of the average NC sizes before and after the shell growth, the average thickness of the shell was estimated to be ca. 2.3 nm, consistent with the core/shell NCs prepared under similar conditions []. These estimates were confirmed using the corresponding band edge absorption energy (Figure 1d).
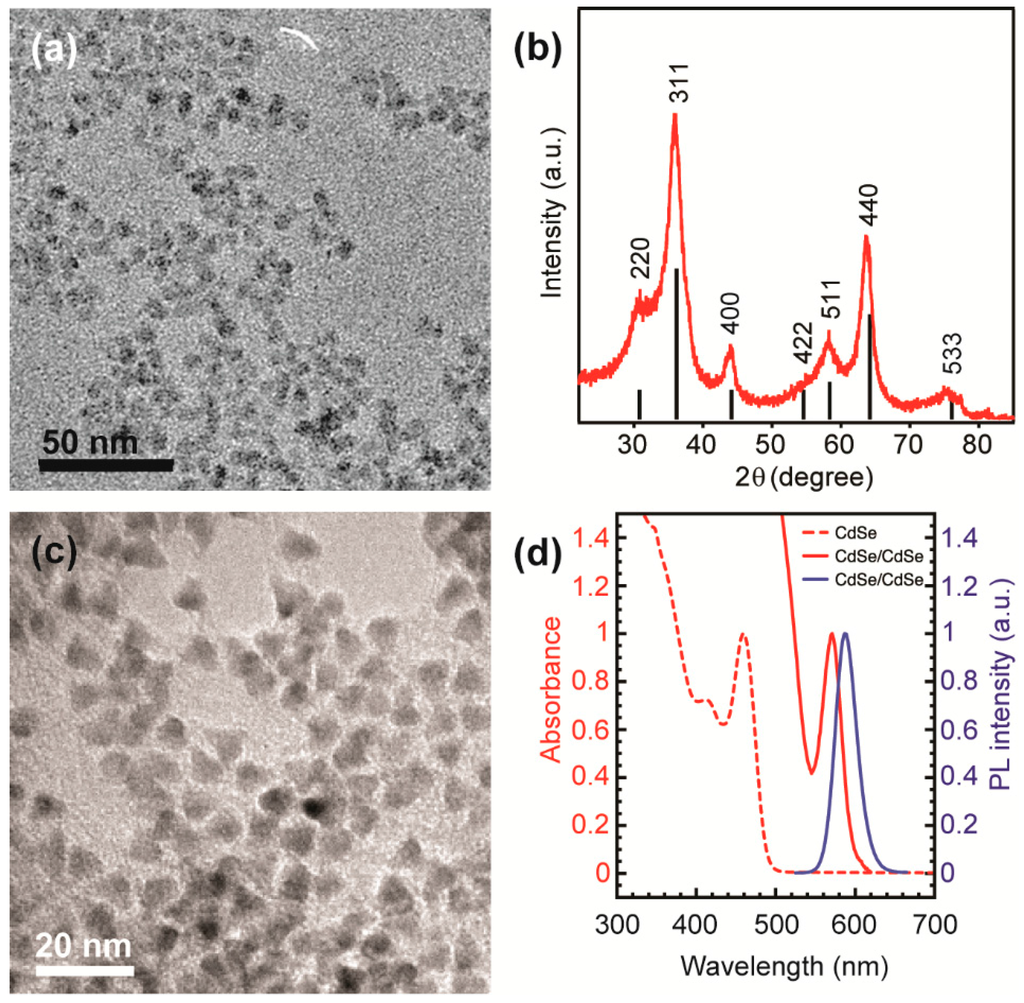
Figure 1.
(a) Overview transmission electron microscopy (TEM) image of colloidal γ-Ga2O3 nanocrystals (NCs) having an average dimeter of ca. 5.5 nm; (b) X-ray diffraction (XRD) pattern of the same NCs; vertical black lines represent a reference XRD pattern of bulk γ-phase Ga2O3; (c) Overview TEM image of ca. 6.8 nm CdSe/CdS core/shell NCs; (d) Absorption (red) and photoluminescence (PL) (blue) spectra of CdSe/CdS NCs (solid lines), and the absorption spectrum of the corresponding CdSe NC cores (red dashed line).
To facilitate the conjugation of Ga2O3 and CdSe/CdS NCs we used thioglycolic acid (TGA), which can bind to NC surfaces through both thiol and carboxylic acid functional groups []. Thiols are known to bind strongly to the CdSe or CdS quantum dot surfaces [,], and in our previous studies we showed that carboxylic acid group reacts with the surface of Ga2O3 NCs [,]. An overview TEM image of the CdSe/CdS-conjugated γ-Ga2O3 NCs is shown in Figure 2a. The NCs form extended networks owing to the strong binding of the linker to the NC surfaces. Figure 2b shows a high resolution TEM image of conjugated NCs. The nanocrystals within a formed aggregate are identified by measuring their lattice spacing. The close proximity of Ga2O3 and CdSe/CdS NCs shown in Figure 2b confirm their conjugation. To determine the overall homogeneity of the colloidal NC conjugate we performed energy-dispersive X-ray spectroscopy (EDX) elemental mapping in the scanning transmission electron microscopy (STEM) mode. A STEM image and the corresponding maps of Ga and Cd are shown in Figure 2c–e, respectively. The Ga and Cd maps are well correlated, indicating homogeneous distribution of both types of NCs within the aggregate.
CdSe/CdS NCs are excellent FRET acceptors because their absorption spectrum strongly overlaps with the emission spectrum of Ga2O3 NCs (Figure 3), providing a basis for the FRET mechanism. Furthermore, the quantum yield of these NCs is very high, in some cases reaching over 90% []. The spectral overlap is calculated as:
where FD(λ) is the emission of the FRET donor with an integrated intensity normalized to unity, and εA(λ) is the molar extinction coefficient of the acceptor at wavelength λ. Spectral overlap is the key parameter determining the critical radius (R0), also known as the Förster radius, which is defined as the separation at which the energy transfer efficiency is 50%.
In this expression Q0 is the donor quantum yield in absence of the acceptor, nr is the index of refraction of the solvent, NA is the Avogadro's number and κ2 is the dipole alignment factor which we define as 2/3. This value is appropriate when donor and acceptor dipole orientations are random and experience no ordering [,,]. In the case of Ga2O3 and CdSe/CdS NCs, the Förster radius was calculated to be 7.13 nm. In order to observe FRET in colloidal suspension, Ga2O3 and CdSe/CdS NCs must be within 21.4 nm (3R0). This distance is much smaller than the average separation of free standing NCs in solution phase, which was estimated to be over 250 nm even for the highest NC concentrations used. To induce FRET in solution, the NCs were conjugated with a bifunctional TGA linker, as described in the Experimental Section. Based on the TEM images, the average sizes of Ga2O3 and CdSe/CdS NCs are ca. 5.5 and 6.8 nm, respectively. Assuming the length of TGA of 0.5 nm, the center-to-center separation between bound NCs should be ca. 6.7 nm, well within the limit of 21.4 nm.
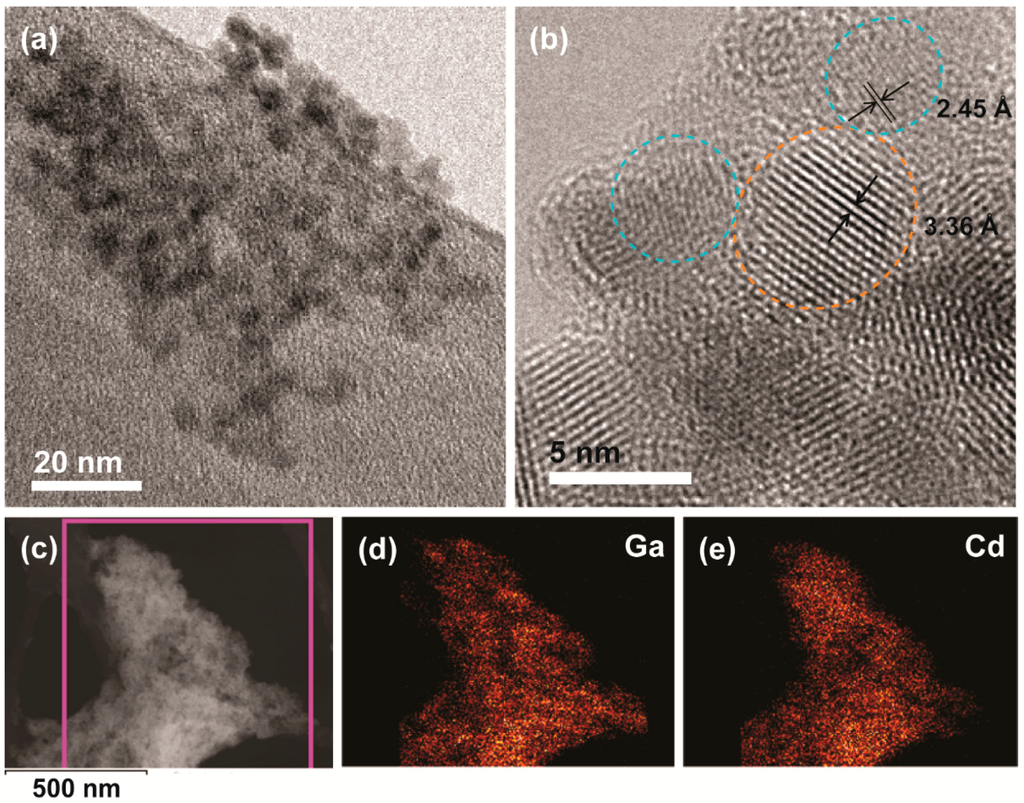
Figure 2.
(a) Overview TEM image of colloidal Ga2O3-CdSe/CdS NC conjugate obtained using NCs shown in Figure 1; (b) High resolution TEM image of the same sample. Orange and blue circles indicate CdSe/CdS and Ga2O3 NCs, respectively; the lattice spacings shown correspond to {002} and {311} planes of CdS and Ga2O3, respectively; (c–e) Scanning transmission electron microscopy (STEM) image of the nanocrystal conjugate (c); and the corresponding Ga (d) and Cd (e) energy-dispersive X-ray spectroscopy (EDX) elemental maps.
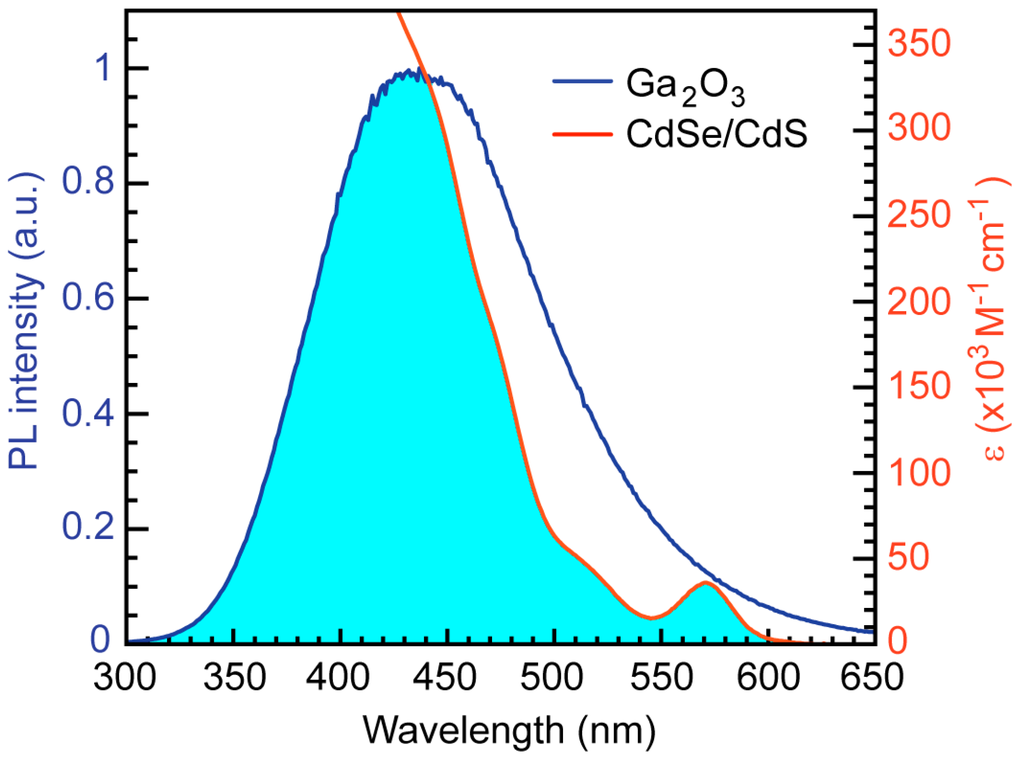
Figure 3.
Absorption spectrum of CdSe/CdS NCs (orange line) and PL spectrum of Ga2O3 NCs (blue line). Excitation wavelength for Ga2O3 NCs is 250 nm. Shaded area indicates a spectral overlap, as an essential requirement for Förster resonance energy transfer (FRET).
Figure 4a shows PL spectra of Ga2O3-CdSe/CdS NC conjugates having different CdSe/CdS to Ga2O3 NC concentration ratio, upon excitation at 250 nm (corresponding to the Ga2O3 band edge). The concentration of CdSe NC cores was determined from the absorption spectrum using the extinction coefficient (ε) value reported for the samples prepared under similar conditions [], which allowed us to estimate the concentration of CdSe/CdS NCs as FRET acceptors by assuming quantitative extraction and uniform coating of the cores with CdS shell. The relative concentrations of Ga2O3 NCs in the conjugate samples were inferred from EDX elemental analysis, accounting for an average NC volume. The emission intensity of Ga2O3 NCs is quenched up to ca. 40% concurrently with an increase in CdSe/CdS NC emission. Deconvoluted spectra of CdSe/CdS NCs in the nanocrystal conjugates are shown in Figure S1 (Supplementary Materials). This observation is consistent with the FRET coupling of the two components. However, CdSe/CdS NCs also emit light upon excitation at 250 nm. The PL spectra of CdSe/CdS NCs, treated exactly as in the preparation of NC conjugates but without Ga2O3 NCs, are shown with dashed lines in Figure 4a. Higher PL intensity of CdSe/CdS NCs in the conjugated form attests to FRET between Ga2O3 and CdSe/CdS NCs (Figure S1, Supplementary Materials). In contrast to the NC conjugate, a suspension containing the same concentrations of Ga2O3 and CdSe/CdS NCs without the linker exhibits only about a 10% decrease in Ga2O3 DAP emission intensity (Figure 4b). This reduction in the DAP emission occurs because of the direct excitation of CdSe/CdS NCs by a fraction of the excitation source, and is an unavoidable phenomenon when studying FRET between nanoparticles. Similarly, a solution containing Ga2O3 NCs and the relevant amount of TGA linker (vide infra) leads to only a 7.5% reduction in the DAP emission. To determine the concentration of TGA bound to the surface of CdSe/CdS NCs, the absorbance of TGA in the supernatant obtained upon precipitation of TGA-bound NCs was measured. After the initial wash ca. 94.5% of TGA remained in the supernatant. Additional washing resulted in further removal of the TGA loosely adsorbed on the NC surfaces, suggesting that only ca. 0.3% of the original amount of TGA is actually bound to CdSe/CdS NCs. Hereafter, the concentration of TGA is given in terms of the equivalents of CdSe/CdS NCs added to Ga2O3 NCs (i.e., the amount of TGA corresponding to certain acceptor to donor concentration ratio). It is evident that some of the reduction in Ga2O3 PL intensity also comes from competitive light absorption and/or quenching by the TGA linker (Figure S2, Supplementary Materials), but the extent to which Ga2O3 NC emission is quenched by energy transfer is far greater (Figure 4c). The existence of FRET is also evident from the excitation spectrum of CdSe/CdS acceptor in the NC conjugate (Figure S3, Supplementary Materials).
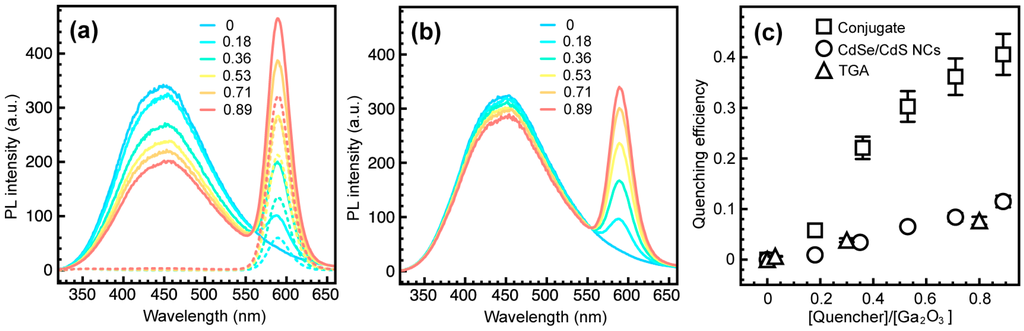
Figure 4.
(a) PL spectra of colloidal Ga2O3-CdSe/CdS NC conjugates (solid lines) having different CdSe/CdS to Ga2O3 NC concentration ratio, as indicated in the graph. PL spectra of thioglycolic acid (TGA)-bound CdSe/CdS NC suspensions having the same concentration as in the NC conjugate are shown with dashed lines (λexc = 250 nm); (b) PL spectra of the mixtures of Ga2O3 and CdSe/CdS NCs prepared in the same way as the NC conjugate but without the TGA linker; (c) Quenching efficiency of the donor-acceptor pair (DAP) emission of Ga2O3 NCs in the conjugate (squares), mixed with CdSe/CdS NCs (circles), and mixed with TGA but without CdSe/CdS NCs (triangles).
The energy transfer efficiency is defined by the Förster theory as:
where RDA is the average separation between donors and acceptors, and n is the acceptor to donor ratio. FRET efficiency (η) can also be determined experimentally by measuring the donor lifetime shortening in the presence of the acceptors:
where τD and τDA are the lifetimes of the donor alone and in the presence of the acceptors, respectively. Since DAP emission does not follow a simple exponential time decay [], the integrated lifetimes were used to calculate η, instead of the time components obtained as the fitting parameters. The ligands bound to the Ga2O3 NC surface can compete with native defects for trapping of the photogenerated free carriers []. Therefore, the DAP emission can also be affected by the molecules bound to the surface of the NCs. When TGA replaces TOPO on Ga2O3 NCs in the amount equivalent to that used to conjugate CdSe/CdS NCs, the DAP emission experiences a negligible reduction in lifetime (Figure 5a). The original DAP PL lifetime is decreased by maximum of ca. 3% for the amount of TGA corresponding to the highest CdSe/CdS to Ga2O3 NC ratio explored in this study (aqua blue trace). On the other hand, Figure 4b shows progressive shortening of the Ga2O3 NC PL lifetime with increasing concentration of TGA-bound CdSe/CdS NCs, confirming that FRET is the dominant quenching mechanism. Figure 5c compares the quenching efficiency (η) of Ga2O3 NCs conjugated with CdSe/CdS NCs via TGA with that of Ga2O3 NCs capped with TGA, for different concentrations of the corresponding quencher, calculated using Equation (4). CdSe/CdS-conjugated Ga2O3 NCs show significantly higher efficiency for all quencher concentrations confirming the FRET from Ga2O3 donor to CdSe/CdS acceptor NCs.
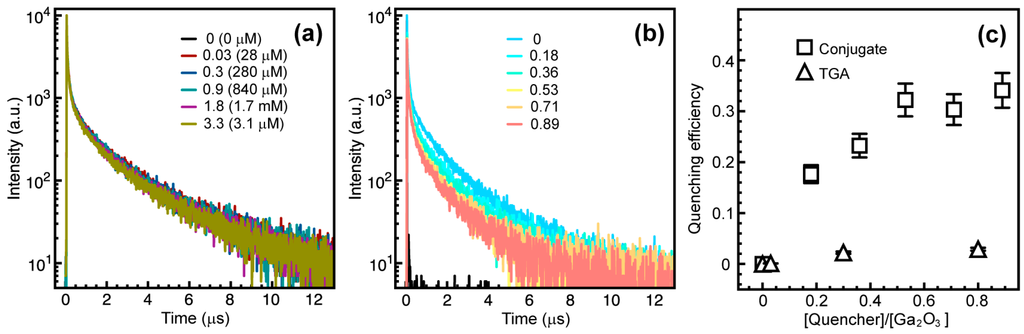
Figure 5.
(a) Time-resolved DAP PL decay of Ga2O3 NCs containing different amounts of surface-bound TGA without CdSe/CdS NCs. TGA equivalents and absolute concentrations (in parentheses) in Ga2O3 NC suspensions are indicated in the graph (aqua blue trace (0.84 mM) represents TGA concentration for the highest acceptor to donor ratio); (b) Time-resolved DAP PL decay of Ga2O3 NCs in the NC conjugates having different CdSe/CdS to Ga2O3 NC concentration ratio, as indicated in the graph; (c) Quenching efficiency of the DAP PL of Ga2O3 NCs in the NC conjugate (squares) and with bound TGA (triangles).
Förster resonance energy transfer efficiency between Ga2O3 and CdSe/CdS NCs, calculated using Equation (4), was corrected for possible quenching of the donor emission by TGA (triangle symbols in Figure 5c), and displayed in Figure 6 as a function of the acceptor to donor ratio (n). The acceptor to donor ratio was determined to be 0.9 when 1 mL of CdSe/CdS NC suspension (the largest amount) was added to 1 mL of Ga2O3 NC stock suspension. The expression for FRET efficiency (Equation (3)) is an average approximation when the majority of binding sites are occupied or the stoichiometric ratio of the donor and acceptor can be controlled [,,]. The colloidal NCs generally have a large surface area, leading to a large number of possible binding sites, some of which are unoccupied, invalidating this basic model. Instead, the distribution of the acceptors per donor will obey Poissonian statistical model when most binding sites are unoccupied [,]:
where ξ is an average number of acceptors per donor, while n is a whole-number acceptor to donor ratio. The FRET efficiency data in Figure 6 were fit using Equation (5) (dashed line). The fit is of a reasonable quality, with R2 value of 0.87. The Poissonian fit in Figure 6 is distinctly different from the energy transfer efficiency predicted by the Förster theory (Equation (3)) using the R0 and RDA values of 7.13 and 6.7 nm, respectively (solid line).
The ability to control FRET efficiency in Ga2O3-CdSe/CdS NC conjugates by adjusting the acceptor to donor ratio can be used to control the overall chromaticity of the emitted light. Figure 7 shows an International Commission on Illumination 1931 (CIE 1931) color space diagram of the NC conjugates consisting of different average number of acceptors per donor. The photographs of the colloidal suspensions of the conjugates corresponding to the symbols labeled in the graph are shown as insets. The non-conjugated Ga2O3 NCs emit blue light (inset 1). The addition of CdSe/CdS NCs increases the orange-red contribution to the spectral power distribution, owing to both energy transfer and direct excitation. For an optimal ratio of CdSe/CdS to Ga2O3 NCs the colloidal NC conjugate suspension has color coordinates in the white light emitting region (0.345, 0.282) (inset 2). The orange-red contribution becomes dominant for high concentration of the CdSe/CdS NCs (inset 3), reaching bright orange color for pure CdSe/CdS NC suspension (inset 4). The CIE 1931 diagram for the mixtures of Ga2O3 and CdSe/CdS NCs is shown in Figure S4 (Supplementary Materials) for comparison. These results demonstrate the promise of using inorganic building blocks to generate tunable white light with characteristic spectral and color properties.
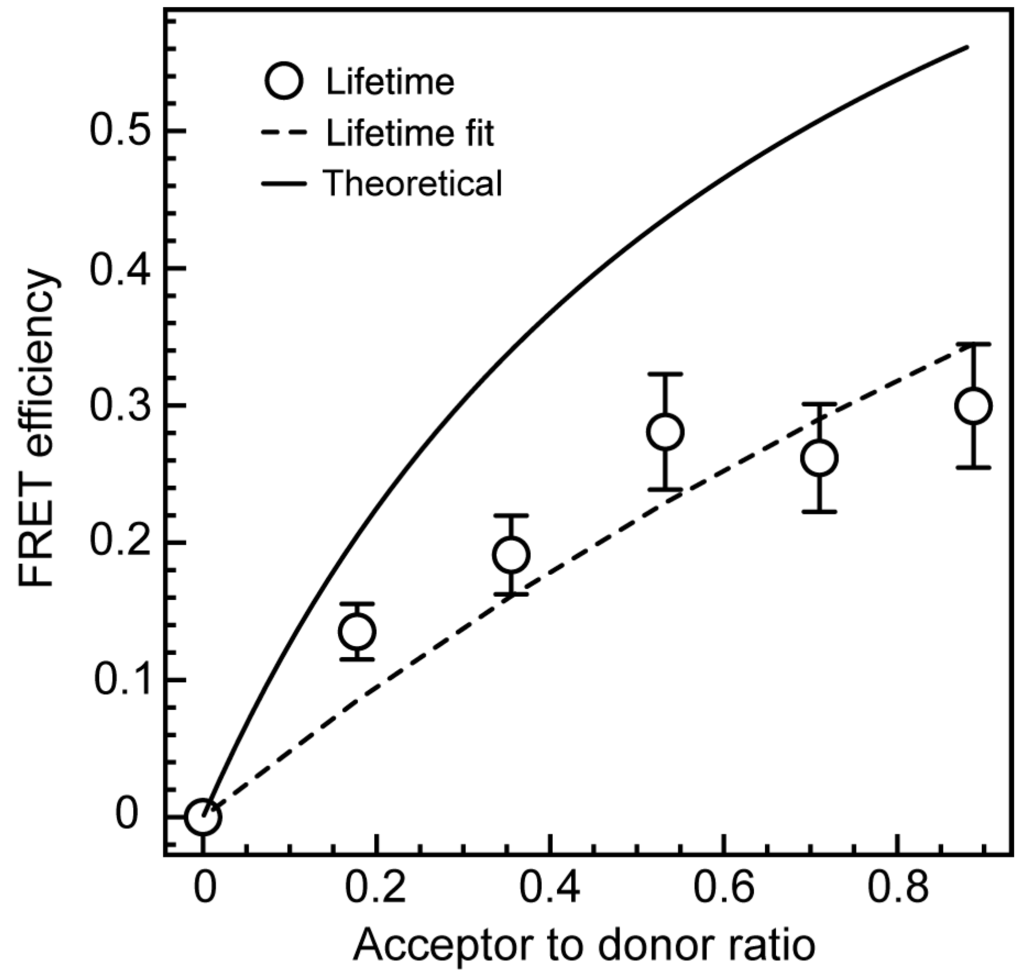
Figure 6.
FRET efficiency in Ga2O3-CdSe/CdS NC conjugate (circles) determined from the DAP PL lifetime data corrected for the lifetime shortenening due to TGA binding. The experimental data were fit using Equation (5) (dashed line). Solid line is the FRET efficiency predicted by the Förster theory (Equation (3)).
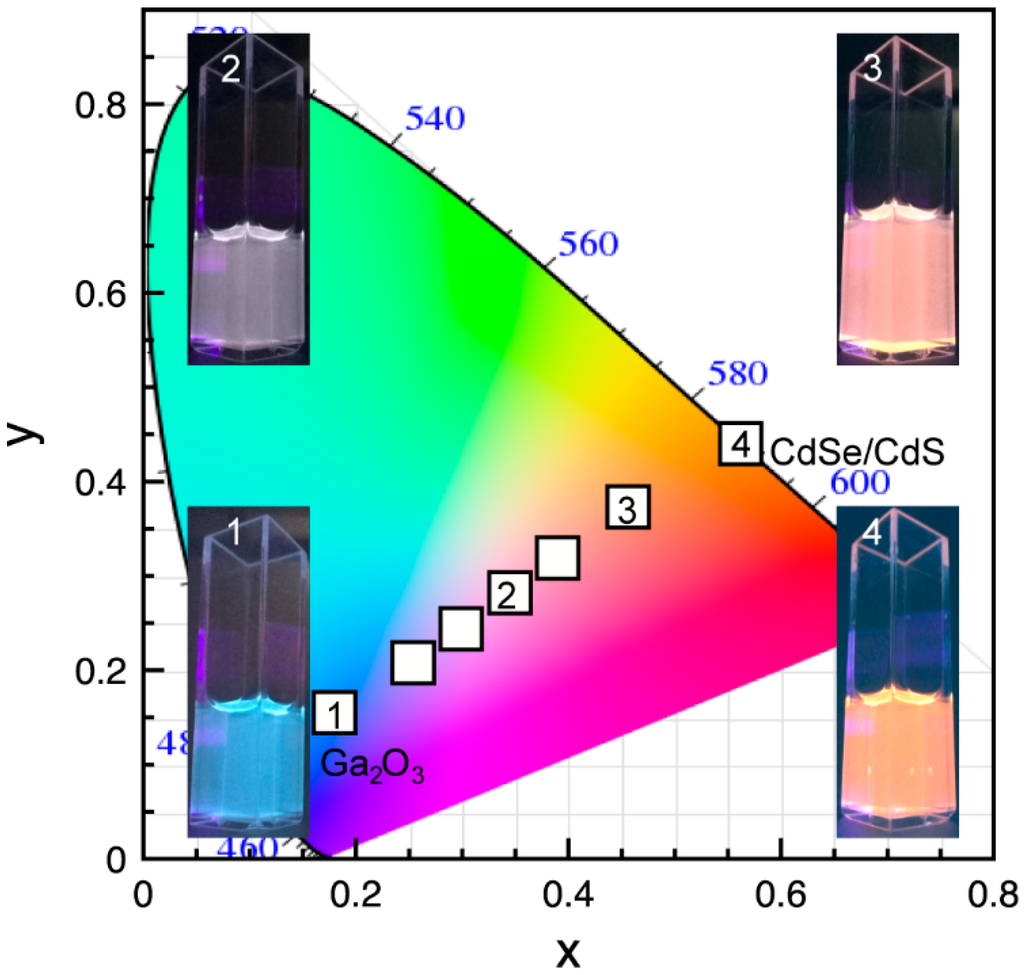
Figure 7.
International Commission on Illumination 1931 (CIE 1931) color coordinate diagram for Ga2O3-CdSe/CdS NC conjugate having different acceptor to donor ratio. The photographs of the colloidal nanoconjugates corresponding to data points labeled in the graph are shown as insets.
3. Materials and Methods
3.1. Materials
All materials are commercially available, and were used as received. Gallium acetylacetonate (Ga(acac)3) was purchased from Strem Chemicals (Newburyport, MA, USA). Cadmium oxide, selenium, 1-octadecene, trioctylphosphine (TOP), oleylamine, oleic acid, thioglycolic acid (TGA), trioctylphospine oxide (TOPO), tetradecylphosphonic acid, and tetrahydrofuran (THF) were all purchased from Sigma Aldrich (St. Louis, MO, USA).
3.2. Synthesis of Ga2O3 NCs
The synthesis of Ga2O3 NCs was carried out according to the previously reported method []. Briefly, 0.5 g of Ga(acac)3 and 14 g of oleylamine were loaded into a 100 mL three-neck round bottom flask. The reaction flask was filled with argon and heated to 300 °C over the course of an hour. The reaction mixture was held at this temperature for an hour, and then cooled naturally to room temperature. The obtained product was washed with ethanol and centrifuged at 3000 rpm. The washing procedure was repeated three more times. The NCs were finally capped with TOPO, as previously described []. The capped NCs were dispersed in THF.
3.3. Synthesis of CdSe NCs
CdO (60 mg), tetradecylphosphonic acid (210 mg), and TOPO (3 g) were combined in a 100 mL three-neck round bottom flask. The flask was degassed at 150 °C for 1 h, then back filled with argon. The reaction mixture was brought to 320 °C and 1 mL of TOP-Se, prepared separately by dissolving 60 mg Se in 1 mL TOP, was injected rapidly. The reaction was allowed to proceed until the desired NC size is achieved, then cooled using compressed air. When the temperature reached 80 °C methanol was injected, and the precipitated NCs were isolated by centrifugation at 3000 rpm. The NCs were then dispersed in hexane, and their concentration was determined from the absorption spectra [].
3.4. CdS Shell Growth
The growth of CdS shell was performed by a previously reported method []. In summary, as-synthesized suspension of CdSe NC cores (ca. 100 nmol) was placed in a three-neck round bottom flask containing 3 mL oleylamine and 3 mL 1-octadecene. The reaction flask was held under vacuum for 1 h and subsequently purged with nitrogen. The shell was grown from Cd(OA)2 and dodecanethiol as precursors. Cd(OA)2 was prepared by dissolving 1 part CdO in 4 parts oleic acid at 230 °C, while dodecanethiol was dissolved in 1-octadecene. The temperature of the flask containing NC cores was increased to 320 °C, and the dropwise injection of 6 mL Cd(OA)2 and dodecanethiol solutions started at 240 °C. Injection was carried out for 3 h, after which 3 mL of oleic acid was injected and the colloidal mixture was further heated for 1 h. The reaction mixture was cooled and washed with acetone, and dissolved in THF.
3.5. Functionalization of CdSe/CdS NCs with TGA
The capping of CdSe/CdS NCs with TGA was carried out by combining 1 mL of 5 μM CdSe/CdS NCs in hexanes, 1 mL acetone, and 0.2 mL TGA in a 25 mL scintillator vial under a nitrogen atmosphere, and stirring for 30 min. 0.5 mL ethanol was added to the vial and the mixture was stirred for another 15 min. The product was isolated by centrifuging at 3000 rpm. The precipitate was washed again in ethanol, and the supernatant liquid was collected. This process was repeated once more, and the resulting TGA-capped NCs were dispersed in THF. The amount of unbound TGA linker in the supernatant was determined by absorption spectroscopy, using a calibration curve established by measuring the absorbance of TGA solutions of known concentrations.
3.6. Preparation of the Nanoconjugate
One milliliter of stock suspension of Ga2O3 NCs in THF was placed in a 25 mL vial. Varying amounts of TGA-bound CdSe/CdS NCs (0–1 mL stock suspension) were added to these vials, and the mixture was diluted with additional THF to the final volume of 2 mL. These suspensions were left for 4 h and then characterized spectroscopically.
3.7. Spectroscopic Measurements
Absorption spectroscopy measurements were performed with a Varian Cary 5000 UV-vis-NIR spectrophotometer (Agilent Technologies, Santa Clara, CA, USA) using standard 1 cm path length quartz cuvettes. Photoluminescence spectra were collected with a Varian Cary Eclipse fluorescence spectrometer. Time-resolved PL measurements were performed with a Horiba Jobin Yvon iHR320 time-correlated single photon counting spectrometer (Edison, NJ, USA) using a 249 nm NanoLED and a Horiba Jobin Yvon TBX picosecond detector.
4. Conclusions
In summary, we demonstrated a new white light-emitting colloidal NC conjugate consisting of CdSe/CdS core/shell NCs connected to γ-Ga2O3 NCs via TGA. Owing to the short chain of TGA molecule, the NC conjugate is a donor-acceptor system undergoing FRET, where Ga2O3 NCs act as energy donors and CdSe/CdS NCs as energy acceptors. In spite of the direct excitation of the acceptor NCs, the FRET mechanism is evident through quenching of the donor PL, shortening of the donor emission lifetime, and an increase in the acceptor emission. The control of the CdSe/CdS NC excitation by simultaneous light absorption and energy transfer from Ga2O3 NCs allows for the control of the overall emission chromaticity of the NC conjugate, including the generation of the white light. The results of this work represent a step toward the design of all-inorganic white light emitting phosphors for various lighting applications.
Supplementary Materials
The following are available online at http://www.mdpi.com/2079-4991/6/2/32/s1. Figure S1: deconvoluted PL spectra of CdSe/CdS NCs, Figure S2: absorption spectrum of TGA, Figure S3: excitation spectra of CdSe/CdS NCs in the NC conjugate, Figure S4: CIE 1931 color space diagram for mixtures of non-linked CdSe/CdS and Ga2O3 NCs.
Acknowledgments
This research was supported by the Natural Sciences and Engineering Research Council of Canada (Idea to Innovation and Discovery grants), and Ontario Centres of Excellence (Project No. 20074). P.V.R. is Canada Research Chair in Spectroscopy of Nanoscale Materials.
Author Contributions
P.V.R. conceived and designed the experiments; P.C.S. performed the experiments and analyzed the data; P.V.R and P.C.S discussed the results and wrote the paper.
Conflicts of Interest
The authors declare no conflict of interest.
References
- Chen, O.; Wei, H.; Maurice, A.; Bawendi, M.; Reiss, P. Pure Colors from Core–Shell Quantum Dots. MRS Bull. 2013, 38, 696–702. [Google Scholar] [CrossRef]
- Peng, X.; Wickham, J.; Alivisatos, A.P. Kinetics of II–VI and III–V Colloidal Semiconductor Nanocrystal Growth: “Focusing” of Size Distributions. J. Am. Chem. Soc. 1998, 120, 5343–5344. [Google Scholar] [CrossRef]
- Medintz, I.L.; Uyeda, H.T.; Goldman, E.R.; Mattoussi, H. Quantum Dot Bioconjugates for Imaging, Labelling and Sensing. Nat. Mater. 2005, 4, 435–446. [Google Scholar] [CrossRef] [PubMed]
- Yao, W.-T.; Yu, S.-H. Synthesis of Semiconducting Functional Materials in Solution: From II–VI Semiconductor to Inorganic–Organic Hybrid Semiconductor Nanomaterials. Adv. Funct. Mater. 2008, 18, 3357–3366. [Google Scholar] [CrossRef]
- Agranovich, V.M.; Gartstein, Y.N.; Litinskaya, M. Hybrid Resonant Organic-Inorganic Nanostructures for Optoelectronic Applications. Chem. Rev. 2011, 111, 5179–5214. [Google Scholar] [CrossRef] [PubMed]
- Brown, L.R. World on the Edge: How to Prevent Environmental and Economic Collapse, 1st ed.; W.W. Norton & Company: New York, NY, USA, 2011. [Google Scholar]
- Khan, N.; Abas, N. Comparative Study of Energy Saving Light Sources. Renew. Sustain. Energy Rev. 2011, 15, 296–309. [Google Scholar] [CrossRef]
- Pimputkar, S.; Speck, J.S.; DenBaars, S.P.; Nakamura, S. Prospects for LED Lighting. Nat. Photonics 2009, 3, 180–182. [Google Scholar] [CrossRef]
- Ye, S.; Xiao, F.; Pan, Y.X.; Ma, Y.Y.; Zhang, Q.Y. Phosphors in Phosphor-Converted White Light-Emitting Diodes: Recent Advances in Materials, Techniques and Properties. Mater. Sci. Eng. 2010, 71, 1–34. [Google Scholar] [CrossRef]
- Krames, M.R.; Shchekin, O.B.; Mueller-Mach, R.; Mueller, G.O.; Zhou, L.; Harbers, G.; Craford, M.G. Status and Future of High-Power Light-Emitting Diodes for Solid-State Lighting. J. Disp. Technol. 2007, 3, 160–175. [Google Scholar] [CrossRef]
- Xie, R.-J.; Hirosaki, N.; Suehiro, T.; Xu, F.-F.; Mitomo, M. A Simple, Efficient Synthetic Route to Sr2Si5N8:Eu2+-Based Red Phosphors for White Light-Emitting Diodes. Chem. Mater. 2006, 18, 5578–5583. [Google Scholar] [CrossRef]
- Korthout, K.; Smet, P.F.; Poelman, D. Rare Earth Doped Core-Shell Particles as Phosphor for Warm-White Light Emitting Diodes. Appl. Phys. Lett. 2011, 98. [Google Scholar] [CrossRef]
- Chang, Y.; Sun, D.; Zhang, Z.; Zhang, Y.; Yao, X.; Jiang, D.; Yu, Y.; Mi, L.; Chen, L.; Zhong, H.; et al. High Color-Rendering-Index Hybrid White LEDs Employing CdSe/ZnS Core/Shell Quantum Dots. J. Nanosci. Nanotechnol. 2016, 16, 670–676. [Google Scholar] [CrossRef]
- Wang, T.; Chirmanov, V.; Chiu, W.H.M.; Radovanovic, P.V. Generating Tunable White Light by Resonance Energy Transfer in Transparent Dye-Conjugated Metal Oxide Nanocrystals. J. Am. Chem. Soc. 2013, 135, 14520–14523. [Google Scholar] [CrossRef] [PubMed]
- Layek, A.; Stanish, P.C.; Chirmanov, V.; Radovanovic, P.V. Hybrid ZnO-Based Nanoconjugate for Efficient and Sustainable White Light Generation. Chem. Mater. 2015, 27, 1021–1030. [Google Scholar] [CrossRef]
- Wang, T.; Farvid, S.S.; Abulikemu, M.; Radovanovic, P.V. Size-Tunable Phosphorescence in Colloidal Metastable γ-Ga2O3 Nanocrystals. J. Am. Chem. Soc. 2010, 132, 9250–9252. [Google Scholar] [CrossRef] [PubMed]
- Wang, T.; Radovanovic, P.V. Size-Dependent Electron Transfer and Trapping in Strongly Luminescent Colloidal Gallium Oxide Nanocrystals. J. Phys. Chem. C 2011, 115, 18473–18478. [Google Scholar] [CrossRef]
- Wang, T.; Radovanovic, P.V. In situ Enhancement of the Blue Photoluminescence of Colloidal Ga2O3 Nanocrystals by Promotion of Defect Formation in Reducing Conditions. Chem. Commun. 2011, 47, 7161–7163. [Google Scholar] [CrossRef] [PubMed]
- Farvid, S.S.; Wang, T.; Radovanovic, P.V. Colloidal Gallium Indium Oxide Nanocrystals: A Multifunctional Light-Emitting Phosphor Broadly Tunable by Alloy Composition. J. Am. Chem. Soc. 2011, 133, 6711–6719. [Google Scholar] [CrossRef] [PubMed]
- Chirmanov, V.; Stanish, P.C.; Layek, A.; Radovanovic, P.V. Distance-Dependent Energy Transfer between Ga2O3 Nanocrystal Defect States and Conjugated Organic Fluorophores in Hybrid White-Light-Emitting Nanophosphors. J. Phys. Chem. C 2015, 119, 5687–5696. [Google Scholar] [CrossRef]
- Yu, W.W.; Qu, L.; Guo, W.; Peng, X. Experimental Determination of the Extinction Coefficient of CdTe, CdSe, and CdS Nanocrystals. Chem. Mater. 2003, 15, 2854–2860. [Google Scholar] [CrossRef]
- Chen, O.; Zhao, J.; Chauhan, V.P.; Cui, J.; Wong, C.; Harris, D.K.; Wei, H.; Han, H.-S.; Fukumura, D.; Jain, R.K.; et al. Compact High-Quality CdSe–CdS Core–Shell Nanocrystals with Narrow Emission Linewidths and Suppressed Blinking. Nat. Mater. 2013, 12, 445–451. [Google Scholar] [CrossRef] [PubMed]
- Dibbell, R.S.; Watson, D.F. Distance-Dependent Electron Transfer in Tethered Assemblies of CdS Quantum Dots and TiO2 Nanoparticles. J. Phys. Chem. C 2009, 113, 3139–3149. [Google Scholar] [CrossRef]
- Zhu, H.; Hu, M.Z.; Shao, L.; Yu, K.; Dabestani, R.; Zaman, M.B.; Liao, S. Synthesis and Optical Properties of Thiol Functionalized CdSe/ZnS (Core/Shell) Quantum Dots by Ligand Exchange. J. Nanomater. 2014, 2014. [Google Scholar] [CrossRef]
- Jeong, S.; Achermann, M.; Nanda, J.; Ivanov, S.; Klimov, V.I.; Hollingsworth, J.A. Effect of the Thiol-Thiolate Equilibrium on the Photophysical Properties of Aqueous CdSe/ZnS Nanocrystal Quantum Dots. J. Am. Chem. Soc. 2005, 127, 10126–10127. [Google Scholar] [CrossRef] [PubMed]
- Reiss, P.; Protière, M.; Li, L. Core/Shell Semiconductor Nanocrystals. Small 2009, 5, 154–168. [Google Scholar] [CrossRef] [PubMed]
- Cantor, C.R.; Pechukas, P. Determination of Distance Distribution Functions by Singlet-Singlet Energy Transfer. Proc. Natl. Acad. Sci. USA 1971, 68, 2099–2101. [Google Scholar] [CrossRef] [PubMed]
- Clapp, A.R.; Medintz, I.L.; Mauro, J.M.; Fisher, B.R.; Bawendi, M.G.; Mattoussi, H. Fluorescence Resonance Energy Transfer between Quantum Dot Donors and Dye-Labeled Protein Acceptors. J. Am. Chem. Soc. 2004, 126, 301–310. [Google Scholar] [CrossRef] [PubMed]
- Hegde, M.; Wang, T.; Miskovic, Z.L.; Radovanovic, P.V. Origin of Size-Dependent Photoluminescence Decay Dynamics in Colloidal γ-Ga2O3 Nanocrystals. Appl. Phys. Lett. 2012, 100. [Google Scholar] [CrossRef]
- Clapp, A.R.; Medintz, I.L.; Mattoussi, H. Förster Resonance Energy Transfer Investigations Using Quantum-Dot Fluorophores. ChemPhysChem 2006, 7, 47–57. [Google Scholar] [CrossRef] [PubMed]
- Dworak, L.; Matylitsky, V.V.; Ren, T.; Basché, T.; Wachtveitl, J. Acceptor Concentration Dependence of Förster Resonance Energy Transfer Dynamics in Dye–Quantum Dot Complexes. J. Phys. Chem. C 2014, 118, 4396–4402. [Google Scholar] [CrossRef]
- Funston, A.M.; Jasieniak, J.J.; Mulvaney, P. Complete Quenching of CdSe Nanocrystal Photoluminescence by Single Dye Molecules. Adv. Mater. 2008, 20, 4274–4280. [Google Scholar] [CrossRef]
© 2016 by the authors; licensee MDPI, Basel, Switzerland. This article is an open access article distributed under the terms and conditions of the Creative Commons by Attribution (CC-BY) license (http://creativecommons.org/licenses/by/4.0/).