
High Performance Li4Ti5O12/Si Composite Anodes for Li-Ion Batteries


Abstract
:
1. Introduction
2. Results and Discussion

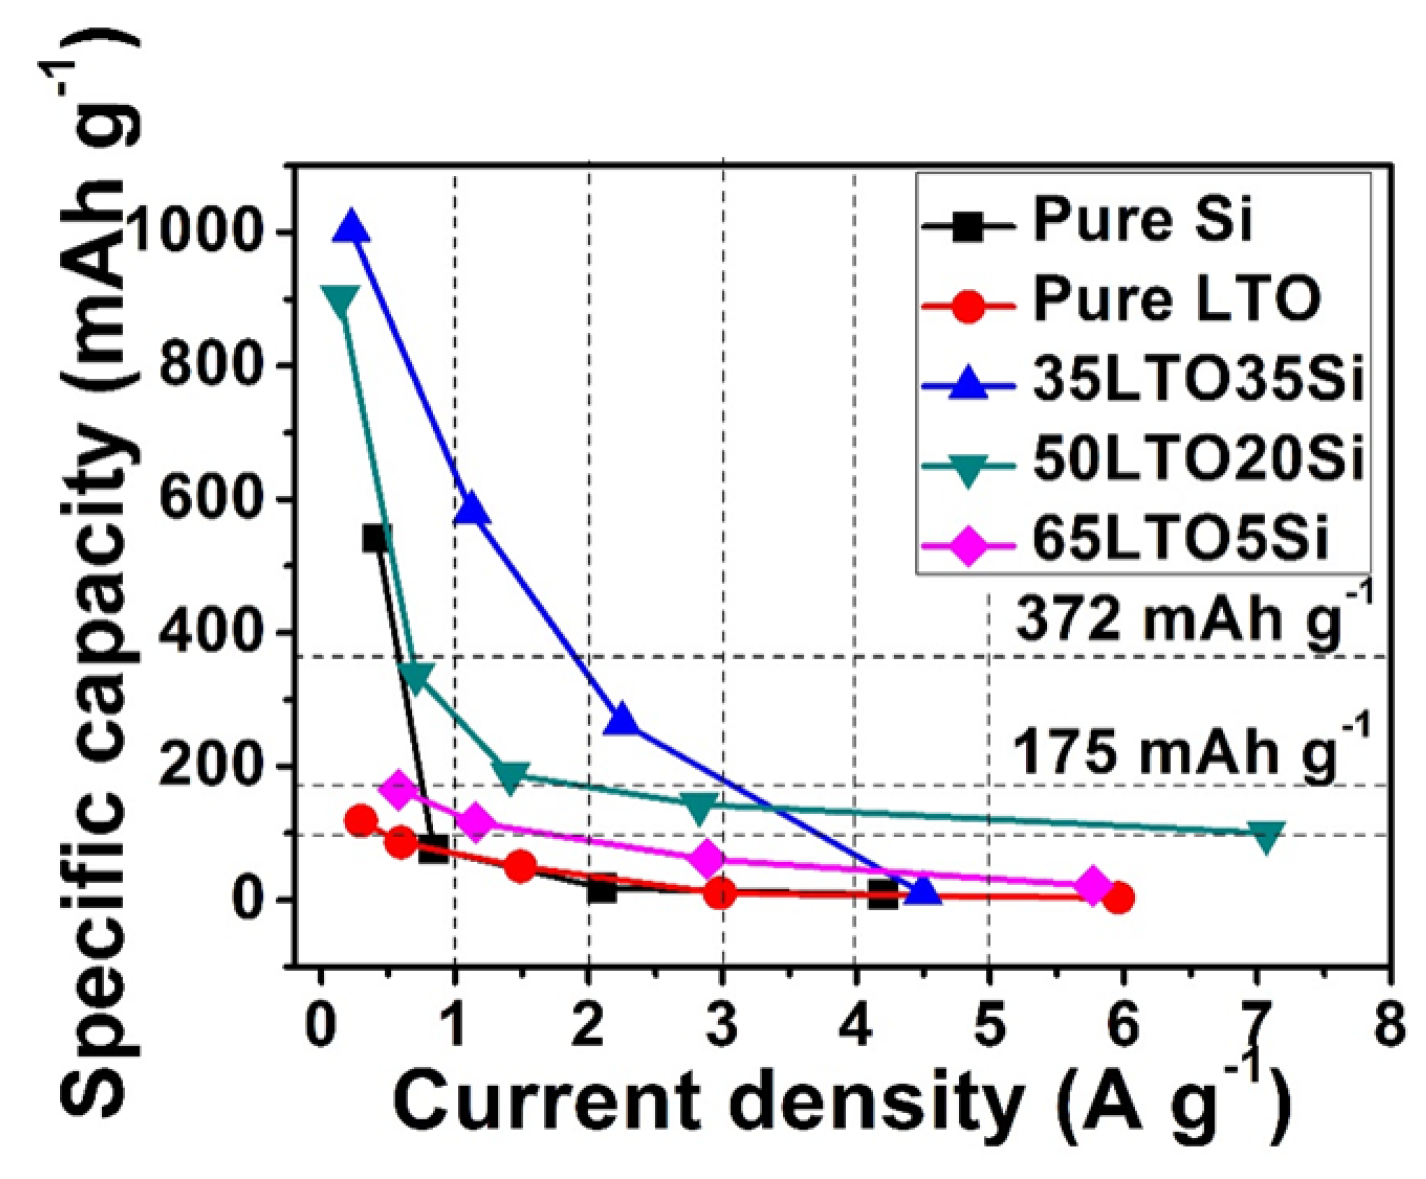
| Sample | Composition (wt %) | 1 C Current Density a (mA·g−1) | |||
|---|---|---|---|---|---|
| Si | LTO | PAA | Super P Li® | ||
| pure-LTO | 0 | 70 | 15 | 15 | 298 |
| 65LTO5Si | 5 | 65 | 15 | 15 | 577 |
| 50LTO20Si | 20 | 50 | 15 | 15 | 1413 |
| 35LTO35Si | 35 | 35 | 15 | 15 | 2249 |
| pure-Si | 70 | 0 | 15 | 15 | 4200 |
3. Experimental Section
3.1. Sample Preparation and Characterization
3.2. Electrochemical Characterization
4. Conclusions
Acknowledgments
Author Contributions
Conflicts of Interest
References
- Tarascon, J.M.; Armand, M. Issues and challenges facing rechargeable lithium batteries. Nature 2001, 414, 359–367. [Google Scholar] [CrossRef] [PubMed]
- Goodenough, J.B.; Kim, Y. Challenges for rechargeable Li batteries. Chem. Mater. 2009, 22, 587–603. [Google Scholar] [CrossRef]
- Bruce, P.G.; Scrosati, B.; Tarascon, J.M. Nanomaterials for rechargeable lithium batteries. Angew. Chem. Int. Ed. 2008, 47, 2930–2946. [Google Scholar] [CrossRef] [PubMed]
- Li, X.; Wang, C. Engineering nanostructured anodes via electrostatic spray deposition for high performance lithium ion battery application. J. Mater. Chem. A 2013, 1, 165–182. [Google Scholar] [CrossRef]
- Sun, X.; Yan, C.; Chen, Y.; Si, W.; Deng, J.; Oswald, S.; Liu, L.; Schmidt, O.G. Three-dimensionally “curved” NiO nanomembranes as ultrahigh rate capability anodes for Li-ion batteries with long cycle lifetimes. Adv. Energy Mater. 2014, 4. [Google Scholar] [CrossRef]
- Feckl, J.M.; Fominykh, K.; Doblinger, M.; Fattakhova-Rohlfing, D.; Bein, T. Nanoscale porous framework of lithium titanate for ultrafast lithium insertion. Angew. Chem. Int. Ed. 2012, 51, 7459–7463. [Google Scholar] [CrossRef] [PubMed]
- Wagemaker, M.; Simon, D.R.; Kelder, E.M.; Schoonman, J.; Ringpfeil, C.; Haake, U.; Lützenkirchen-Hecht, D.; Frahm, R.; Mulder, F.M. A kinetic two-phase and equilibrium solid solution in spinel Li4+xTi5O12. Adv. Mater. 2006, 18, 3169–3173. [Google Scholar] [CrossRef]
- Kim, C.; Norberg, N.S.; Alexander, C.T.; Kostecki, R.; Cabana, J. Mechanism of phase propagation during lithiation in carbon-free Li4Ti5O12 battery electrodes. Adv. Funct. Mater. 2013, 23, 1214–1222. [Google Scholar] [CrossRef]
- Wagemaker, M.; van Eck, E.R.H.; Kentgens, A.P.M.; Mulder, F.M. Li-ion diffusion in the equilibrium nanomorphology of spinel Li4+xTi5O12. J. Phys. Chem. B 2009, 113, 224–230. [Google Scholar] [CrossRef] [PubMed]
- Zhao, Y.; Pang, S.; Zhang, C.; Zhang, Q.; Gu, L.; Zhou, X.; Li, G.; Cui, G. Nitridated mesoporous Li4Ti5O12 spheres for high-rate lithium-ion batteries anode material. J. Solid State Electrochem. 2013, 17, 1479–1485. [Google Scholar] [CrossRef]
- Liu, J.; Song, K.; van Aken, P.A.; Maier, J.; Yu, Y. Self-supported Li4Ti5O12–C nanotube arrays as high-rate and long-life anode materials for flexible Li-ion batteries. Nano Lett. 2014, 14, 2597–2603. [Google Scholar] [CrossRef] [PubMed]
- Zhao, L.; Hu, Y.; Li, H.; Wang, Z.; Chen, L. Porous Li4Ti5O12 coated with N-doped carbon from ionic liquids for Li-ion batteries. Adv. Mater. 2011, 23, 1385–1388. [Google Scholar] [CrossRef] [PubMed]
- Jung, H.; Myung, S.; Yoon, C.S.; Son, S.; Oh, K.H.; Amine, K.; Scrosati, B.; Sun, Y. Microscale spherical carbon-coated Li4Ti5O12 as ultra high power anode material for lithium batteries. Energy Environ. Sci. 2011, 4, 1345–1351. [Google Scholar] [CrossRef]
- Hao, Y.; Lai, Q.; Lu, J.; Ji, X. Effects of dopant on the electrochemical properties of Li4Ti5O12 anode materials. Ionics 2007, 13, 369–373. [Google Scholar] [CrossRef]
- Ji, S.; Zhang, J.; Wang, W.; Huang, Y.; Feng, Z.; Zhang, Z.; Tang, Z. Preparation and effects of Mg-doping on the electrochemical properties of spinel Li4Ti5O12 as anode material for lithium ion battery. Mater. Chem. Phys. 2010, 123, 510–515. [Google Scholar] [CrossRef]
- Borghols, W.J.H.; Wagemaker, M.; Lafont, U.; Kelder, E.M.; Mulder, F.M. Size effects in the Li4+xTi5O12spinel. J. Am. Chem. Soc. 2009, 131, 17786–17792. [Google Scholar] [CrossRef] [PubMed]
- Ganapathy, S.; Wagemaker, M. Nanosize storage properties in spinel Li4Ti5O12 explained by anisotropic surface lithium insertion. ACS Nano 2012, 6, 8702–8712. [Google Scholar] [CrossRef] [PubMed]
- Yu, L.; Wu, H.B.; Lou, X.W. Mesoporous Li4Ti5O12 hollow spheres with enhanced lithium storage capability. Adv. Mater. 2013, 25, 2296–2300. [Google Scholar] [CrossRef] [PubMed]
- Shen, L.; Yuan, C.; Luo, H.; Zhang, X.; Xu, K.; Zhang, F. In situ growth of Li4Ti5O12 on multi-walled carbon nanotubes: Novel coaxial nanocables for high rate lithium ion batteries. J. Mater. Chem. 2011, 21, 761–767. [Google Scholar] [CrossRef]
- Shen, L.; Yuan, C.; Luo, H.; Zhang, X.; Yang, S.; Lu, X. In situ synthesis of high-loading Li4Ti5O12–graphene hybrid nanostructures for high rate lithium ion batteries. Nanoscale 2011, 3, 572–574. [Google Scholar] [CrossRef] [PubMed]
- Shen, L.; Uchaker, E.; Zhang, X.; Cao, G. Hydrogenated Li4Ti5O12 nanowire arrays for high rate lithium ion batteries. Adv. Mater. 2012, 24, 6502–6506. [Google Scholar] [CrossRef] [PubMed]
- Zhong, Z.; Ouyang, C.; Shi, S.; Lei, M. Ab initio studies on Li4+xTi5O12 compounds as anode materials for lithium-ion batteries. ChemPhysChem 2008, 9, 2104–2108. [Google Scholar] [CrossRef] [PubMed]
- Ge, H.; Li, N.; Li, D.; Dai, C.; Wang, D. Electrochemical characteristics of spinel Li4Ti5O12 discharged to 0.01 V. Electrochem. Commun. 2008, 10, 719–722. [Google Scholar] [CrossRef]
- Zhu, Y.; Yin, L.; Yi, T.; Liu, H.; Xie, Y.; Zhu, R. Electrochemical performance and lithium-ion intercalation kinetics of submicron-sized Li4Ti5O12anode material. J. Alloys Compd. 2013, 547, 107–112. [Google Scholar] [CrossRef]
- Sivashanmugam, A.; Gopukumar, S.; Thirunakaran, R.; Nithya, C.; Prema, S. Novel Li4Ti5O12/Sn nano-composites as anode material for lithium ion batteries. Mater. Res. Bull. 2011, 46, 492–500. [Google Scholar] [CrossRef]
- Wang, Y.; Hao, Y.; Lai, Q.; Lu, J.; Chen, Y.; Ji, X. A new composite material Li4Ti5O12–SnO2 for lithium-ion batteries. Ionics 2008, 14, 85–88. [Google Scholar] [CrossRef]
- Zhu, J.; Yang, G.; Zhao, J.; Wang, Q.; Yang, H. Synthesis and electrochemical properties of Li4Ti5O12/CuO anode material for Li-ion batteries. Adv. Mater. Res. 2011, 279, 77–82. [Google Scholar] [CrossRef]
- Chen, M.; Li, W.; Shen, X.; Diao, G. Fabrication of core–shell α-Fe2O3@Li4Ti5O12 composite and its application in the lithium ion batteries. ACS Appl. Mater. Interfaces 2014, 6, 4514–4523. [Google Scholar] [CrossRef] [PubMed]
- Chan, C.K.; Peng, H.; Liu, G.; McIlwrath, K.; Zhang, X.; Huggins, R.A.; Cui, Y. High-performance lithium battery anodes using silicon nanowires. Nat. Nanotechnol. 2007, 3, 31–35. [Google Scholar] [CrossRef] [PubMed]
- Zhang, L.; Deng, J.; Liu, L.; Si, W.; Oswald, S.; Xi, L.; Kundu, M.; Ma, G.; Gemming, T.; Baunack, S.; et al. Hierarchically designed SiOx/SiOy bilayer nanomembranes as stable anodes for lithium ion batteries. Adv. Mater. 2014, 26, 4527–4532. [Google Scholar] [CrossRef] [PubMed]
- Deng, J.; Ji, H.; Yan, C.; Zhang, J.; Si, W.; Baunack, S.; Oswald, S.; Mei, Y.; Schmidt, O.G. Naturally rolled-up C/Si/C trilayer nanomembranes as stable anodes for lithium-ion batteries with remarkable cycling performance. Angew. Chem. 2013, 125, 2382–2386. [Google Scholar] [CrossRef]
- Chen, W.; Fan, Z.; Dhanabalan, A.; Chen, C.; Wang, C. Mesoporous silicon anodes prepared by magnesiothermic reduction for lithium ion batteries. J. Electrochem. Soc. 2011, 158, 1055–1059. [Google Scholar] [CrossRef]
- Chen, W.; Jiang, N.; Fan, Z.; Dhanabalan, A.; Chen, C.; Li, Y.; Yang, M.; Wang, C. Facile synthesis of silicon films by photosintering as anode materials for lithium-ion batteries. J. Power Sources 2012, 214, 21–27. [Google Scholar] [CrossRef]
- Lin, Y.; Yang, Y.; Lin, Y.; Zhao, G.; Zhou, T.; Huang, Z. Effects of amorphous silicon film on elevated-temperature cycle performance of Li4Ti5O12 for lithium ion battery. Int. J. Electrochem. Sci. 2011, 6, 5588–5596. [Google Scholar]
- Chan, C.K.; Ruffo, R.; Hong, S.S.; Huggins, R.A.; Cui, Y. Structural and electrochemical study of the reaction of lithium with silicon nanowires. J. Power Sources 2009, 189, 34–39. [Google Scholar] [CrossRef]
- Shin, H.C.; Corno, J.A.; Gole, J.L.; Liu, M. Porous silicon negative electrodes for rechargeable lithium batteries. J. Power Sources 2005, 139, 314–320. [Google Scholar] [CrossRef]
- Hsieh, C.T.; Lin, J.Y. Influence of Li addition on charge/discharge behavior of spinel lithium titanate. J. Alloys Comp. 2010, 506, 231–236. [Google Scholar] [CrossRef]
- Liu, J.; Li, X.; Ci, M.; Li, R.; Sun, X. Ultrathin atomic layer deposited ZrO2 coating to enhance the electrochemical performance of Li4Ti5O12 as an anode material. Electrochim. Acta 2013, 93, 195–201. [Google Scholar] [CrossRef]
- Meng, X.; Liu, J.; Li, X.; Banis, M.N.; Yang, J.; Li, R.; Sun, X. Atomic layer deposited Li4Ti5O12on nitrogen-doped carbon nanotubes. RSC Adv. 2013, 3, 7285–7288. [Google Scholar] [CrossRef]
- Sun, Q.; Zhang, B.; Fu, Z.W. Lithium electrochemistry of SiO2 thin film electrode for lithium-ion batteries. Appl. Surf. Sci. 2008, 254, 3774–3779. [Google Scholar] [CrossRef]
- Favors, Z.; Wang, W.; Bay, H.H.; George, A.; Ozkan, M.; Ozkan, C.S. Stable cycling of SiO2 nanotubes as high-performance anodes for lithium-ion batteries. Sci. Rep. 2014, 4. [Google Scholar] [CrossRef] [PubMed]
© 2015 by the authors; licensee MDPI, Basel, Switzerland. This article is an open access article distributed under the terms and conditions of the Creative Commons Attribution license (http://creativecommons.org/licenses/by/4.0/).
Share and Cite
Chen, C.; Agrawal, R.; Wang, C. High Performance Li4Ti5O12/Si Composite Anodes for Li-Ion Batteries. Nanomaterials 2015, 5, 1469-1480. https://doi.org/10.3390/nano5031469
Chen C, Agrawal R, Wang C. High Performance Li4Ti5O12/Si Composite Anodes for Li-Ion Batteries. Nanomaterials. 2015; 5(3):1469-1480. https://doi.org/10.3390/nano5031469
Chicago/Turabian StyleChen, Chunhui, Richa Agrawal, and Chunlei Wang. 2015. "High Performance Li4Ti5O12/Si Composite Anodes for Li-Ion Batteries" Nanomaterials 5, no. 3: 1469-1480. https://doi.org/10.3390/nano5031469
APA StyleChen, C., Agrawal, R., & Wang, C. (2015). High Performance Li4Ti5O12/Si Composite Anodes for Li-Ion Batteries. Nanomaterials, 5(3), 1469-1480. https://doi.org/10.3390/nano5031469