3.2.1. Silver Sulfide Nanoparticles
Ag
2S is a semiconductor with a narrow band gap of 1.08 eV [
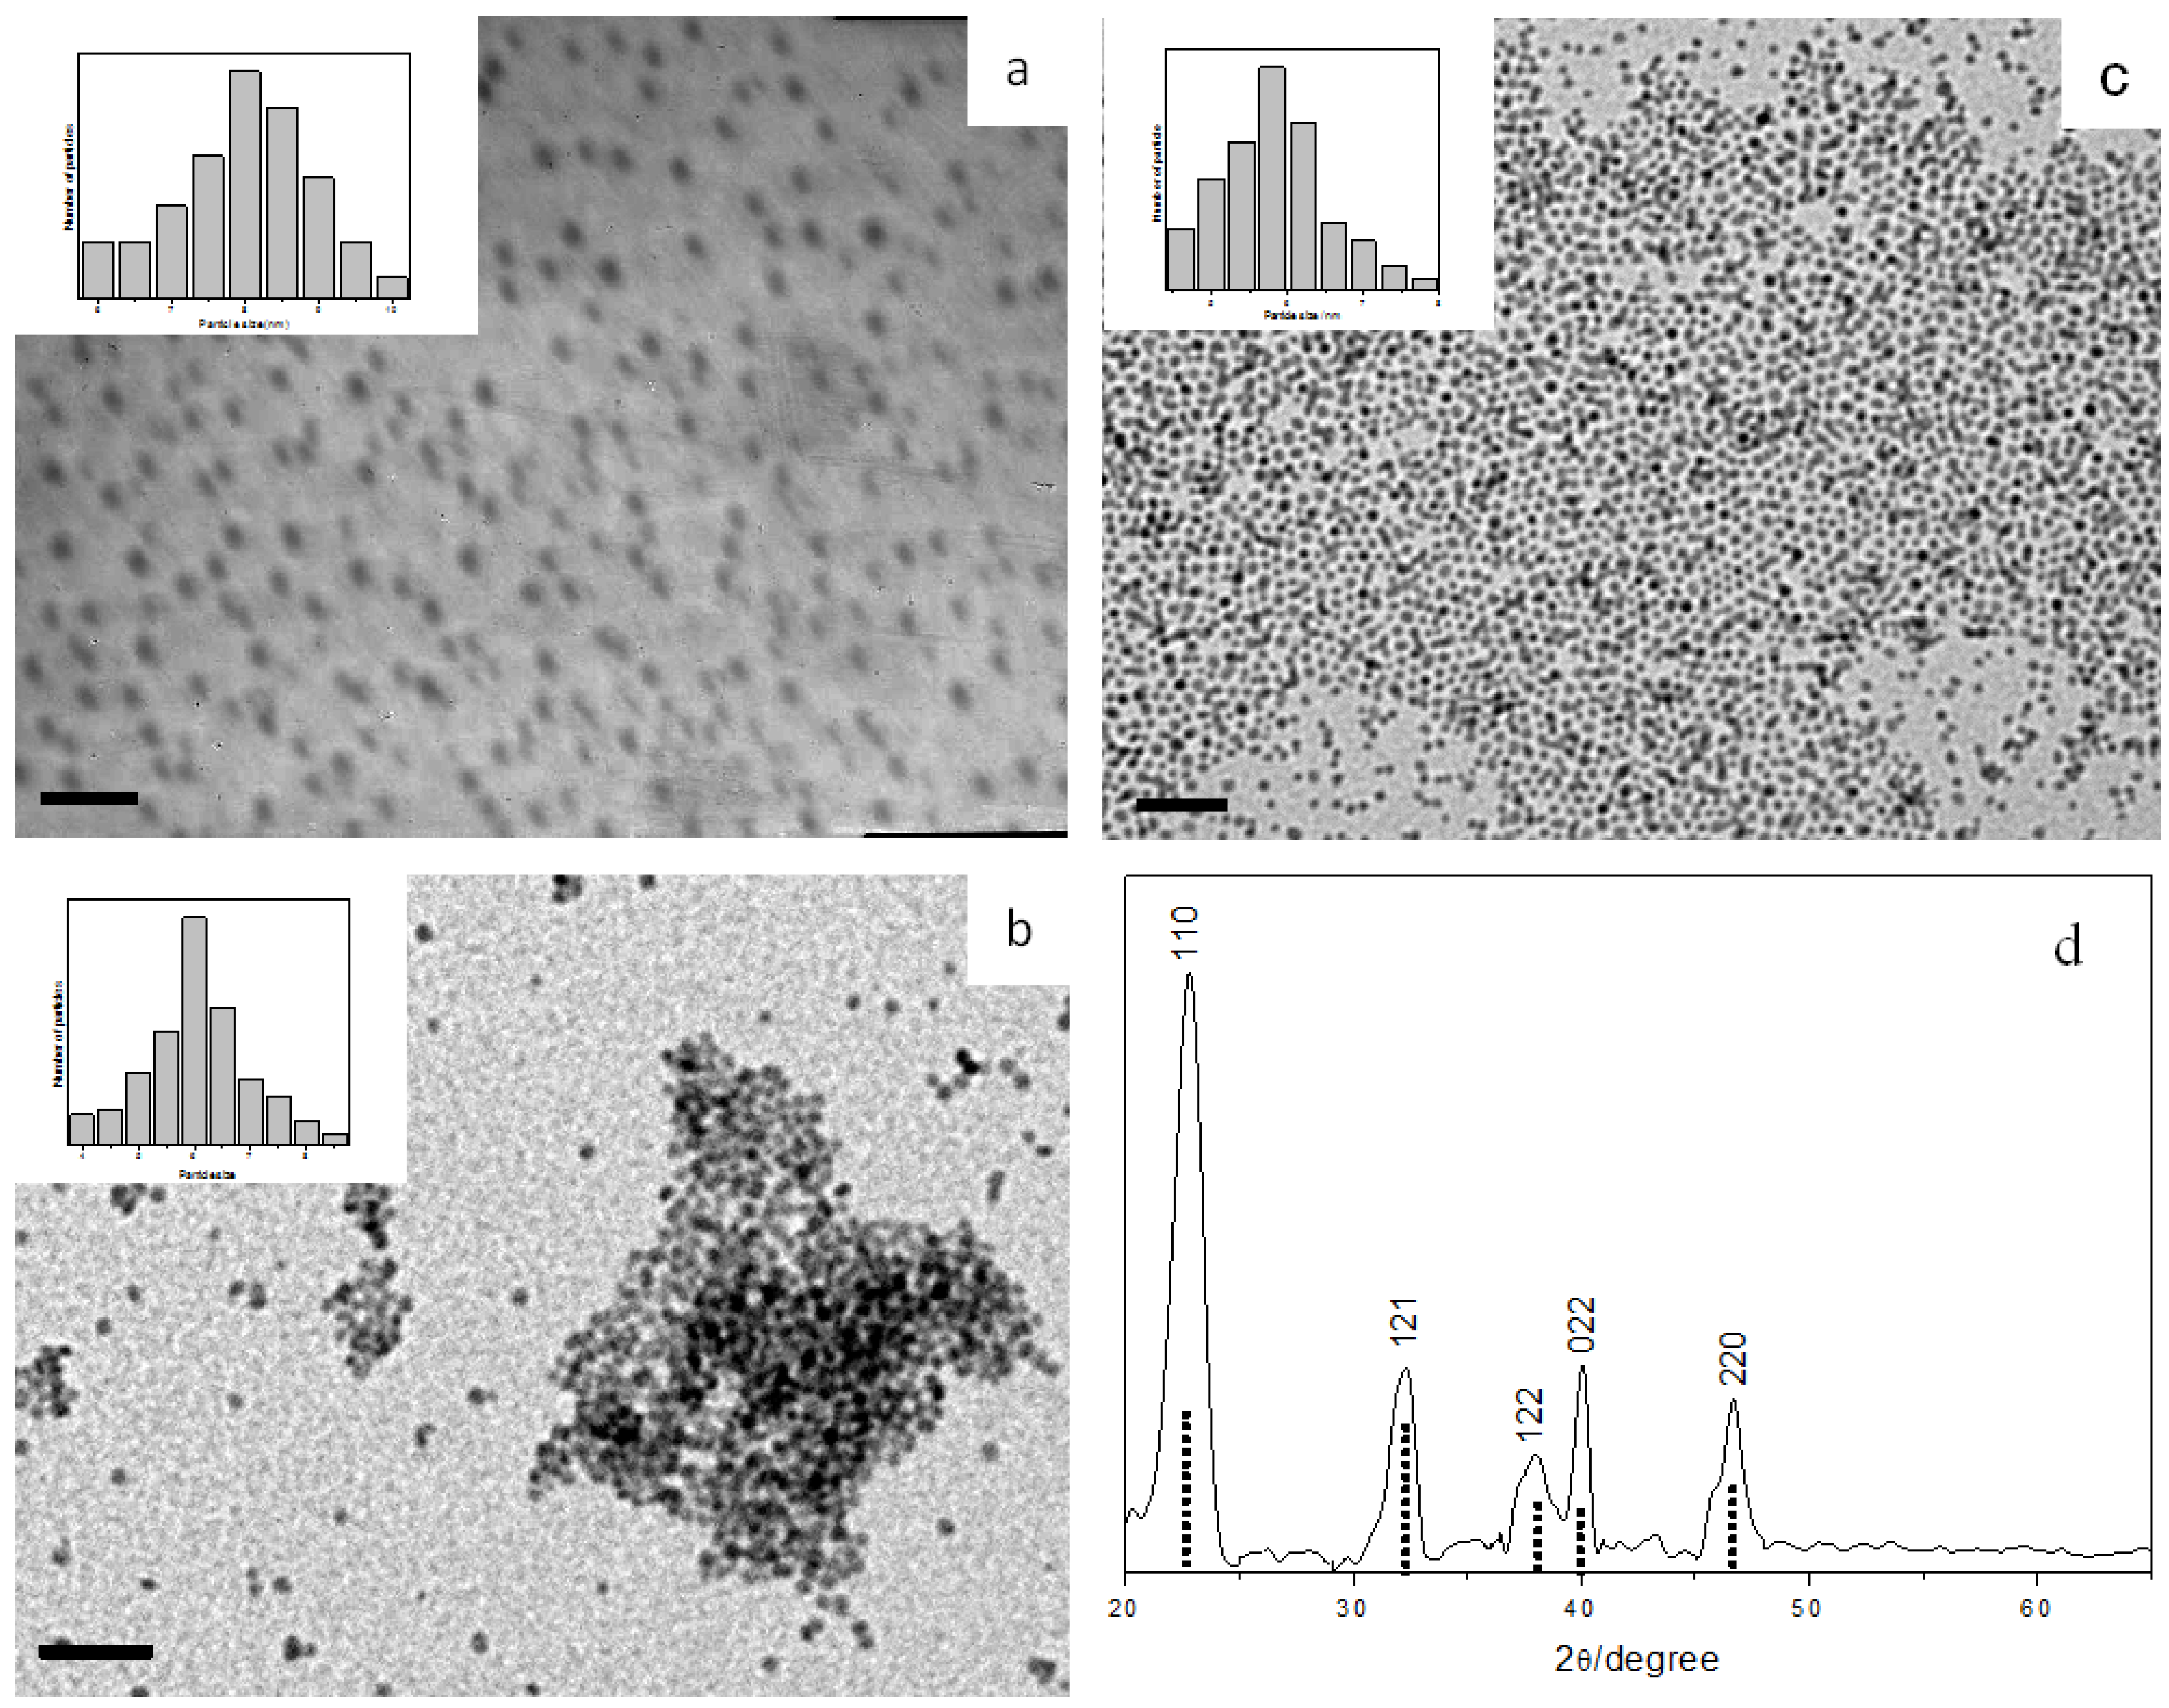
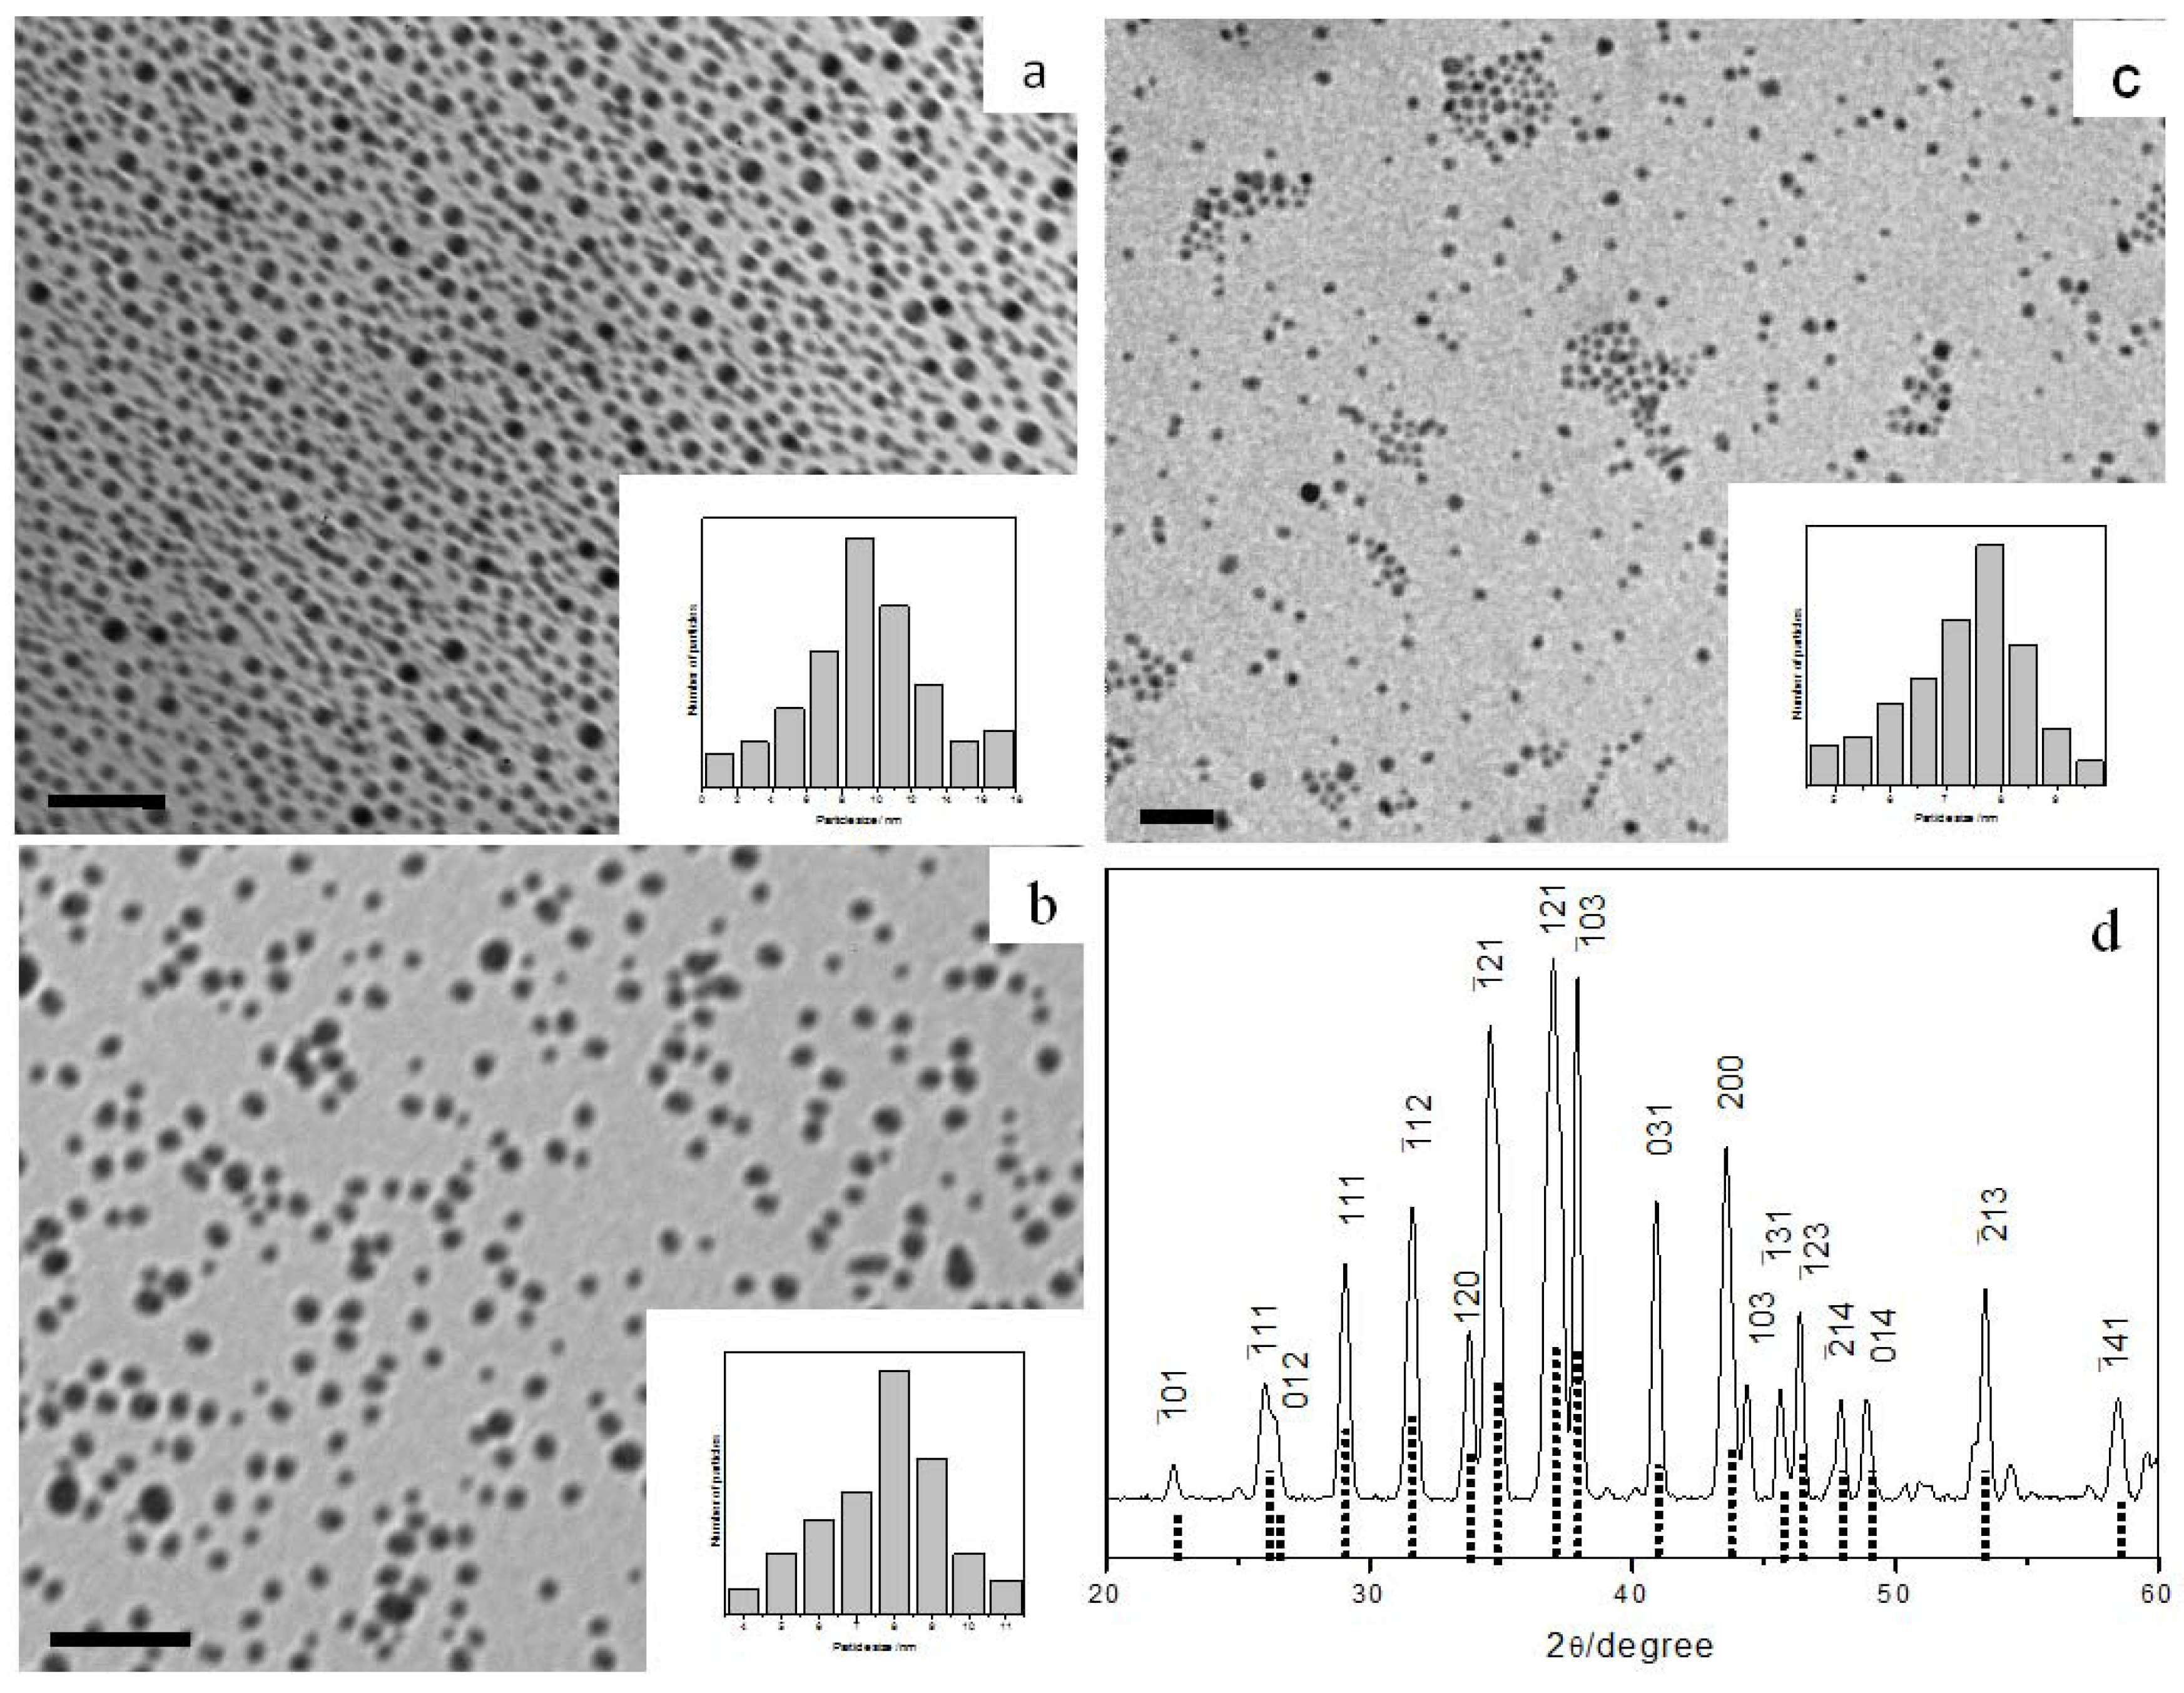
34]. When AgTB precursor was stirred with octylamine (OA) in toluene at room temperature, monodispersed Ag
2S nanocrystals can be isolated after 3 hours (
Figure 2a). Typical XRD pattern of the nanoparticles prepared from AgTB is shown in
Figure 2d. The diffraction pattern revealed good monoclinic crystallinity and fitted well with the α-phase of bulk Ag
2S (JCPDS 14-72). This is known to be the stable silver sulfide phase which commonly exists at room temperature.
The same α-phase silver sulfide nanocrystals were obtained when the reaction was carried out using other amines such as dodecylamine (DDA) and oleylamine (OLA). TEM analysis showed that spherical nanoparticles with reasonable size distribution were produced at room temperature in all these cases. The Ag
2S nanocrystals obtained from different amines, however, are slightly different in sizes as shown by the size histograms in
Figure 2a–c. Thus, average particle diameters of 9.2 ± 1.9, 8.3 ± 1.5 and 7.5 ± 0.9 nm are obtained for reaction with OA, DDA and OLA respectively. In conclusion, the Ag
2S particle sizes can be controlled by varying the chain length of the alkylamine used, and longer-chain amines tend to produce smaller-sized particles.
Figure 2.
TEM images and size histograms of Ag2S nanoparticles prepared with different amines: (a) octylamine, (b) dodecylamine, and (c) oleylamine; all scale bar = 50 nm. (d) XRD pattern of the monoclinic Ag2S nanoparticles prepared. The standard pattern of α-phase Ag2S (JCPDS 14-72) is shown as dotted lines below the pattern.
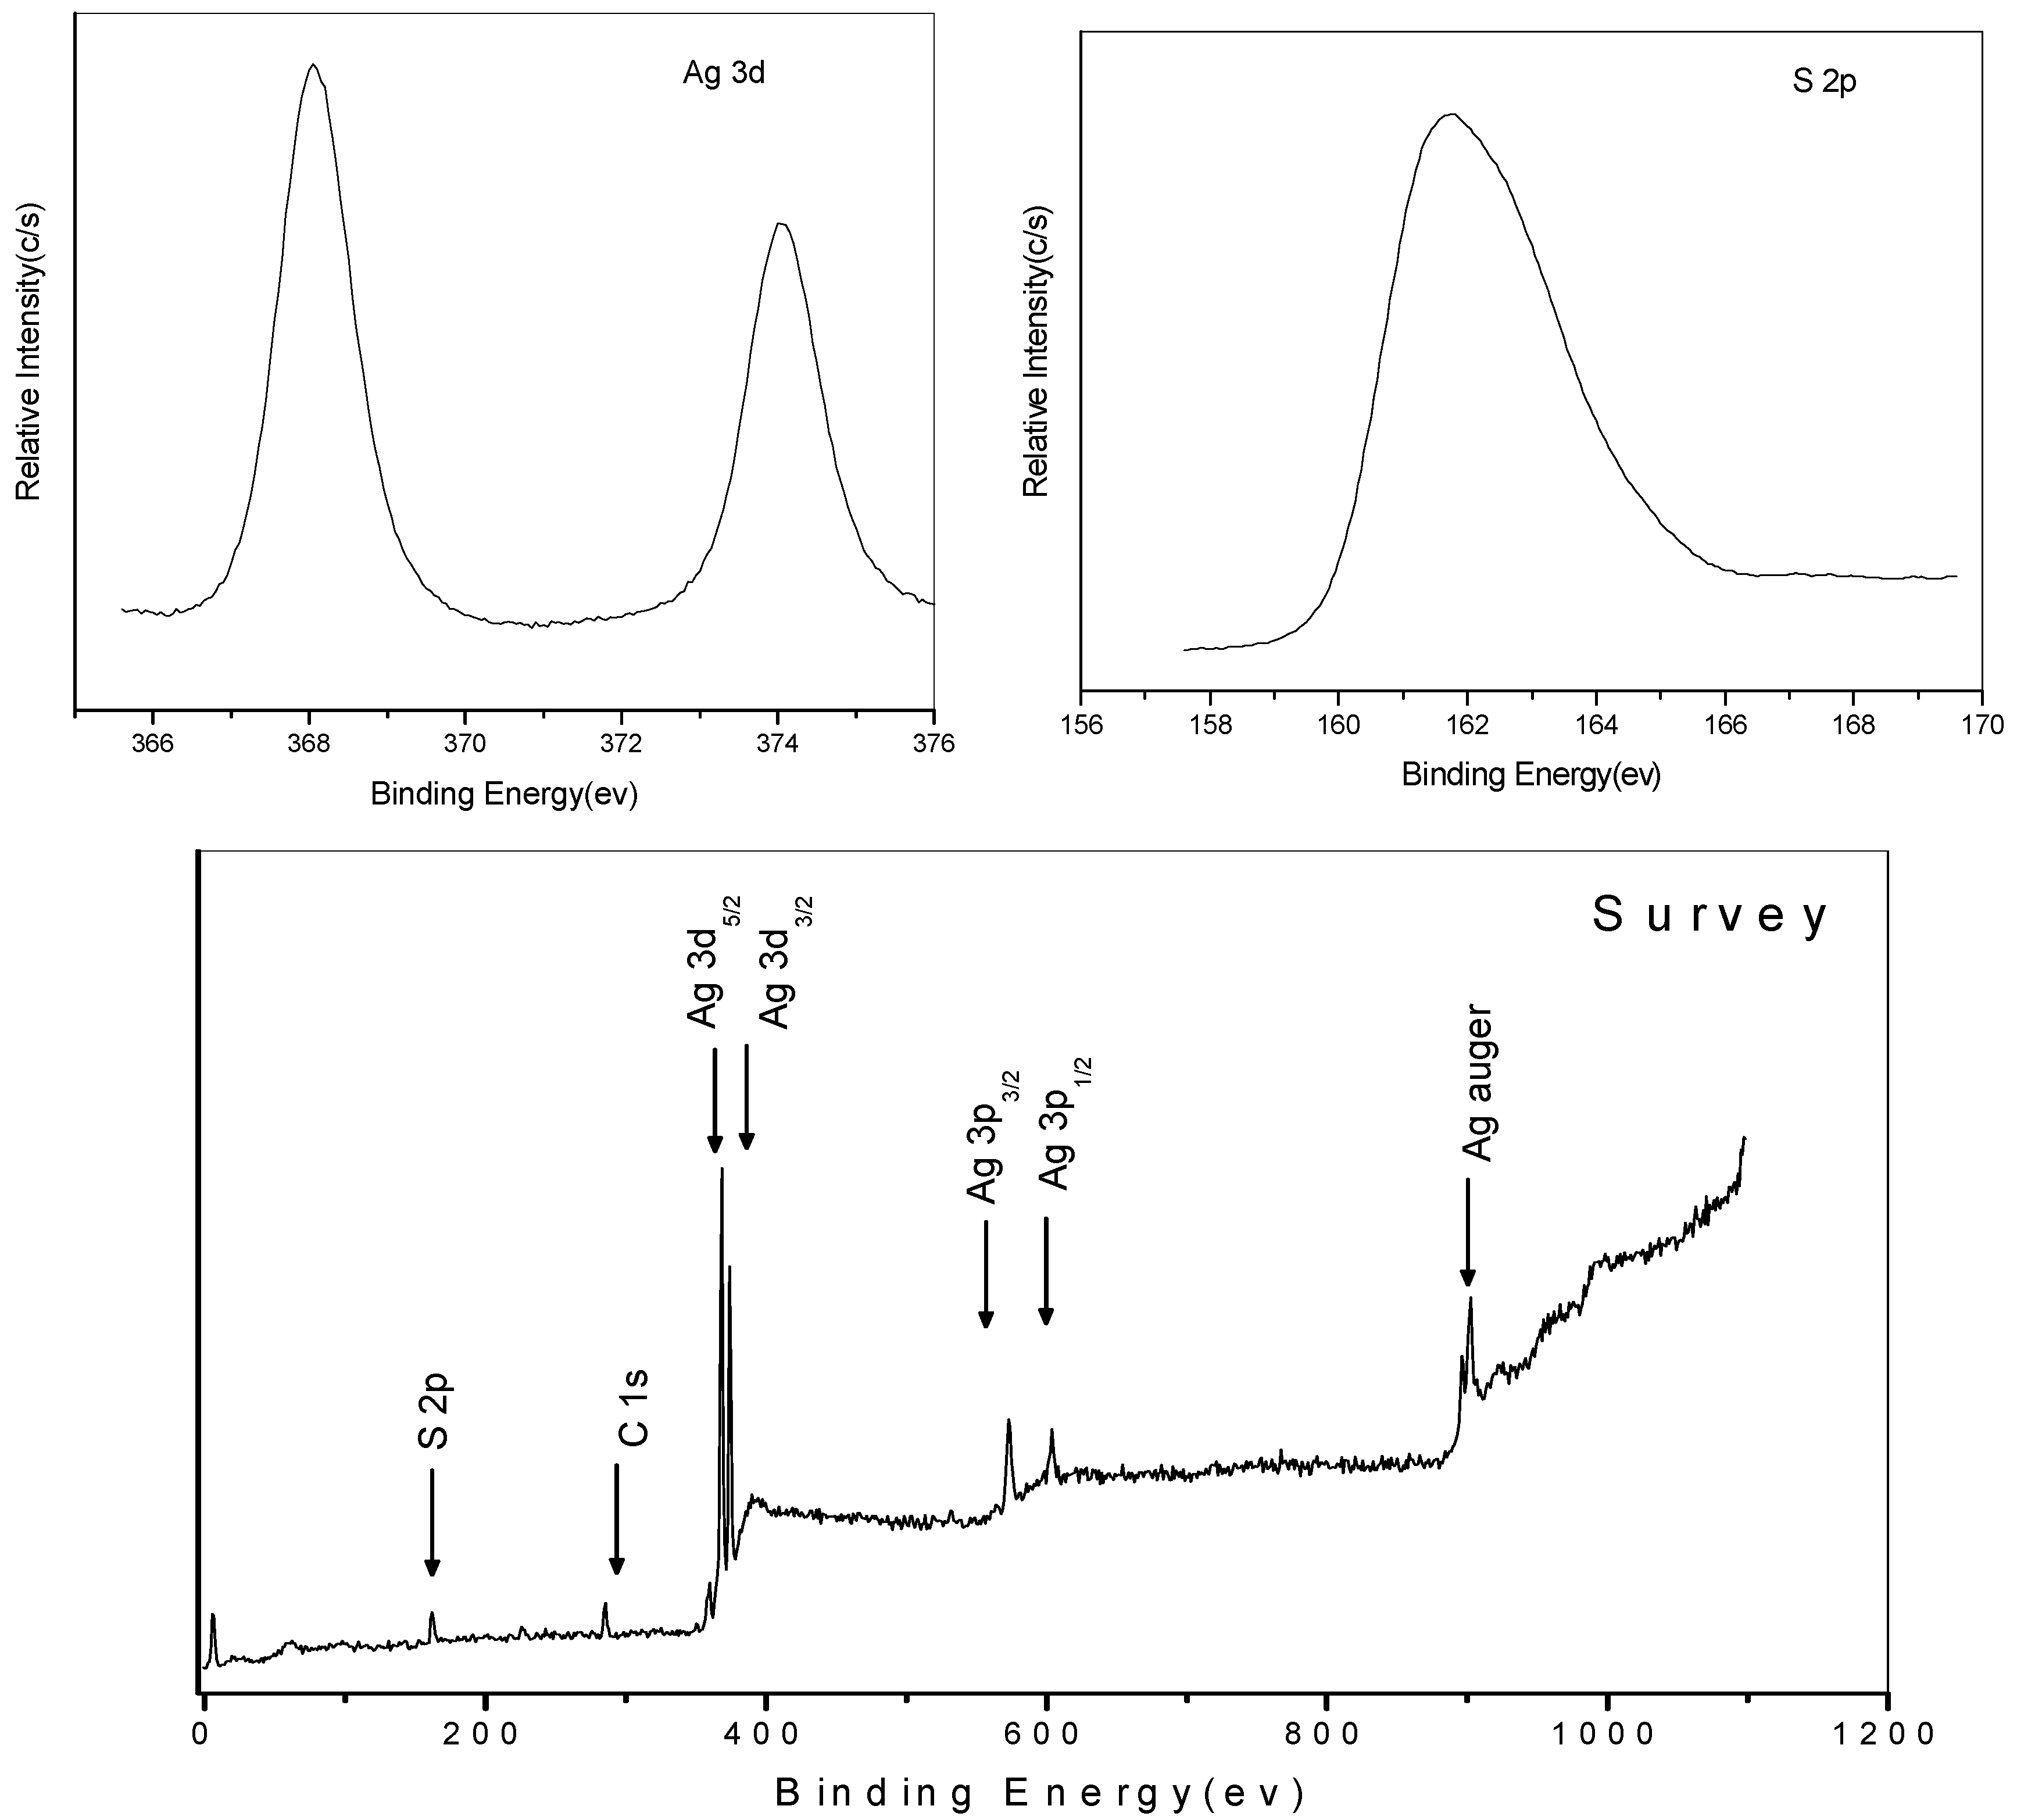
Typical XPS spectra of the Ag
2S nanocrystals are shown in
Figure 3, with binding energies corrected with reference to the C 1s peak at 284.7 eV. The doublet arising from Ag 3d
5/2 and 3d
3/2 was detected at 368.0 and 374.1 eV respectively, while the S 2p photoelectron peak appears at 161.7 eV. These values are close to those of bulk Ag
2S [
35]. There is no O 1s peak (531.0 eV) detected on the spectrum, indicating that there is no by-product such as Ag
2SO
4 (368.3 eV) or Ag
2O (368.4 eV) produced. Peak area analysis of the Ag 3d
5/2 and S 2p peaks, after accounting for elemental sensitivity factors, gives an elemental ratio of 1.97:1 for Ag to S.
Figure 3.
(Bottom) XPS survey scan, (Top, Left to Right) Ag 3d and S 2p elemental photoelectron peaks of nanocrystalline Ag2S.
Figure 3.
(Bottom) XPS survey scan, (Top, Left to Right) Ag 3d and S 2p elemental photoelectron peaks of nanocrystalline Ag2S.
3.2.2. Copper Sulfide Nanoparticles
Similarly, we found that CuTB precursors readily decompose by reacting with alkylamines at room temperature to give uniform Cu
2−xS nanoparticles. TEM analysis (
Figure 4a–c) indicated average diameters of 8.1 ± 1.1, 6.1 ± 0.5 and 5.8 ± 0.4 nm for the nanoparticles produced from OA, dioctylamine (DOA) and OLA, respectively.
It is well known that copper sulfides exist in many different phases and compositions (Cu
xS, x: 1 → 2). Non-stoichiometric copper sulfide is readily formed and has been utilized as superionic conductor or p-type semiconductor. XPS peak area analysis gave an elemental Cu to S ratio of 1.72:1 for our samples, thus corresponding to x ~0.28 in the Cu
2−xS general formula. The XRD pattern in
Figure 4d clearly revealed the rhombohedral structure, which fits well with the standard bulk Cu
2−xS phase (JCPDS 85-1693).
Figure 4.
TEM images and size histograms of Cu2−xS nanoparticles prepared with different amines: (a) octylamine (OA), (b) dioctylamine (DOA), and (c) oleylamine (OLA); all scale bar = 50 nm. (d) XRD pattern of the rhombohedral Cu2−xS nanoparticles prepared. The standard pattern of JCPDS 85-1693 Cu2−xS phase is shown as dotted lines.
While DOA also reacts with CuTB to produce copper sulfide nanoparticles at room temperature, we notice that the growth rate is slightly slower and the particles produced are smaller than those prepared with primary amine (i.e., OA). We believe that, since OA is less bulky compared to DOA, it attacks the precursor with less hindrance and thus causes the reaction to occur at a faster rate. In addition, DOA is expected to play a better role to efficiently prevent the nanoparticles from aggregation and thus will tend to produce smaller particles. On the other hand, our experiments confirmed that tri-substituted amine does not result in the formation of Cu2−xS, probably due to its bulkiness.
3.2.3. Indium Sulfide Nanoparticles
β-In
2S
3 is an n-type semiconductor with a band gap of 2.0–2.2 eV [
36]. It has promising applications in the preparation of green and red phosphors for photoconductors and photovoltaics [
37,
38,
39]. In addition, it can serve as a host for a number of metal ions to form semiconducting and/or magnetic materials. In
2S
3 nanocrystals have not received as much attention so far, due to the lack of a straightforward preparation methodology. In this case, we have successfully prepared these nanoparticles by decomposing InTB precursor in alkylamines.
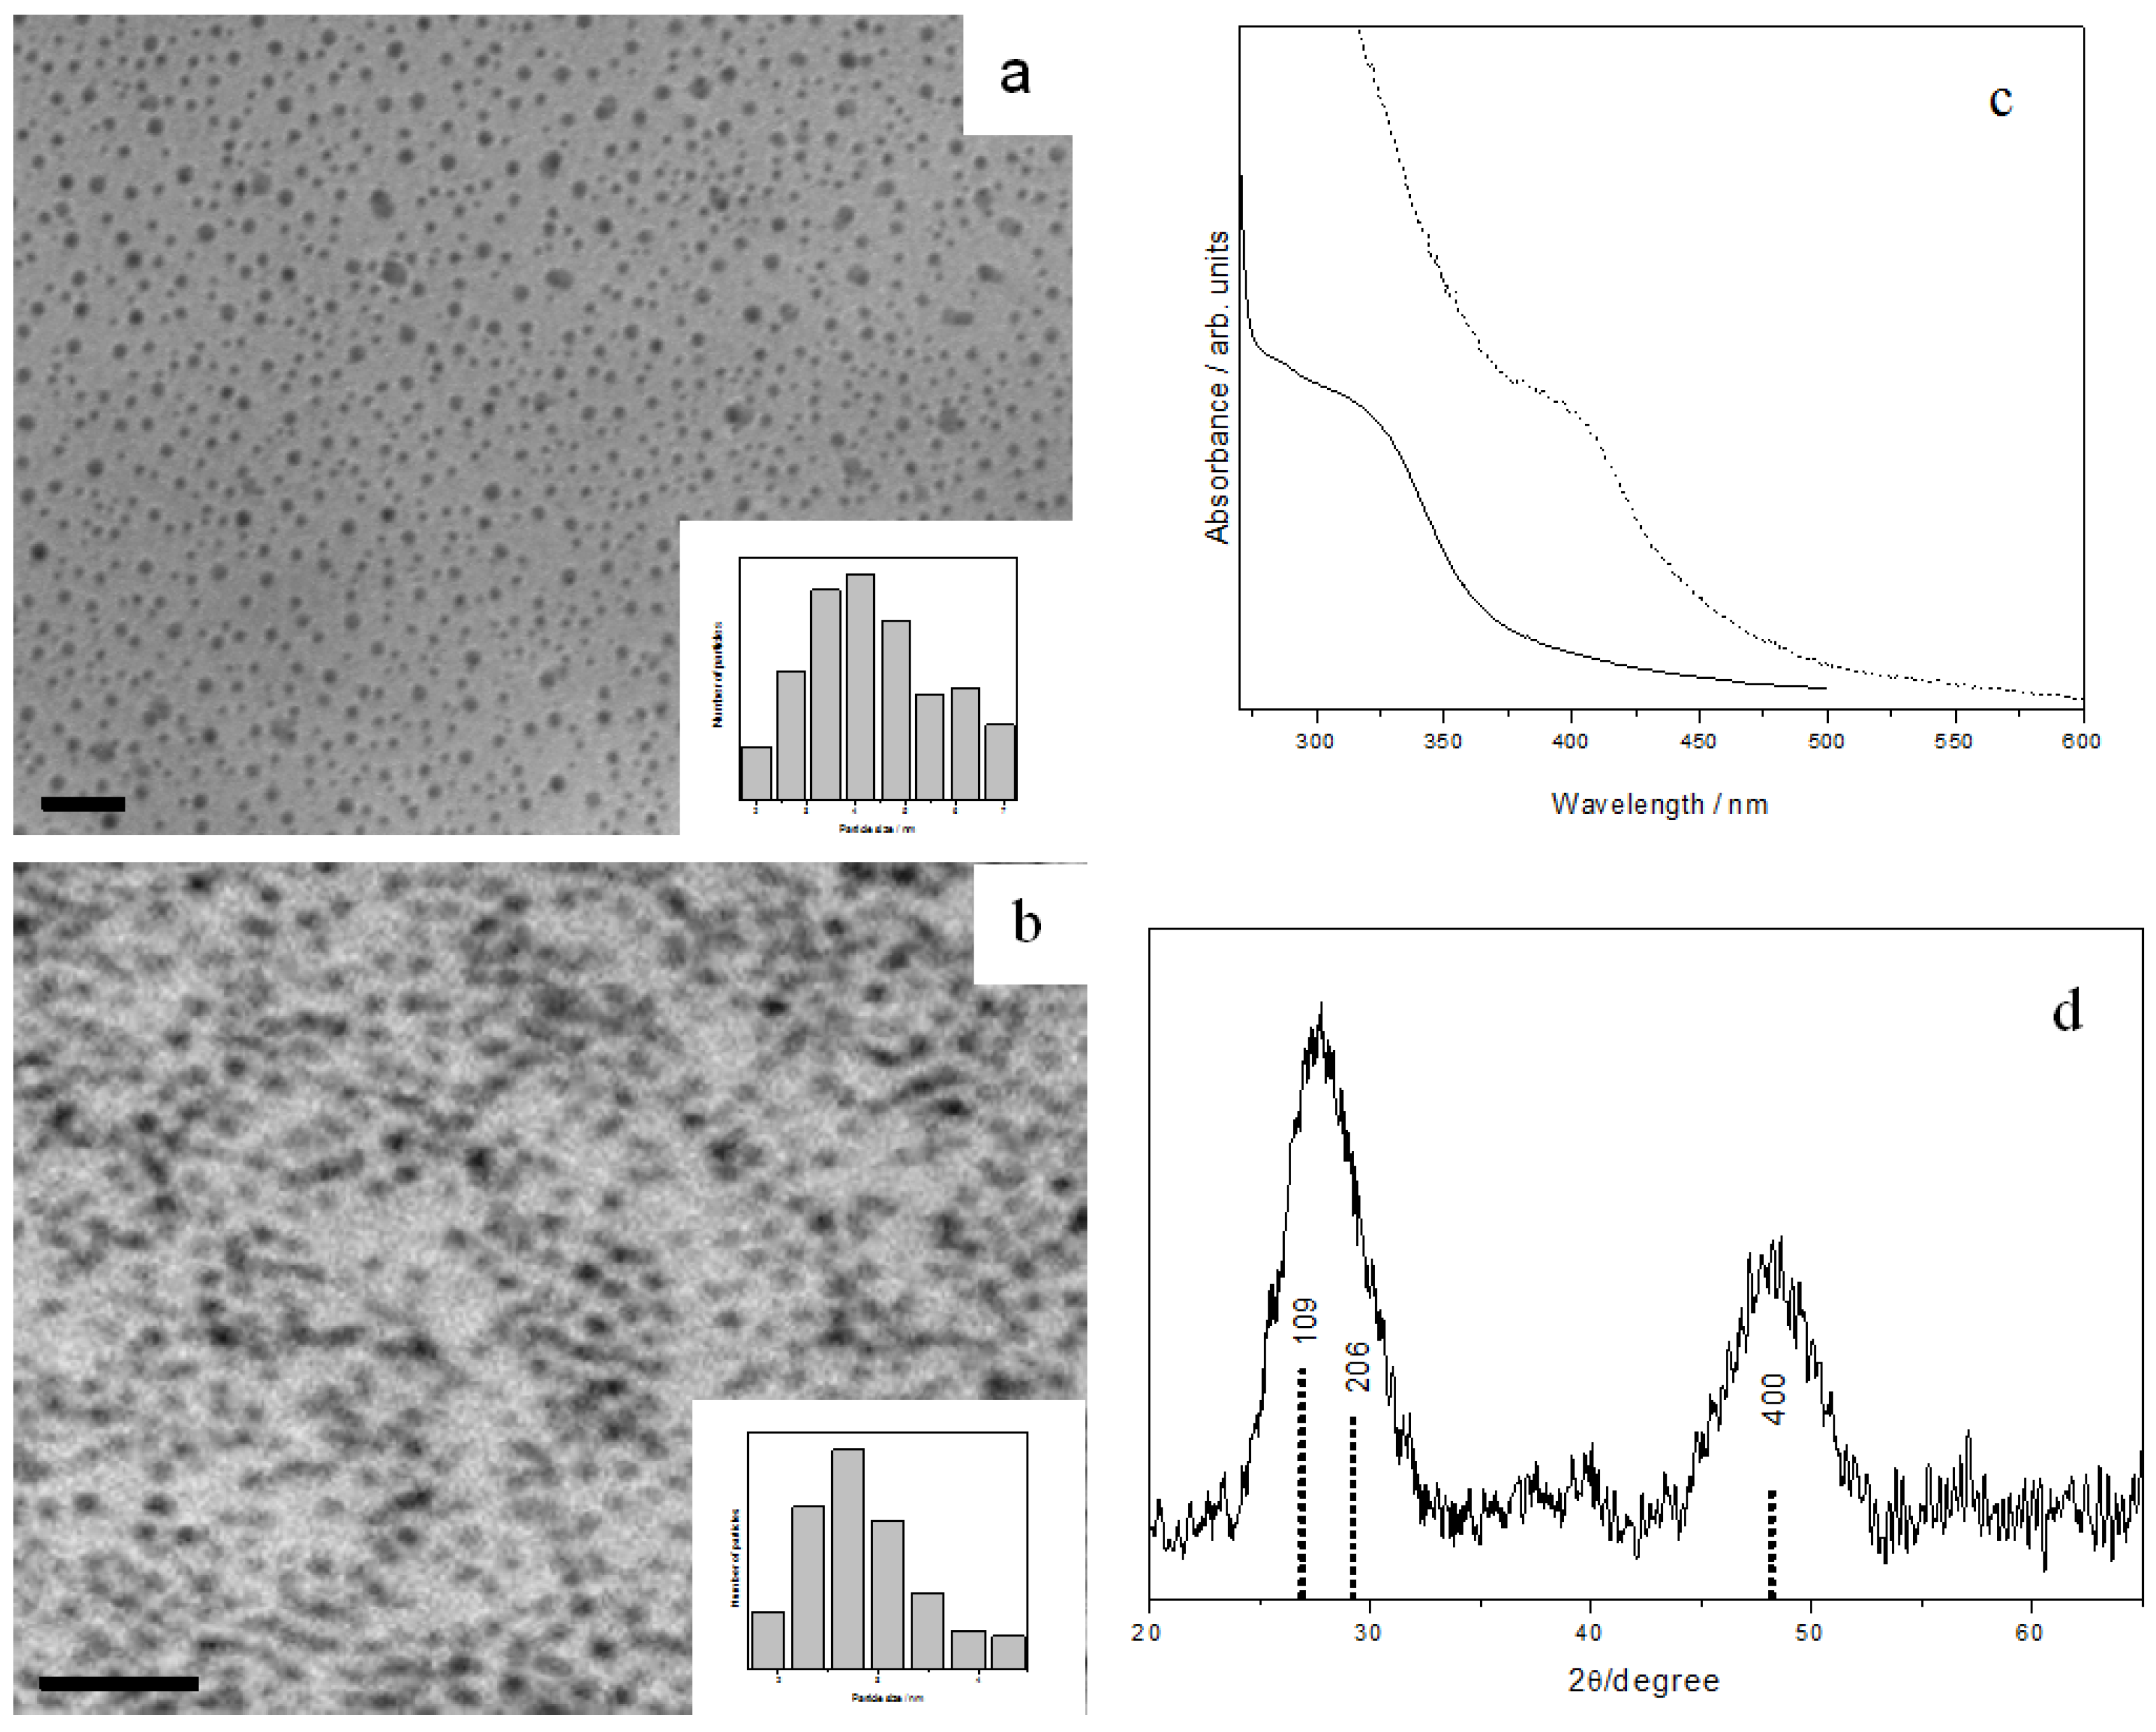
Reacting InTB with OA could produce spherical In
2S
3 with an average diameter of 3.7 ± 0.6 nm (
Figure 5a). However, reaction of InTB with OLA or DOA could not proceed at room temperature until the addition of a trace amount of a short chain amine. Thus, upon adding propylamine into OLA, In
2S
3 nanoparticles with average diameter of 2.6 ± 0.4 nm could be isolated (
Figure 5b). The In
2S
3 nanoparticles prepared from OLA and OA show a UV-Vis absorption onset at 355 nm (3.50 eV) and 437 nm (2.84 eV), respectively (
Figure 5c). Compared to the band-gap of bulk In
2S
3 (2.2 eV or 564 nm) [
36], it is clear that the excitonic transition is blue-shifted due to strong quantum confinement in these In
2S
3 nanocrystals.
Figure 5d shows the XRD pattern of the as-prepared In
2S
3 nanoparticles, confirming the tetragonal β-phase of In
2S
3 (JCPDS 32-0456).
Figure 5.
TEM images and size histograms of In2S3 nanoparticles prepared with different amines: (a) OA, and (b) OLA + trace amount of propylamine, all scale bar = 20 nm. (c) UV-Vis absorption spectra of OA-capped (dashed line) and OLA-capped (solid line) In2S3 nanoparticles. (d) XRD pattern of the In2S3 nanoparticles prepared. The standard JCPDS 32-0456 pattern of β-phase In2S3 is shown as dotted lines.
3.2.4. Cadmium Sulfide Nanoparticles
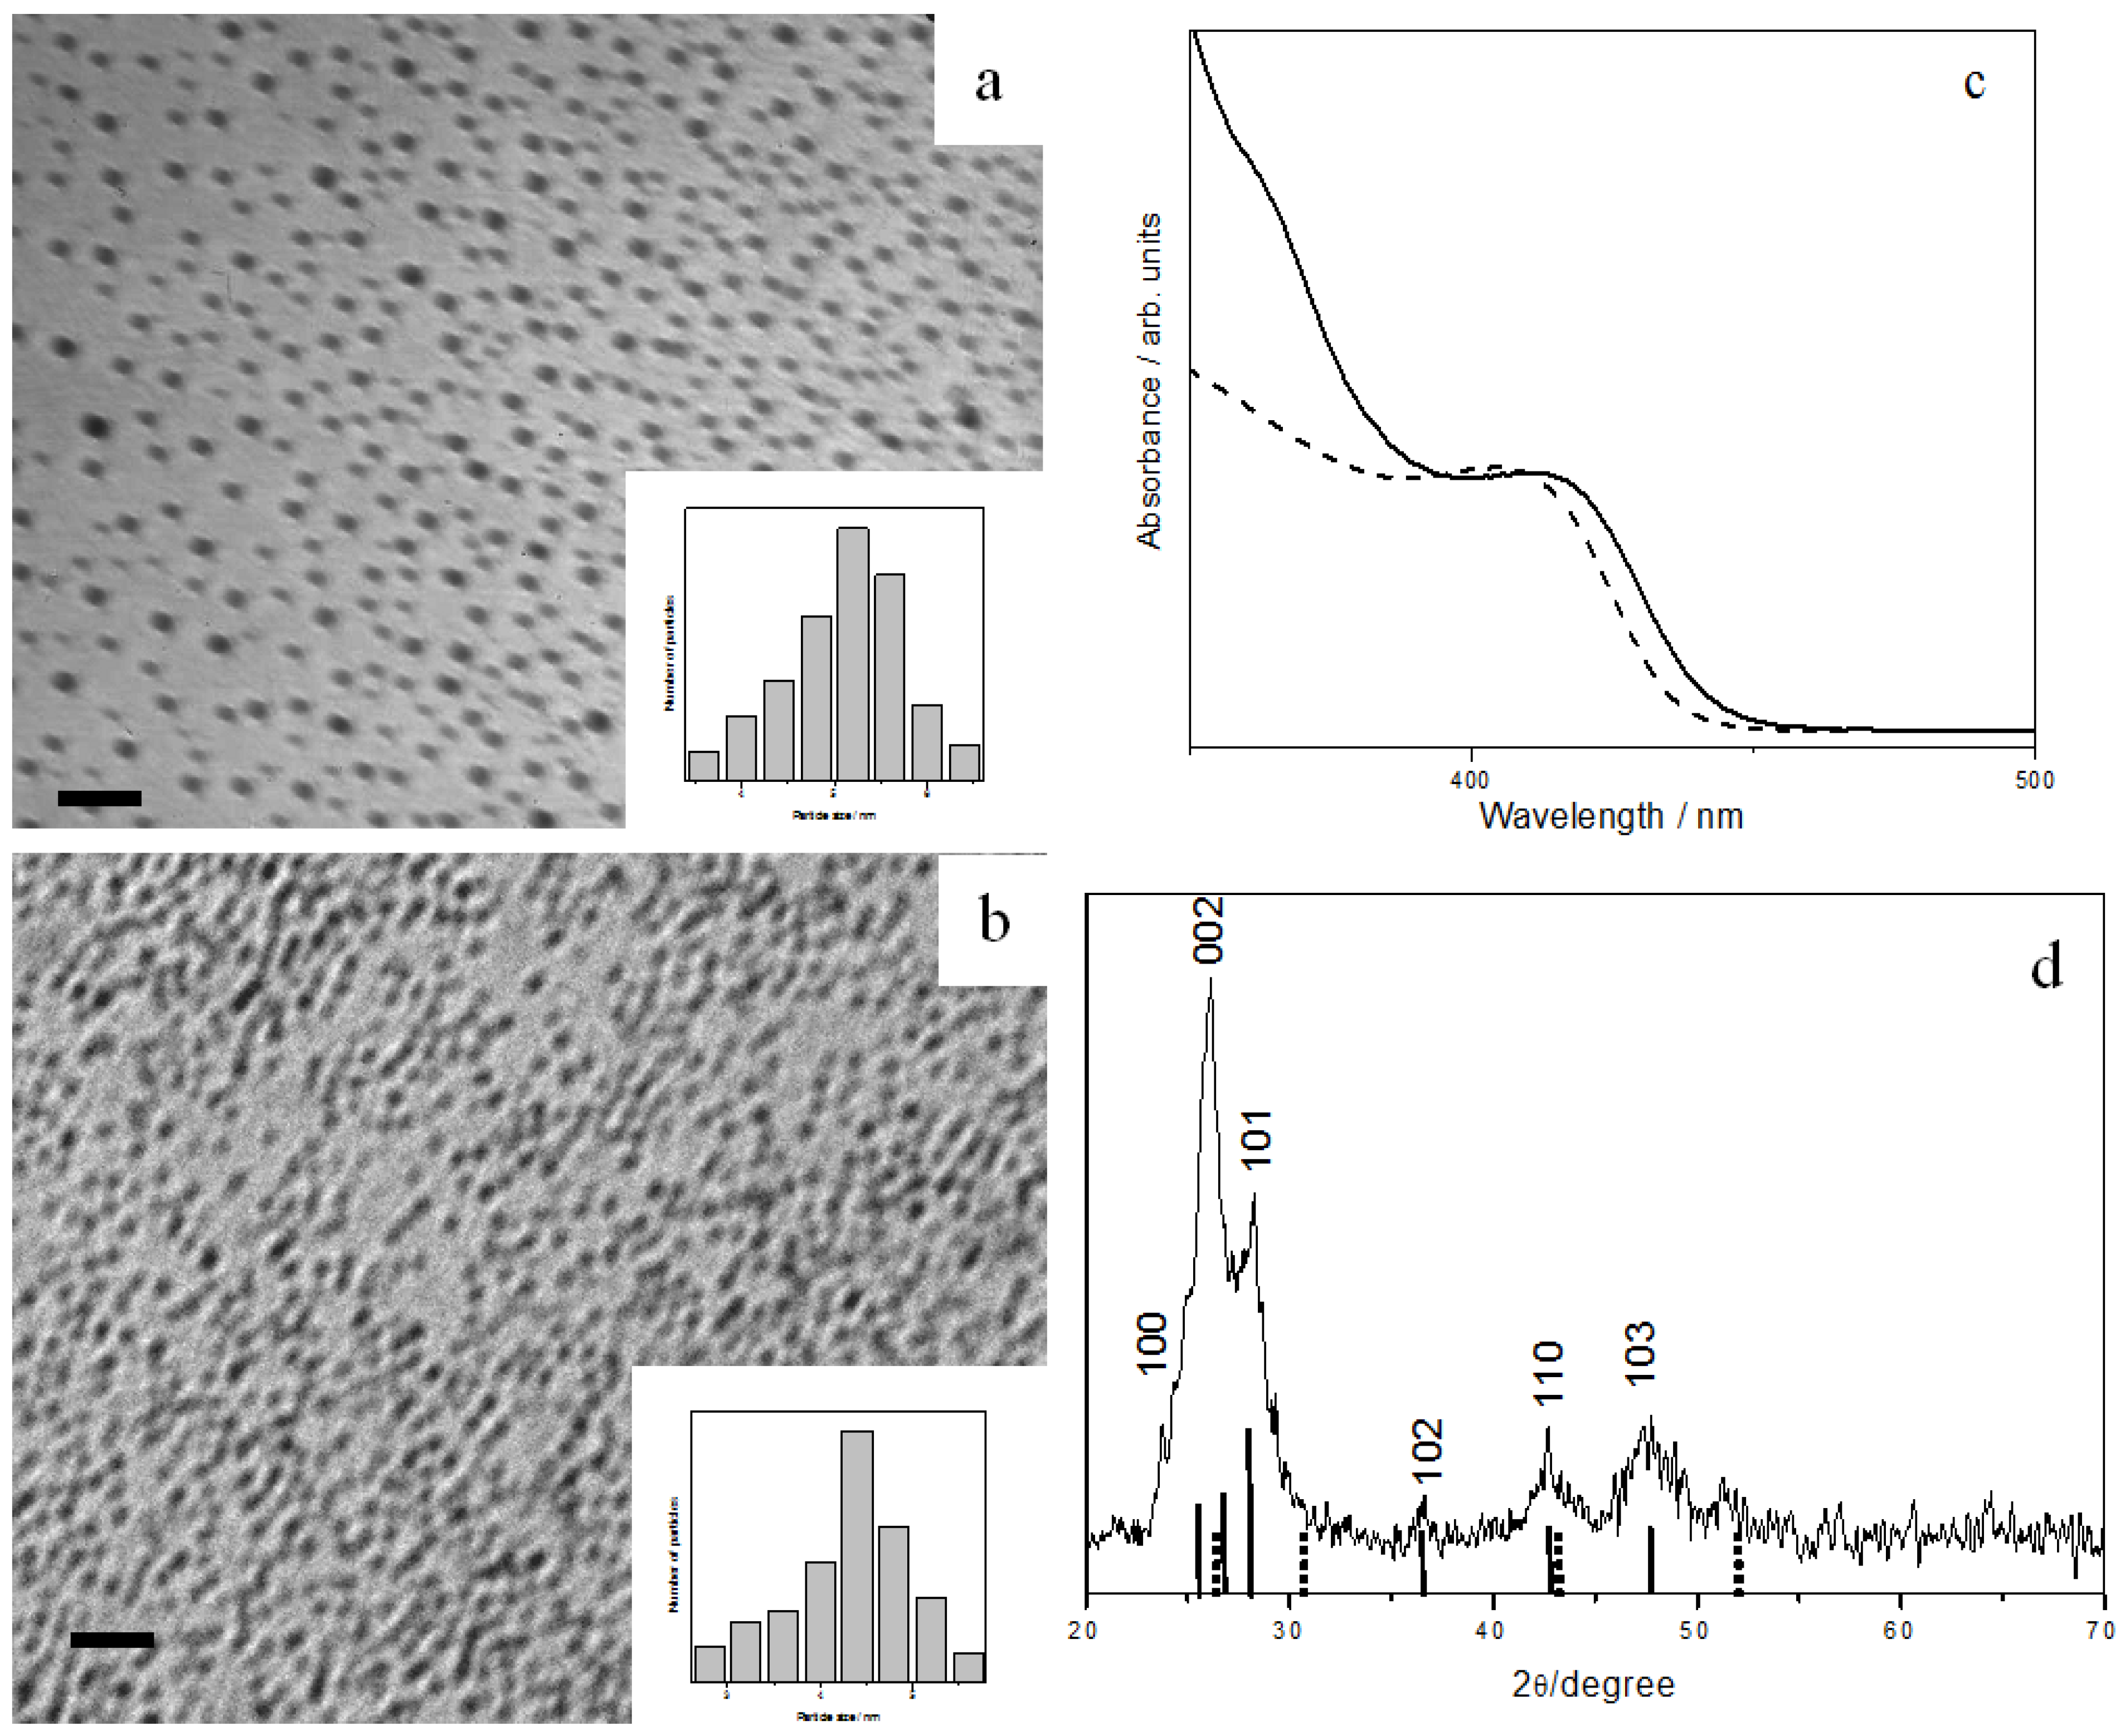
CdS is one of the most studied metal sulfides, due to its various applications. When CdTB precursor was mixed with OA, spherical CdS nanoparticles with an average diameter of 5.3 ± 0.7 nm were produced (
Figure 6a). No reaction had happened, however, in the sole presence of OLA at room temperature. Again, CdS nanoparticles with an average diameter of 4.4 ± 0.3 nm were obtained upon adding a small amount of propylamine into the OLA (
Figure 6b).
Figure 6.
TEM images and size histograms of CdS nanoparticles prepared with different amines: (a) OA, and (b) OLA + a trace amount of propylamine, all scale bar = 20 nm. (c) UV-Vis absorption spectra of OA-capped (solid line) and OLA-capped CdS nanoparticles (dashed line). (d) XRD pattern of OA-capped CdS nanoparticles with wurtzite structures. The standard patterns of CdS phases are shown as sticks below the diffractogram: wurtzite (solid line) and zinc blende (dashed line).
The monodispersity of the prepared CdS nanoparticles is manifested in their absorption spectra, which exhibit a clear distinct band rather than a shoulder or threshold (
Figure 6c). The band-edge absorption is blue-shifted, occurring at 432 nm for OA-capped and 424 nm for OLA-capped nanocrystals. These gave an estimated particle diameter of 4.9 and 4.0 nm respectively from the Brus equation, in good agreement with those obtained from TEM analysis. CdS is known to exist in two structures: Cubic zinc blende phase and hexagonal wurtzite phase. In our sample, XRD analysis (
Figure 6d) suggested a wurtzite crystal structure (JCPDS 41-1049). This observation is interesting, since CdS nanoparticles with zinc blende structure are often produced in ambient conditions, whereas wurtzite structure is often obtained at high temperatures.


